|
||||||||||||||||||||||||||||||||||||||||||||||||||||||||||||||||||||||||||||||||||||||||||||||||||||||||||||||||||||||||||||||||||||||||||||||||||||||||||||||||||||||||||||||||||||||||||||||||||||||||||||||||||||||||||||||||||||||||||||||||||||||||||||||||||||||||||||||||||||||||||||||||||||||||||||||||||||||||||
| |
| Phenotypic Information (metabolism pathway, cancer, disease, phenome) |
| |
| |
| Gene-Gene Network Information: Co-Expression Network, Interacting Genes & KEGG |
| |
|


| Gene Summary for AGRN |
| Basic gene info. | Gene symbol | AGRN |
| Gene name | agrin | |
| Synonyms | CMSPPD | |
| Cytomap | UCSC genome browser: 1p36.33 | |
| Genomic location | chr1 :955502-991499 | |
| Type of gene | protein-coding | |
| RefGenes | NM_198576.3, | |
| Ensembl id | ENSG00000188157 | |
| Description | agrin proteoglycan | |
| Modification date | 20141219 | |
| dbXrefs | MIM : 103320 | |
| HGNC : HGNC | ||
| Ensembl : ENSG00000188157 | ||
| HPRD : 10550 | ||
| Vega : OTTHUMG00000040778 | ||
| Protein | UniProt: go to UniProt's Cross Reference DB Table | |
| Expression | CleanEX: HS_AGRN | |
| BioGPS: 375790 | ||
| Gene Expression Atlas: ENSG00000188157 | ||
| The Human Protein Atlas: ENSG00000188157 | ||
| Pathway | NCI Pathway Interaction Database: AGRN | |
| KEGG: AGRN | ||
| REACTOME: AGRN | ||
| ConsensusPathDB | ||
| Pathway Commons: AGRN | ||
| Metabolism | MetaCyc: AGRN | |
| HUMANCyc: AGRN | ||
| Regulation | Ensembl's Regulation: ENSG00000188157 | |
| miRBase: chr1 :955,502-991,499 | ||
| TargetScan: NM_198576 | ||
| cisRED: ENSG00000188157 | ||
| Context | iHOP: AGRN | |
| cancer metabolism search in PubMed: AGRN | ||
| UCL Cancer Institute: AGRN | ||
| Assigned class in ccmGDB | C | |
| Top |
| Phenotypic Information for AGRN(metabolism pathway, cancer, disease, phenome) |
| Cancer | CGAP: AGRN |
| Familial Cancer Database: AGRN | |
| * This gene is included in those cancer gene databases. |
|
|
|
|
|
| . | ||||||||||||||||||||||||||||||||||||||||||||||||||||||||||||||||||||||||||||||||||||||||||||||||||||||||||||||||||||||||||||||||||||||||||||||||||||||||||||||||||||||||||||||||||||||||||||||||||||||||||||||||||||||||||||||||||||||||||||||||||||||||||||||||||||||||||||||||||||||||||||||||||||||||||||||||||||
Oncogene 1 | Significant driver gene in | |||||||||||||||||||||||||||||||||||||||||||||||||||||||||||||||||||||||||||||||||||||||||||||||||||||||||||||||||||||||||||||||||||||||||||||||||||||||||||||||||||||||||||||||||||||||||||||||||||||||||||||||||||||||||||||||||||||||||||||||||||||||||||||||||||||||||||||||||||||||||||||||||||||||||||||||||||||||||
| cf) number; DB name 1 Oncogene; http://nar.oxfordjournals.org/content/35/suppl_1/D721.long, 2 Tumor Suppressor gene; https://bioinfo.uth.edu/TSGene/, 3 Cancer Gene Census; http://www.nature.com/nrc/journal/v4/n3/abs/nrc1299.html, 4 CancerGenes; http://nar.oxfordjournals.org/content/35/suppl_1/D721.long, 5 Network of Cancer Gene; http://ncg.kcl.ac.uk/index.php, 1Therapeutic Vulnerabilities in Cancer; http://cbio.mskcc.org/cancergenomics/statius/ |
| REACTOME_METABOLISM_OF_CARBOHYDRATES | |
| OMIM | |
| Orphanet | |
| Disease | KEGG Disease: AGRN |
| MedGen: AGRN (Human Medical Genetics with Condition) | |
| ClinVar: AGRN | |
| Phenotype | MGI: AGRN (International Mouse Phenotyping Consortium) |
| PhenomicDB: AGRN | |
| Mutations for AGRN |
| * Under tables are showing count per each tissue to give us broad intuition about tissue specific mutation patterns.You can go to the detailed page for each mutation database's web site. |
| There's no structural variation information in COSMIC data for this gene. |
| * From mRNA Sanger sequences, Chitars2.0 arranged chimeric transcripts. This table shows AGRN related fusion information. |
| ID | Head Gene | Tail Gene | Accession | Gene_a | qStart_a | qEnd_a | Chromosome_a | tStart_a | tEnd_a | Gene_a | qStart_a | qEnd_a | Chromosome_a | tStart_a | tEnd_a |
| BF763267 | AGRN | 75 | 94 | 1 | 978392 | 978411 | TIMM50 | 86 | 297 | 19 | 39978835 | 39980445 | |
| BG423236 | AGRN | 2 | 68 | 1 | 991423 | 991489 | RPL13 | 61 | 291 | 16 | 89628763 | 89629485 | |
| CK000816 | AGRN | 8 | 252 | 1 | 986863 | 987189 | AGRN | 252 | 479 | 1 | 983716 | 984441 | |
| Top |
| Mutation type/ Tissue ID | brca | cns | cerv | endome | haematopo | kidn | Lintest | liver | lung | ns | ovary | pancre | prost | skin | stoma | thyro | urina | |||
| Total # sample | 1 | 1 | ||||||||||||||||||
| GAIN (# sample) | 1 | 1 | ||||||||||||||||||
| LOSS (# sample) |
| cf) Tissue ID; Tissue type (1; Breast, 2; Central_nervous_system, 3; Cervix, 4; Endometrium, 5; Haematopoietic_and_lymphoid_tissue, 6; Kidney, 7; Large_intestine, 8; Liver, 9; Lung, 10; NS, 11; Ovary, 12; Pancreas, 13; Prostate, 14; Skin, 15; Stomach, 16; Thyroid, 17; Urinary_tract) |
| Top |
|
 |
| Top |
| Stat. for Non-Synonymous SNVs (# total SNVs=87) | (# total SNVs=34) |
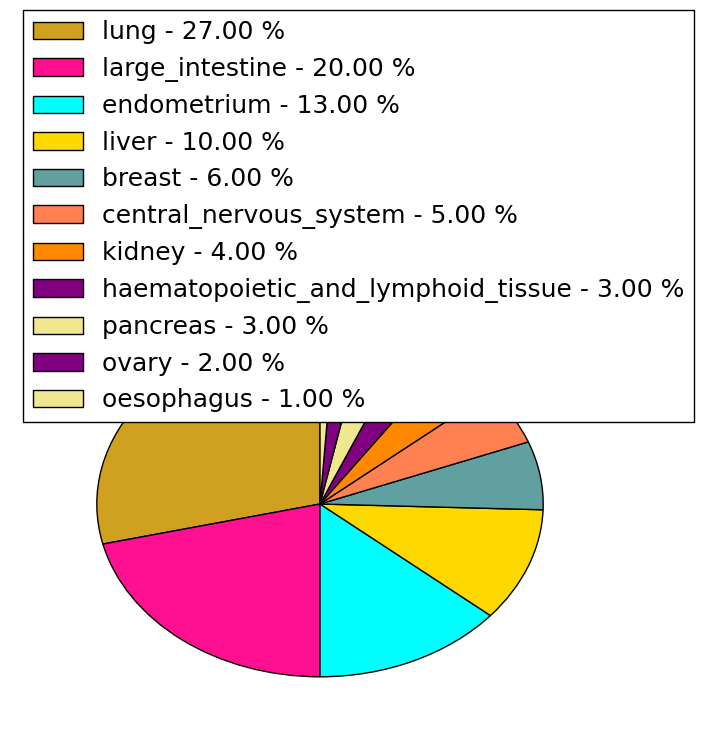 | 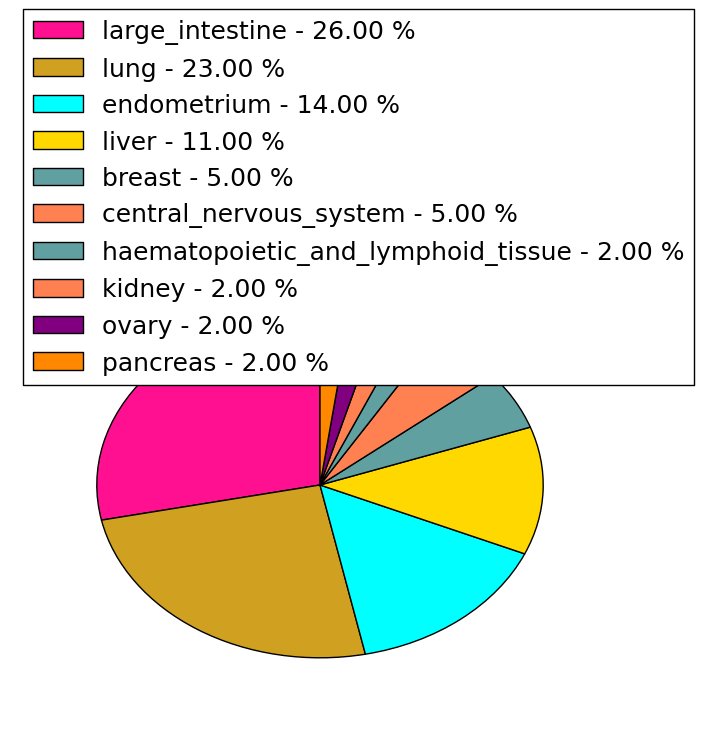 |
(# total SNVs=2) | (# total SNVs=6) |
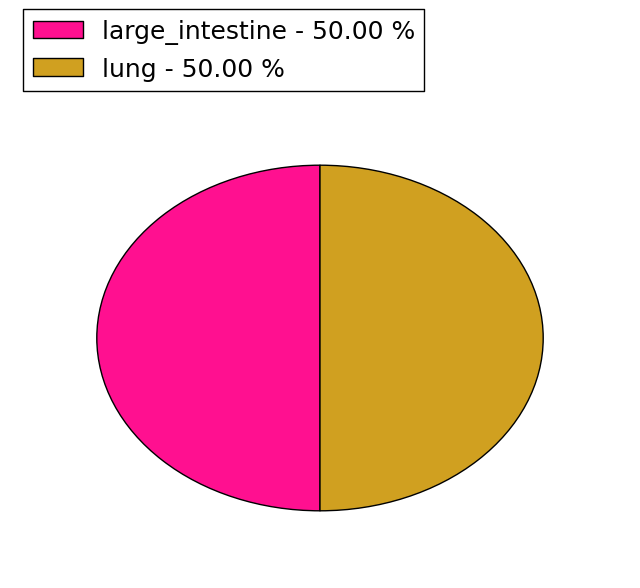 | 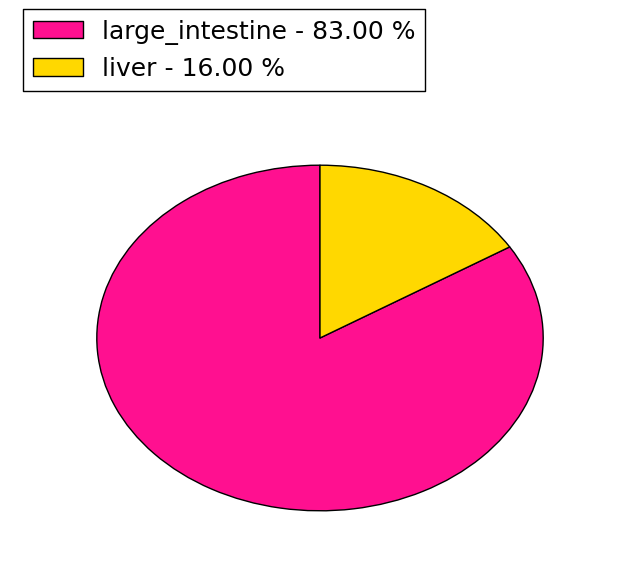 |
| Top |
| * When you move the cursor on each content, you can see more deailed mutation information on the Tooltip. Those are primary_site,primary_histology,mutation(aa),pubmedID. |
| GRCh37 position | Mutation(aa) | Unique sampleID count |
| chr1:981860-981861 | p.G1002fs*58 | 5 |
| chr1:981931-981931 | p.S1022S | 5 |
| chr1:985173-985173 | p.V1581A | 3 |
| chr1:981387-981387 | p.F908F | 3 |
| chr1:987137-987137 | p.D1865H | 2 |
| chr1:978952-978952 | p.C546C | 2 |
| chr1:985102-985102 | p.P1557P | 2 |
| chr1:984698-984698 | p.R1461W | 2 |
| chr1:990267-990267 | p.G2015D | 2 |
| chr1:957654-957654 | p.V92G | 2 |
| Top |
|
 |
| Point Mutation/ Tissue ID | 1 | 2 | 3 | 4 | 5 | 6 | 7 | 8 | 9 | 10 | 11 | 12 | 13 | 14 | 15 | 16 | 17 | 18 | 19 | 20 |
| # sample | 5 | 3 | 1 | 14 | 2 | 5 | 1 | 3 | 13 | 4 | 1 | 1 | 1 | 17 | 14 | 10 | ||||
| # mutation | 5 | 3 | 1 | 14 | 2 | 5 | 1 | 3 | 14 | 6 | 1 | 1 | 1 | 18 | 15 | 17 | ||||
| nonsynonymous SNV | 3 | 1 | 1 | 9 | 1 | 1 | 1 | 3 | 7 | 4 | 10 | 8 | 12 | |||||||
| synonymous SNV | 2 | 2 | 5 | 1 | 4 | 7 | 2 | 1 | 1 | 1 | 8 | 7 | 5 |
| cf) Tissue ID; Tissue type (1; BLCA[Bladder Urothelial Carcinoma], 2; BRCA[Breast invasive carcinoma], 3; CESC[Cervical squamous cell carcinoma and endocervical adenocarcinoma], 4; COAD[Colon adenocarcinoma], 5; GBM[Glioblastoma multiforme], 6; Glioma Low Grade, 7; HNSC[Head and Neck squamous cell carcinoma], 8; KICH[Kidney Chromophobe], 9; KIRC[Kidney renal clear cell carcinoma], 10; KIRP[Kidney renal papillary cell carcinoma], 11; LAML[Acute Myeloid Leukemia], 12; LUAD[Lung adenocarcinoma], 13; LUSC[Lung squamous cell carcinoma], 14; OV[Ovarian serous cystadenocarcinoma ], 15; PAAD[Pancreatic adenocarcinoma], 16; PRAD[Prostate adenocarcinoma], 17; SKCM[Skin Cutaneous Melanoma], 18:STAD[Stomach adenocarcinoma], 19:THCA[Thyroid carcinoma], 20:UCEC[Uterine Corpus Endometrial Carcinoma]) |
| Top |
| * We represented just top 10 SNVs. When you move the cursor on each content, you can see more deailed mutation information on the Tooltip. Those are primary_site, primary_histology, mutation(aa), pubmedID. |
| Genomic Position | Mutation(aa) | Unique sampleID count |
| chr1:981387 | p.F908F | 3 |
| chr1:979730 | p.G722E | 2 |
| chr1:986164 | p.T1151T | 2 |
| chr1:982771 | p.S1199S | 2 |
| chr1:983033 | p.R1734C | 2 |
| chr1:979559 | p.A1972V | 1 |
| chr1:982024 | p.T550T | 1 |
| chr1:989295 | p.G714S | 1 |
| chr1:957623 | p.L886L | 1 |
| chr1:977059 | p.R1102K | 1 |
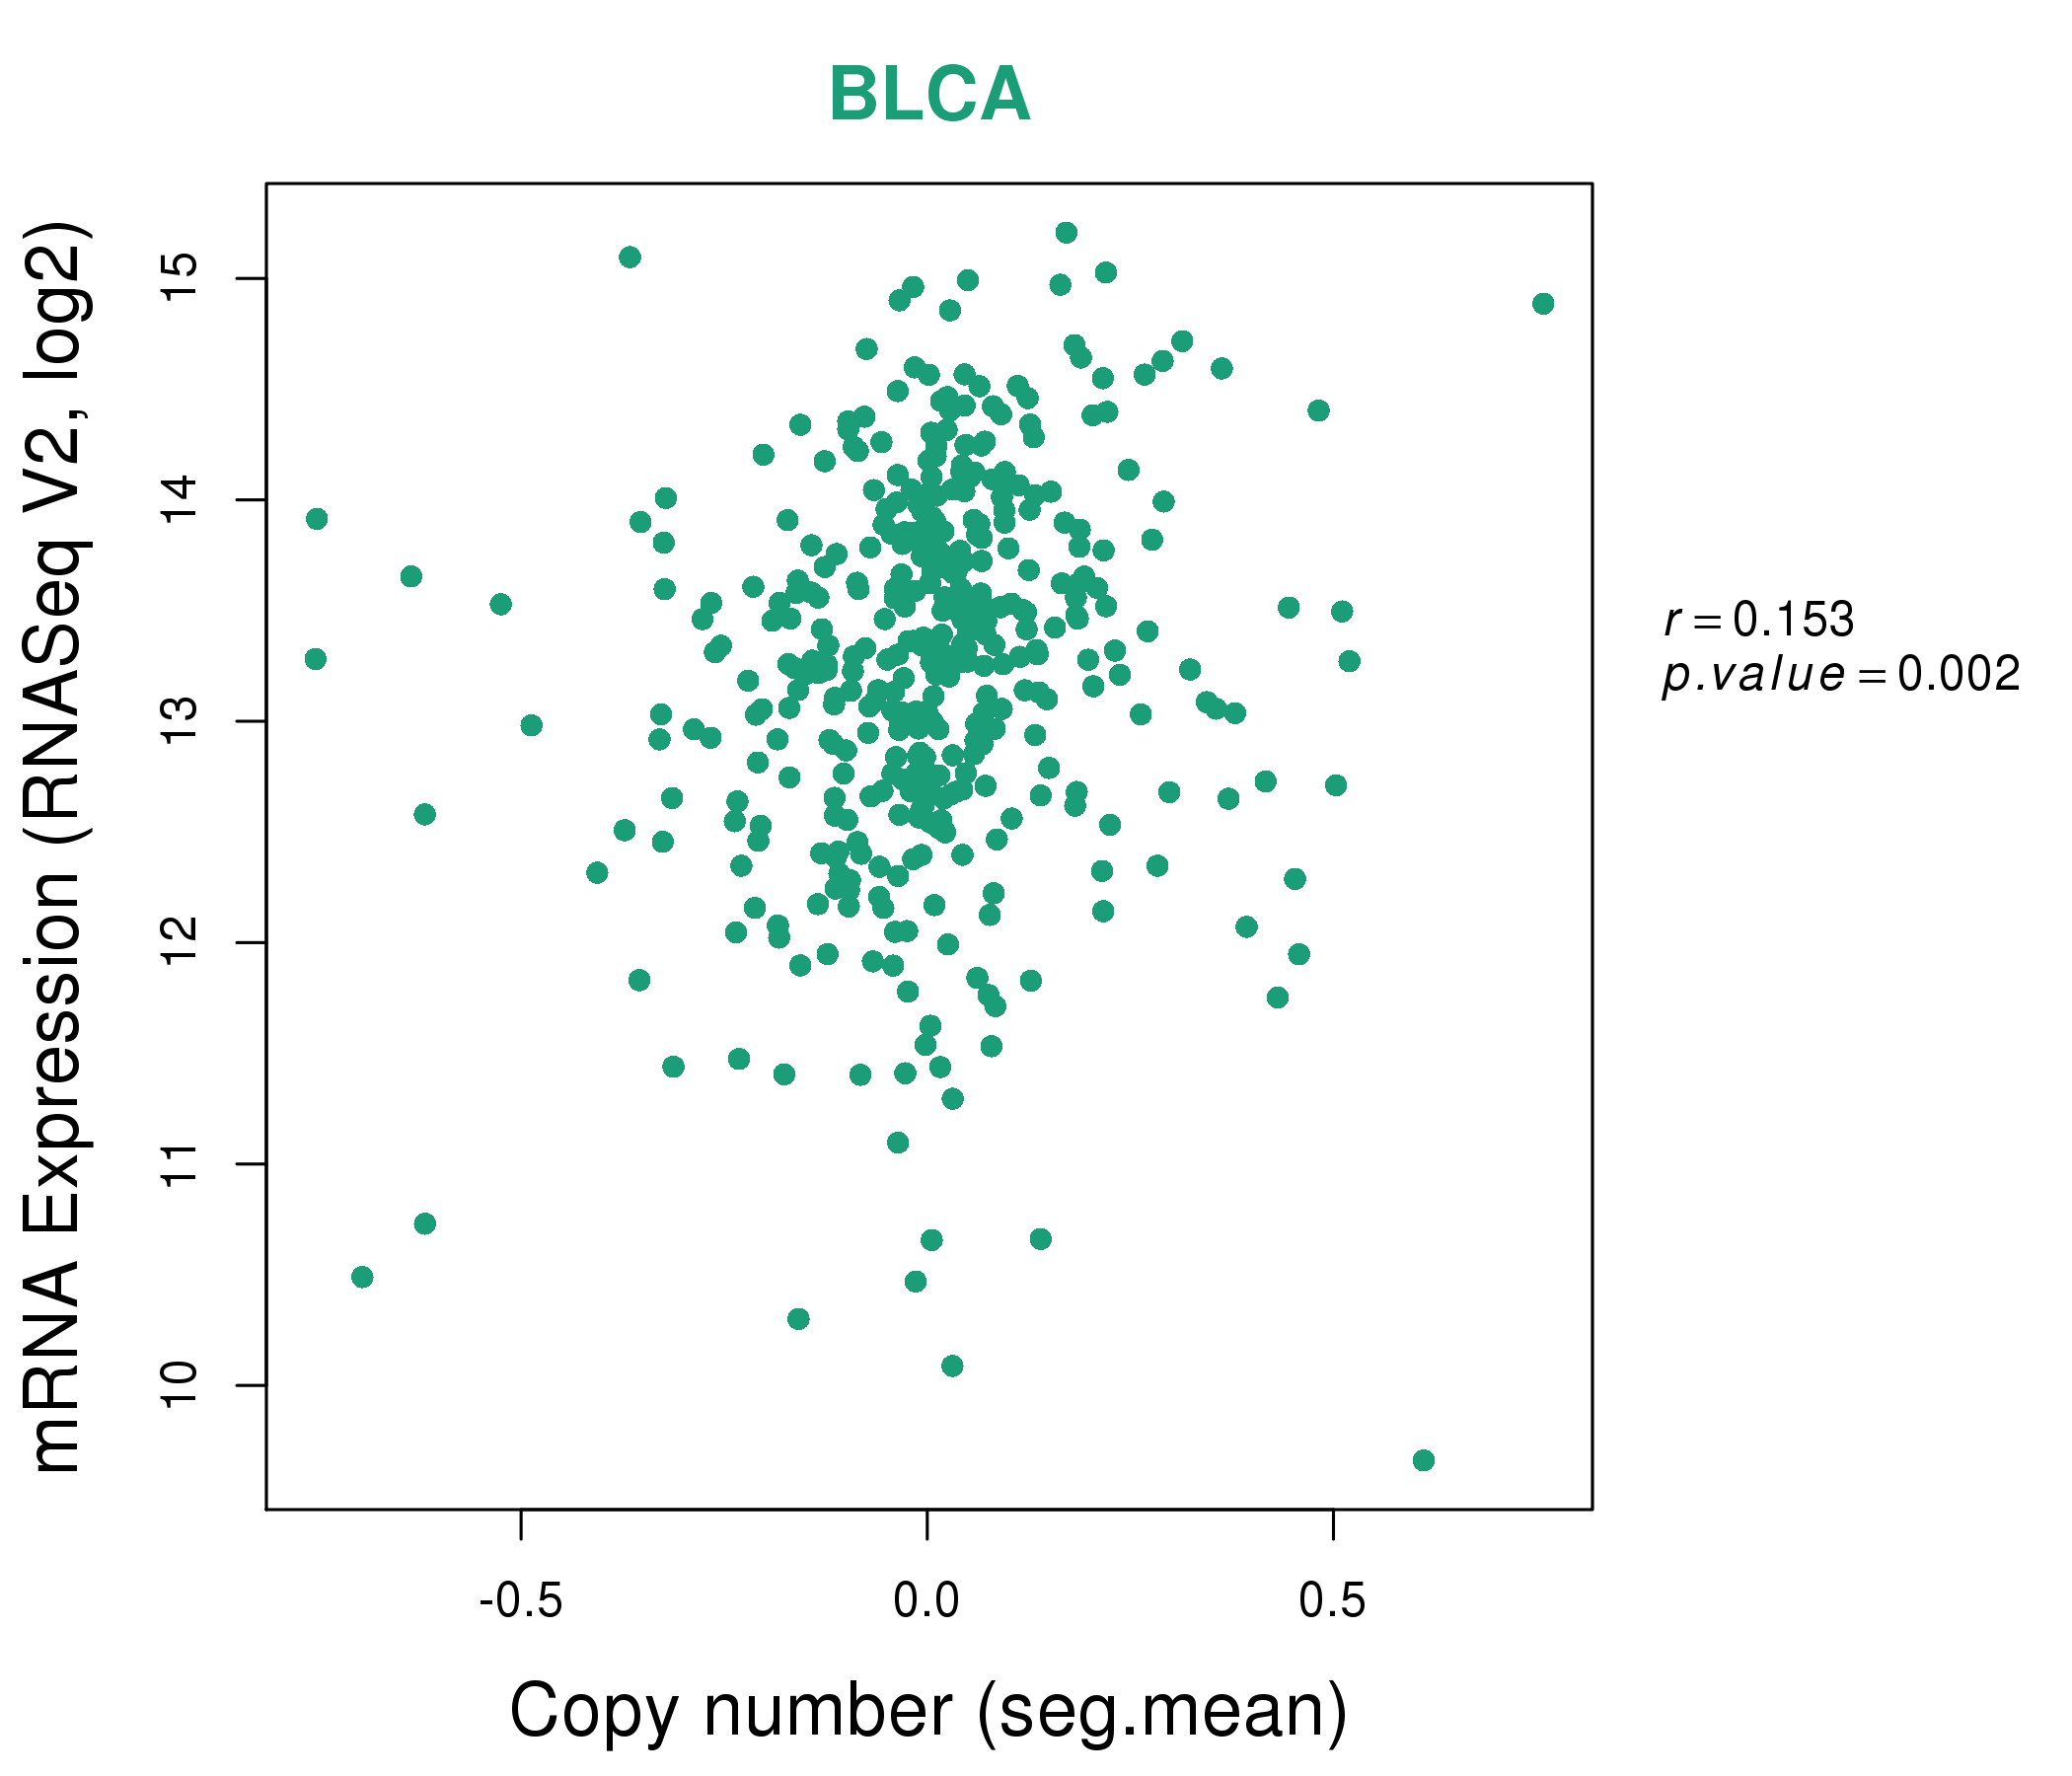
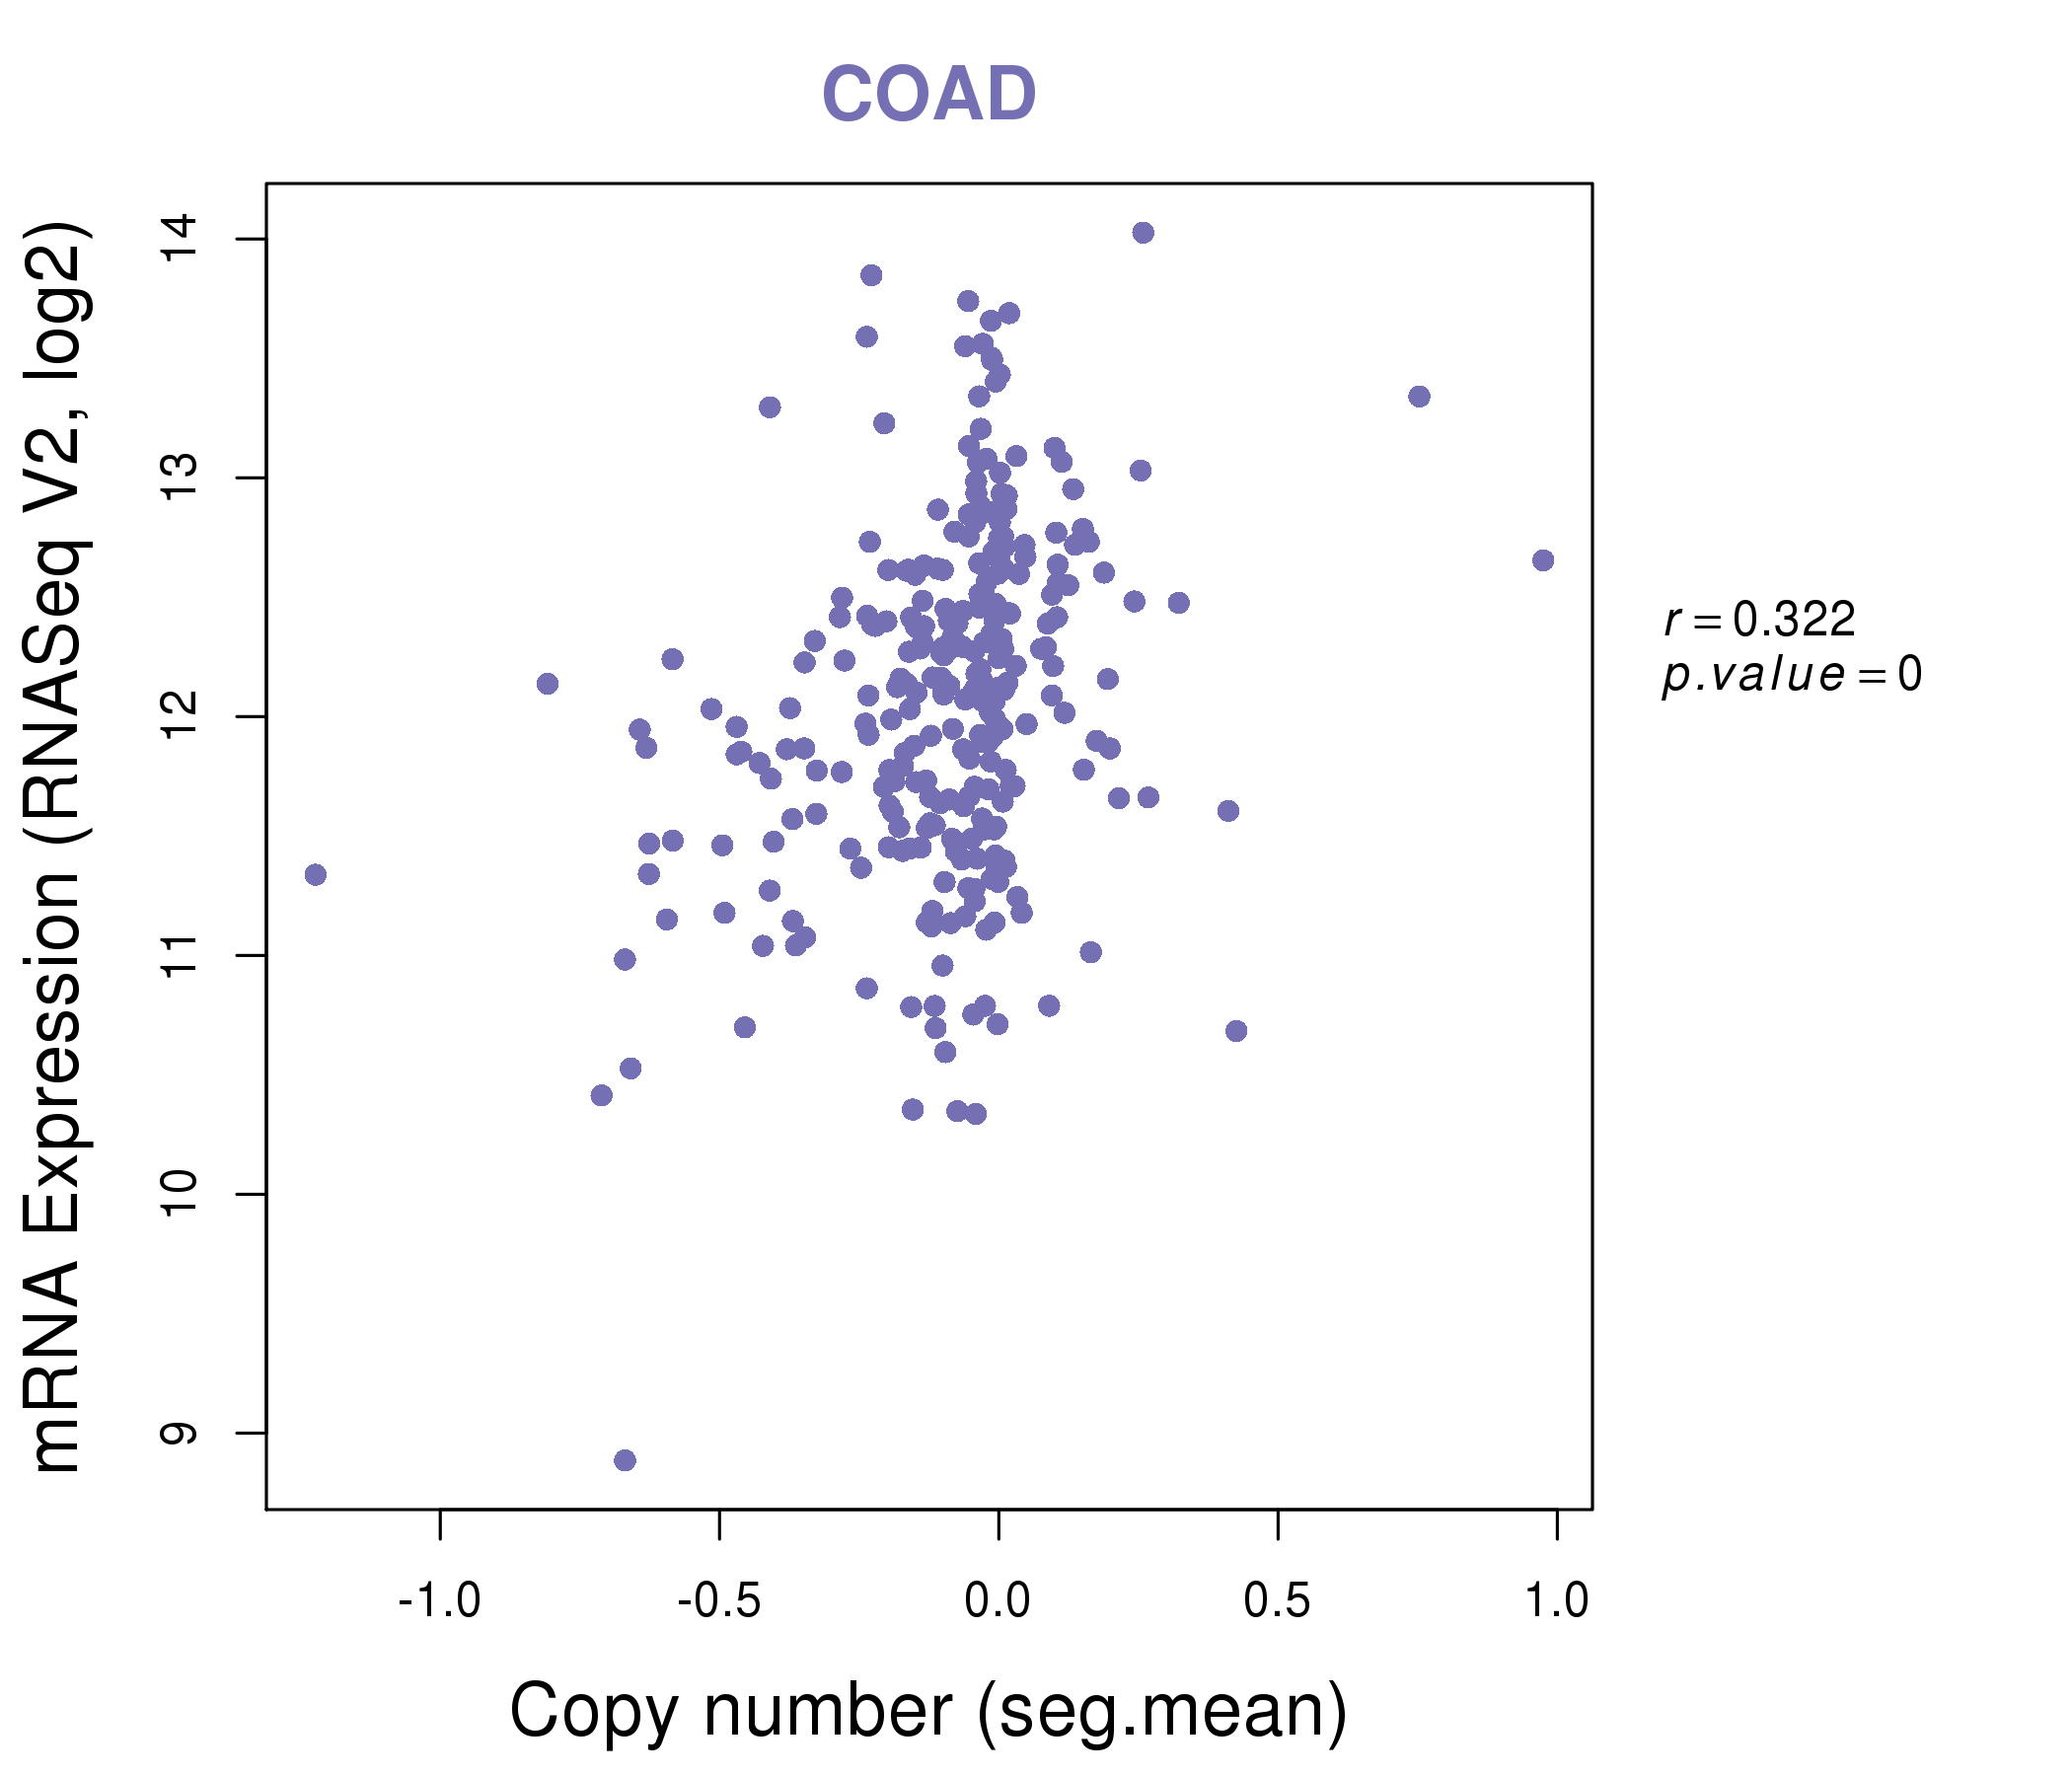
| * Copy number data were extracted from TCGA using R package TCGA-Assembler. The URLs of all public data files on TCGA DCC data server were gathered on Jan-05-2015. Function ProcessCNAData in TCGA-Assembler package was used to obtain gene-level copy number value which is calculated as the average copy number of the genomic region of a gene. |
 |
| cf) Tissue ID[Tissue type]: BLCA[Bladder Urothelial Carcinoma], BRCA[Breast invasive carcinoma], CESC[Cervical squamous cell carcinoma and endocervical adenocarcinoma], COAD[Colon adenocarcinoma], GBM[Glioblastoma multiforme], Glioma Low Grade, HNSC[Head and Neck squamous cell carcinoma], KICH[Kidney Chromophobe], KIRC[Kidney renal clear cell carcinoma], KIRP[Kidney renal papillary cell carcinoma], LAML[Acute Myeloid Leukemia], LUAD[Lung adenocarcinoma], LUSC[Lung squamous cell carcinoma], OV[Ovarian serous cystadenocarcinoma ], PAAD[Pancreatic adenocarcinoma], PRAD[Prostate adenocarcinoma], SKCM[Skin Cutaneous Melanoma], STAD[Stomach adenocarcinoma], THCA[Thyroid carcinoma], UCEC[Uterine Corpus Endometrial Carcinoma] |
| Top |
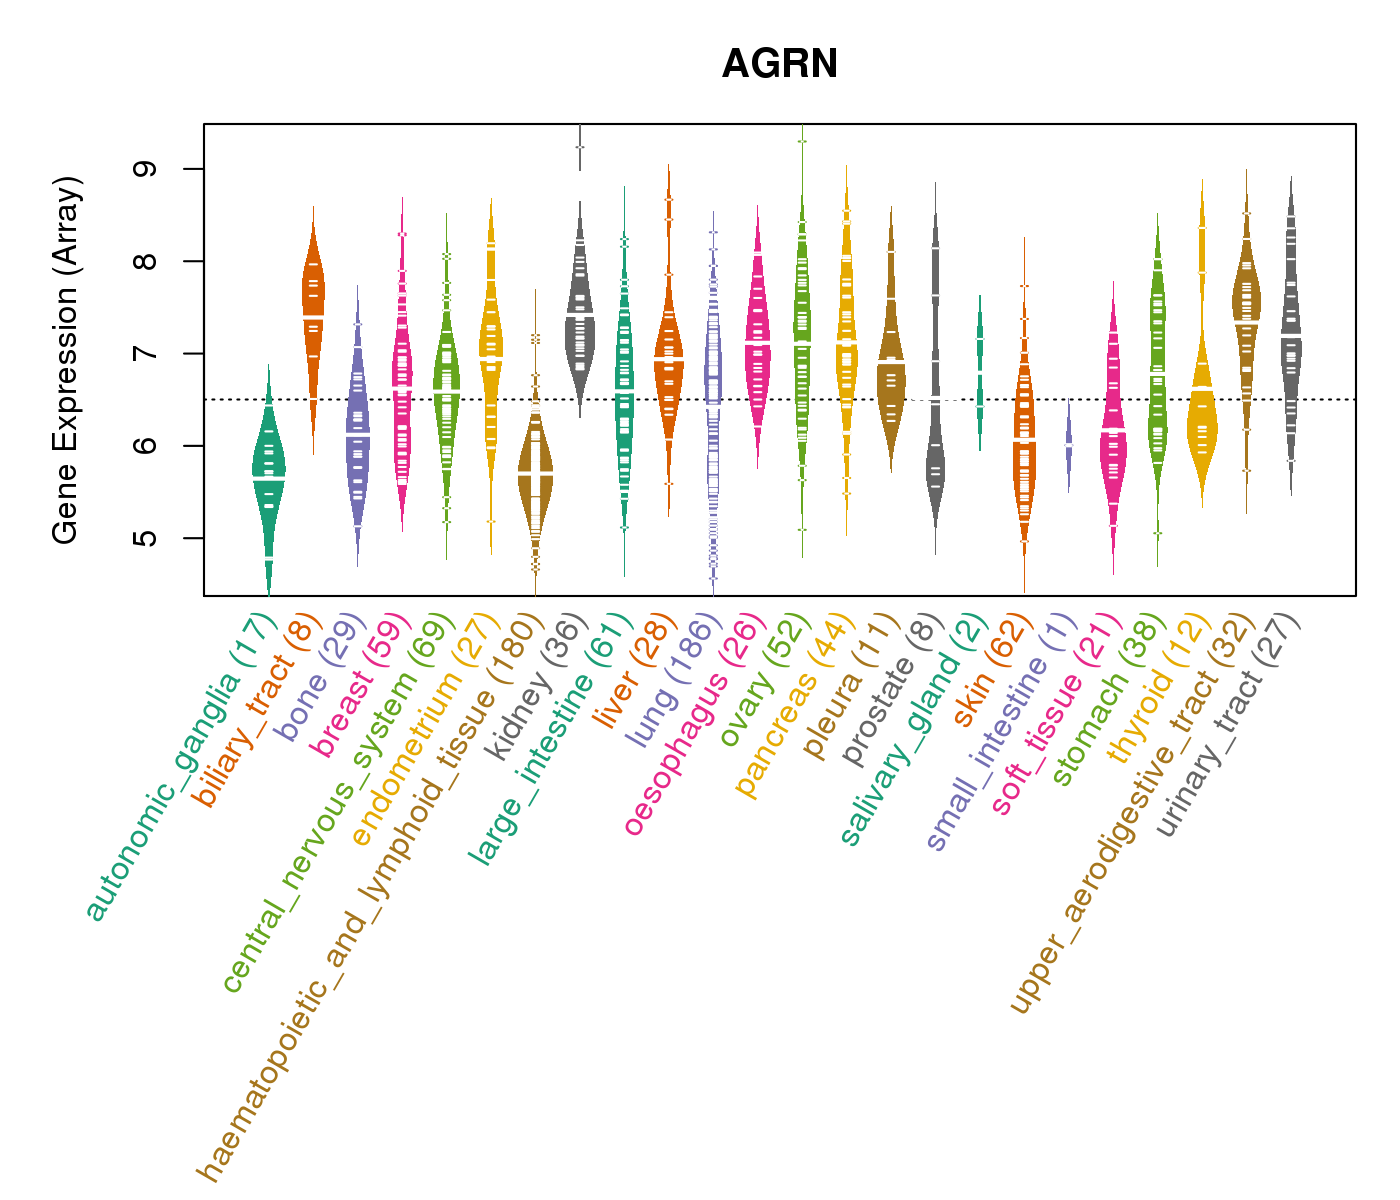
| Gene Expression for AGRN |
| * CCLE gene expression data were extracted from CCLE_Expression_Entrez_2012-10-18.res: Gene-centric RMA-normalized mRNA expression data. |
 |
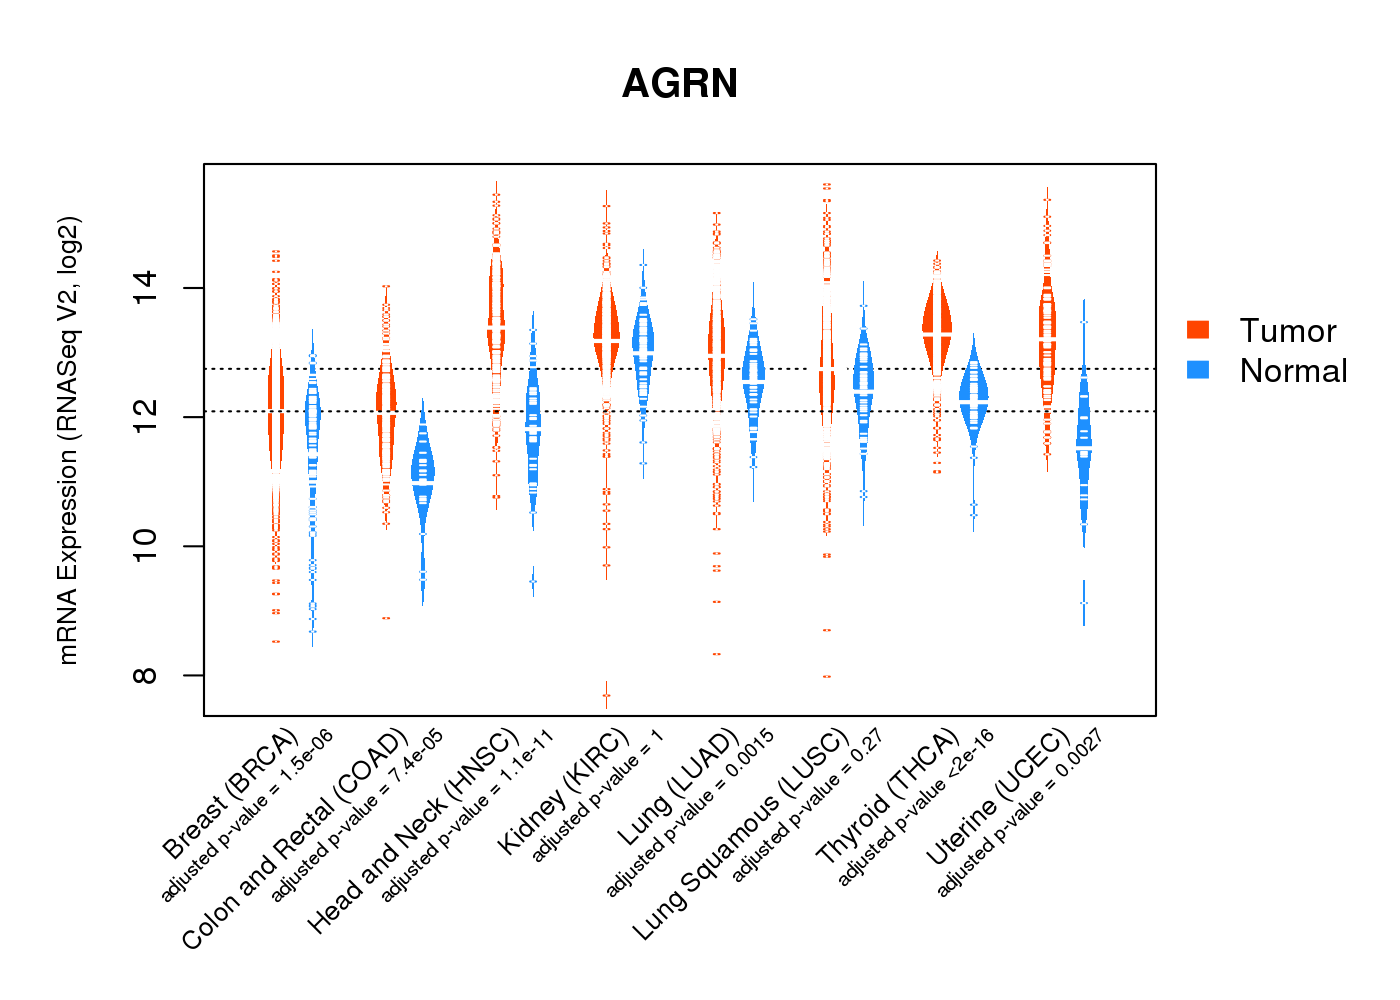
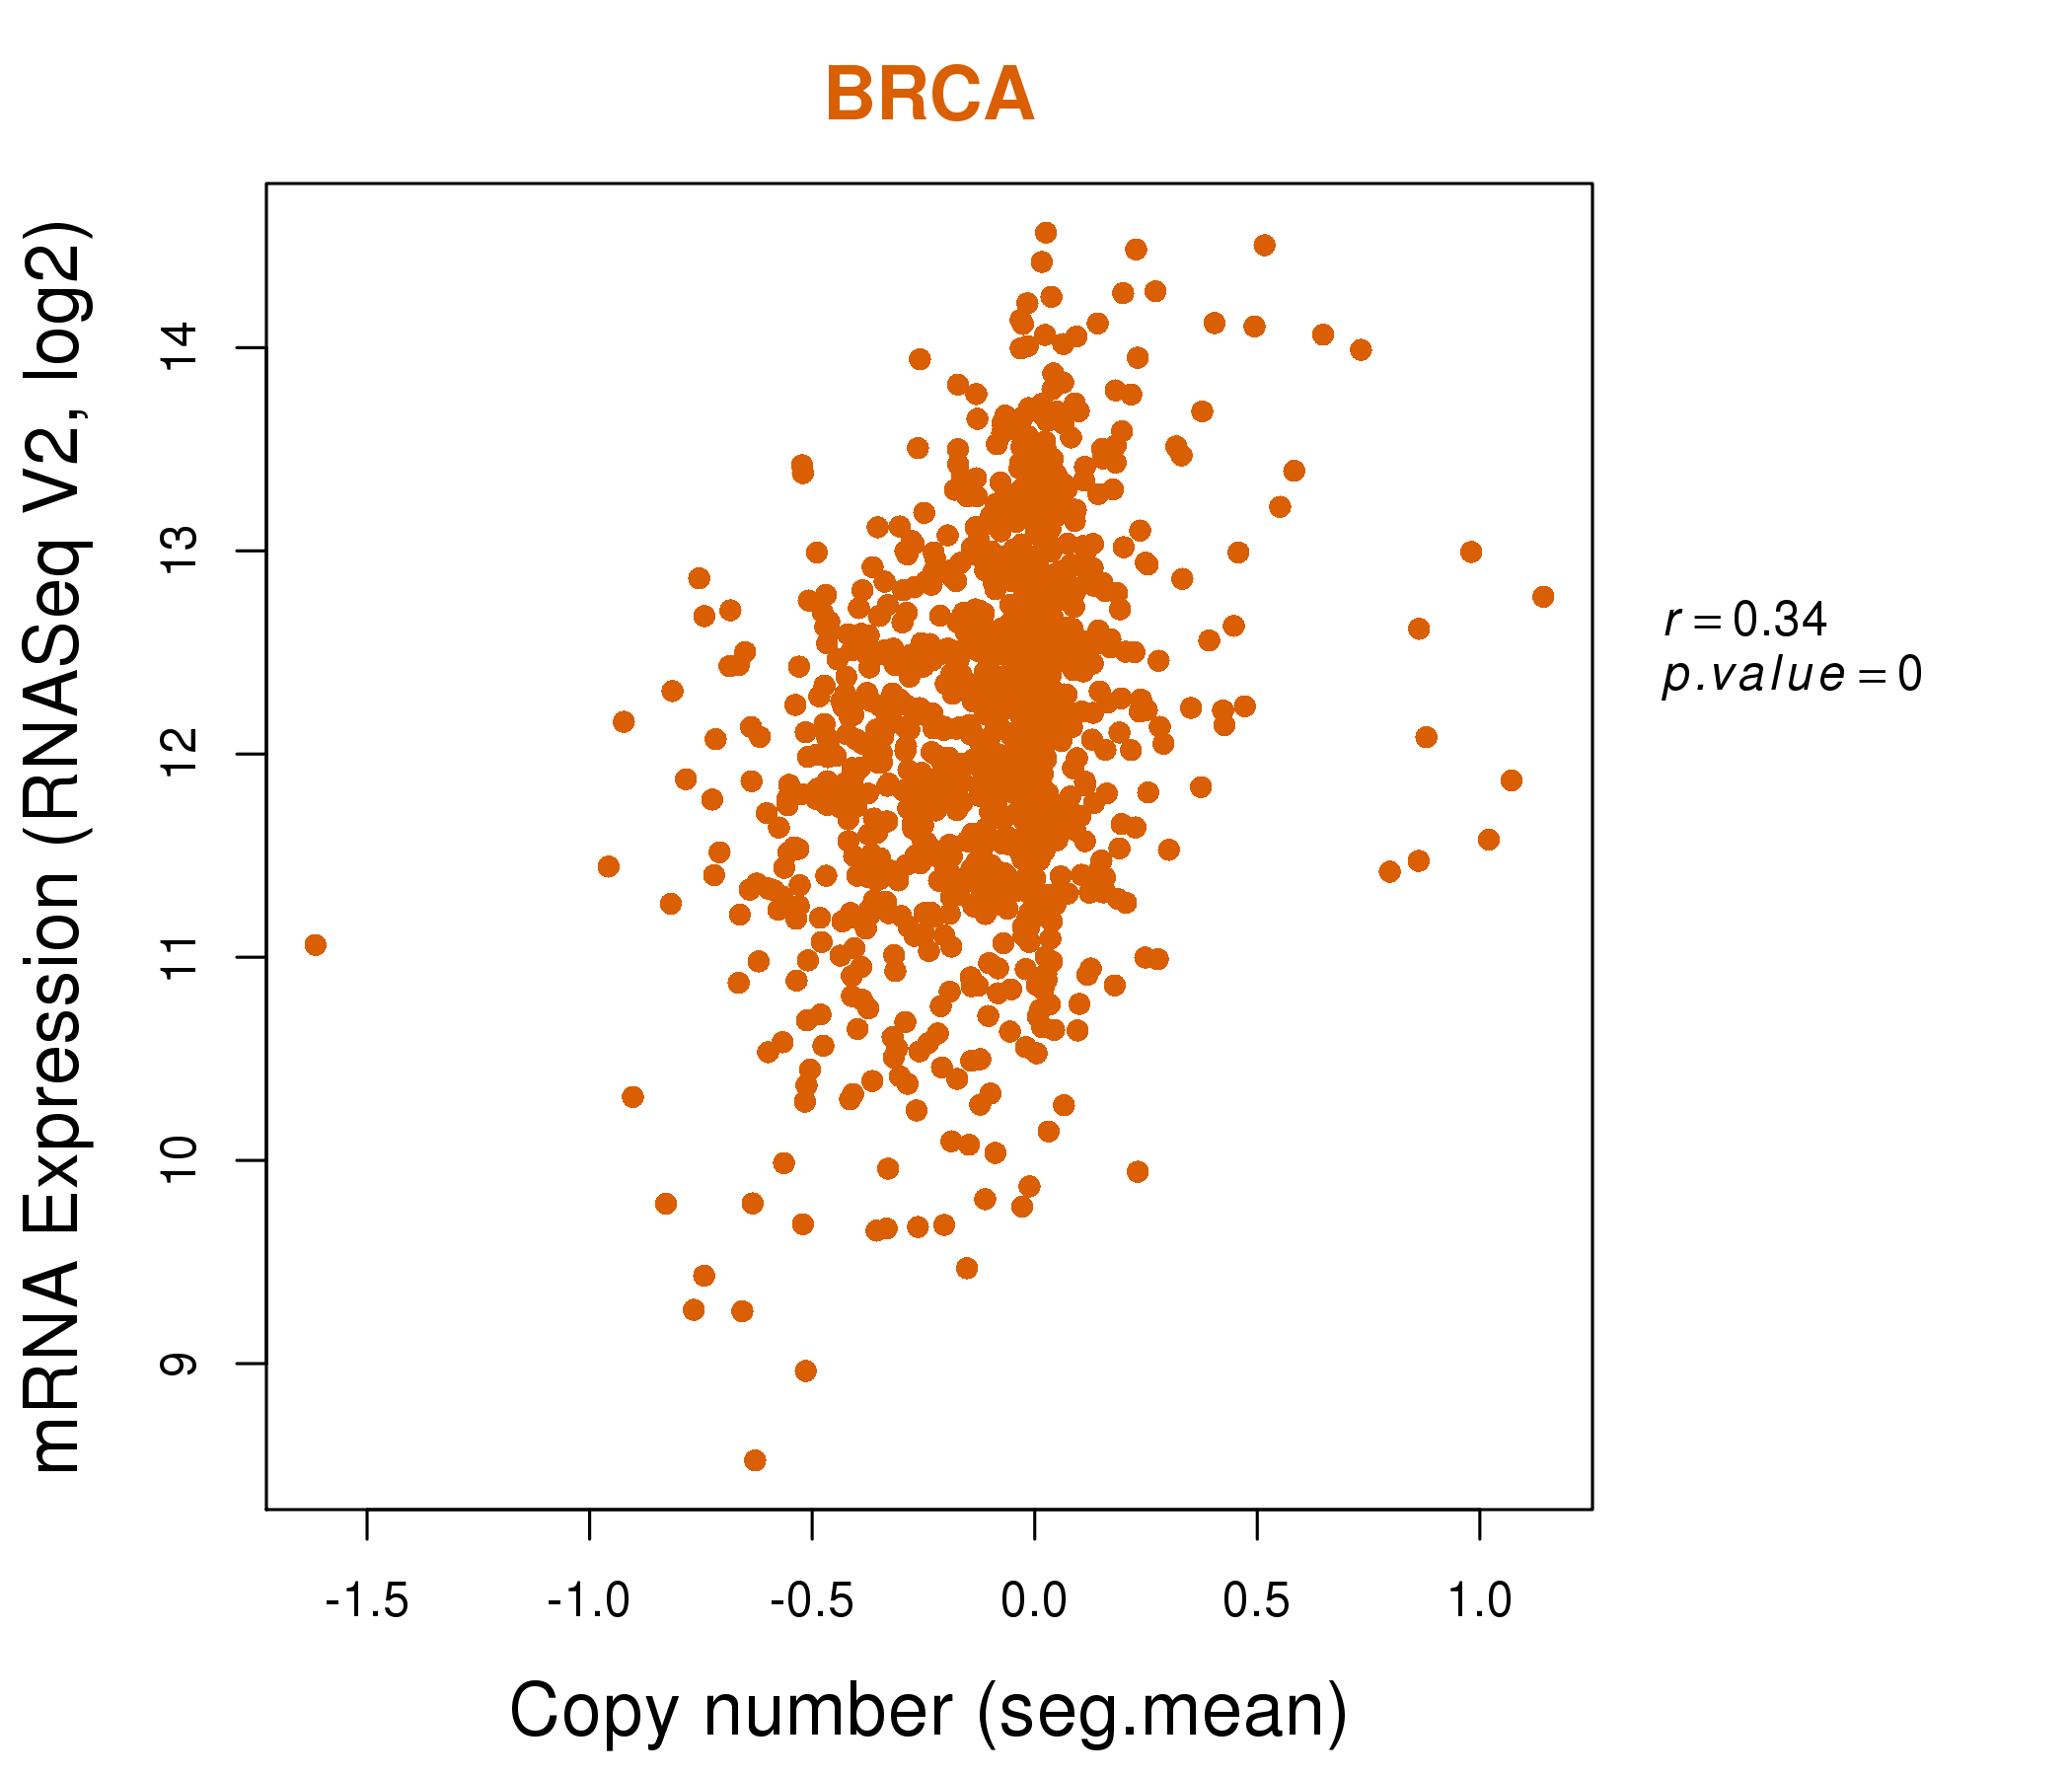
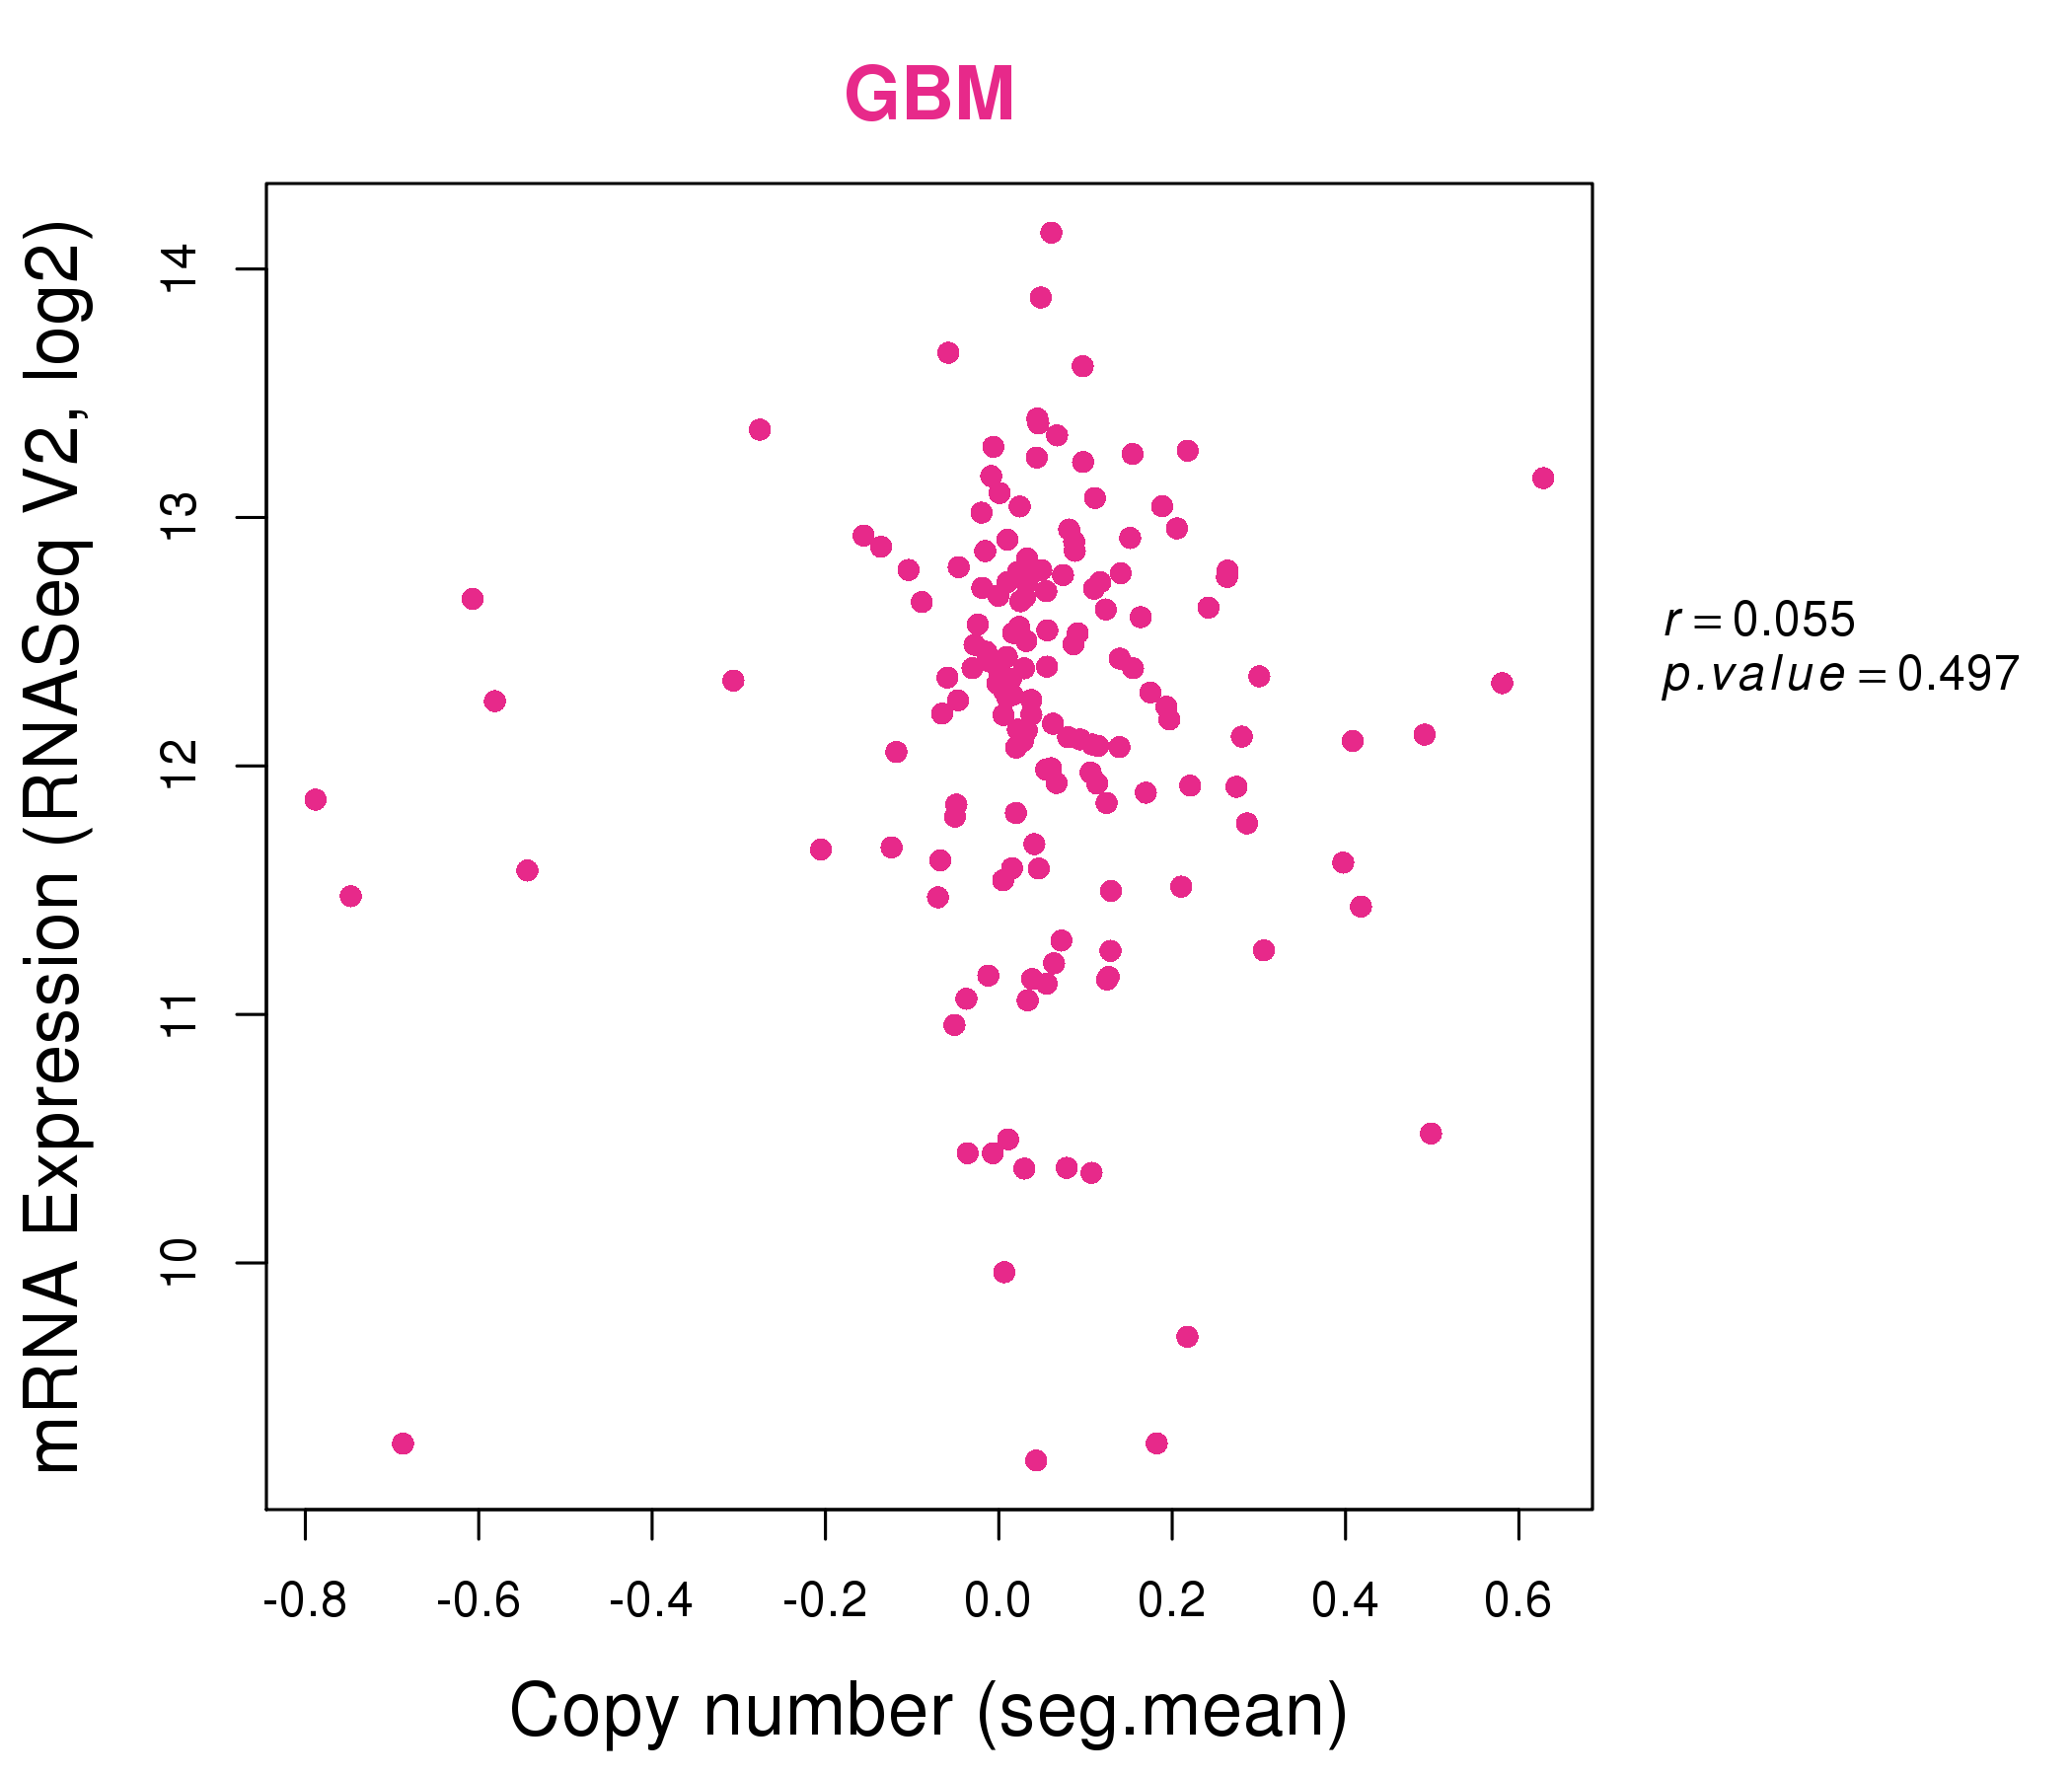
| * Normalized gene expression data of RNASeqV2 was extracted from TCGA using R package TCGA-Assembler. The URLs of all public data files on TCGA DCC data server were gathered at Jan-05-2015. Only eight cancer types have enough normal control samples for differential expression analysis. (t test, adjusted p<0.05 (using Benjamini-Hochberg FDR)) |
 |
| Top |
| * This plots show the correlation between CNV and gene expression. |
: Open all plots for all cancer types
 |
|
 |
|
| Top |
| Gene-Gene Network Information |
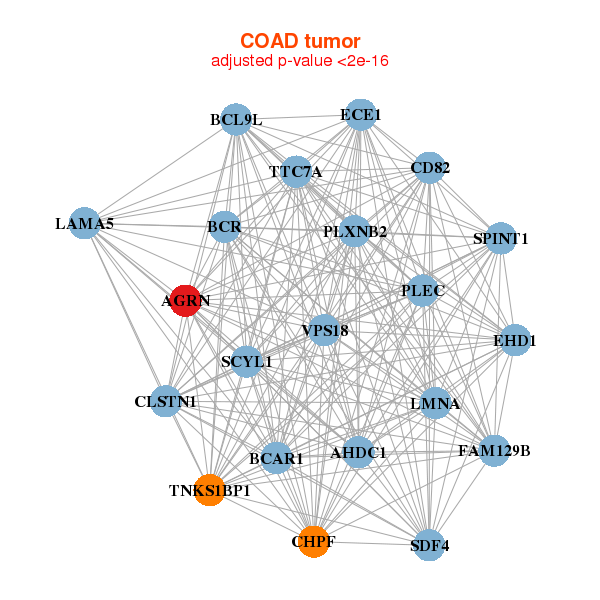
| * Co-Expression network figures were drawn using R package igraph. Only the top 20 genes with the highest correlations were shown. Red circle: input gene, orange circle: cell metabolism gene, sky circle: other gene |
: Open all plots for all cancer types
 |
|
| ACAP3,AGRN,AHDC1,BCAR1,C1orf159,COL18A1,CROCC, DVL1,INF2,INTS1,CEP170B,LMNA,MAP7D1,MIB2, PLEKHM2,PLEKHN1,PRKCZ,SDF4,UBE2J2,ZBTB17,ZNF628 | AGRN,ARVCF,CADM4,CAPN1,DGCR2,FAM129B,FAM83F, FBXL19,H2AFY2,ITGA3,LSR,NCDN,PAK4,PKP3, PLXNB2,RFX1,SLC12A9,SMARCA4,ST14,SYTL1,U2AF2 |
 |
|
| AGRN,AHDC1,BCAR1,BCL9L,BCR,CD82,CHPF, CLSTN1,ECE1,EHD1,FAM129B,LAMA5,LMNA,PLEC, PLXNB2,SCYL1,SDF4,SPINT1,TNKS1BP1,TTC7A,VPS18 | AGRN,ANKRD11,ARID1A,ATXN2L,CEP250,CPSF1,FBXL19, GTF3C1,INTS1,MCM3AP,KMT2B___KMT2D,PCNT,PHRF1,SAFB2, SEC16A,SMARCA4,SRCAP,TAOK2,TNKS1BP1,TRRAP,ZC3H4 |
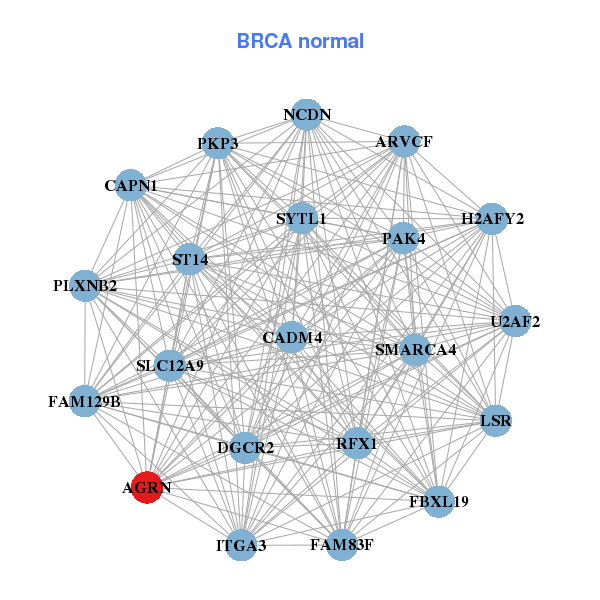

| * Co-Expression network figures were drawn using R package igraph. Only the top 20 genes with the highest correlations were shown. Red circle: input gene, orange circle: cell metabolism gene, sky circle: other gene |
: Open all plots for all cancer types
| Top |
: Open all interacting genes' information including KEGG pathway for all interacting genes from DAVID
| Top |
| Pharmacological Information for AGRN |
| There's no related Drug. |
| Top |
| Cross referenced IDs for AGRN |
| * We obtained these cross-references from Uniprot database. It covers 150 different DBs, 18 categories. http://www.uniprot.org/help/cross_references_section |
: Open all cross reference information
|
Copyright © 2016-Present - The Univsersity of Texas Health Science Center at Houston @ |