|
||||||||||||||||||||
| |
| Phenotypic Information (metabolism pathway, cancer, disease, phenome) |
| |
| |
| Gene-Gene Network Information: Co-Expression Network, Interacting Genes & KEGG |
| |
|


| Gene Summary for PLTP |
| Top |
| Phenotypic Information for PLTP(metabolism pathway, cancer, disease, phenome) |
| Cancer | CGAP: PLTP |
| Familial Cancer Database: PLTP | |
| * This gene is included in those cancer gene databases. |
|
|
|
|
|
| . | ||||||||||||||
Oncogene 1 | Significant driver gene in | |||||||||||||||||||
| cf) number; DB name 1 Oncogene; http://nar.oxfordjournals.org/content/35/suppl_1/D721.long, 2 Tumor Suppressor gene; https://bioinfo.uth.edu/TSGene/, 3 Cancer Gene Census; http://www.nature.com/nrc/journal/v4/n3/abs/nrc1299.html, 4 CancerGenes; http://nar.oxfordjournals.org/content/35/suppl_1/D721.long, 5 Network of Cancer Gene; http://ncg.kcl.ac.uk/index.php, 1Therapeutic Vulnerabilities in Cancer; http://cbio.mskcc.org/cancergenomics/statius/ |
| REACTOME_METABOLISM_OF_LIPIDS_AND_LIPOPROTEINS REACTOME_LIPOPROTEIN_METABOLISM | |
| OMIM | |
| Orphanet | |
| Disease | KEGG Disease: PLTP |
| MedGen: PLTP (Human Medical Genetics with Condition) | |
| ClinVar: PLTP | |
| Phenotype | MGI: PLTP (International Mouse Phenotyping Consortium) |
| PhenomicDB: PLTP | |
| Mutations for PLTP |
| * Under tables are showing count per each tissue to give us broad intuition about tissue specific mutation patterns.You can go to the detailed page for each mutation database's web site. |
| - Statistics for Tissue and Mutation type | Top |
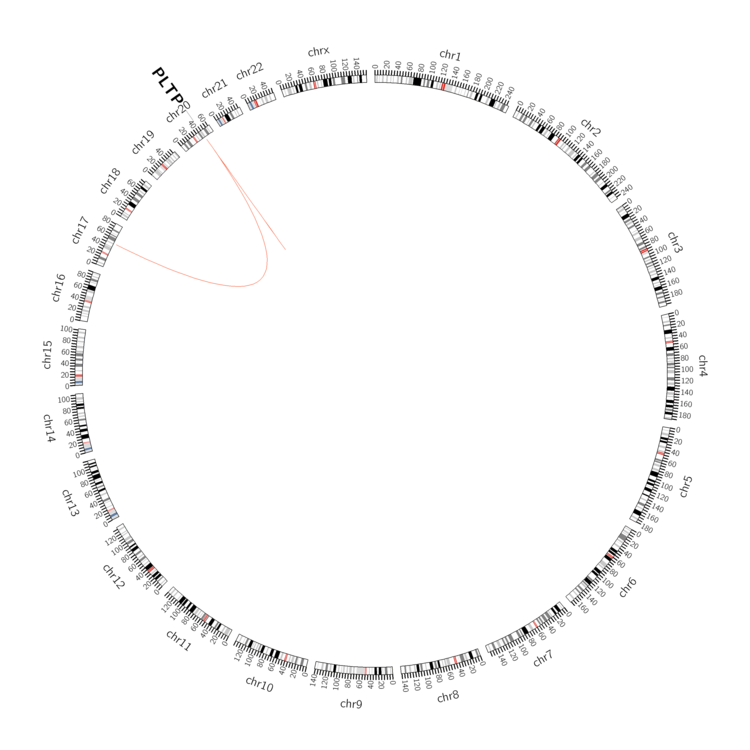 |
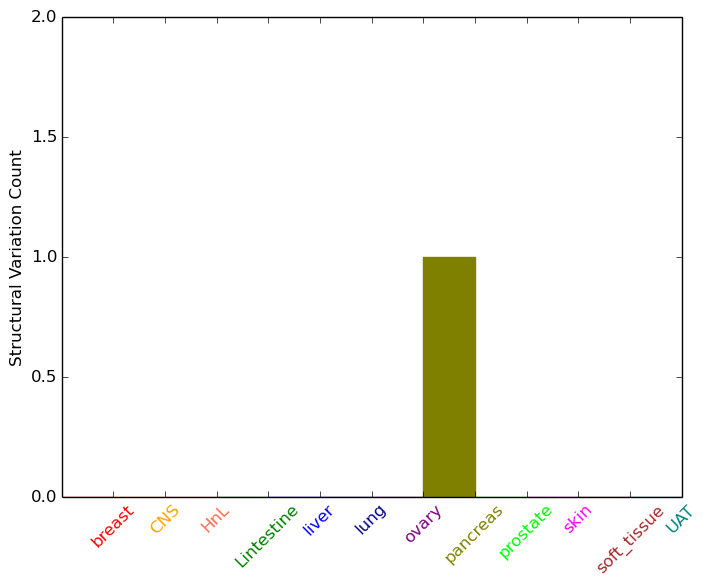
| - For Inter-chromosomal Variations |
| * Inter-chromosomal variantions includes 'interchromosomal amplicon to amplicon', 'interchromosomal amplicon to non-amplified dna', 'interchromosomal insertion', 'Interchromosomal unknown type'. |
 |
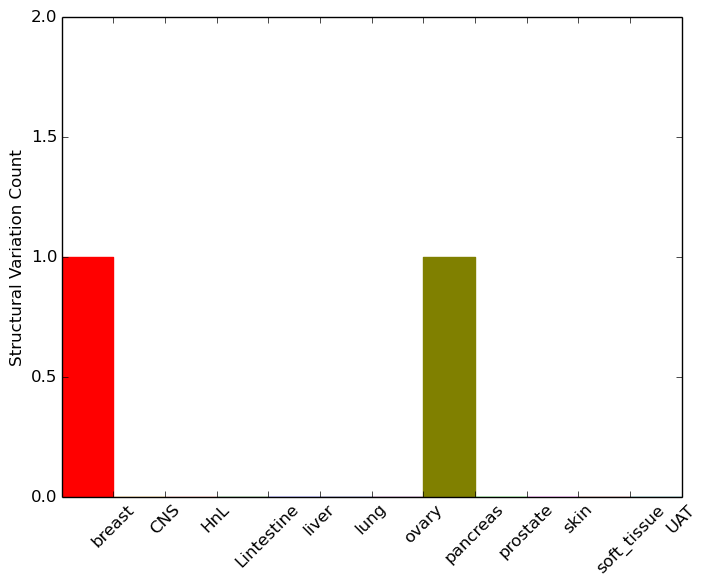
| - For Intra-chromosomal Variations |
| * Intra-chromosomal variantions includes 'intrachromosomal amplicon to amplicon', 'intrachromosomal amplicon to non-amplified dna', 'intrachromosomal deletion', 'intrachromosomal fold-back inversion', 'intrachromosomal inversion', 'intrachromosomal tandem duplication', 'Intrachromosomal unknown type', 'intrachromosomal with inverted orientation', 'intrachromosomal with non-inverted orientation'. |
 |
| Sample | Symbol_a | Chr_a | Start_a | End_a | Symbol_b | Chr_b | Start_b | End_b |
| breast | PLTP | chr20 | 44534111 | 44534111 | chr20 | 44576980 | 44576980 | |
| pancreas | PLTP | chr20 | 44535361 | 44535381 | PLTP | chr20 | 44535774 | 44535794 |
| cf) Tissue number; Tissue name (1;Breast, 2;Central_nervous_system, 3;Haematopoietic_and_lymphoid_tissue, 4;Large_intestine, 5;Liver, 6;Lung, 7;Ovary, 8;Pancreas, 9;Prostate, 10;Skin, 11;Soft_tissue, 12;Upper_aerodigestive_tract) |
| * From mRNA Sanger sequences, Chitars2.0 arranged chimeric transcripts. This table shows PLTP related fusion information. |
| ID | Head Gene | Tail Gene | Accession | Gene_a | qStart_a | qEnd_a | Chromosome_a | tStart_a | tEnd_a | Gene_a | qStart_a | qEnd_a | Chromosome_a | tStart_a | tEnd_a |
| Top |
| There's no copy number variation information in COSMIC data for this gene. |
| Top |
|
 |
| Top |
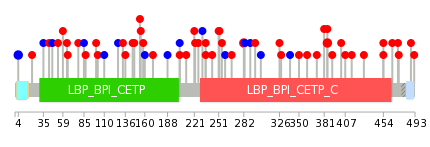
| Stat. for Non-Synonymous SNVs (# total SNVs=46) | (# total SNVs=13) |
 |  |
(# total SNVs=0) | (# total SNVs=0) |
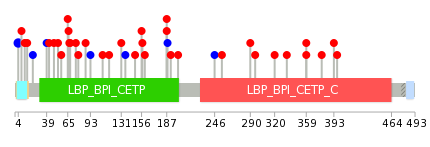
| Top |
| * When you move the cursor on each content, you can see more deailed mutation information on the Tooltip. Those are primary_site,primary_histology,mutation(aa),pubmedID. |
| GRCh37 position | Mutation(aa) | Unique sampleID count |
| chr20:44530927-44530927 | p.R385L | 3 |
| chr20:44540080-44540080 | p.F4F | 2 |
| chr20:44533618-44533618 | p.R282Q | 2 |
| chr20:44533663-44533663 | p.A267V | 1 |
| chr20:44539798-44539798 | p.I65V | 1 |
| chr20:44527669-44527669 | p.A465T | 1 |
| chr20:44534950-44534950 | p.K221R | 1 |
| chr20:44531107-44531107 | p.P360L | 1 |
| chr20:44538206-44538206 | p.S145F | 1 |
| chr20:44533686-44533686 | p.E259E | 1 |
| Top |
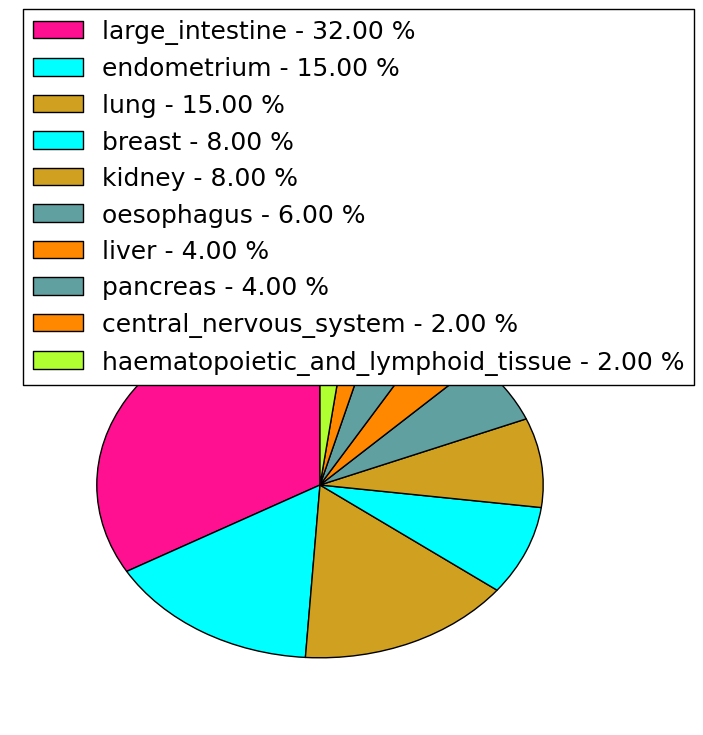
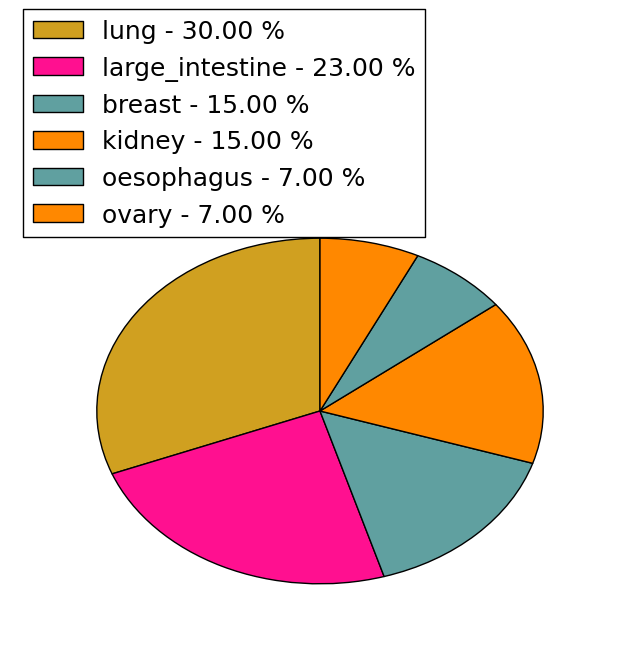
|
 |
| Point Mutation/ Tissue ID | 1 | 2 | 3 | 4 | 5 | 6 | 7 | 8 | 9 | 10 | 11 | 12 | 13 | 14 | 15 | 16 | 17 | 18 | 19 | 20 |
| # sample | 1 | 1 | 8 | 1 | 3 | 1 | 7 | 3 | 1 | 1 | 1 | 4 | 7 | |||||||
| # mutation | 1 | 1 | 11 | 1 | 3 | 1 | 7 | 3 | 1 | 1 | 1 | 5 | 7 | |||||||
| nonsynonymous SNV | 1 | 1 | 10 | 1 | 2 | 5 | 2 | 1 | 1 | 4 | 7 | |||||||||
| synonymous SNV | 1 | 1 | 1 | 2 | 1 | 1 | 1 |
| cf) Tissue ID; Tissue type (1; BLCA[Bladder Urothelial Carcinoma], 2; BRCA[Breast invasive carcinoma], 3; CESC[Cervical squamous cell carcinoma and endocervical adenocarcinoma], 4; COAD[Colon adenocarcinoma], 5; GBM[Glioblastoma multiforme], 6; Glioma Low Grade, 7; HNSC[Head and Neck squamous cell carcinoma], 8; KICH[Kidney Chromophobe], 9; KIRC[Kidney renal clear cell carcinoma], 10; KIRP[Kidney renal papillary cell carcinoma], 11; LAML[Acute Myeloid Leukemia], 12; LUAD[Lung adenocarcinoma], 13; LUSC[Lung squamous cell carcinoma], 14; OV[Ovarian serous cystadenocarcinoma ], 15; PAAD[Pancreatic adenocarcinoma], 16; PRAD[Prostate adenocarcinoma], 17; SKCM[Skin Cutaneous Melanoma], 18:STAD[Stomach adenocarcinoma], 19:THCA[Thyroid carcinoma], 20:UCEC[Uterine Corpus Endometrial Carcinoma]) |
| Top |
| * We represented just top 10 SNVs. When you move the cursor on each content, you can see more deailed mutation information on the Tooltip. Those are primary_site, primary_histology, mutation(aa), pubmedID. |
| Genomic Position | Mutation(aa) | Unique sampleID count |
| chr20:44540080 | p.F4F,PLTP | 2 |
| chr20:44536520 | p.R290L,PLTP | 1 |
| chr20:44527702 | p.L93L,PLTP | 1 |
| chr20:44538707 | p.A15T,PLTP | 1 |
| chr20:44533619 | p.V255I,PLTP | 1 |
| chr20:44538177 | p.T75M,PLTP | 1 |
| chr20:44528172 | p.G246G,PLTP | 1 |
| chr20:44539798 | p.A67T,PLTP | 1 |
| chr20:44533700 | p.P201T,PLTP | 1 |
| chr20:44538179 | p.H66R,PLTP | 1 |
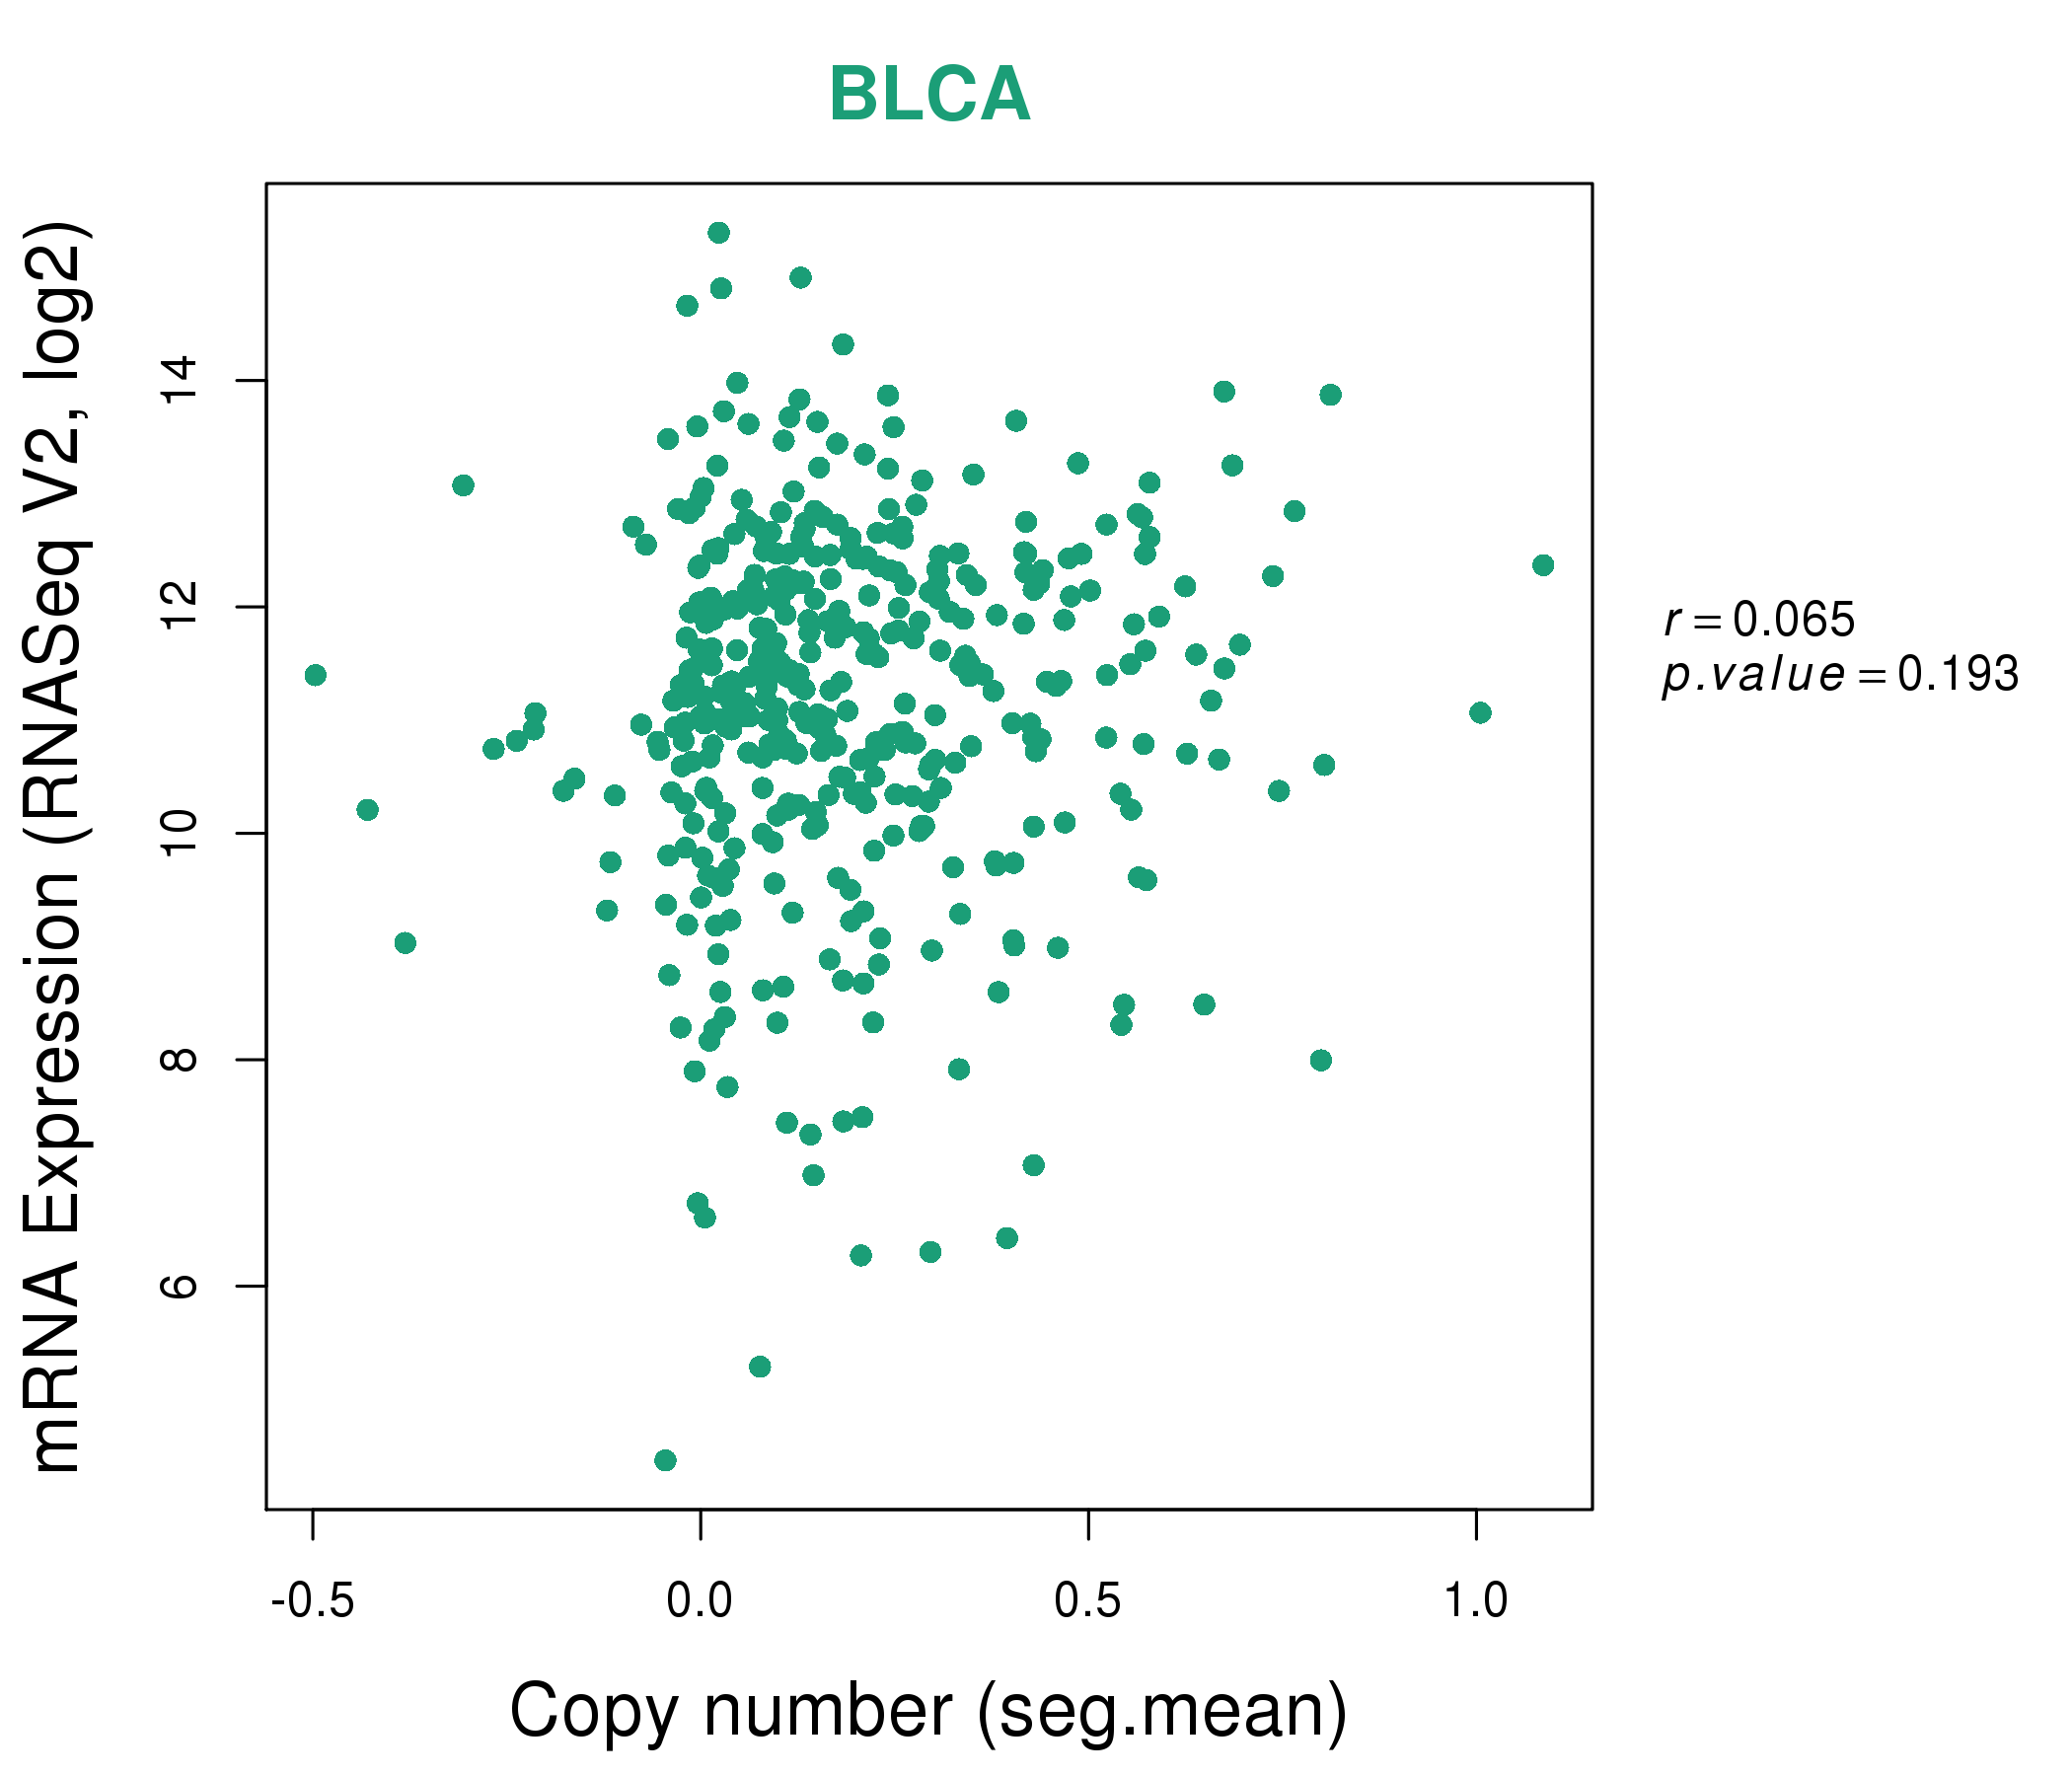
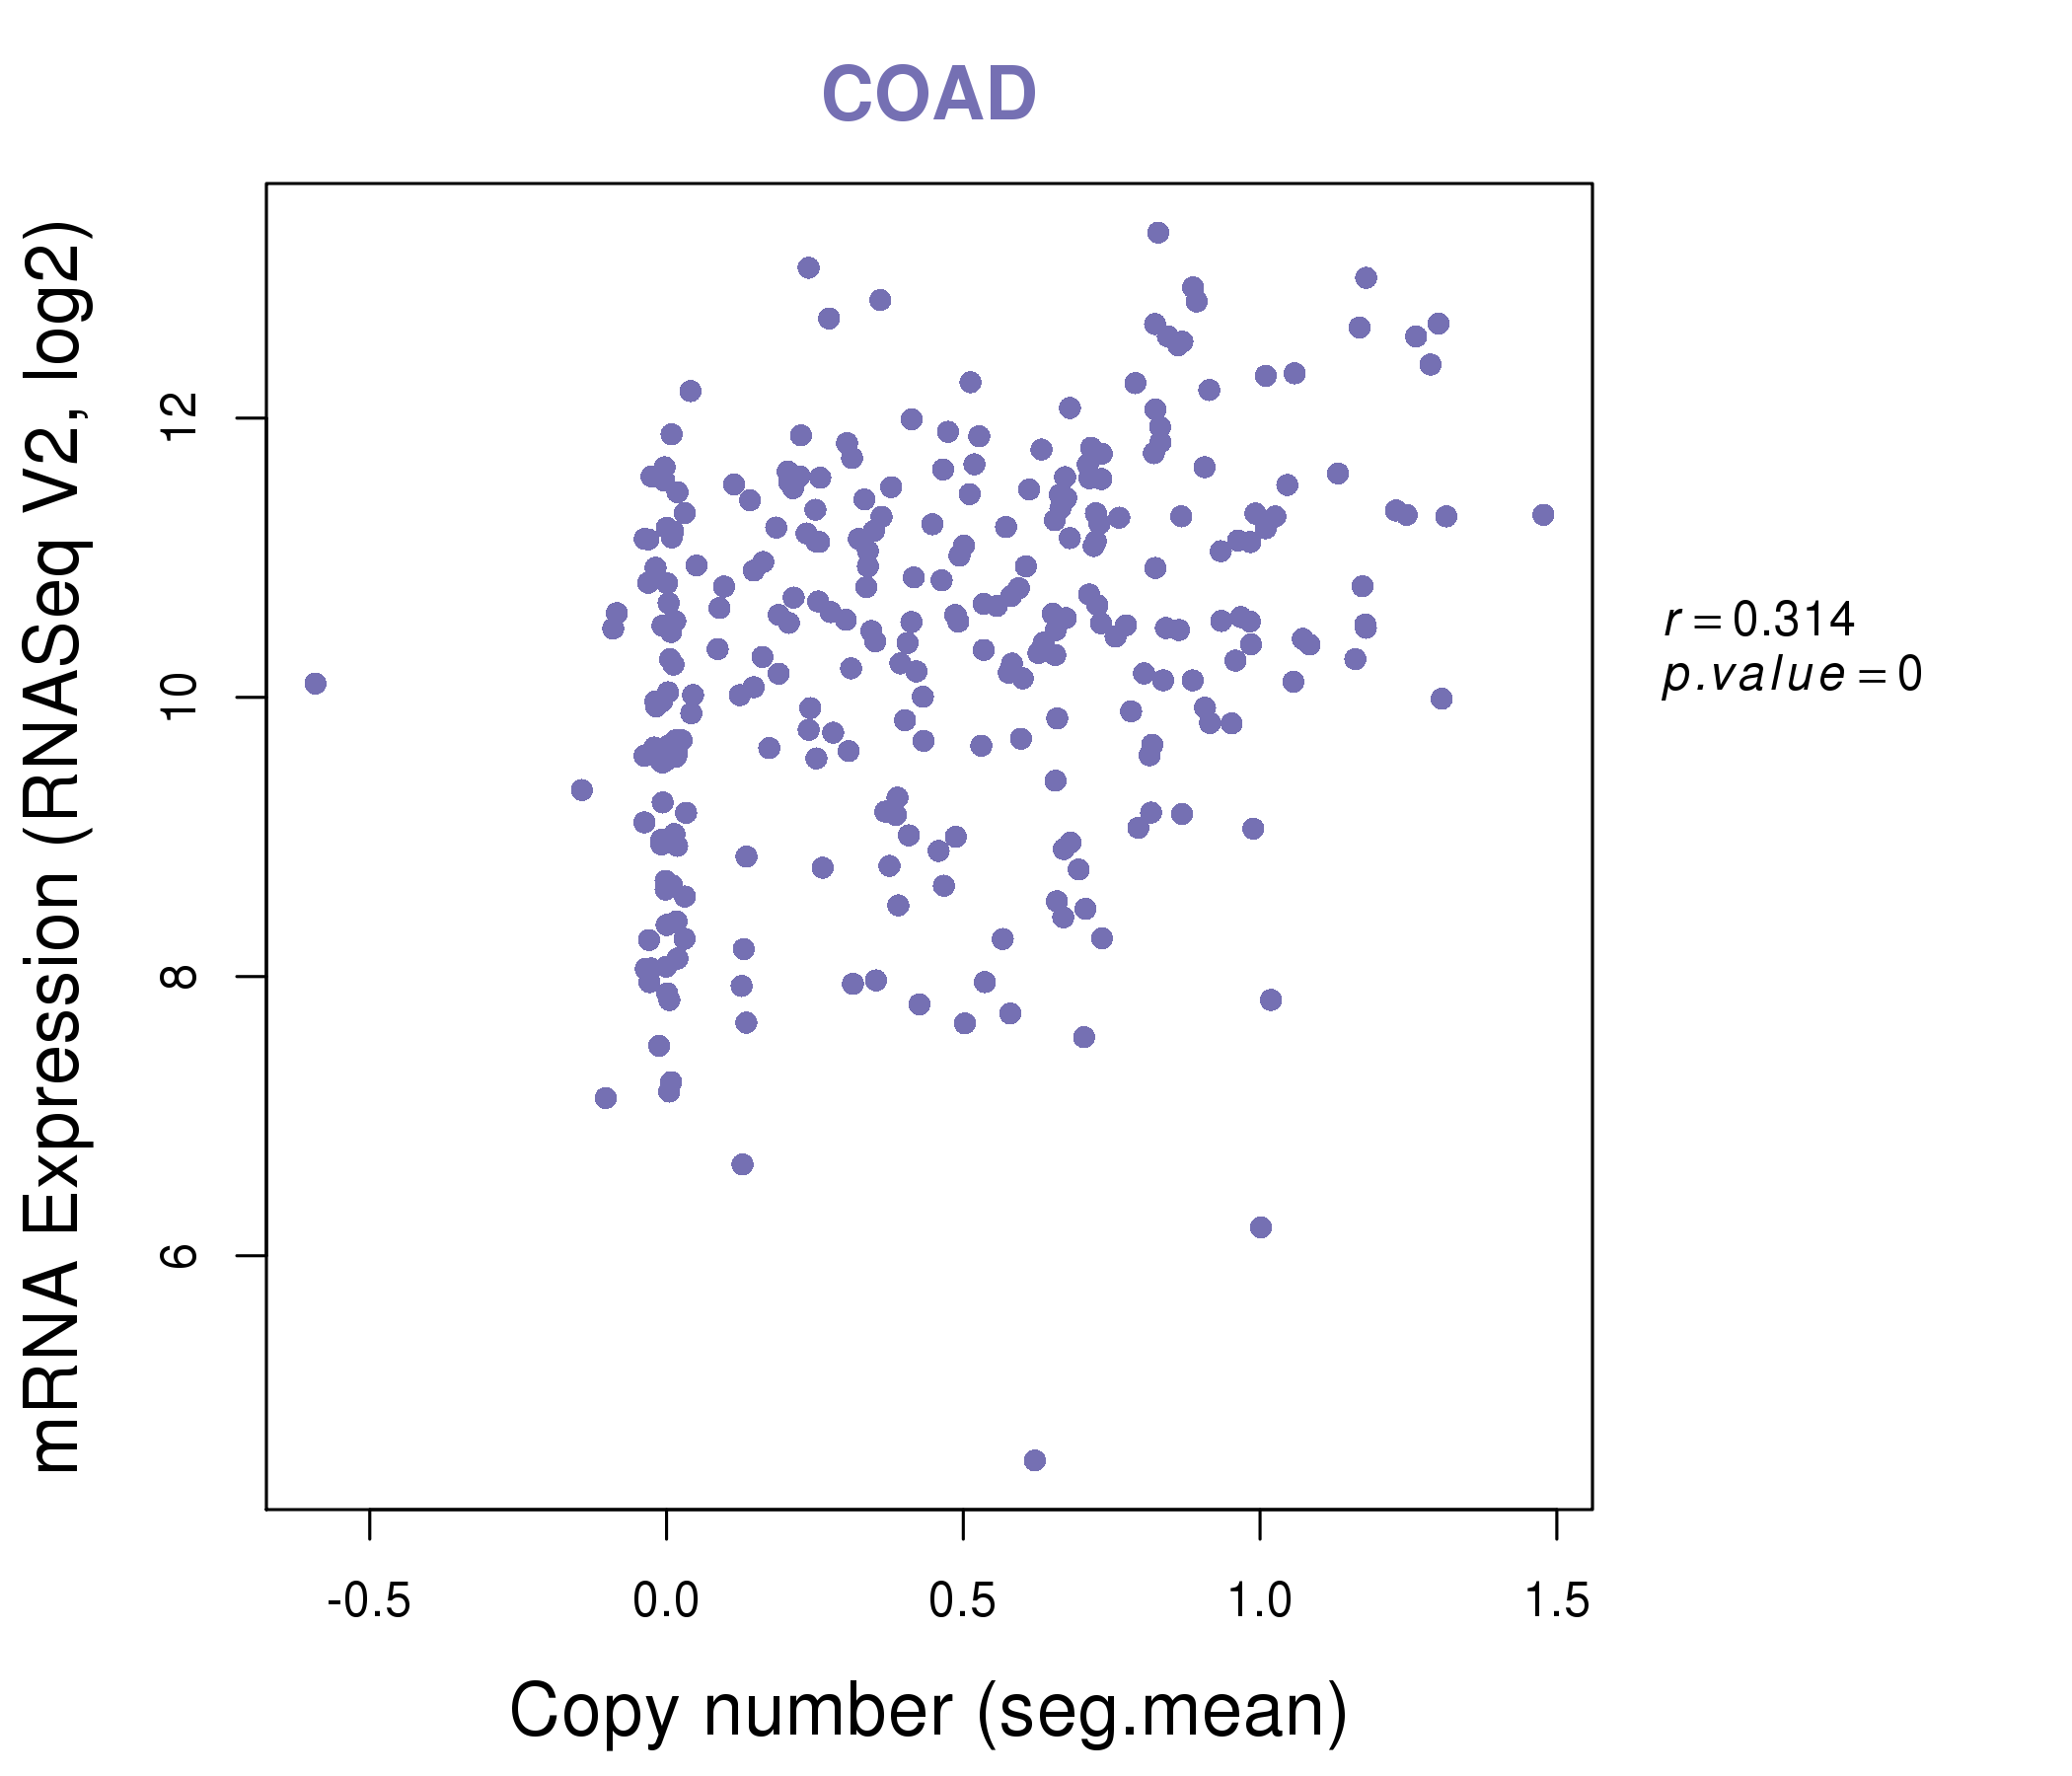
| * Copy number data were extracted from TCGA using R package TCGA-Assembler. The URLs of all public data files on TCGA DCC data server were gathered on Jan-05-2015. Function ProcessCNAData in TCGA-Assembler package was used to obtain gene-level copy number value which is calculated as the average copy number of the genomic region of a gene. |
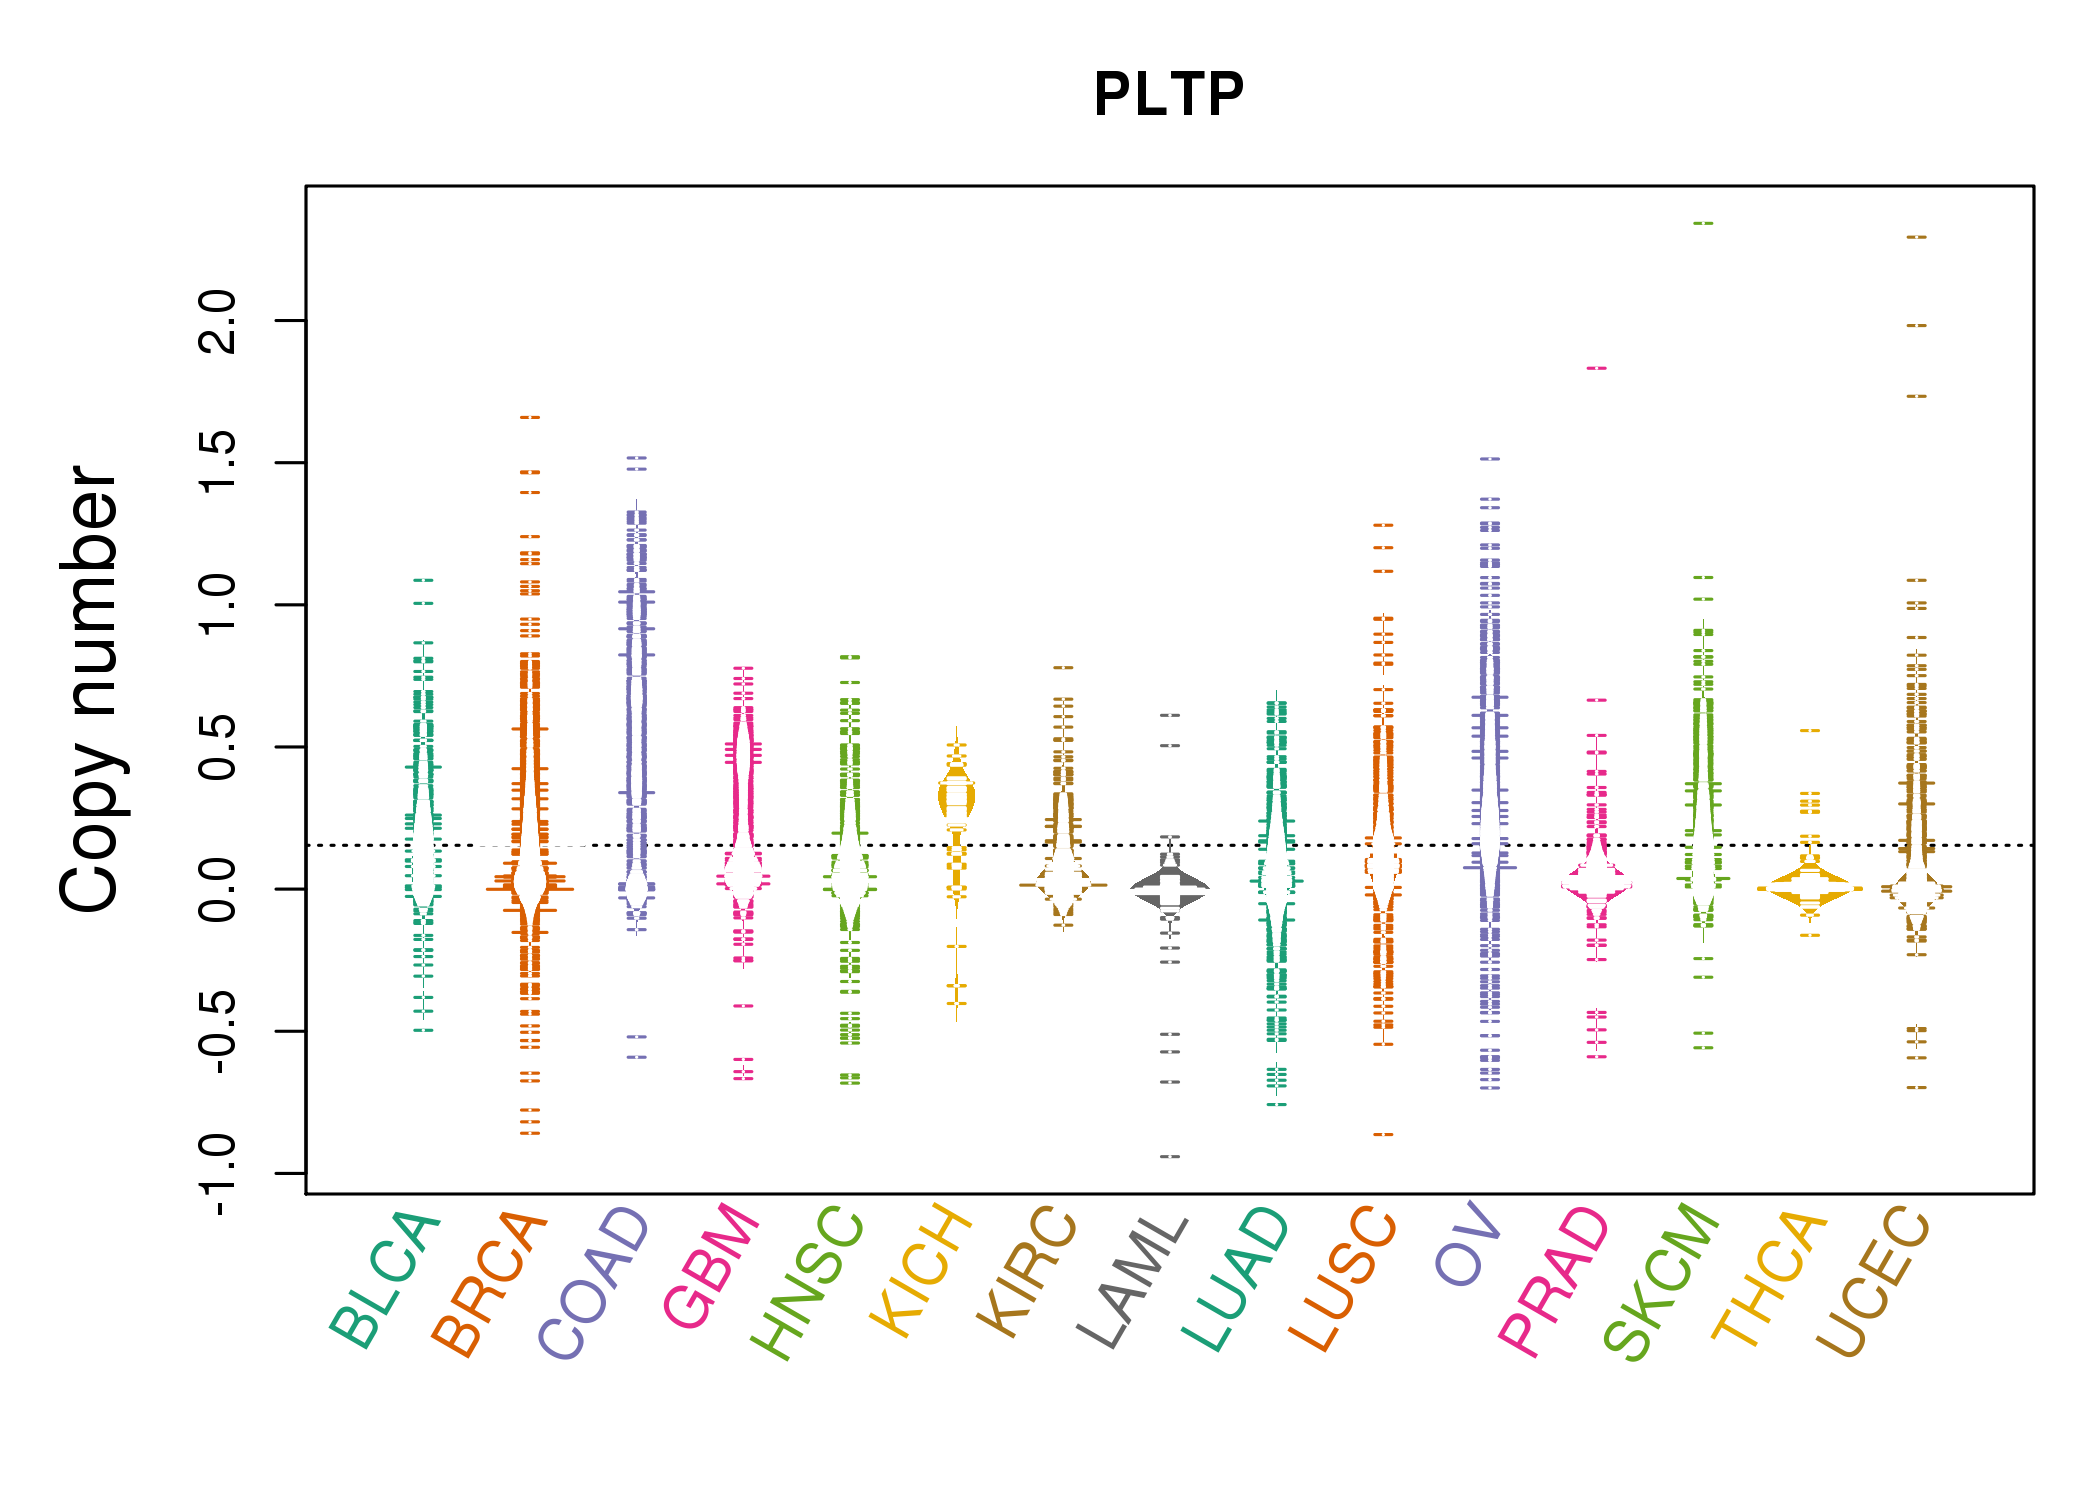 |
| cf) Tissue ID[Tissue type]: BLCA[Bladder Urothelial Carcinoma], BRCA[Breast invasive carcinoma], CESC[Cervical squamous cell carcinoma and endocervical adenocarcinoma], COAD[Colon adenocarcinoma], GBM[Glioblastoma multiforme], Glioma Low Grade, HNSC[Head and Neck squamous cell carcinoma], KICH[Kidney Chromophobe], KIRC[Kidney renal clear cell carcinoma], KIRP[Kidney renal papillary cell carcinoma], LAML[Acute Myeloid Leukemia], LUAD[Lung adenocarcinoma], LUSC[Lung squamous cell carcinoma], OV[Ovarian serous cystadenocarcinoma ], PAAD[Pancreatic adenocarcinoma], PRAD[Prostate adenocarcinoma], SKCM[Skin Cutaneous Melanoma], STAD[Stomach adenocarcinoma], THCA[Thyroid carcinoma], UCEC[Uterine Corpus Endometrial Carcinoma] |
| Top |
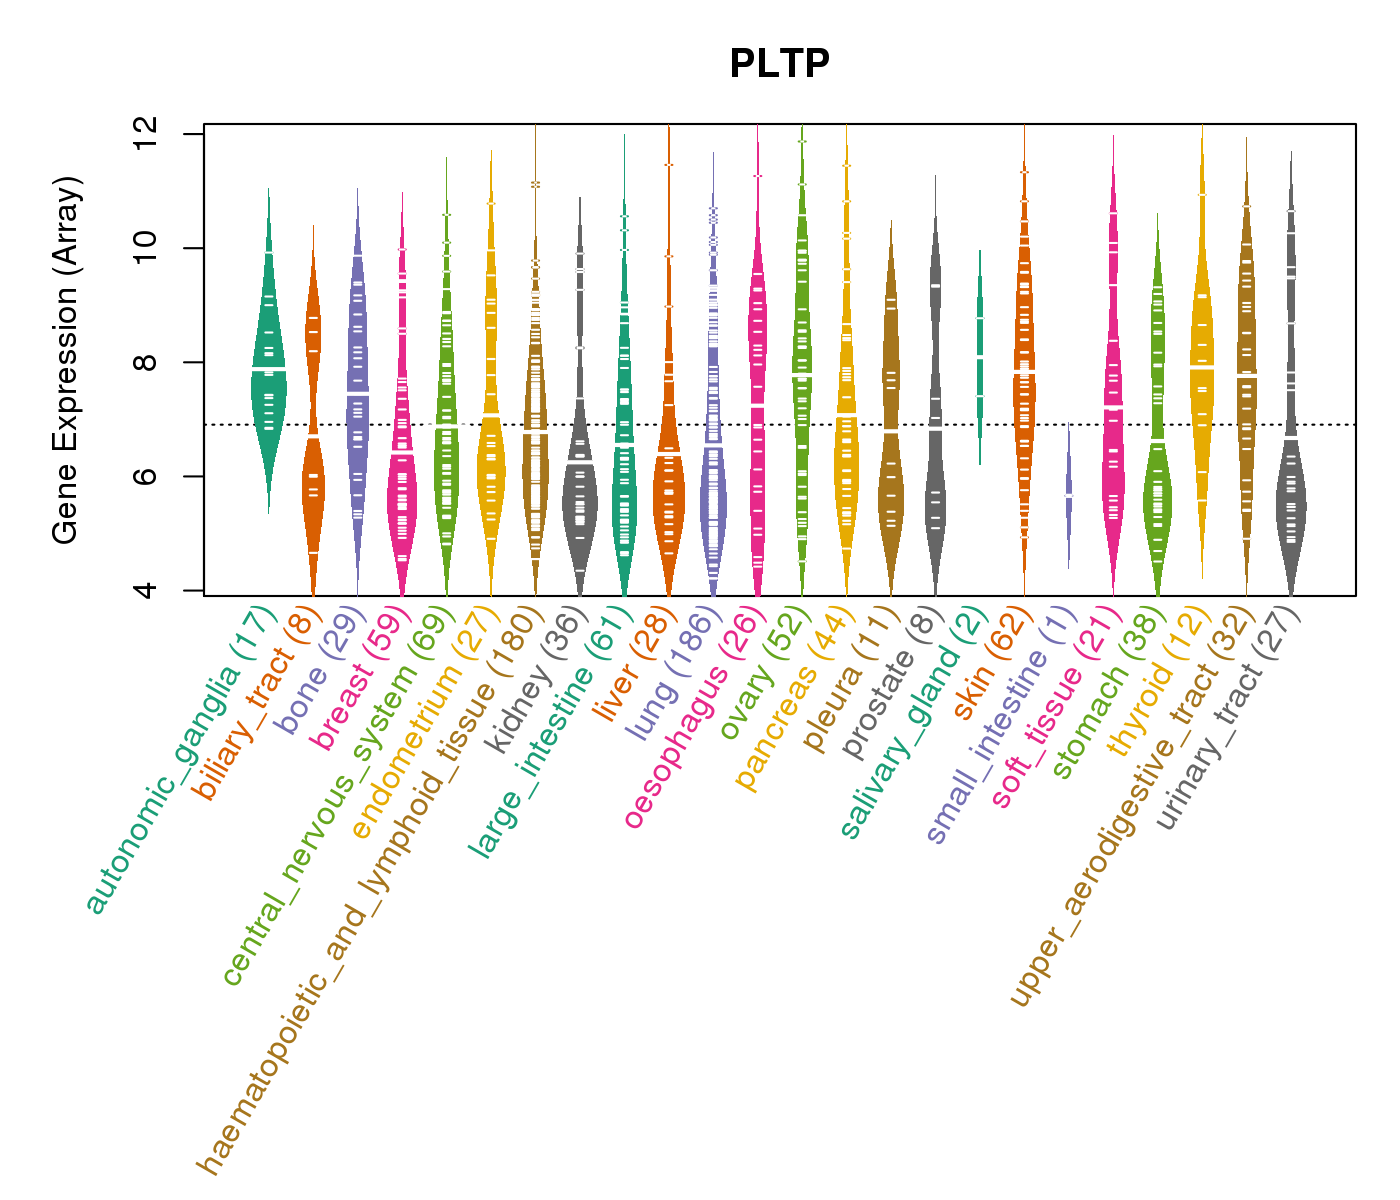
| Gene Expression for PLTP |
| * CCLE gene expression data were extracted from CCLE_Expression_Entrez_2012-10-18.res: Gene-centric RMA-normalized mRNA expression data. |
 |
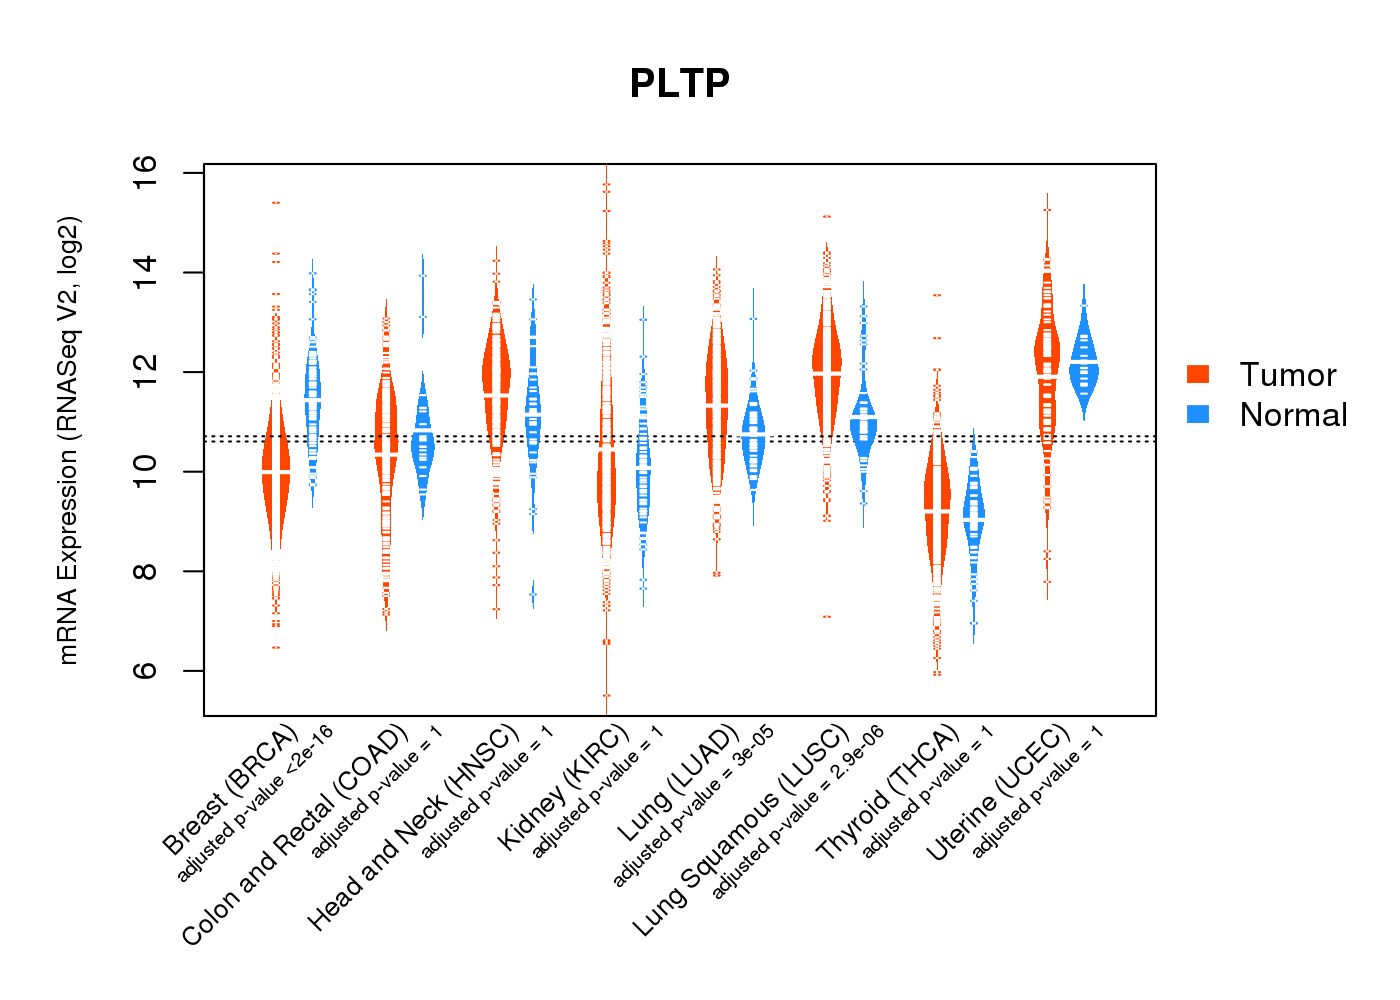
| * Normalized gene expression data of RNASeqV2 was extracted from TCGA using R package TCGA-Assembler. The URLs of all public data files on TCGA DCC data server were gathered at Jan-05-2015. Only eight cancer types have enough normal control samples for differential expression analysis. (t test, adjusted p<0.05 (using Benjamini-Hochberg FDR)) |
 |
| Top |
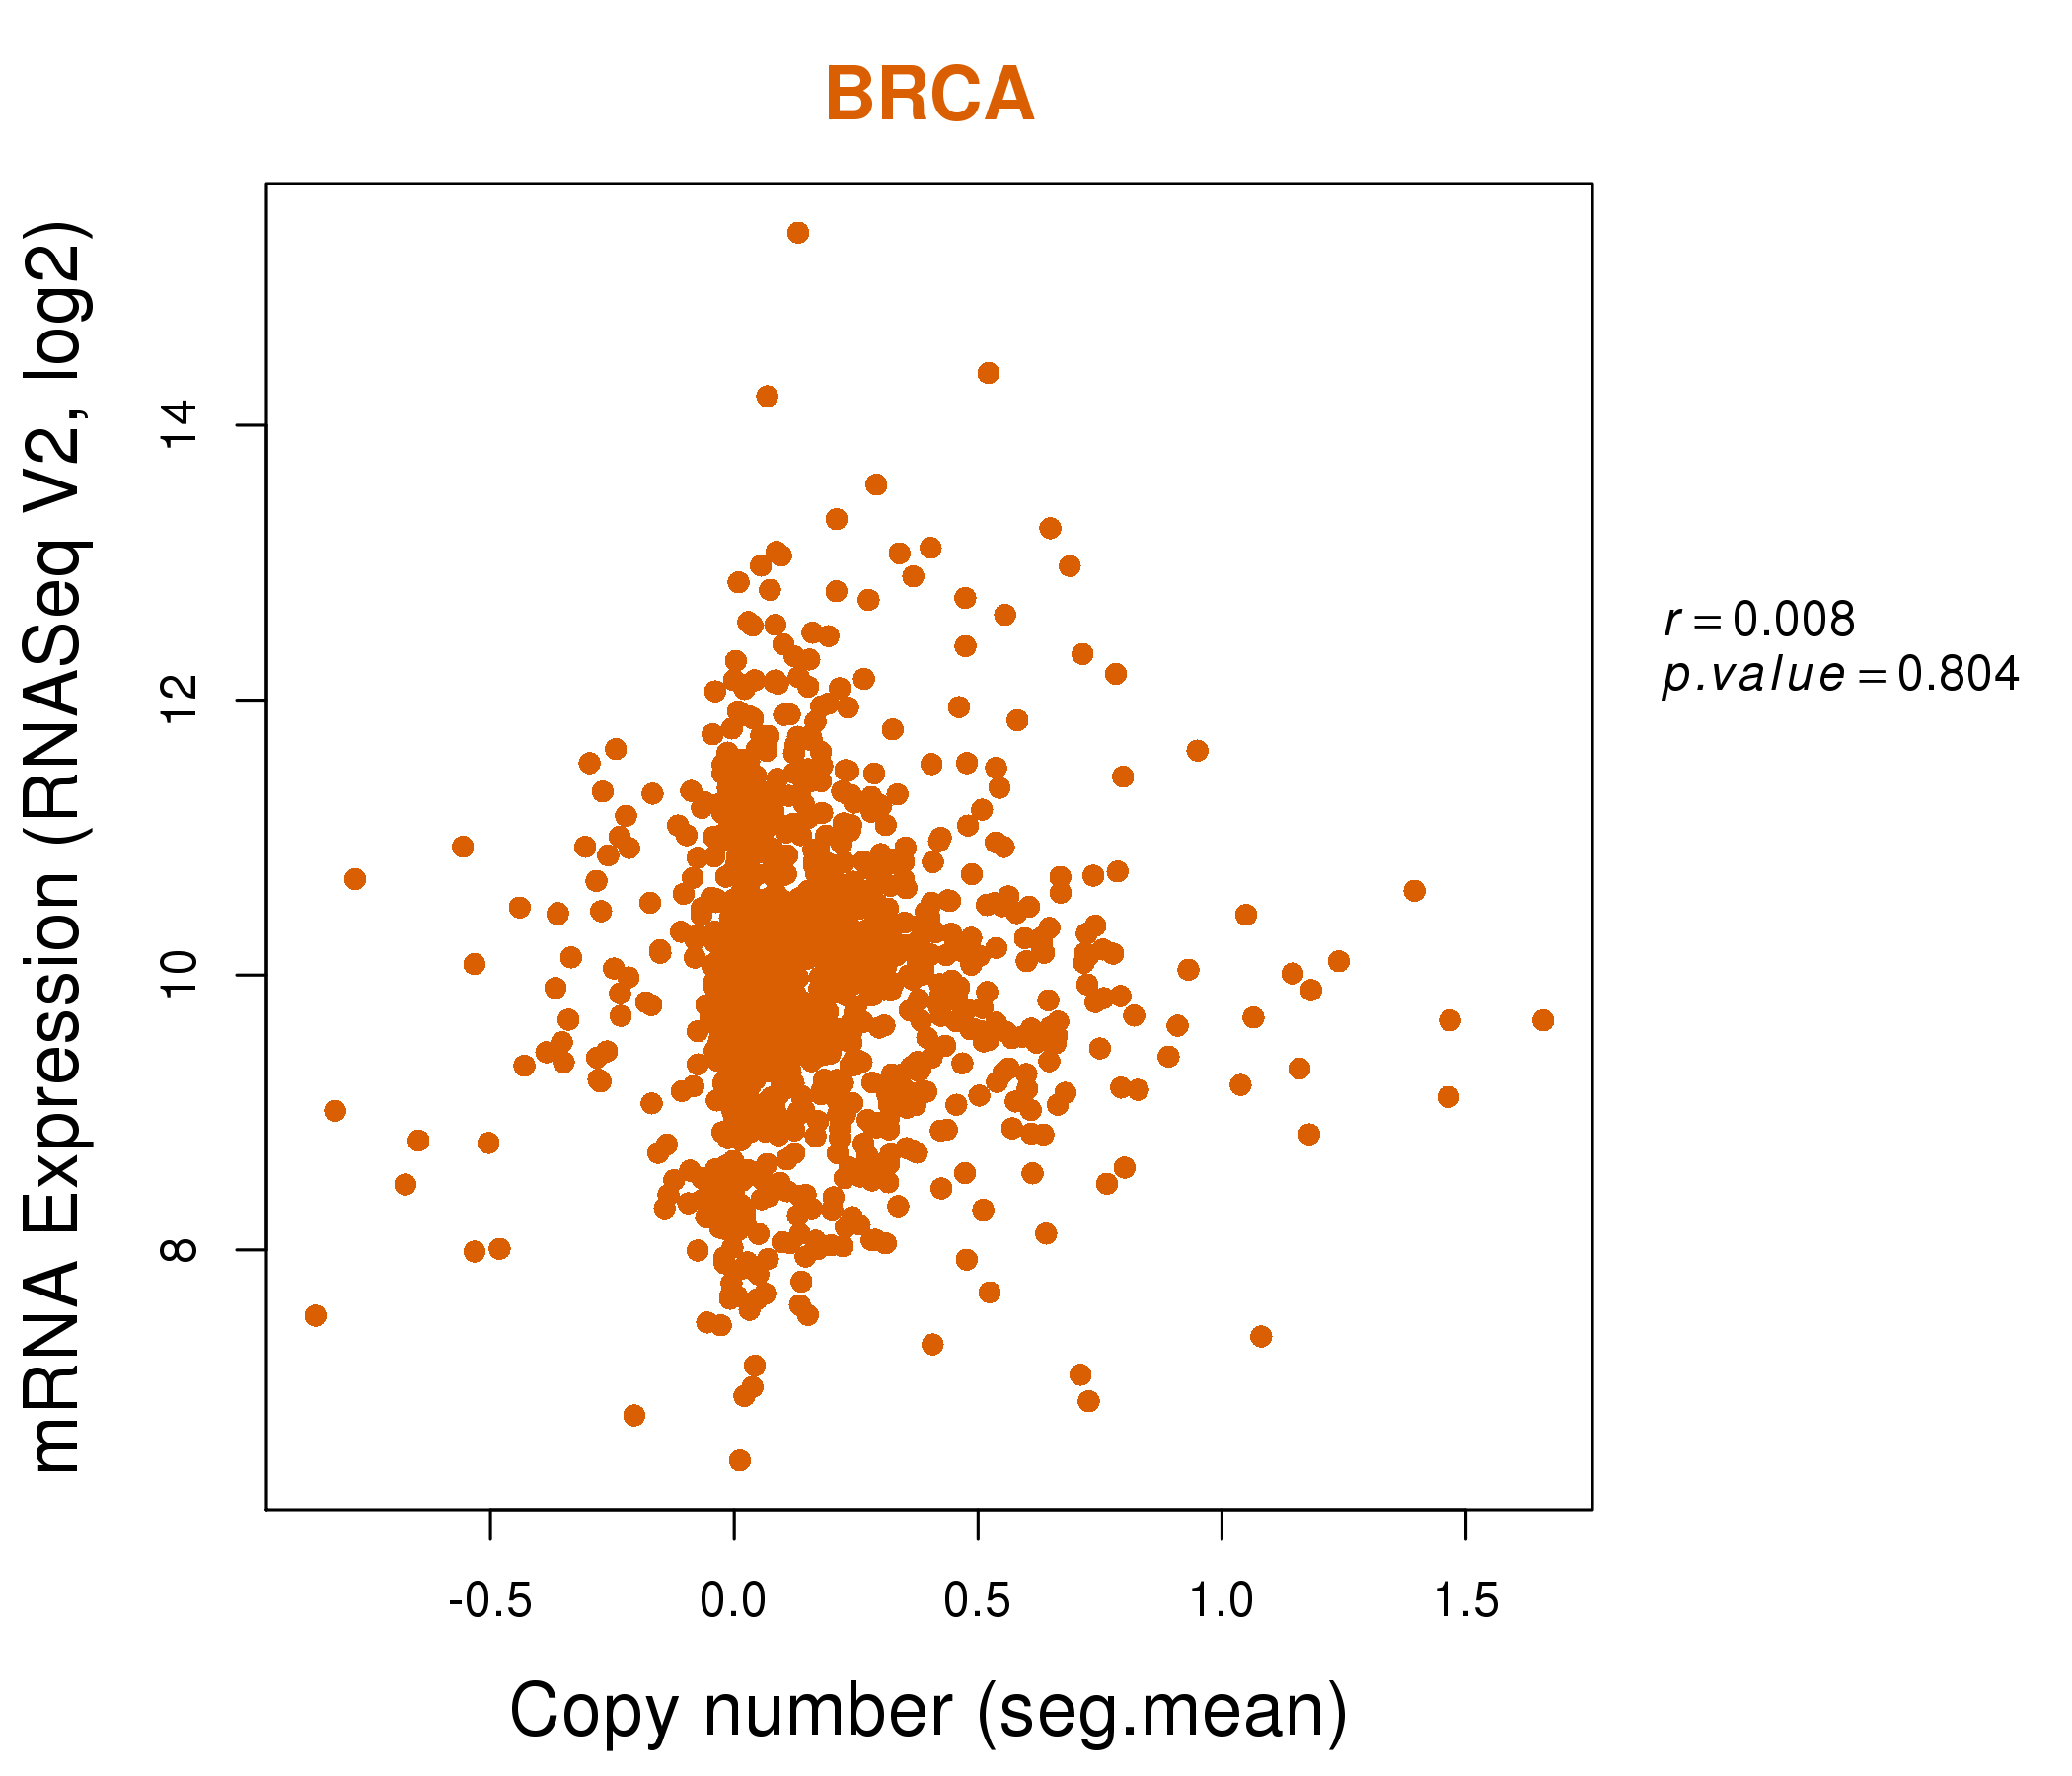
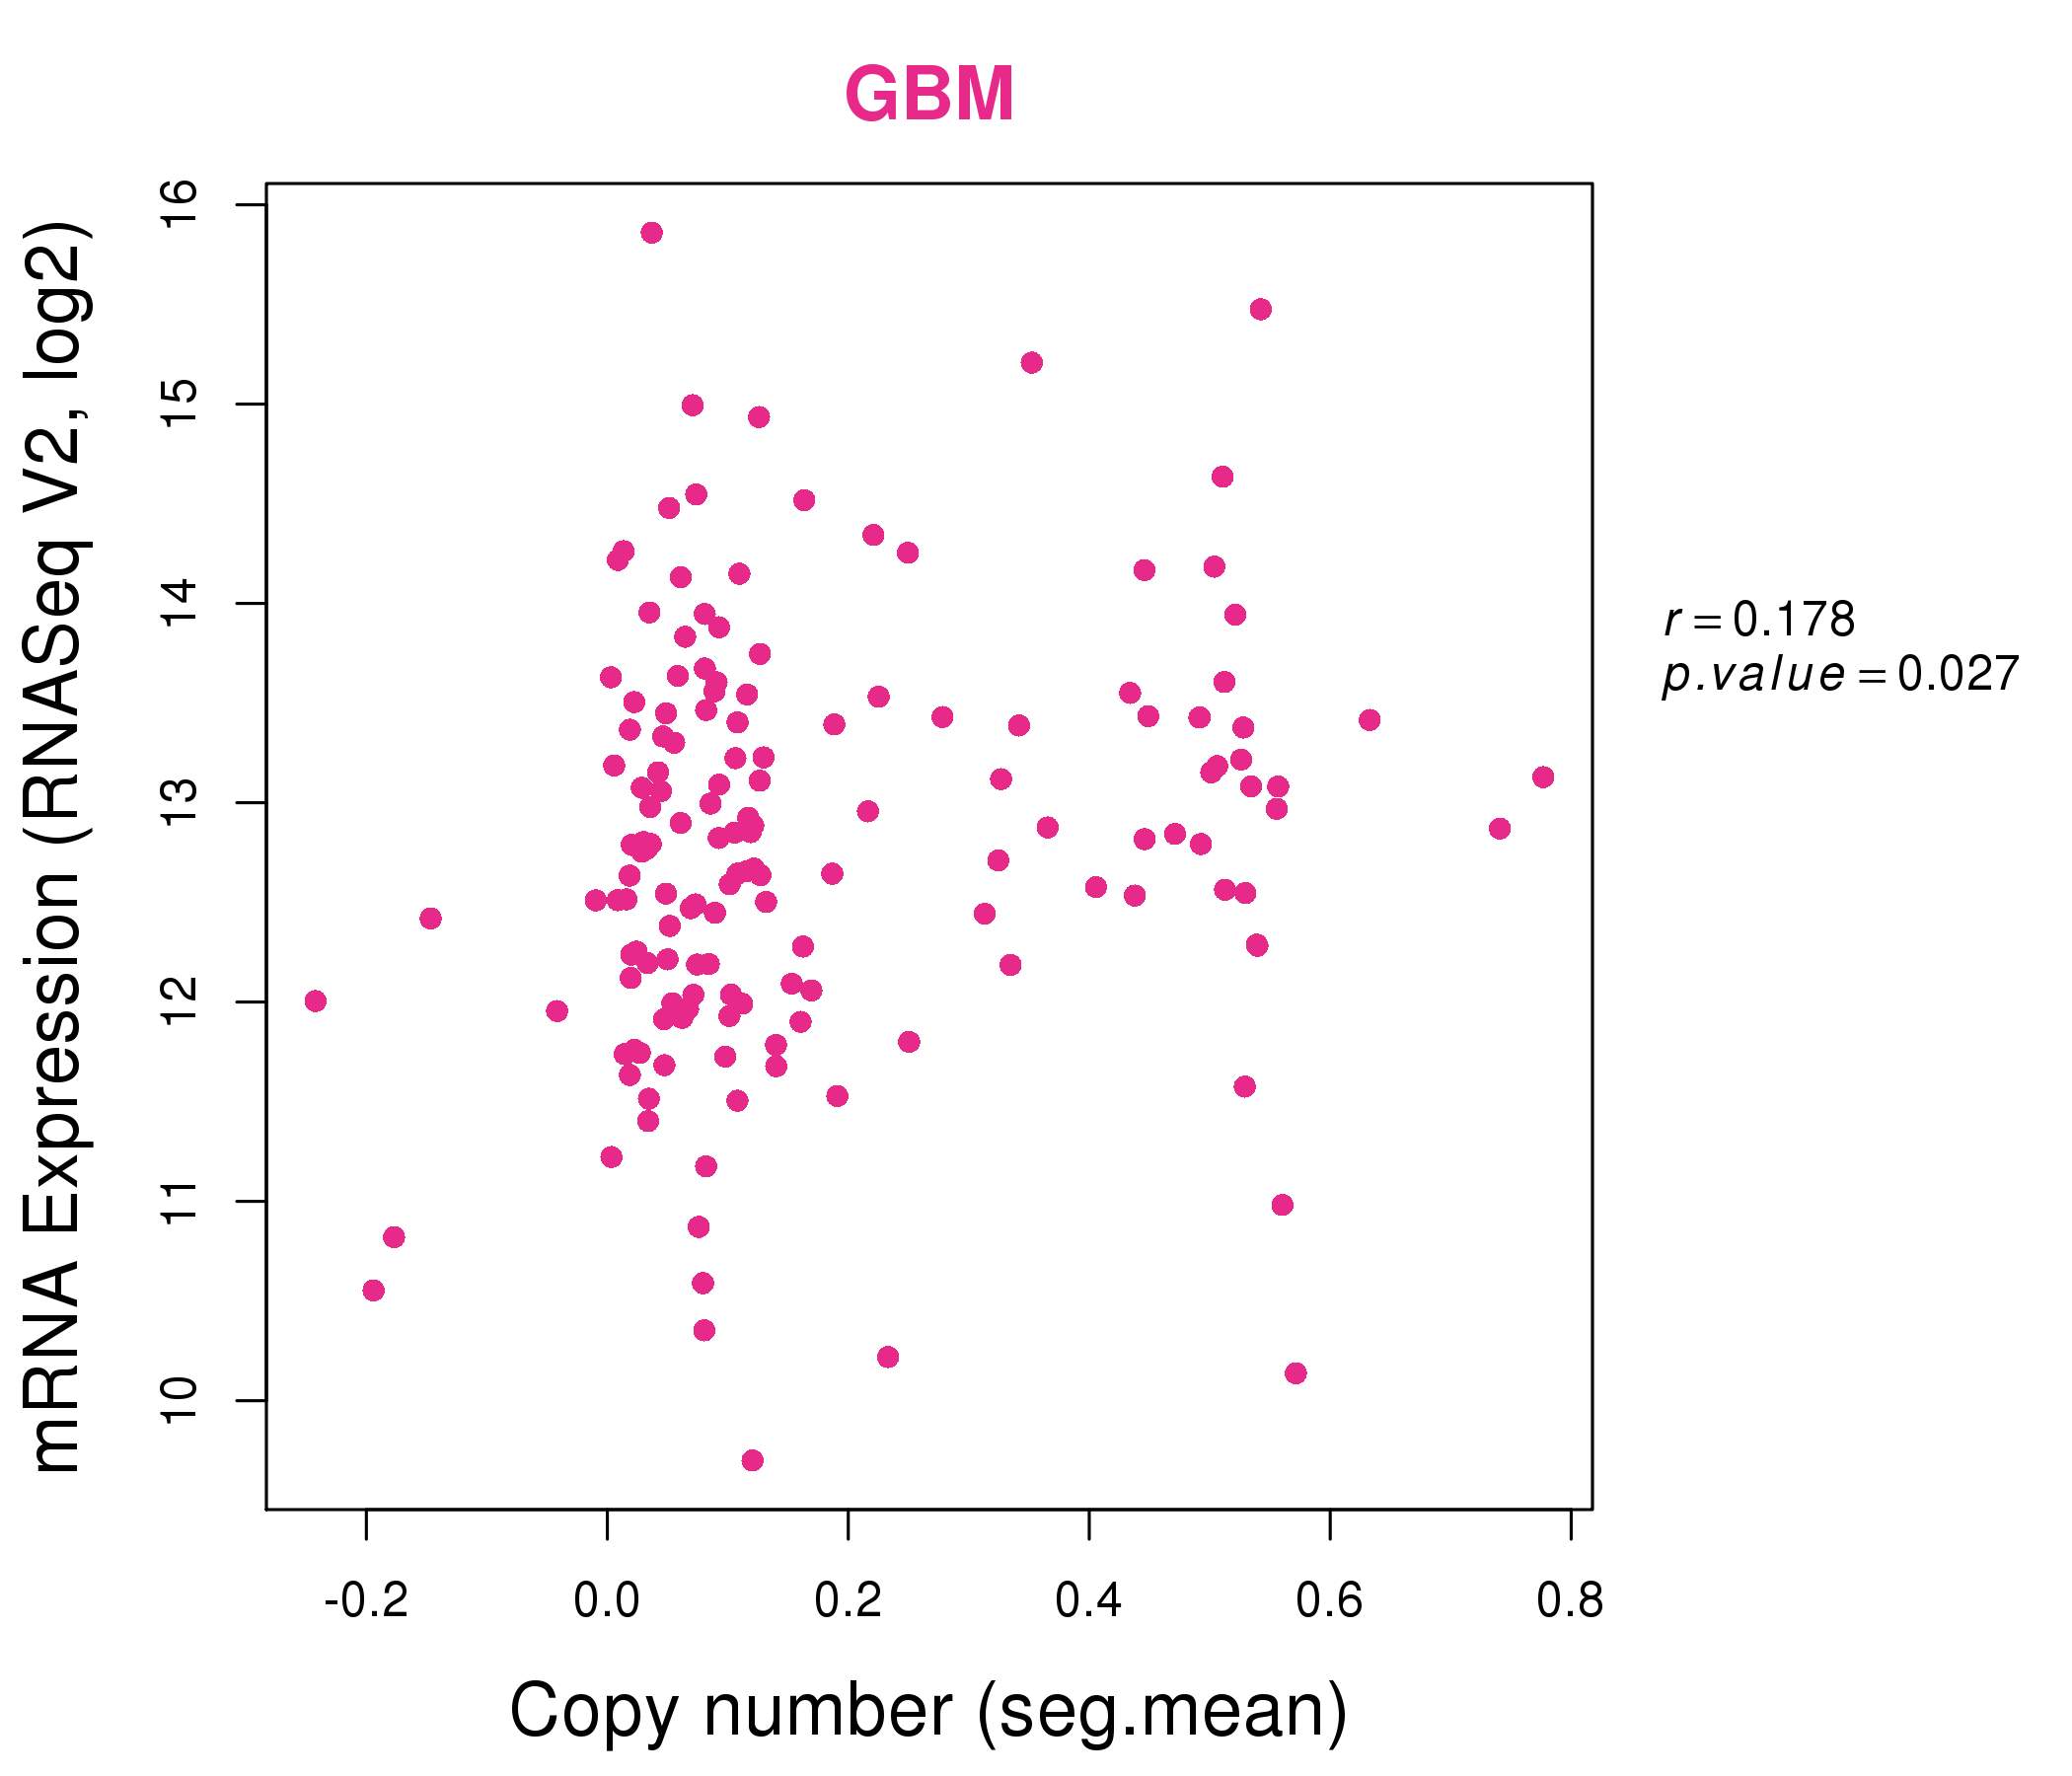
| * This plots show the correlation between CNV and gene expression. |
: Open all plots for all cancer types
 |
|
 |
|
| Top |
| Gene-Gene Network Information |
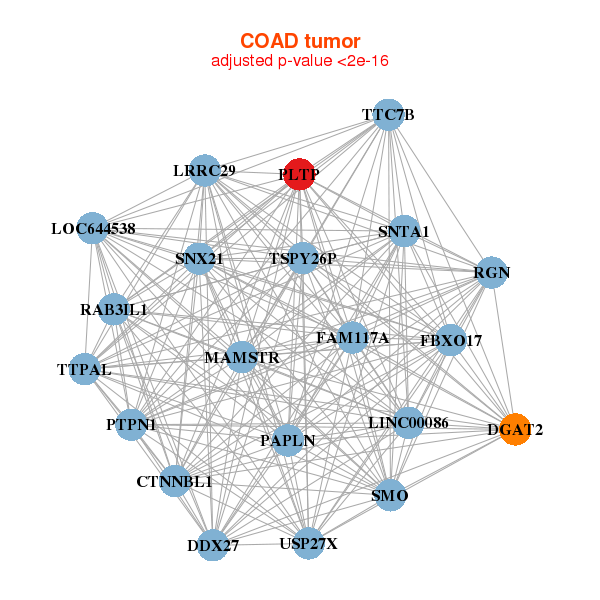
| * Co-Expression network figures were drawn using R package igraph. Only the top 20 genes with the highest correlations were shown. Red circle: input gene, orange circle: cell metabolism gene, sky circle: other gene |
: Open all plots for all cancer types
 |
|
| MILR1,CD248,COL6A2,DAZL,DEFB124,FOLR2,GP9, LAMC3,LCE3C,LCE3D,LCNL1,MMP9,LINC00162,PCOLCE, PLTP,PTGDS,RCN3,SPON2,SPRR2G,STAB1,XPNPEP2 | C1QA,C1QB,C1QC,C2,CD14,CD163,CD209, CLEC10A,CRYBB1,CSF1R,FOLR2,LGMN,LILRB2,LILRB5, MCOLN1,PLTP,RASGRP4,RNASE1,SIGLEC1,STAB1,VSIG4 |
 |
|
| CTNNBL1,DDX27,DGAT2,FAM117A,FBXO17,LOC644538,LRRC29, MAMSTR,LINC00086,PAPLN,PLTP,PTPN1,RAB3IL1,RGN, SMO,SNTA1,SNX21,TSPY26P,TTC7B,TTPAL,USP27X | AQPEP,C4A,CHI3L1,CLDN11,CNBD1,CPXM1,DEFB124, DYDC1,FAM20A,GLYCAM1,GREM1,LIM2,LOC55908,MARCO, OR3A4P,PLTP,REG1A,REG1B,RNASE2,SCN1B,SNORA22, |
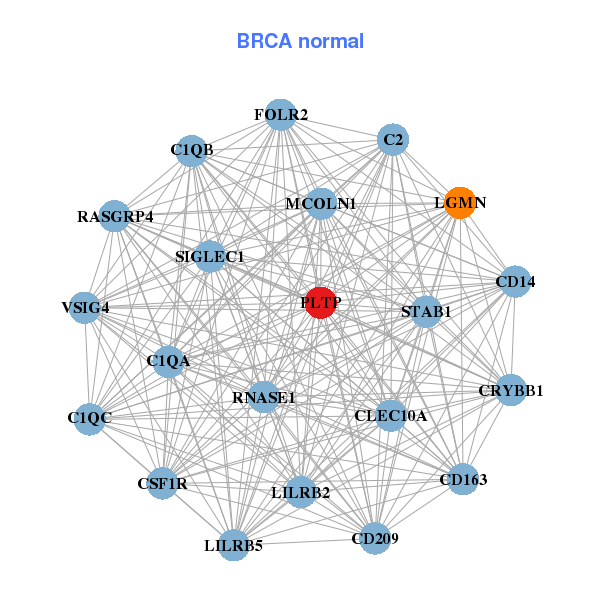
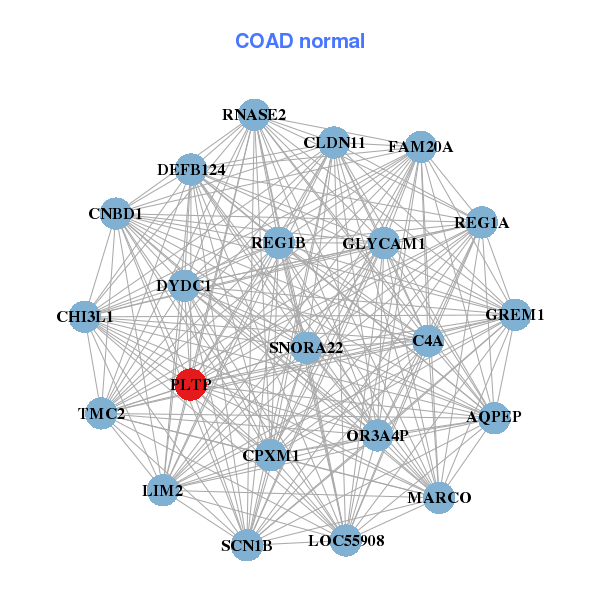
| * Co-Expression network figures were drawn using R package igraph. Only the top 20 genes with the highest correlations were shown. Red circle: input gene, orange circle: cell metabolism gene, sky circle: other gene |
: Open all plots for all cancer types
| Top |
: Open all interacting genes' information including KEGG pathway for all interacting genes from DAVID
| Top |
| Pharmacological Information for PLTP |
| There's no related Drug. |
| Top |
| Cross referenced IDs for PLTP |
| * We obtained these cross-references from Uniprot database. It covers 150 different DBs, 18 categories. http://www.uniprot.org/help/cross_references_section |
: Open all cross reference information
|
Copyright © 2016-Present - The Univsersity of Texas Health Science Center at Houston @ |