|
||||||||||||||||||||||||||||||||||||||||||||||||||||||||||||||||||||||||||||||||||||||||||||||||||||||||||||||||||||||||||||||||||||||||||||||||||||||||||||||||||||||||||||||||||||||||||||||||||||||||||||||||||||||||||||||||||||||||||||||||||||||||||||||||||||||||||||||||||||||||||||||||||||||||||||||||||||||||||
| |
| Phenotypic Information (metabolism pathway, cancer, disease, phenome) |
| |
| |
| Gene-Gene Network Information: Co-Expression Network, Interacting Genes & KEGG |
| |
|


| Gene Summary for ACP5 |
| Top |
| Phenotypic Information for ACP5(metabolism pathway, cancer, disease, phenome) |
| Cancer | CGAP: ACP5 |
| Familial Cancer Database: ACP5 | |
| * This gene is included in those cancer gene databases. |
|
|
|
|
|
| . | ||||||||||||||||||||||||||||||||||||||||||||||||||||||||||||||||||||||||||||||||||||||||||||||||||||||||||||||||||||||||||||||||||||||||||||||||||||||||||||||||||||||||||||||||||||||||||||||||||||||||||||||||||||||||||||||||||||||||||||||||||||||||||||||||||||||||||||||||||||||||||||||||||||||||||||||||||||
Oncogene 1 | Significant driver gene in | |||||||||||||||||||||||||||||||||||||||||||||||||||||||||||||||||||||||||||||||||||||||||||||||||||||||||||||||||||||||||||||||||||||||||||||||||||||||||||||||||||||||||||||||||||||||||||||||||||||||||||||||||||||||||||||||||||||||||||||||||||||||||||||||||||||||||||||||||||||||||||||||||||||||||||||||||||||||||
| cf) number; DB name 1 Oncogene; http://nar.oxfordjournals.org/content/35/suppl_1/D721.long, 2 Tumor Suppressor gene; https://bioinfo.uth.edu/TSGene/, 3 Cancer Gene Census; http://www.nature.com/nrc/journal/v4/n3/abs/nrc1299.html, 4 CancerGenes; http://nar.oxfordjournals.org/content/35/suppl_1/D721.long, 5 Network of Cancer Gene; http://ncg.kcl.ac.uk/index.php, 1Therapeutic Vulnerabilities in Cancer; http://cbio.mskcc.org/cancergenomics/statius/ |
| KEGG_RIBOFLAVIN_METABOLISM REACTOME_METABOLISM_OF_VITAMINS_AND_COFACTORS | |
| OMIM | |
| Orphanet | |
| Disease | KEGG Disease: ACP5 |
| MedGen: ACP5 (Human Medical Genetics with Condition) | |
| ClinVar: ACP5 | |
| Phenotype | MGI: ACP5 (International Mouse Phenotyping Consortium) |
| PhenomicDB: ACP5 | |
| Mutations for ACP5 |
| * Under tables are showing count per each tissue to give us broad intuition about tissue specific mutation patterns.You can go to the detailed page for each mutation database's web site. |
| There's no structural variation information in COSMIC data for this gene. |
| * From mRNA Sanger sequences, Chitars2.0 arranged chimeric transcripts. This table shows ACP5 related fusion information. |
| ID | Head Gene | Tail Gene | Accession | Gene_a | qStart_a | qEnd_a | Chromosome_a | tStart_a | tEnd_a | Gene_a | qStart_a | qEnd_a | Chromosome_a | tStart_a | tEnd_a |
| AW608479 | PSAP | 1 | 206 | 10 | 73587814 | 73588741 | ACP5 | 196 | 544 | 19 | 11687572 | 11688133 | |
| AW608472 | ACP5 | 1 | 347 | 19 | 11687572 | 11688133 | PSAP | 337 | 592 | 10 | 73587814 | 73588789 | |
| Top |
| Mutation type/ Tissue ID | brca | cns | cerv | endome | haematopo | kidn | Lintest | liver | lung | ns | ovary | pancre | prost | skin | stoma | thyro | urina | |||
| Total # sample | 1 | |||||||||||||||||||
| GAIN (# sample) | 1 | |||||||||||||||||||
| LOSS (# sample) |
| cf) Tissue ID; Tissue type (1; Breast, 2; Central_nervous_system, 3; Cervix, 4; Endometrium, 5; Haematopoietic_and_lymphoid_tissue, 6; Kidney, 7; Large_intestine, 8; Liver, 9; Lung, 10; NS, 11; Ovary, 12; Pancreas, 13; Prostate, 14; Skin, 15; Stomach, 16; Thyroid, 17; Urinary_tract) |
| Top |
|
 |
| Top |
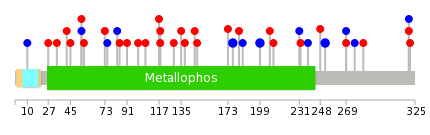
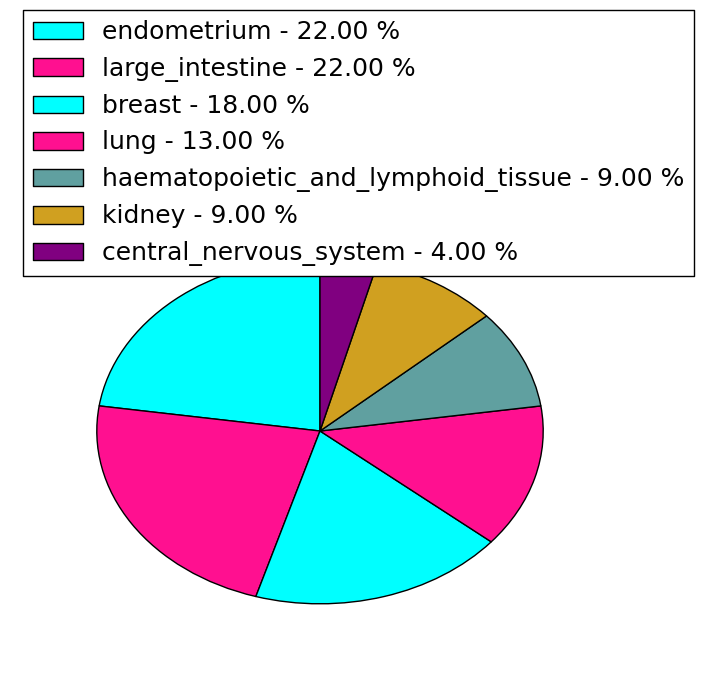
| Stat. for Non-Synonymous SNVs (# total SNVs=22) | (# total SNVs=10) |
 | 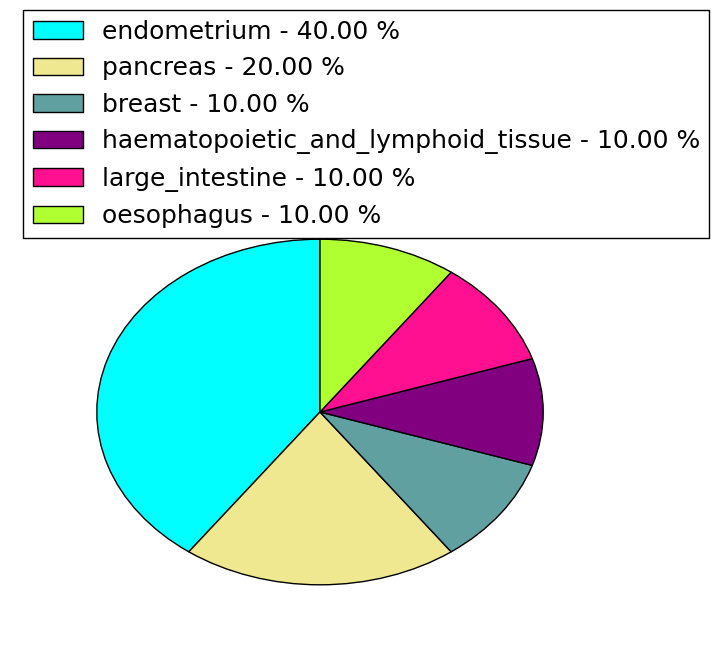 |
(# total SNVs=0) | (# total SNVs=0) |
| Top |
| * When you move the cursor on each content, you can see more deailed mutation information on the Tooltip. Those are primary_site,primary_histology,mutation(aa),pubmedID. |
| GRCh37 position | Mutation(aa) | Unique sampleID count |
| chr19:11687196-11687196 | p.Y199Y | 2 |
| chr19:11687262-11687262 | p.D177D | 2 |
| chr19:11686047-11686047 | p.G252G | 2 |
| chr19:11687649-11687649 | p.E91Q | 2 |
| chr19:11685843-11685843 | p.P320P | 1 |
| chr19:11687908-11687908 | p.F75F | 1 |
| chr19:11687164-11687164 | p.S210F | 1 |
| chr19:11687390-11687390 | p.P135S | 1 |
| chr19:11685844-11685844 | p.P320L | 1 |
| chr19:11687914-11687914 | p.F73L | 1 |
| Top |
|
 |
| Point Mutation/ Tissue ID | 1 | 2 | 3 | 4 | 5 | 6 | 7 | 8 | 9 | 10 | 11 | 12 | 13 | 14 | 15 | 16 | 17 | 18 | 19 | 20 |
| # sample | 3 | 3 | 1 | 3 | 2 | 2 | 2 | 2 | 5 | 7 | ||||||||||
| # mutation | 3 | 3 | 1 | 3 | 2 | 2 | 2 | 3 | 5 | 9 | ||||||||||
| nonsynonymous SNV | 3 | 2 | 1 | 3 | 2 | 2 | 2 | 3 | 3 | 5 | ||||||||||
| synonymous SNV | 1 | 2 | 4 |
| cf) Tissue ID; Tissue type (1; BLCA[Bladder Urothelial Carcinoma], 2; BRCA[Breast invasive carcinoma], 3; CESC[Cervical squamous cell carcinoma and endocervical adenocarcinoma], 4; COAD[Colon adenocarcinoma], 5; GBM[Glioblastoma multiforme], 6; Glioma Low Grade, 7; HNSC[Head and Neck squamous cell carcinoma], 8; KICH[Kidney Chromophobe], 9; KIRC[Kidney renal clear cell carcinoma], 10; KIRP[Kidney renal papillary cell carcinoma], 11; LAML[Acute Myeloid Leukemia], 12; LUAD[Lung adenocarcinoma], 13; LUSC[Lung squamous cell carcinoma], 14; OV[Ovarian serous cystadenocarcinoma ], 15; PAAD[Pancreatic adenocarcinoma], 16; PRAD[Prostate adenocarcinoma], 17; SKCM[Skin Cutaneous Melanoma], 18:STAD[Stomach adenocarcinoma], 19:THCA[Thyroid carcinoma], 20:UCEC[Uterine Corpus Endometrial Carcinoma]) |
| Top |
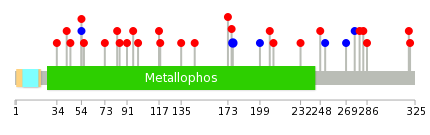
| * We represented just top 10 SNVs. When you move the cursor on each content, you can see more deailed mutation information on the Tooltip. Those are primary_site, primary_histology, mutation(aa), pubmedID. |
| Genomic Position | Mutation(aa) | Unique sampleID count |
| chr19:11687262 | p.D177D,ACP5 | 2 |
| chr19:11685844 | p.R280H,ACP5 | 1 |
| chr19:11687196 | p.R100C,ACP5 | 1 |
| chr19:11687879 | p.N276N,ACP5 | 1 |
| chr19:11685947 | p.D96H,ACP5 | 1 |
| chr19:11687884 | p.R269R,ACP5 | 1 |
| chr19:11685955 | p.E91Q,ACP5 | 1 |
| chr19:11687266 | p.G252G,ACP5 | 1 |
| chr19:11687914 | p.R85T,ACP5 | 1 |
| chr19:11685964 | p.Q248E,ACP5 | 1 |
| * Copy number data were extracted from TCGA using R package TCGA-Assembler. The URLs of all public data files on TCGA DCC data server were gathered on Jan-05-2015. Function ProcessCNAData in TCGA-Assembler package was used to obtain gene-level copy number value which is calculated as the average copy number of the genomic region of a gene. |
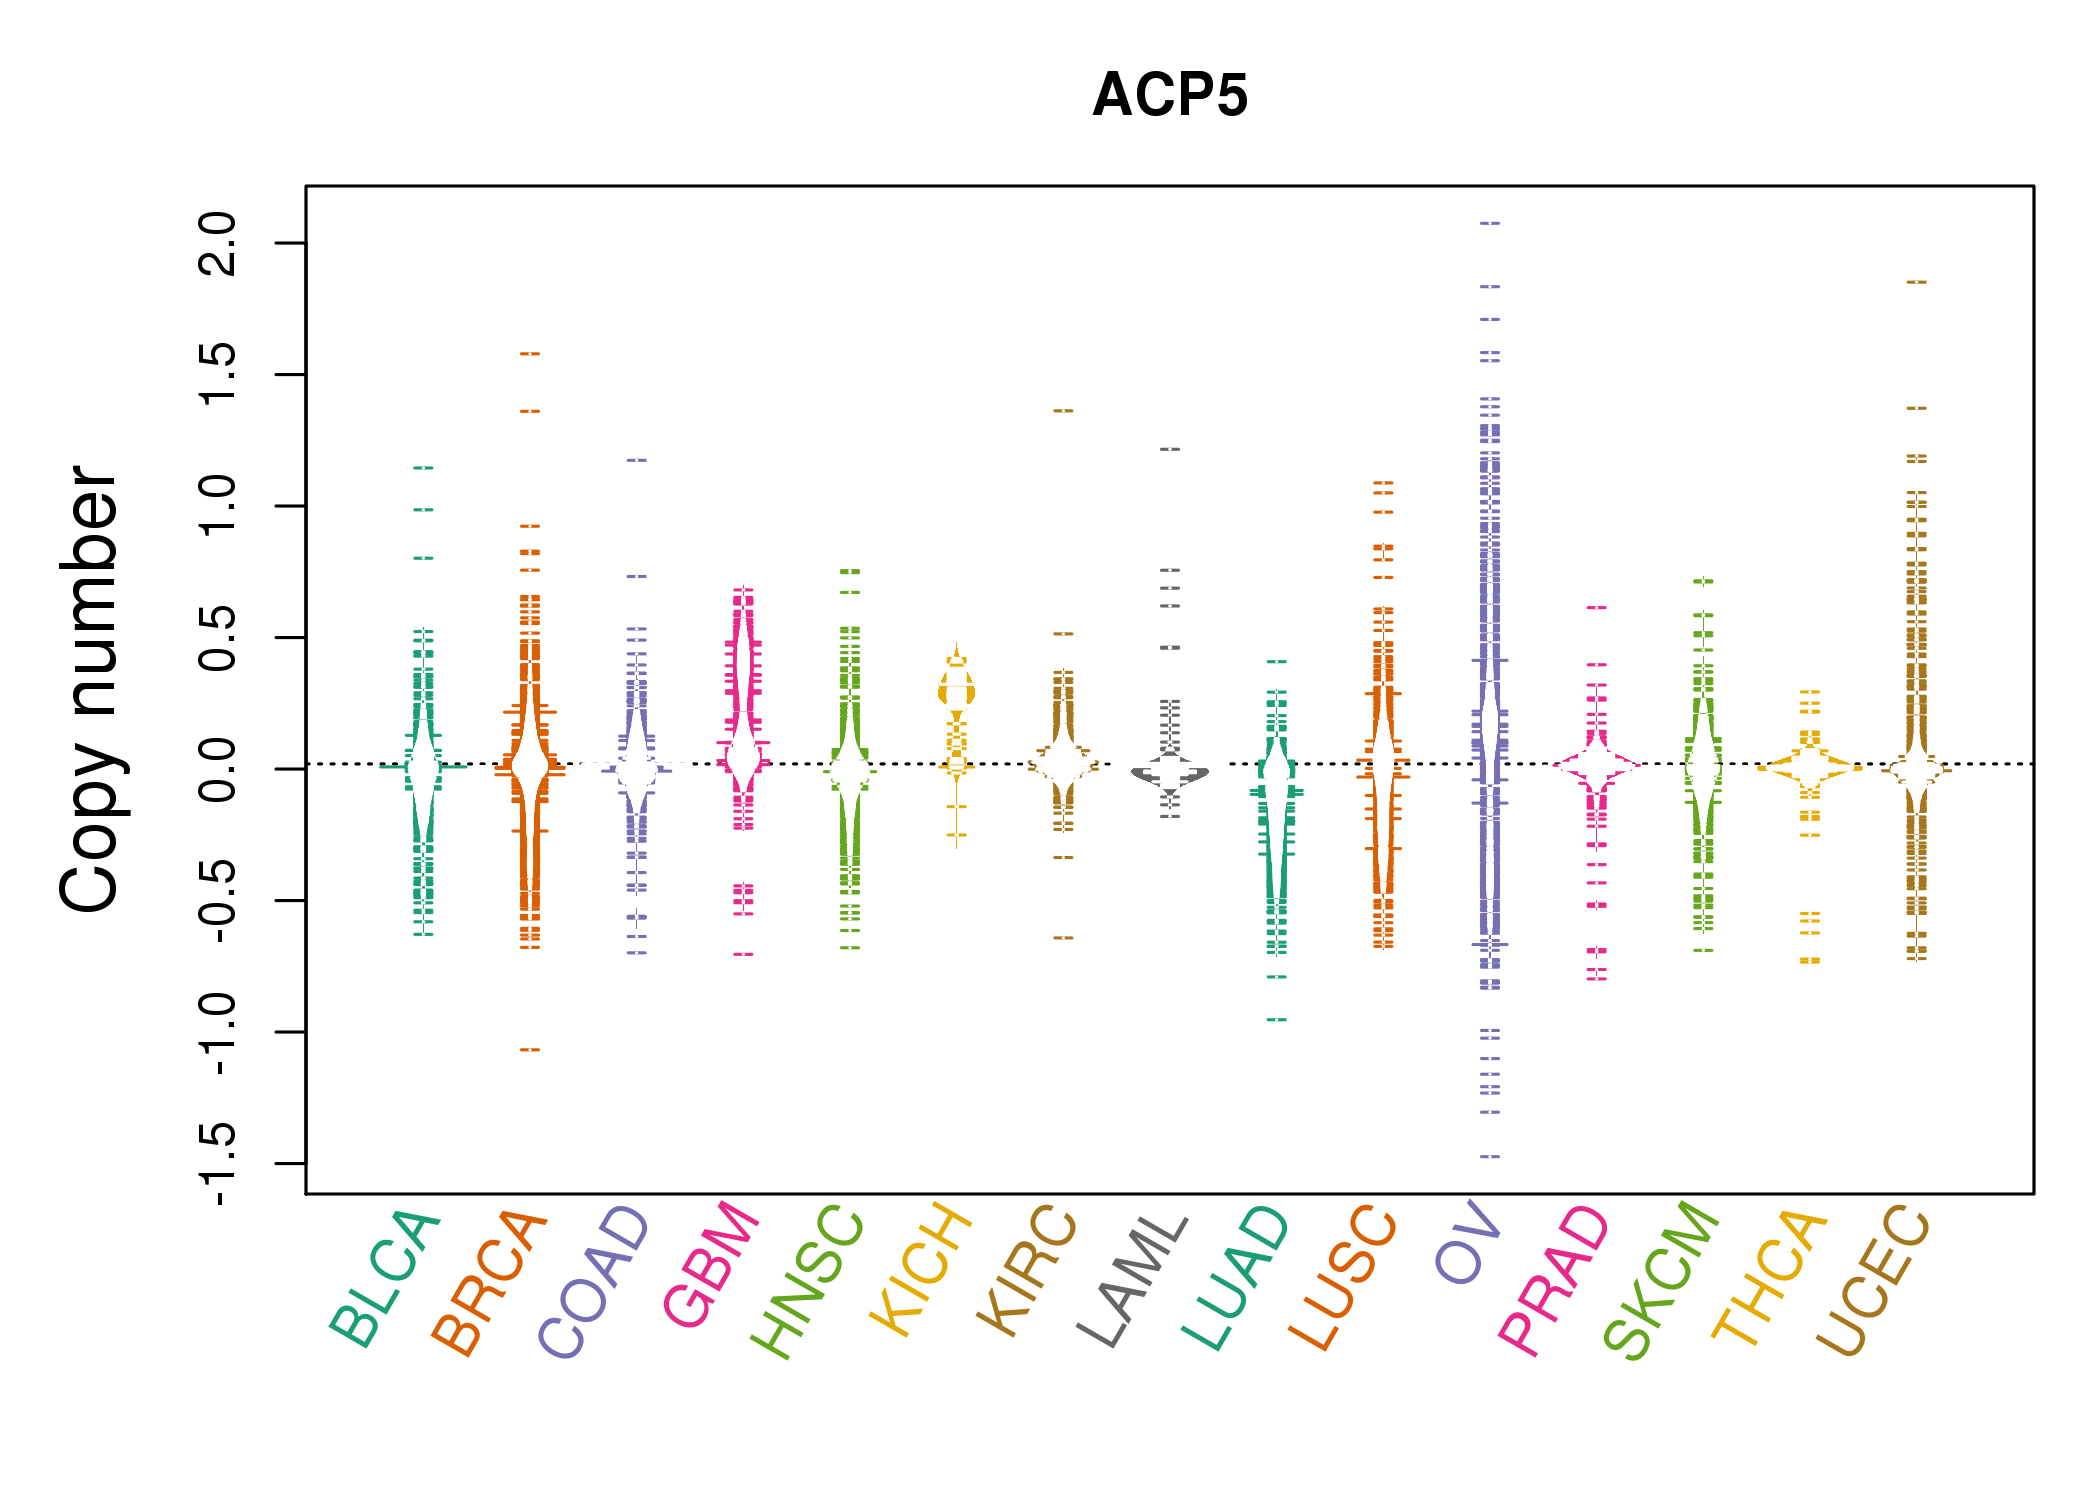 |
| cf) Tissue ID[Tissue type]: BLCA[Bladder Urothelial Carcinoma], BRCA[Breast invasive carcinoma], CESC[Cervical squamous cell carcinoma and endocervical adenocarcinoma], COAD[Colon adenocarcinoma], GBM[Glioblastoma multiforme], Glioma Low Grade, HNSC[Head and Neck squamous cell carcinoma], KICH[Kidney Chromophobe], KIRC[Kidney renal clear cell carcinoma], KIRP[Kidney renal papillary cell carcinoma], LAML[Acute Myeloid Leukemia], LUAD[Lung adenocarcinoma], LUSC[Lung squamous cell carcinoma], OV[Ovarian serous cystadenocarcinoma ], PAAD[Pancreatic adenocarcinoma], PRAD[Prostate adenocarcinoma], SKCM[Skin Cutaneous Melanoma], STAD[Stomach adenocarcinoma], THCA[Thyroid carcinoma], UCEC[Uterine Corpus Endometrial Carcinoma] |
| Top |
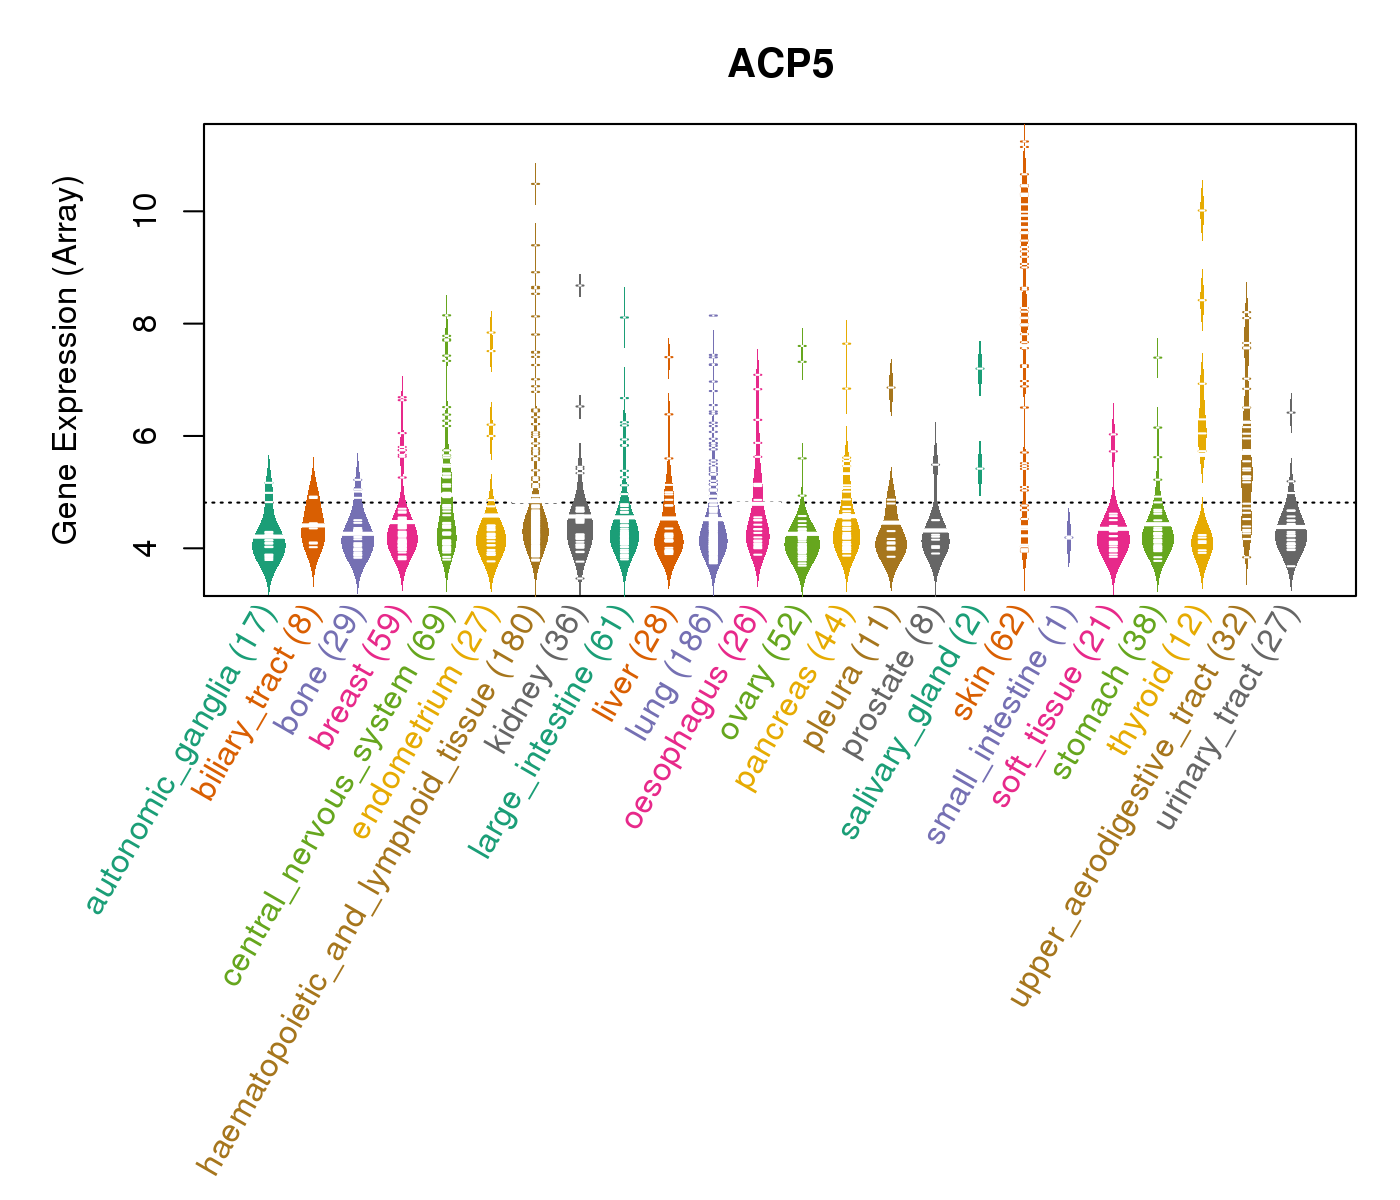
| Gene Expression for ACP5 |
| * CCLE gene expression data were extracted from CCLE_Expression_Entrez_2012-10-18.res: Gene-centric RMA-normalized mRNA expression data. |
 |
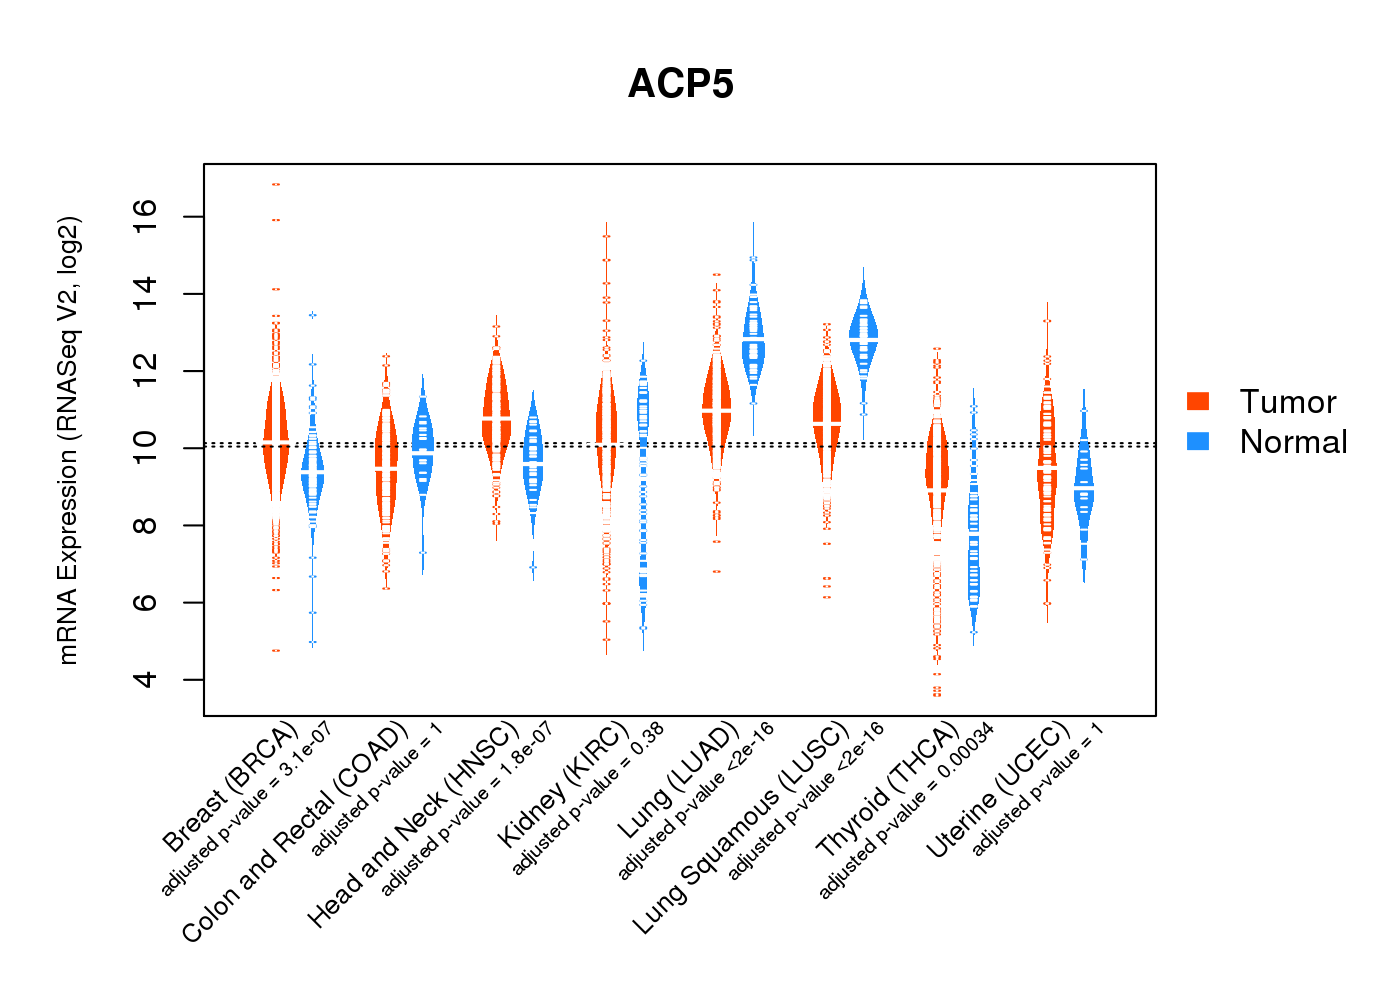
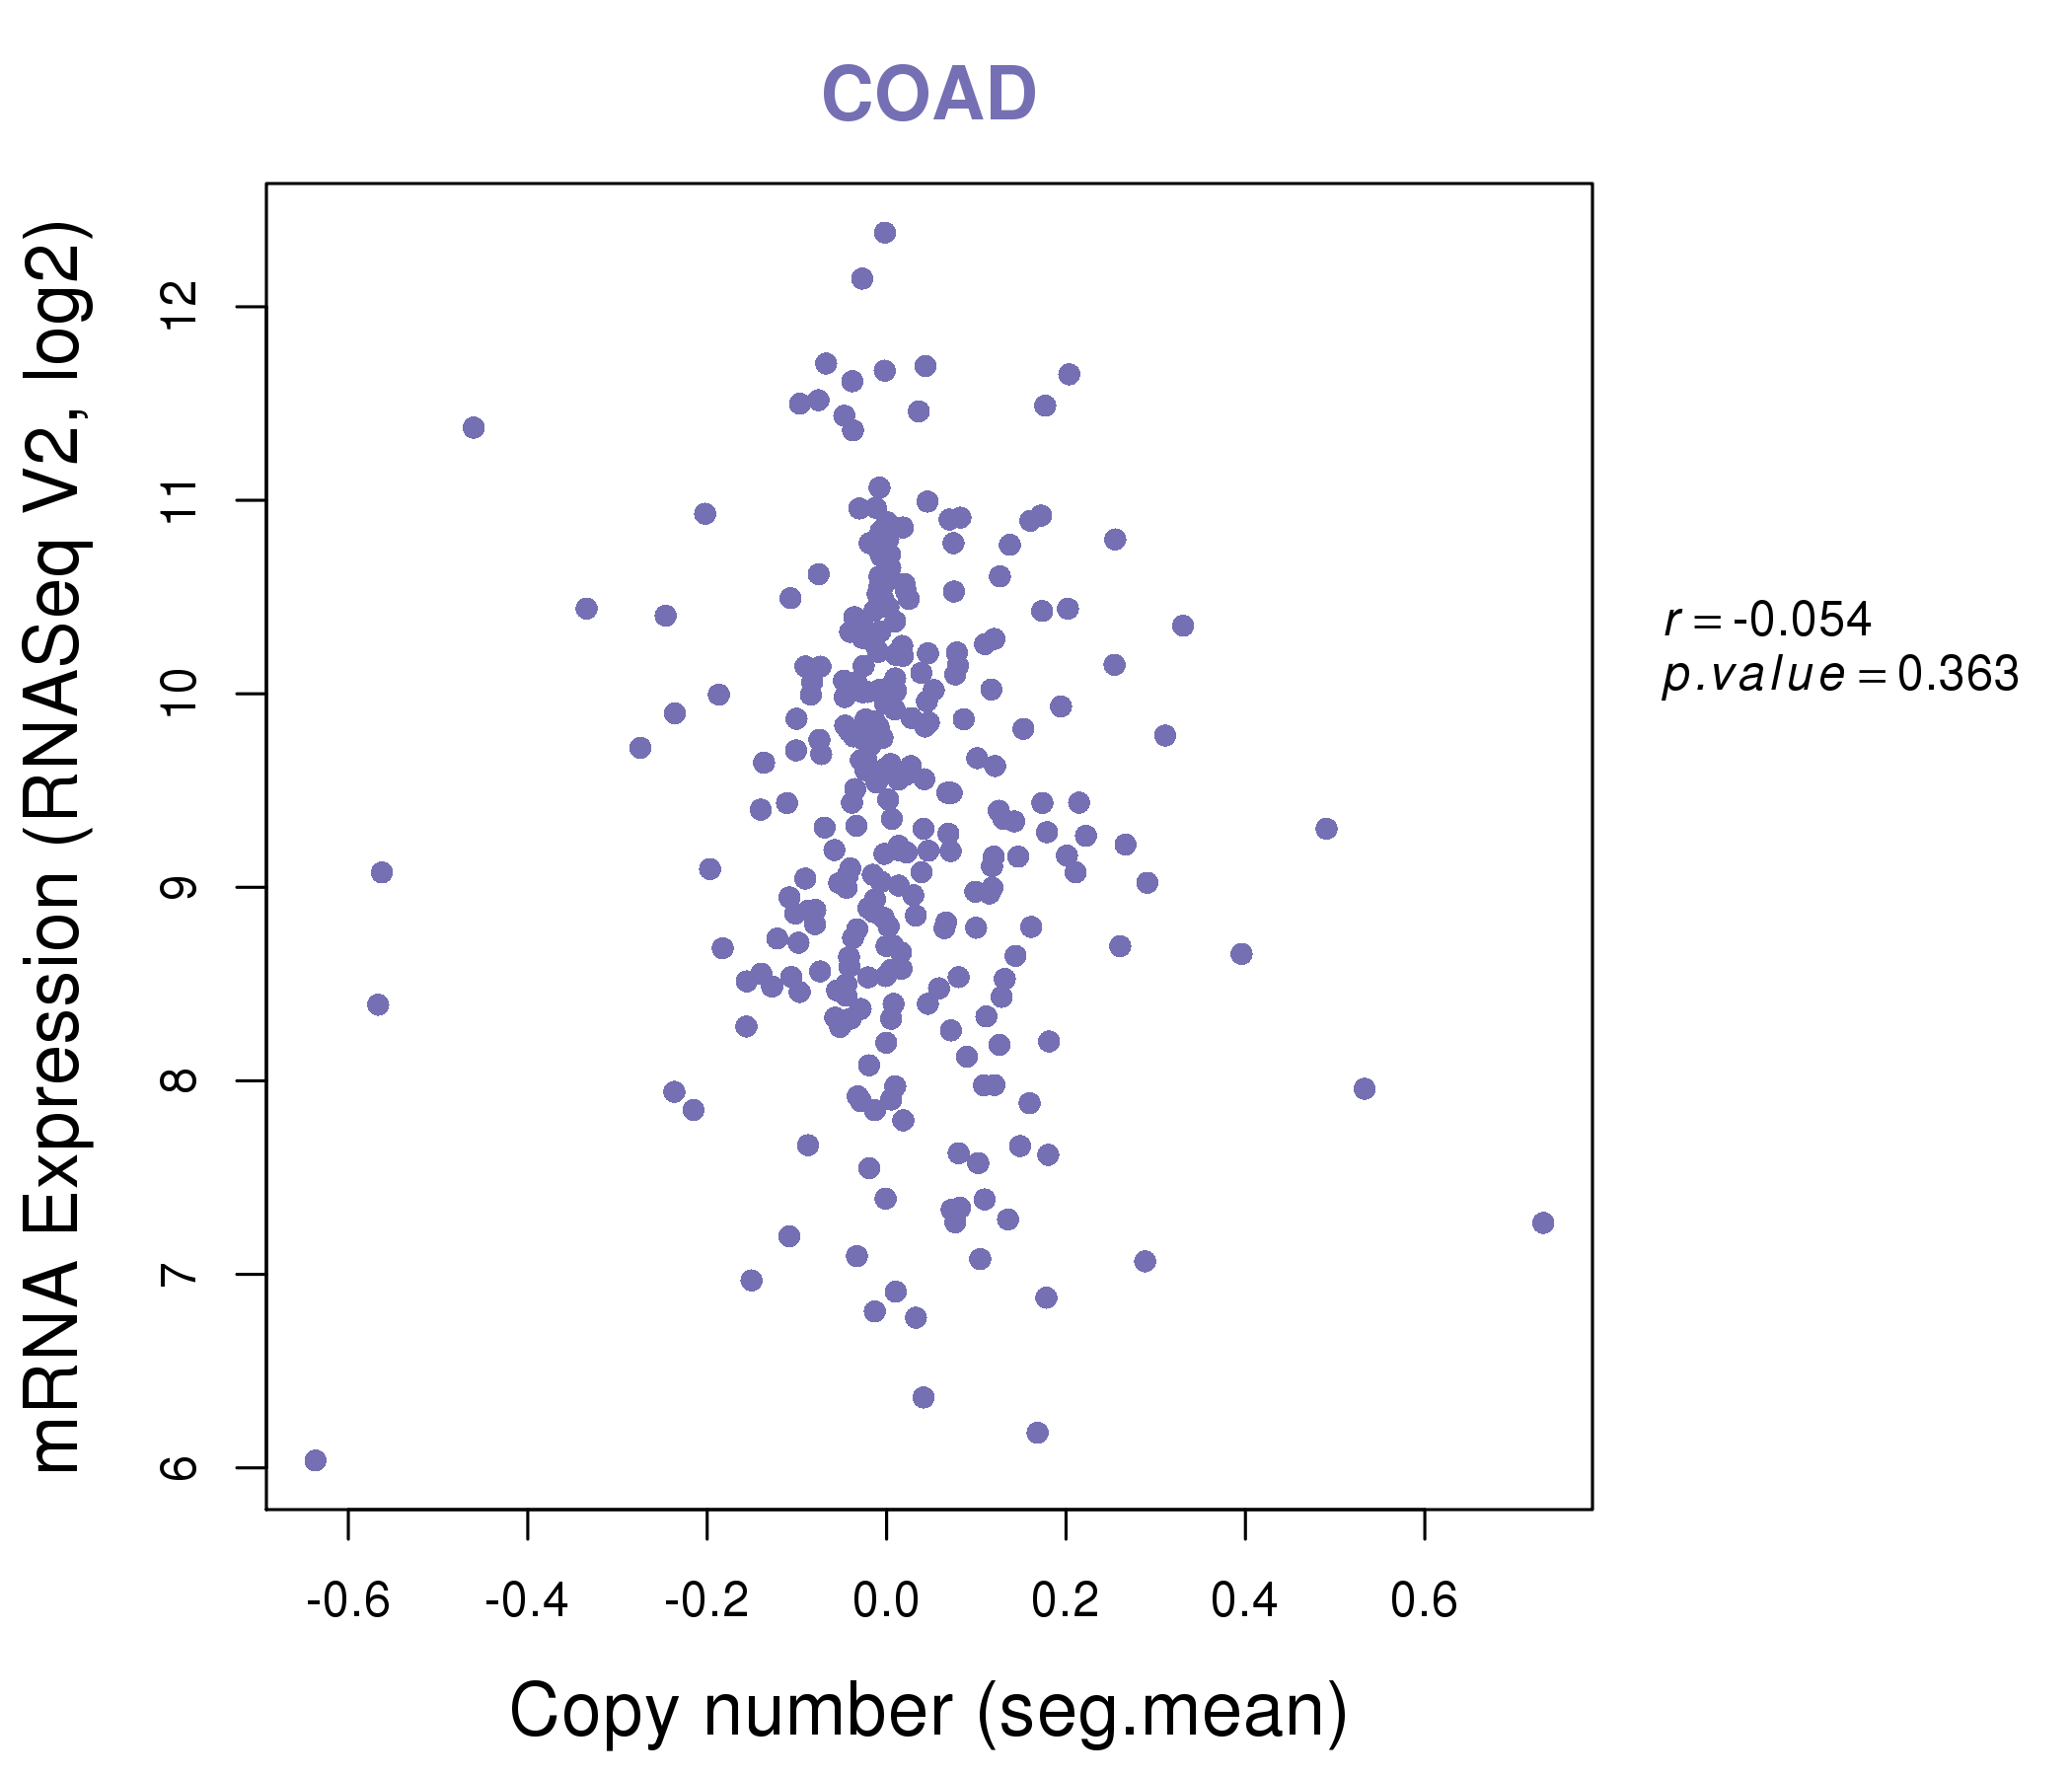
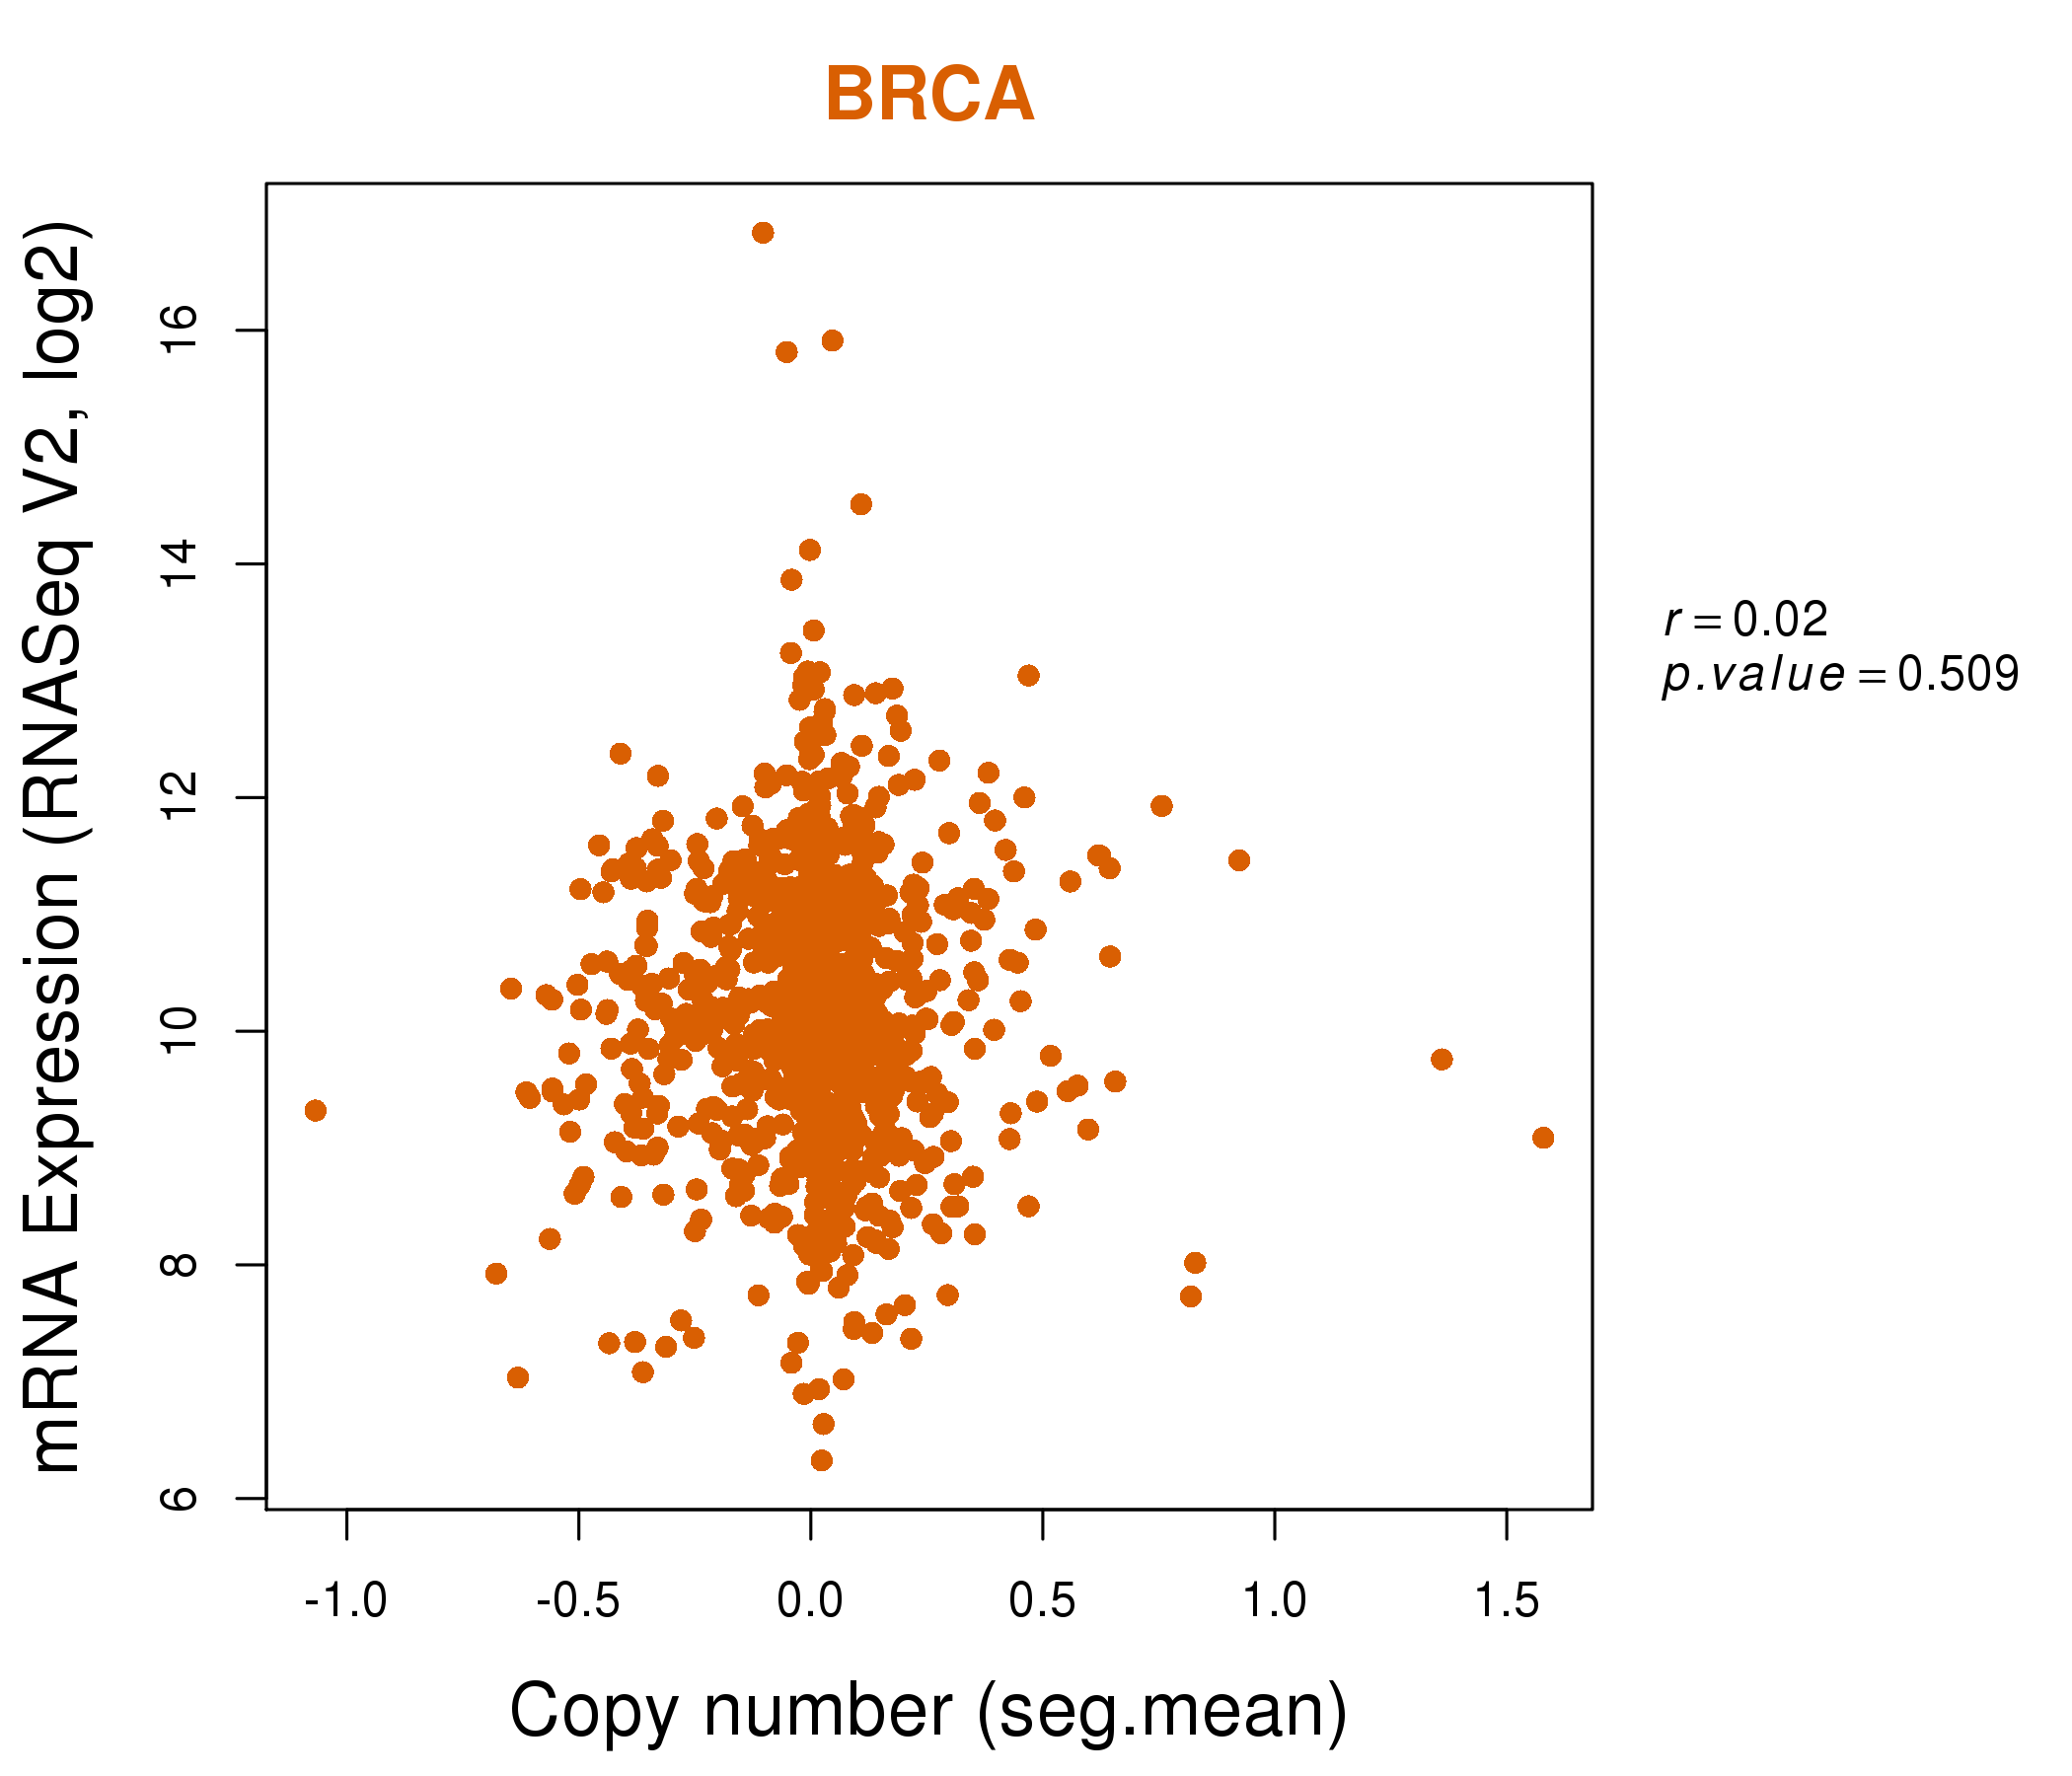
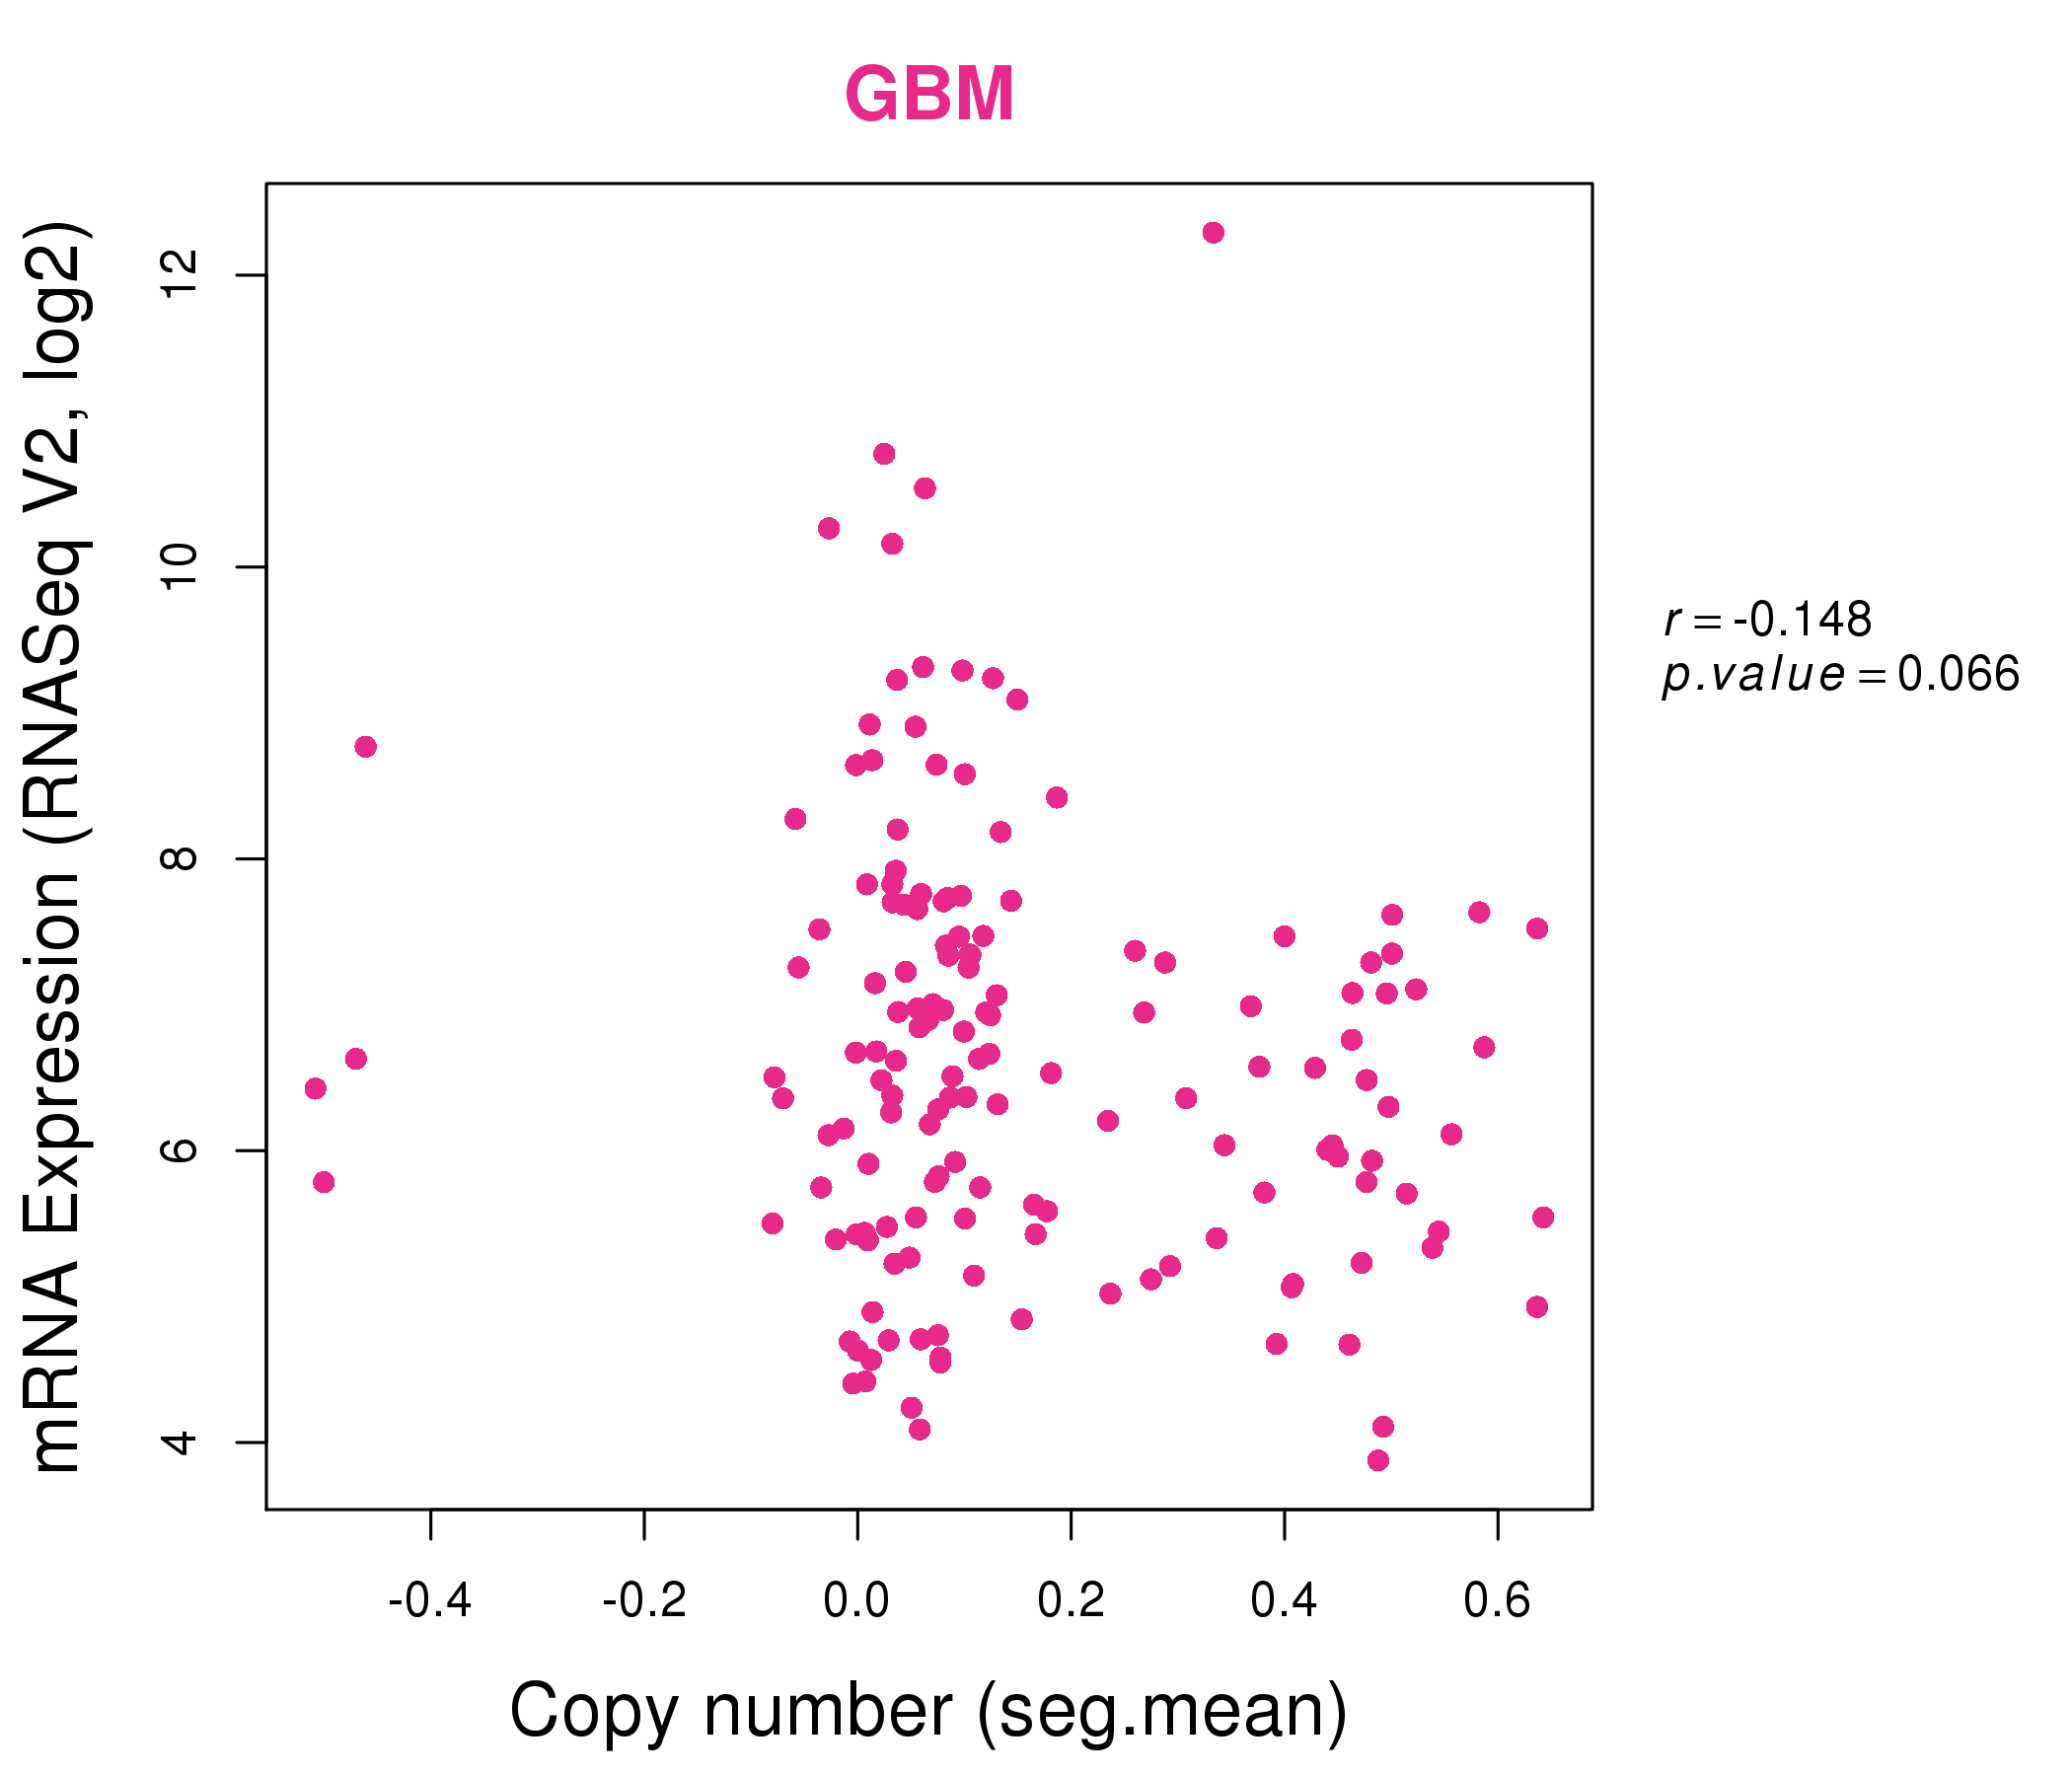
| * Normalized gene expression data of RNASeqV2 was extracted from TCGA using R package TCGA-Assembler. The URLs of all public data files on TCGA DCC data server were gathered at Jan-05-2015. Only eight cancer types have enough normal control samples for differential expression analysis. (t test, adjusted p<0.05 (using Benjamini-Hochberg FDR)) |
 |
| Top |
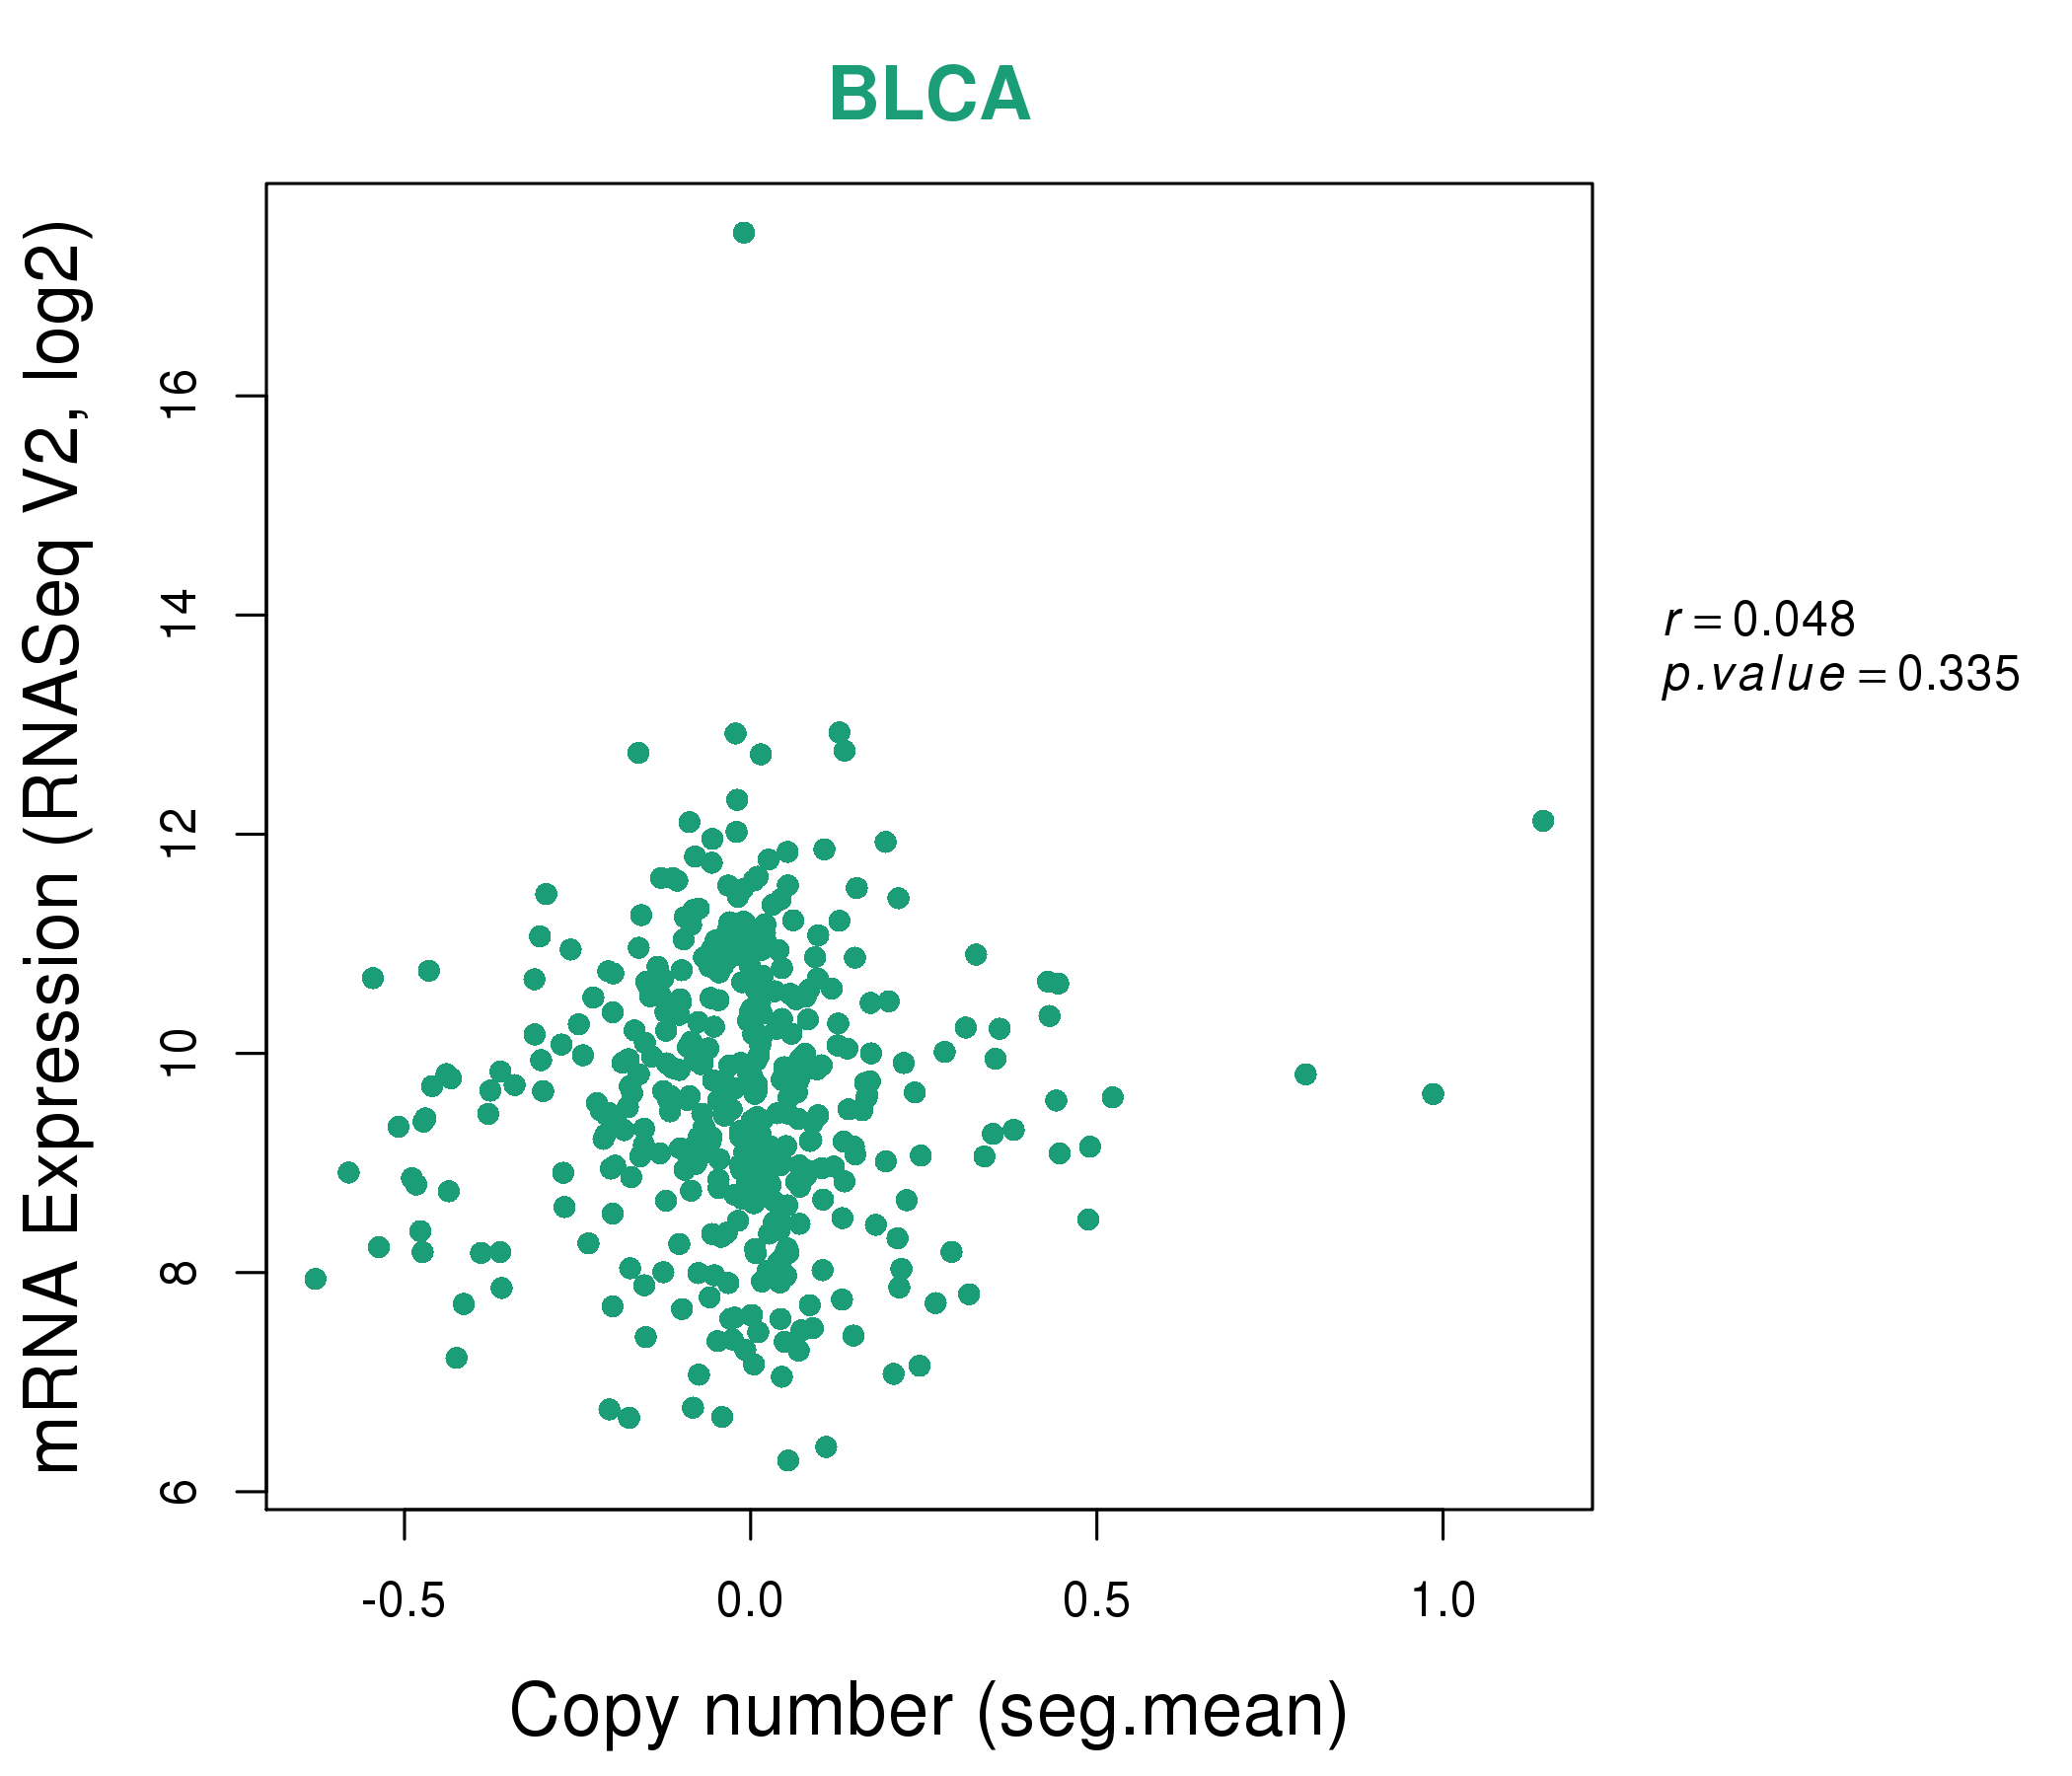
| * This plots show the correlation between CNV and gene expression. |
: Open all plots for all cancer types
 |
|
 |
|
| Top |
| Gene-Gene Network Information |
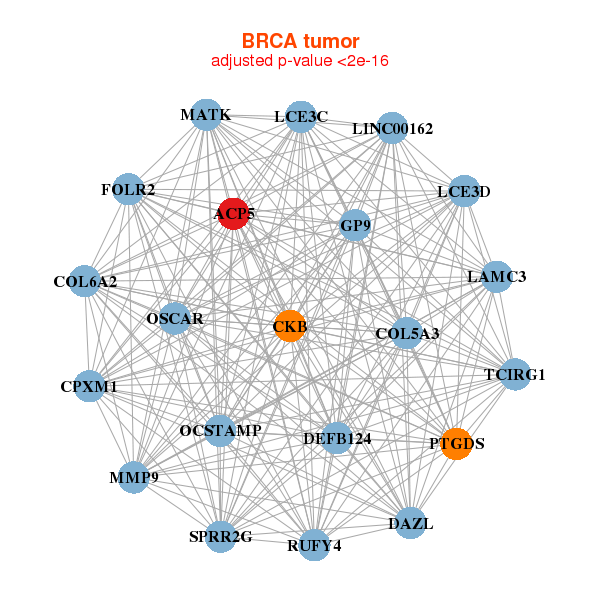
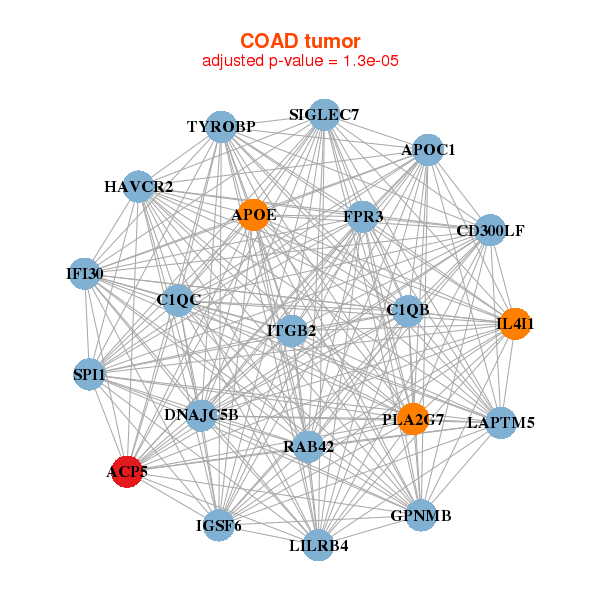
| * Co-Expression network figures were drawn using R package igraph. Only the top 20 genes with the highest correlations were shown. Red circle: input gene, orange circle: cell metabolism gene, sky circle: other gene |
: Open all plots for all cancer types
 |
|
| ACP5,OCSTAMP,CKB,COL5A3,COL6A2,CPXM1,DAZL, DEFB124,FOLR2,GP9,LAMC3,LCE3C,LCE3D,MATK, MMP9,LINC00162,OSCAR,PTGDS,RUFY4,SPRR2G,TCIRG1 | ACP5,CD300LB,CD52,CTSD,HCST,HK3,IFI30, ITGAX,ITGB2,LOC653786,OSCAR,OTOA,PILRA,PLA2G7, PTCRA,SIGLEC7,SLAMF9,SPOCD1,TM4SF19,DCSTAMP,TREM2 |
 |
|
| ACP5,APOC1,APOE,C1QB,C1QC,CD300LF,DNAJC5B, FPR3,GPNMB,HAVCR2,IFI30,IGSF6,IL4I1,ITGB2, LAPTM5,LILRB4,PLA2G7,RAB42,SIGLEC7,SPI1,TYROBP | ABI3,ACP5,AMICA1,AOAH,BHLHA15,CARD9,CSF2RA, DNASE1L3,EDEM2,FPR3,HERPUD1,IGSF6,KCNK13,MEI1, MPEG1,NCF4,PLA2G7,SIGLEC7,SLAMF7,SSR4,TRPM2 |
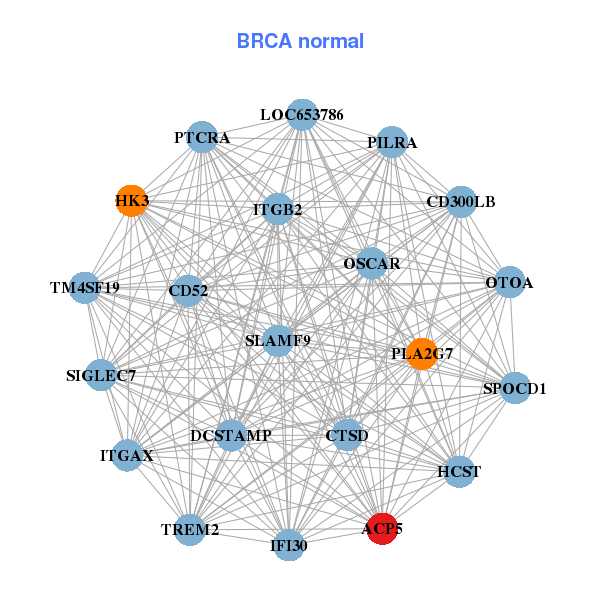
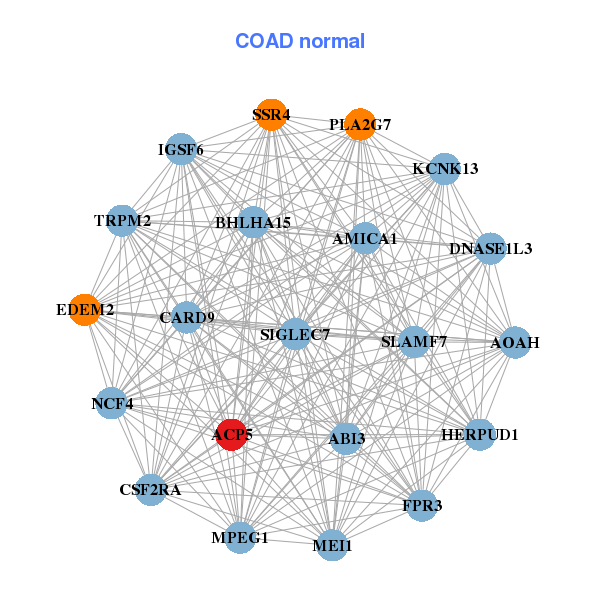
| * Co-Expression network figures were drawn using R package igraph. Only the top 20 genes with the highest correlations were shown. Red circle: input gene, orange circle: cell metabolism gene, sky circle: other gene |
: Open all plots for all cancer types
| Top |
: Open all interacting genes' information including KEGG pathway for all interacting genes from DAVID
| Top |
| Pharmacological Information for ACP5 |
| There's no related Drug. |
| Top |
| Cross referenced IDs for ACP5 |
| * We obtained these cross-references from Uniprot database. It covers 150 different DBs, 18 categories. http://www.uniprot.org/help/cross_references_section |
: Open all cross reference information
|
Copyright © 2016-Present - The Univsersity of Texas Health Science Center at Houston @ |