|
|||||||||||||||||||||||||||||||||||||||||||||||||||||||||||||||||||||||||||||||||||||||||||||||||||||||||||||||||||||||||||||||||||||||||||||||||||||||||||||||||||||||||||||||||||||||||||||||||||||||||||||||||||||||||||||||||||||||||||||||||||||||||||||||||||||||||||||||||||||||||||||||||||||||||||||||||||||||||||||||||||||||||||||||||||||||||||||||||||||
| |
| Phenotypic Information (metabolism pathway, cancer, disease, phenome) |
| |
| |
| Gene-Gene Network Information: Co-Expression Network, Interacting Genes & KEGG |
| |
|


| Gene Summary for AKR1B10 |
| Basic gene info. | Gene symbol | AKR1B10 |
| Gene name | aldo-keto reductase family 1, member B10 (aldose reductase) | |
| Synonyms | AKR1B11|AKR1B12|ALDRLn|ARL-1|ARL1|HIS|HSI | |
| Cytomap | UCSC genome browser: 7q33 | |
| Genomic location | chr7 :134212343-134226166 | |
| Type of gene | protein-coding | |
| RefGenes | NM_020299.4, | |
| Ensembl id | ENSG00000198074 | |
| Description | ARPSI reductasealdo-keto reductase family 1 member B10aldo-keto reductase family 1, member B11 (aldose reductase-like)aldose reductase-like 1aldose reductase-like peptidealdose reductase-related proteinhARPsmall intestine reductase | |
| Modification date | 20141207 | |
| dbXrefs | MIM : 604707 | |
| HGNC : HGNC | ||
| Ensembl : ENSG00000198074 | ||
| HPRD : 05271 | ||
| Vega : OTTHUMG00000155356 | ||
| Protein | UniProt: O60218 go to UniProt's Cross Reference DB Table | |
| Expression | CleanEX: HS_AKR1B10 | |
| BioGPS: 57016 | ||
| Gene Expression Atlas: ENSG00000198074 | ||
| The Human Protein Atlas: ENSG00000198074 | ||
| Pathway | NCI Pathway Interaction Database: AKR1B10 | |
| KEGG: AKR1B10 | ||
| REACTOME: AKR1B10 | ||
| ConsensusPathDB | ||
| Pathway Commons: AKR1B10 | ||
| Metabolism | MetaCyc: AKR1B10 | |
| HUMANCyc: AKR1B10 | ||
| Regulation | Ensembl's Regulation: ENSG00000198074 | |
| miRBase: chr7 :134,212,343-134,226,166 | ||
| TargetScan: NM_020299 | ||
| cisRED: ENSG00000198074 | ||
| Context | iHOP: AKR1B10 | |
| cancer metabolism search in PubMed: AKR1B10 | ||
| UCL Cancer Institute: AKR1B10 | ||
| Assigned class in ccmGDB | A - This gene has a literature evidence and it belongs to cancer gene. | |
| References showing role of AKR1B10 in cancer cell metabolism | 1. Ruiz FX, Porte S, Pares X, Farres J (2012) Biological role of aldo-keto reductases in retinoic Acid biosynthesis and signaling. Front Pharmacol 3: 58. doi: 10.3389/fphar.2012.00058. pmid: 3328219. go to article 2. Balendiran GK, Martin HJ, El-Hawari Y, Maser E (2009) Cancer biomarker AKR1B10 and carbonyl metabolism. Chem Biol Interact 178: 134-137. doi: 10.1016/j.cbi.2008.10.044. go to article 3. Zhang W, Li H, Yang Y, Liao J, Yang GY (2014) Knockdown or inhibition of aldo-keto reductase 1B10 inhibits pancreatic carcinoma growth via modulating Kras-E-cadherin pathway. Cancer Lett 355: 273-280. doi: 10.1016/j.canlet.2014.09.031. pmid: 4462172. go to article 4. Nishinaka T, Miura T, Sakou M, Hidaka C, Sasaoka C, et al. (2015) Down-regulation of aldo-keto reductase AKR1B10 gene expression by a phorbol ester via the ERK/c-Jun signaling pathway. Chem Biol Interact 234: 274-281. doi: 10.1016/j.cbi.2014.11.013. go to article | |
| Top |
| Phenotypic Information for AKR1B10(metabolism pathway, cancer, disease, phenome) |
| Cancer | CGAP: AKR1B10 |
| Familial Cancer Database: AKR1B10 | |
| * This gene is included in those cancer gene databases. |
|
|
|
|
|
|
| |||||||||||||||||||||||||||||||||||||||||||||||||||||||||||||||||||||||||||||||||||||||||||||||||||||||||||||||||||||||||||||||||||||||||||||||||||||||||||||||||||||||||||||||||||||||||||||||||||||||||||||||||||||||||||||||||||||||||||||||||||||||||||||||||||||||||||||||||||||||||||||||||||||||||||||||||||||||||||||||||||||||||||||||||||||||||||||||
Oncogene 1 | Significant driver gene in | ||||||||||||||||||||||||||||||||||||||||||||||||||||||||||||||||||||||||||||||||||||||||||||||||||||||||||||||||||||||||||||||||||||||||||||||||||||||||||||||||||||||||||||||||||||||||||||||||||||||||||||||||||||||||||||||||||||||||||||||||||||||||||||||||||||||||||||||||||||||||||||||||||||||||||||||||||||||||||||||||||||||||||||||||||||||||||||||||||||
| cf) number; DB name 1 Oncogene; http://nar.oxfordjournals.org/content/35/suppl_1/D721.long, 2 Tumor Suppressor gene; https://bioinfo.uth.edu/TSGene/, 3 Cancer Gene Census; http://www.nature.com/nrc/journal/v4/n3/abs/nrc1299.html, 4 CancerGenes; http://nar.oxfordjournals.org/content/35/suppl_1/D721.long, 5 Network of Cancer Gene; http://ncg.kcl.ac.uk/index.php, 1Therapeutic Vulnerabilities in Cancer; http://cbio.mskcc.org/cancergenomics/statius/ |
| KEGG_FRUCTOSE_AND_MANNOSE_METABOLISM KEGG_LINOLEIC_ACID_METABOLISM KEGG_BUTANOATE_METABOLISM | |
| OMIM | 604707; gene. |
| Orphanet | |
| Disease | KEGG Disease: AKR1B10 |
| MedGen: AKR1B10 (Human Medical Genetics with Condition) | |
| ClinVar: AKR1B10 | |
| Phenotype | MGI: AKR1B10 (International Mouse Phenotyping Consortium) |
| PhenomicDB: AKR1B10 | |
| Mutations for AKR1B10 |
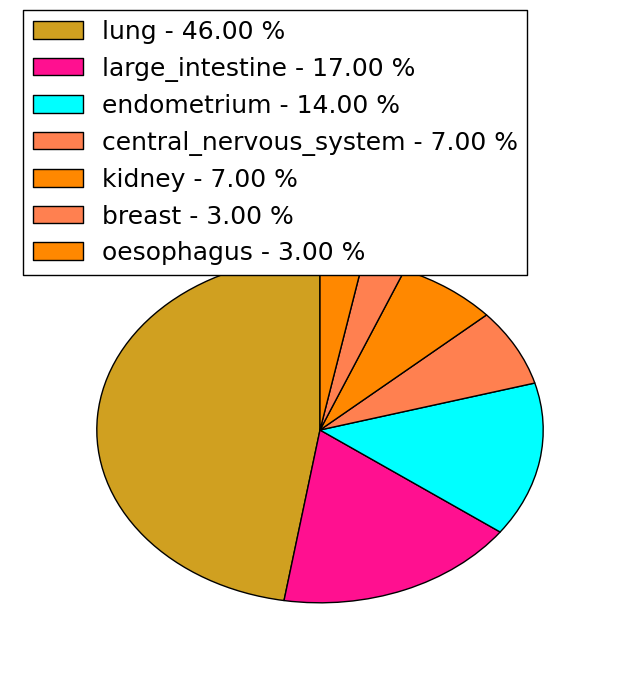
| * Under tables are showing count per each tissue to give us broad intuition about tissue specific mutation patterns.You can go to the detailed page for each mutation database's web site. |
| - Statistics for Tissue and Mutation type | Top |
 |
| - For Inter-chromosomal Variations |
| There's no inter-chromosomal structural variation. |
| - For Intra-chromosomal Variations |
| * Intra-chromosomal variantions includes 'intrachromosomal amplicon to amplicon', 'intrachromosomal amplicon to non-amplified dna', 'intrachromosomal deletion', 'intrachromosomal fold-back inversion', 'intrachromosomal inversion', 'intrachromosomal tandem duplication', 'Intrachromosomal unknown type', 'intrachromosomal with inverted orientation', 'intrachromosomal with non-inverted orientation'. |
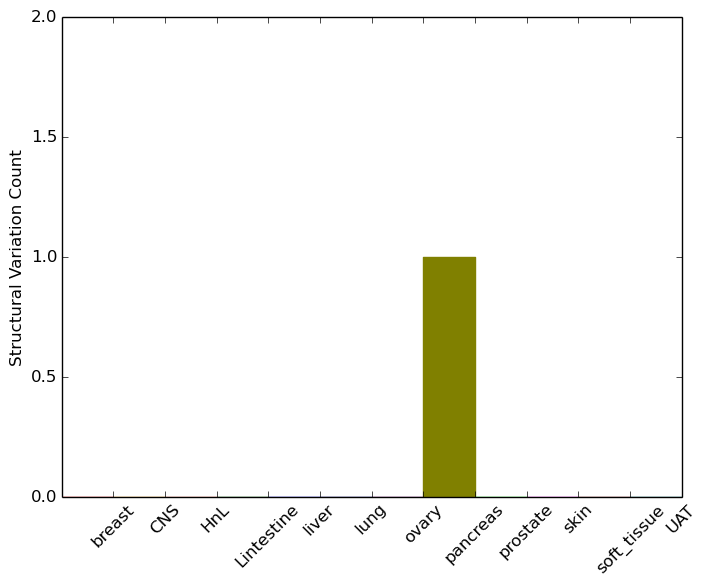 |
| Sample | Symbol_a | Chr_a | Start_a | End_a | Symbol_b | Chr_b | Start_b | End_b |
| pancreas | AKR1B10 | chr7 | 134216181 | 134216201 | AKR1B10 | chr7 | 134217976 | 134217996 |
| cf) Tissue number; Tissue name (1;Breast, 2;Central_nervous_system, 3;Haematopoietic_and_lymphoid_tissue, 4;Large_intestine, 5;Liver, 6;Lung, 7;Ovary, 8;Pancreas, 9;Prostate, 10;Skin, 11;Soft_tissue, 12;Upper_aerodigestive_tract) |
| * From mRNA Sanger sequences, Chitars2.0 arranged chimeric transcripts. This table shows AKR1B10 related fusion information. |
| ID | Head Gene | Tail Gene | Accession | Gene_a | qStart_a | qEnd_a | Chromosome_a | tStart_a | tEnd_a | Gene_a | qStart_a | qEnd_a | Chromosome_a | tStart_a | tEnd_a |
| Top |
| Mutation type/ Tissue ID | brca | cns | cerv | endome | haematopo | kidn | Lintest | liver | lung | ns | ovary | pancre | prost | skin | stoma | thyro | urina | |||
| Total # sample | 1 | |||||||||||||||||||
| GAIN (# sample) | 1 | |||||||||||||||||||
| LOSS (# sample) |
| cf) Tissue ID; Tissue type (1; Breast, 2; Central_nervous_system, 3; Cervix, 4; Endometrium, 5; Haematopoietic_and_lymphoid_tissue, 6; Kidney, 7; Large_intestine, 8; Liver, 9; Lung, 10; NS, 11; Ovary, 12; Pancreas, 13; Prostate, 14; Skin, 15; Stomach, 16; Thyroid, 17; Urinary_tract) |
| Top |
|
 |
| Top |
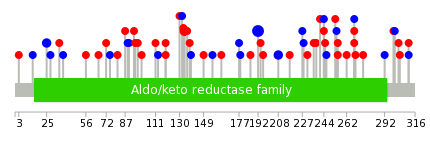
| Stat. for Non-Synonymous SNVs (# total SNVs=28) | (# total SNVs=17) |
 |  |
(# total SNVs=0) | (# total SNVs=0) |
| Top |
| * When you move the cursor on each content, you can see more deailed mutation information on the Tooltip. Those are primary_site,primary_histology,mutation(aa),pubmedID. |
| GRCh37 position | Mutation(aa) | Unique sampleID count |
| chr7:134221826-134221826 | p.T192T | 7 |
| chr7:134217804-134217804 | p.G134R | 3 |
| chr7:134221874-134221874 | p.T208T | 2 |
| chr7:134212697-134212697 | p.K12* | 2 |
| chr7:134215403-134215403 | p.L25L | 2 |
| chr7:134223007-134223007 | p.A268V | 2 |
| chr7:134215495-134215495 | p.G56E | 1 |
| chr7:134221837-134221837 | p.L196R | 1 |
| chr7:134216714-134216714 | p.L97F | 1 |
| chr7:134222405-134222405 | p.A245T | 1 |
| Top |
|
 |
| Point Mutation/ Tissue ID | 1 | 2 | 3 | 4 | 5 | 6 | 7 | 8 | 9 | 10 | 11 | 12 | 13 | 14 | 15 | 16 | 17 | 18 | 19 | 20 |
| # sample | 1 | 5 | 2 | 3 | 2 | 11 | 3 | 14 | 3 | 3 | ||||||||||
| # mutation | 1 | 4 | 2 | 3 | 2 | 12 | 3 | 15 | 3 | 4 | ||||||||||
| nonsynonymous SNV | 1 | 2 | 1 | 3 | 1 | 9 | 3 | 8 | 2 | 3 | ||||||||||
| synonymous SNV | 2 | 1 | 1 | 3 | 7 | 1 | 1 |
| cf) Tissue ID; Tissue type (1; BLCA[Bladder Urothelial Carcinoma], 2; BRCA[Breast invasive carcinoma], 3; CESC[Cervical squamous cell carcinoma and endocervical adenocarcinoma], 4; COAD[Colon adenocarcinoma], 5; GBM[Glioblastoma multiforme], 6; Glioma Low Grade, 7; HNSC[Head and Neck squamous cell carcinoma], 8; KICH[Kidney Chromophobe], 9; KIRC[Kidney renal clear cell carcinoma], 10; KIRP[Kidney renal papillary cell carcinoma], 11; LAML[Acute Myeloid Leukemia], 12; LUAD[Lung adenocarcinoma], 13; LUSC[Lung squamous cell carcinoma], 14; OV[Ovarian serous cystadenocarcinoma ], 15; PAAD[Pancreatic adenocarcinoma], 16; PRAD[Prostate adenocarcinoma], 17; SKCM[Skin Cutaneous Melanoma], 18:STAD[Stomach adenocarcinoma], 19:THCA[Thyroid carcinoma], 20:UCEC[Uterine Corpus Endometrial Carcinoma]) |
| Top |
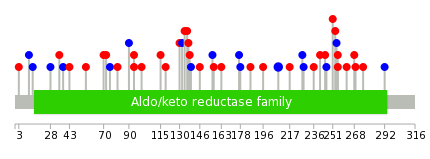
| * We represented just top 10 SNVs. When you move the cursor on each content, you can see more deailed mutation information on the Tooltip. Those are primary_site, primary_histology, mutation(aa), pubmedID. |
| Genomic Position | Mutation(aa) | Unique sampleID count |
| chr7:134221874 | p.T208T | 2 |
| chr7:134215542 | p.P262H | 1 |
| chr7:134222956 | p.E94D | 1 |
| chr7:134217804 | p.Y178Y | 1 |
| chr7:134221806 | p.A268V | 1 |
| chr7:134215553 | p.L100M | 1 |
| chr7:134222961 | p.E186Q | 1 |
| chr7:134217811 | p.R269S | 1 |
| chr7:134212671 | p.T3M | 1 |
| chr7:134221837 | p.G115E | 1 |
| * Copy number data were extracted from TCGA using R package TCGA-Assembler. The URLs of all public data files on TCGA DCC data server were gathered on Jan-05-2015. Function ProcessCNAData in TCGA-Assembler package was used to obtain gene-level copy number value which is calculated as the average copy number of the genomic region of a gene. |
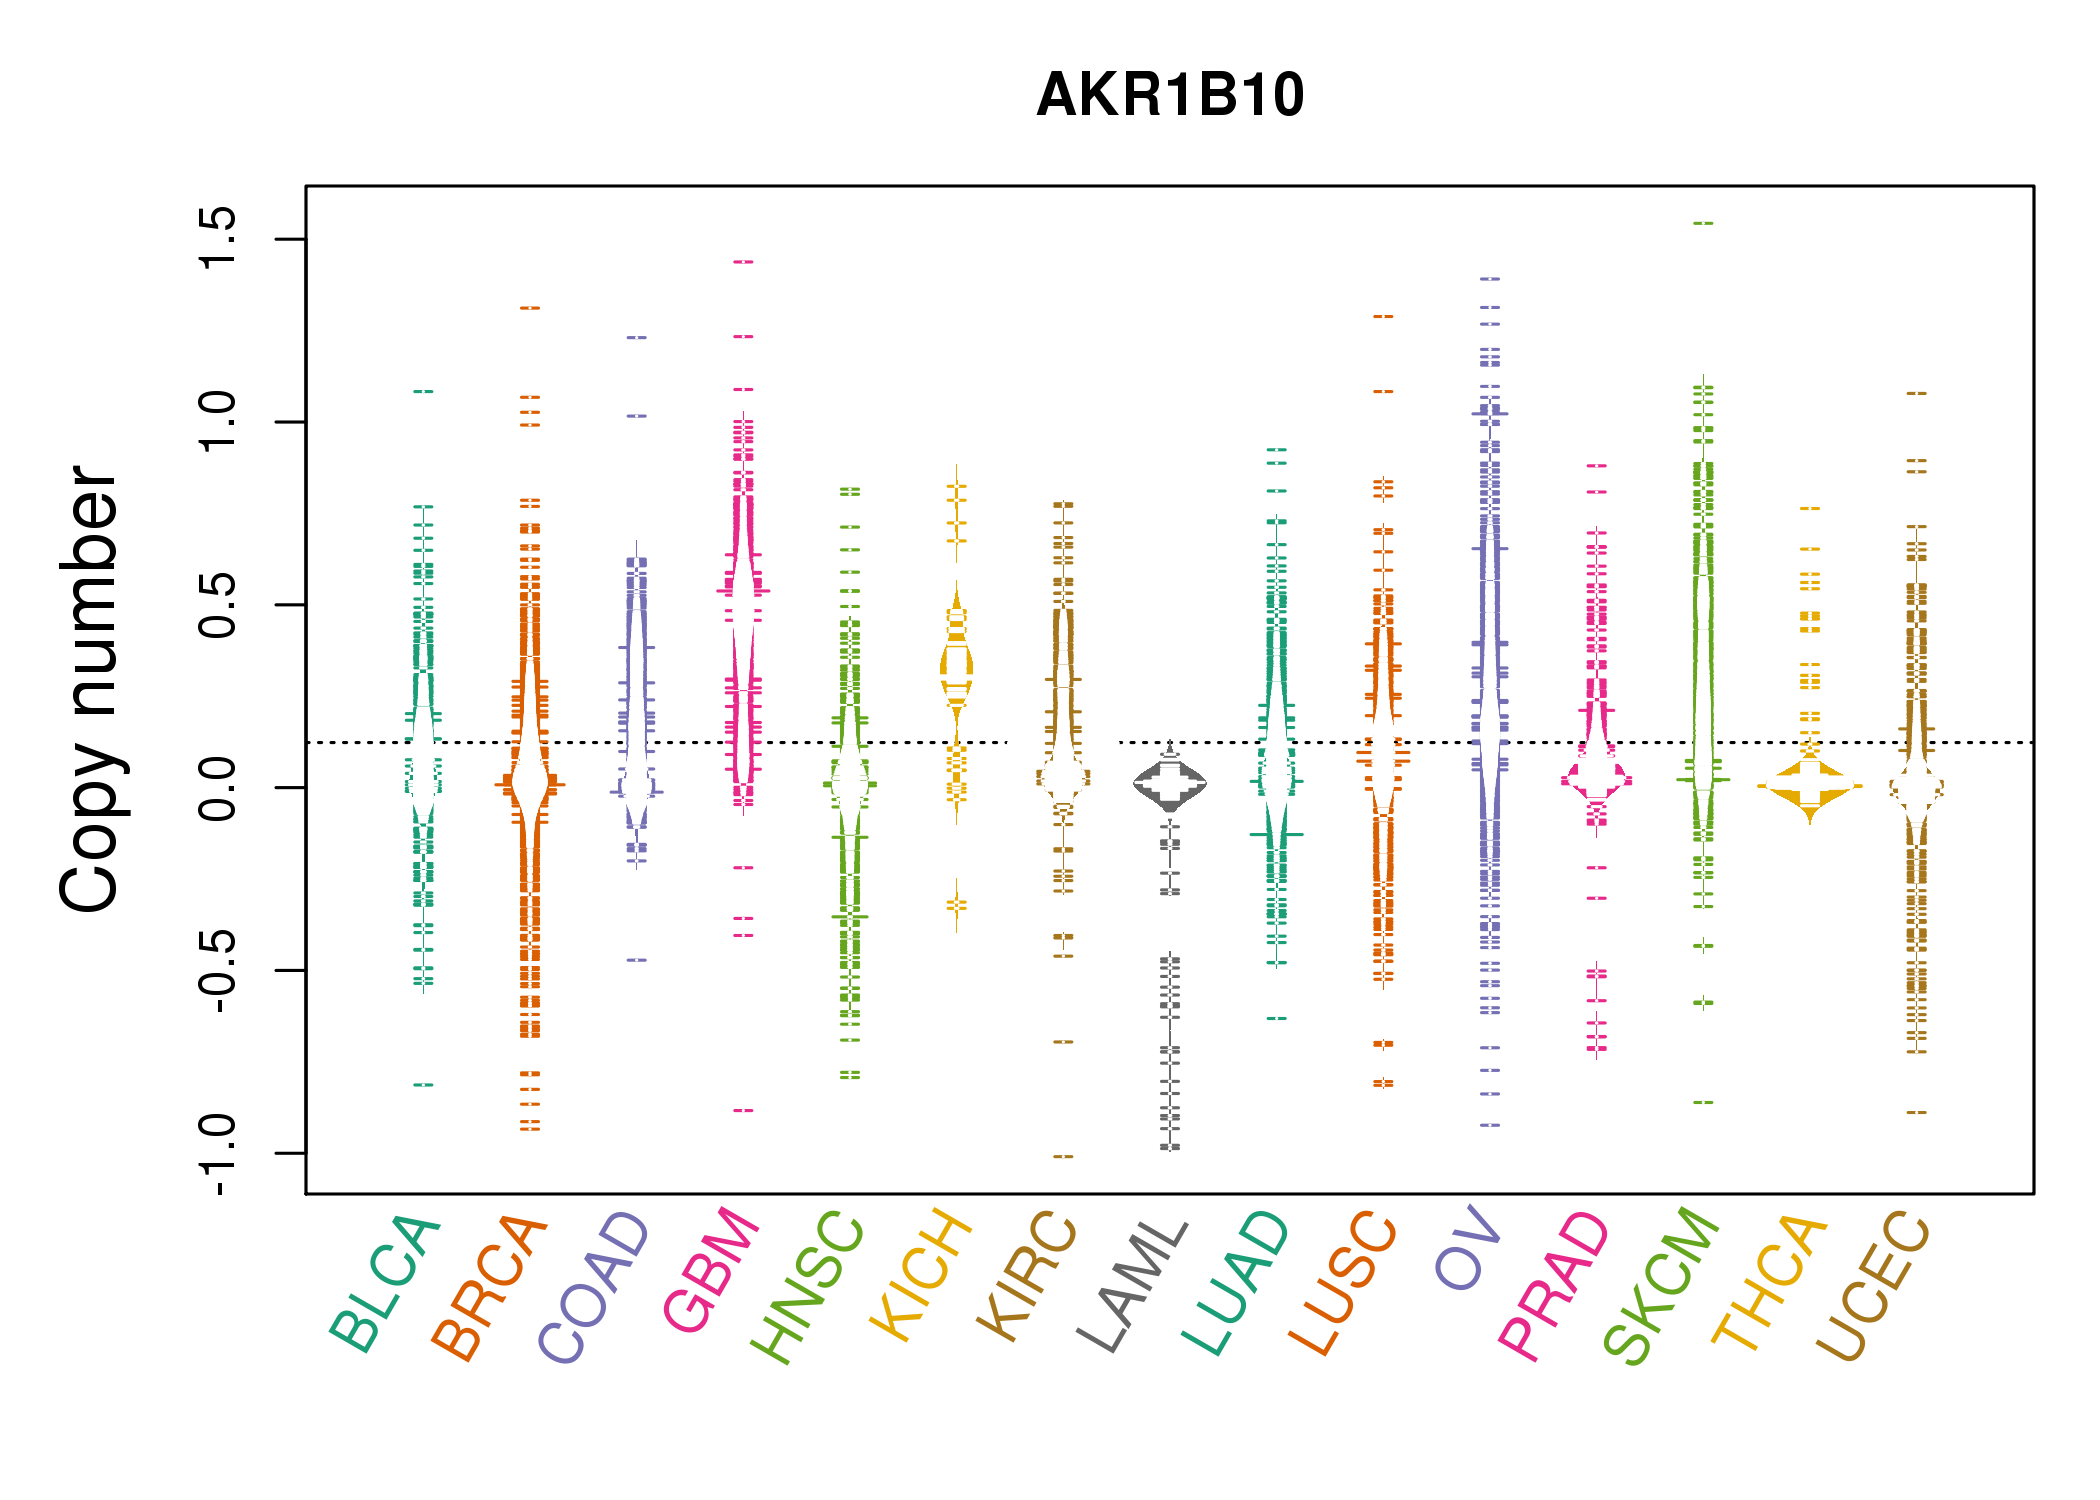 |
| cf) Tissue ID[Tissue type]: BLCA[Bladder Urothelial Carcinoma], BRCA[Breast invasive carcinoma], CESC[Cervical squamous cell carcinoma and endocervical adenocarcinoma], COAD[Colon adenocarcinoma], GBM[Glioblastoma multiforme], Glioma Low Grade, HNSC[Head and Neck squamous cell carcinoma], KICH[Kidney Chromophobe], KIRC[Kidney renal clear cell carcinoma], KIRP[Kidney renal papillary cell carcinoma], LAML[Acute Myeloid Leukemia], LUAD[Lung adenocarcinoma], LUSC[Lung squamous cell carcinoma], OV[Ovarian serous cystadenocarcinoma ], PAAD[Pancreatic adenocarcinoma], PRAD[Prostate adenocarcinoma], SKCM[Skin Cutaneous Melanoma], STAD[Stomach adenocarcinoma], THCA[Thyroid carcinoma], UCEC[Uterine Corpus Endometrial Carcinoma] |
| Top |
| Gene Expression for AKR1B10 |
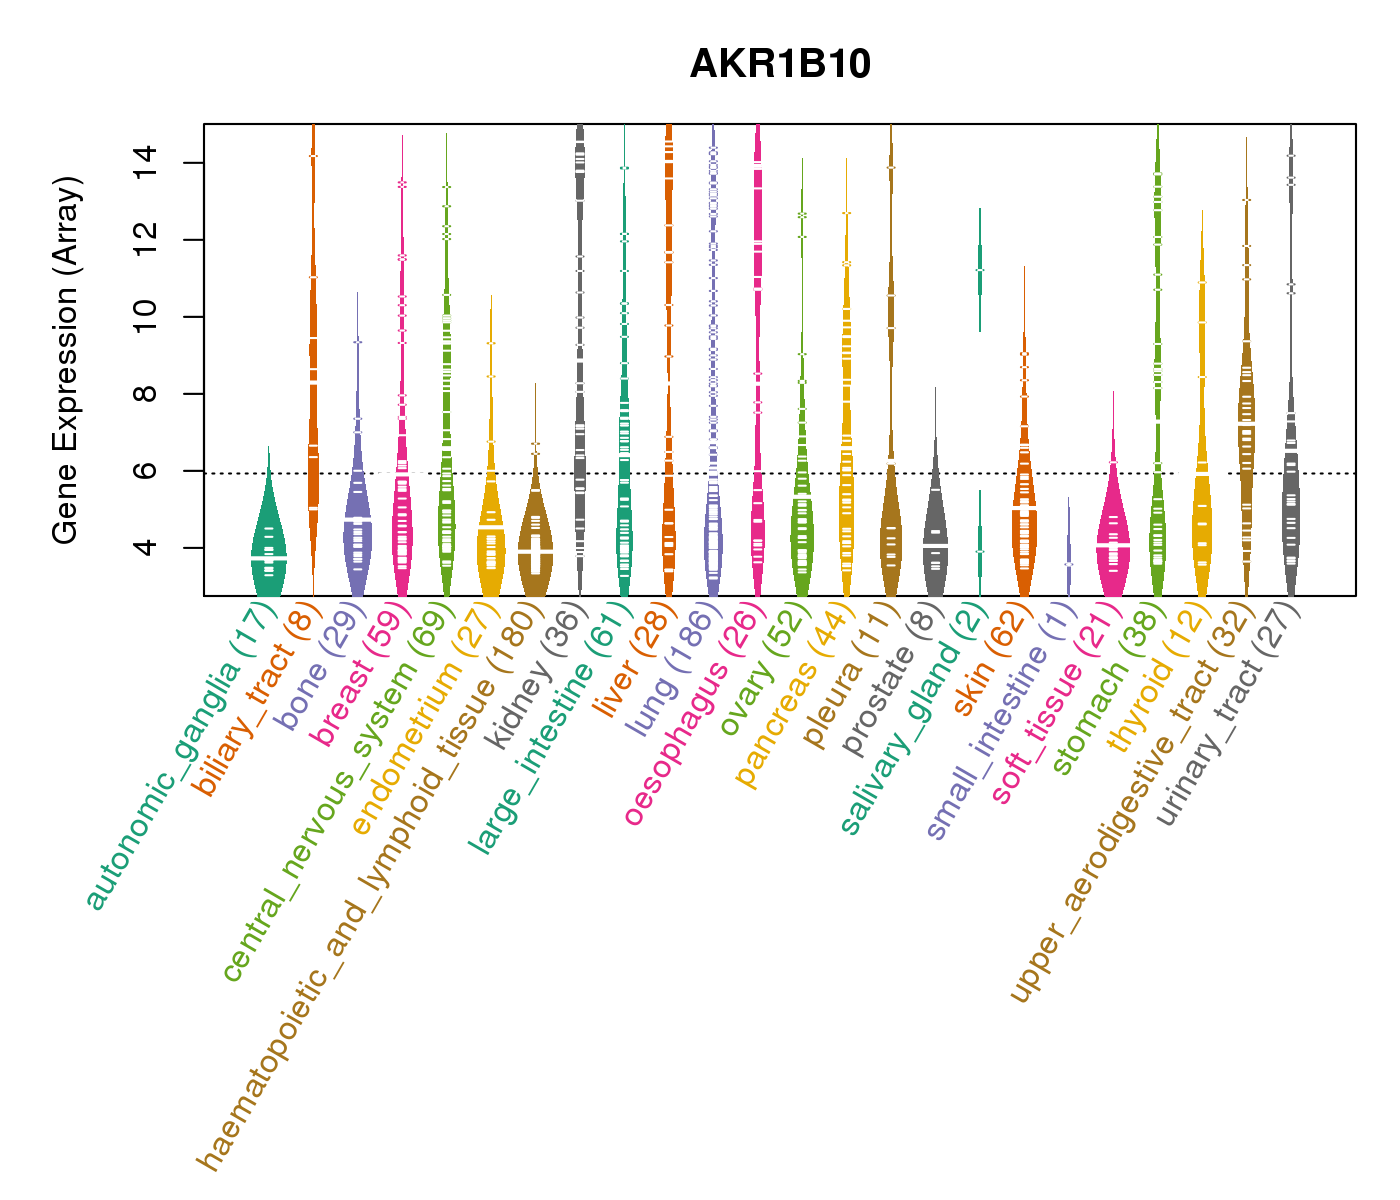
| * CCLE gene expression data were extracted from CCLE_Expression_Entrez_2012-10-18.res: Gene-centric RMA-normalized mRNA expression data. |
 |
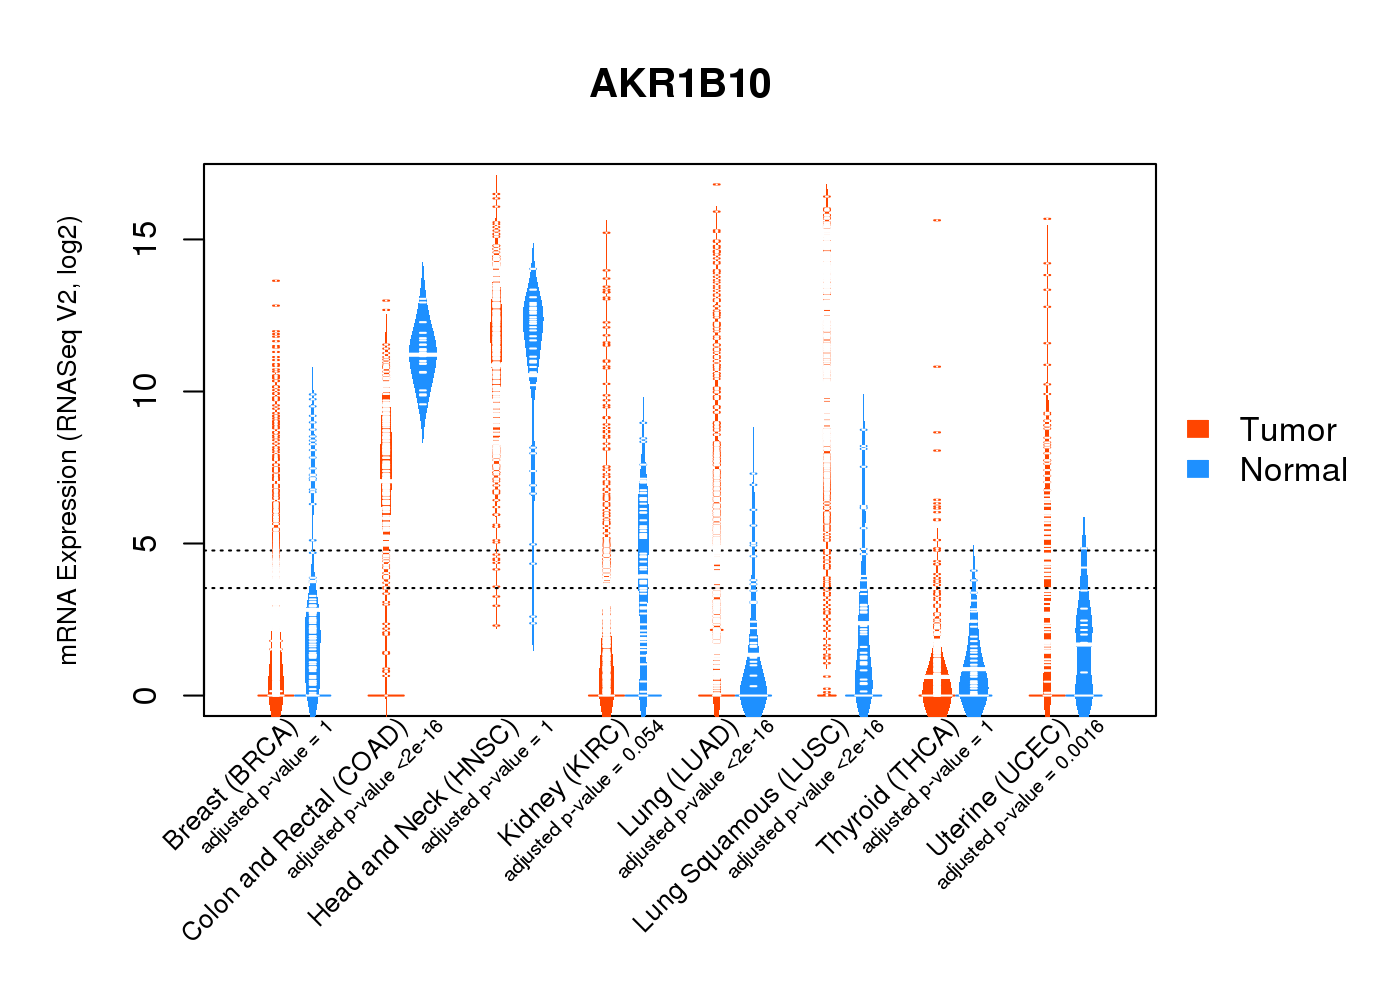
| * Normalized gene expression data of RNASeqV2 was extracted from TCGA using R package TCGA-Assembler. The URLs of all public data files on TCGA DCC data server were gathered at Jan-05-2015. Only eight cancer types have enough normal control samples for differential expression analysis. (t test, adjusted p<0.05 (using Benjamini-Hochberg FDR)) |
 |
| Top |
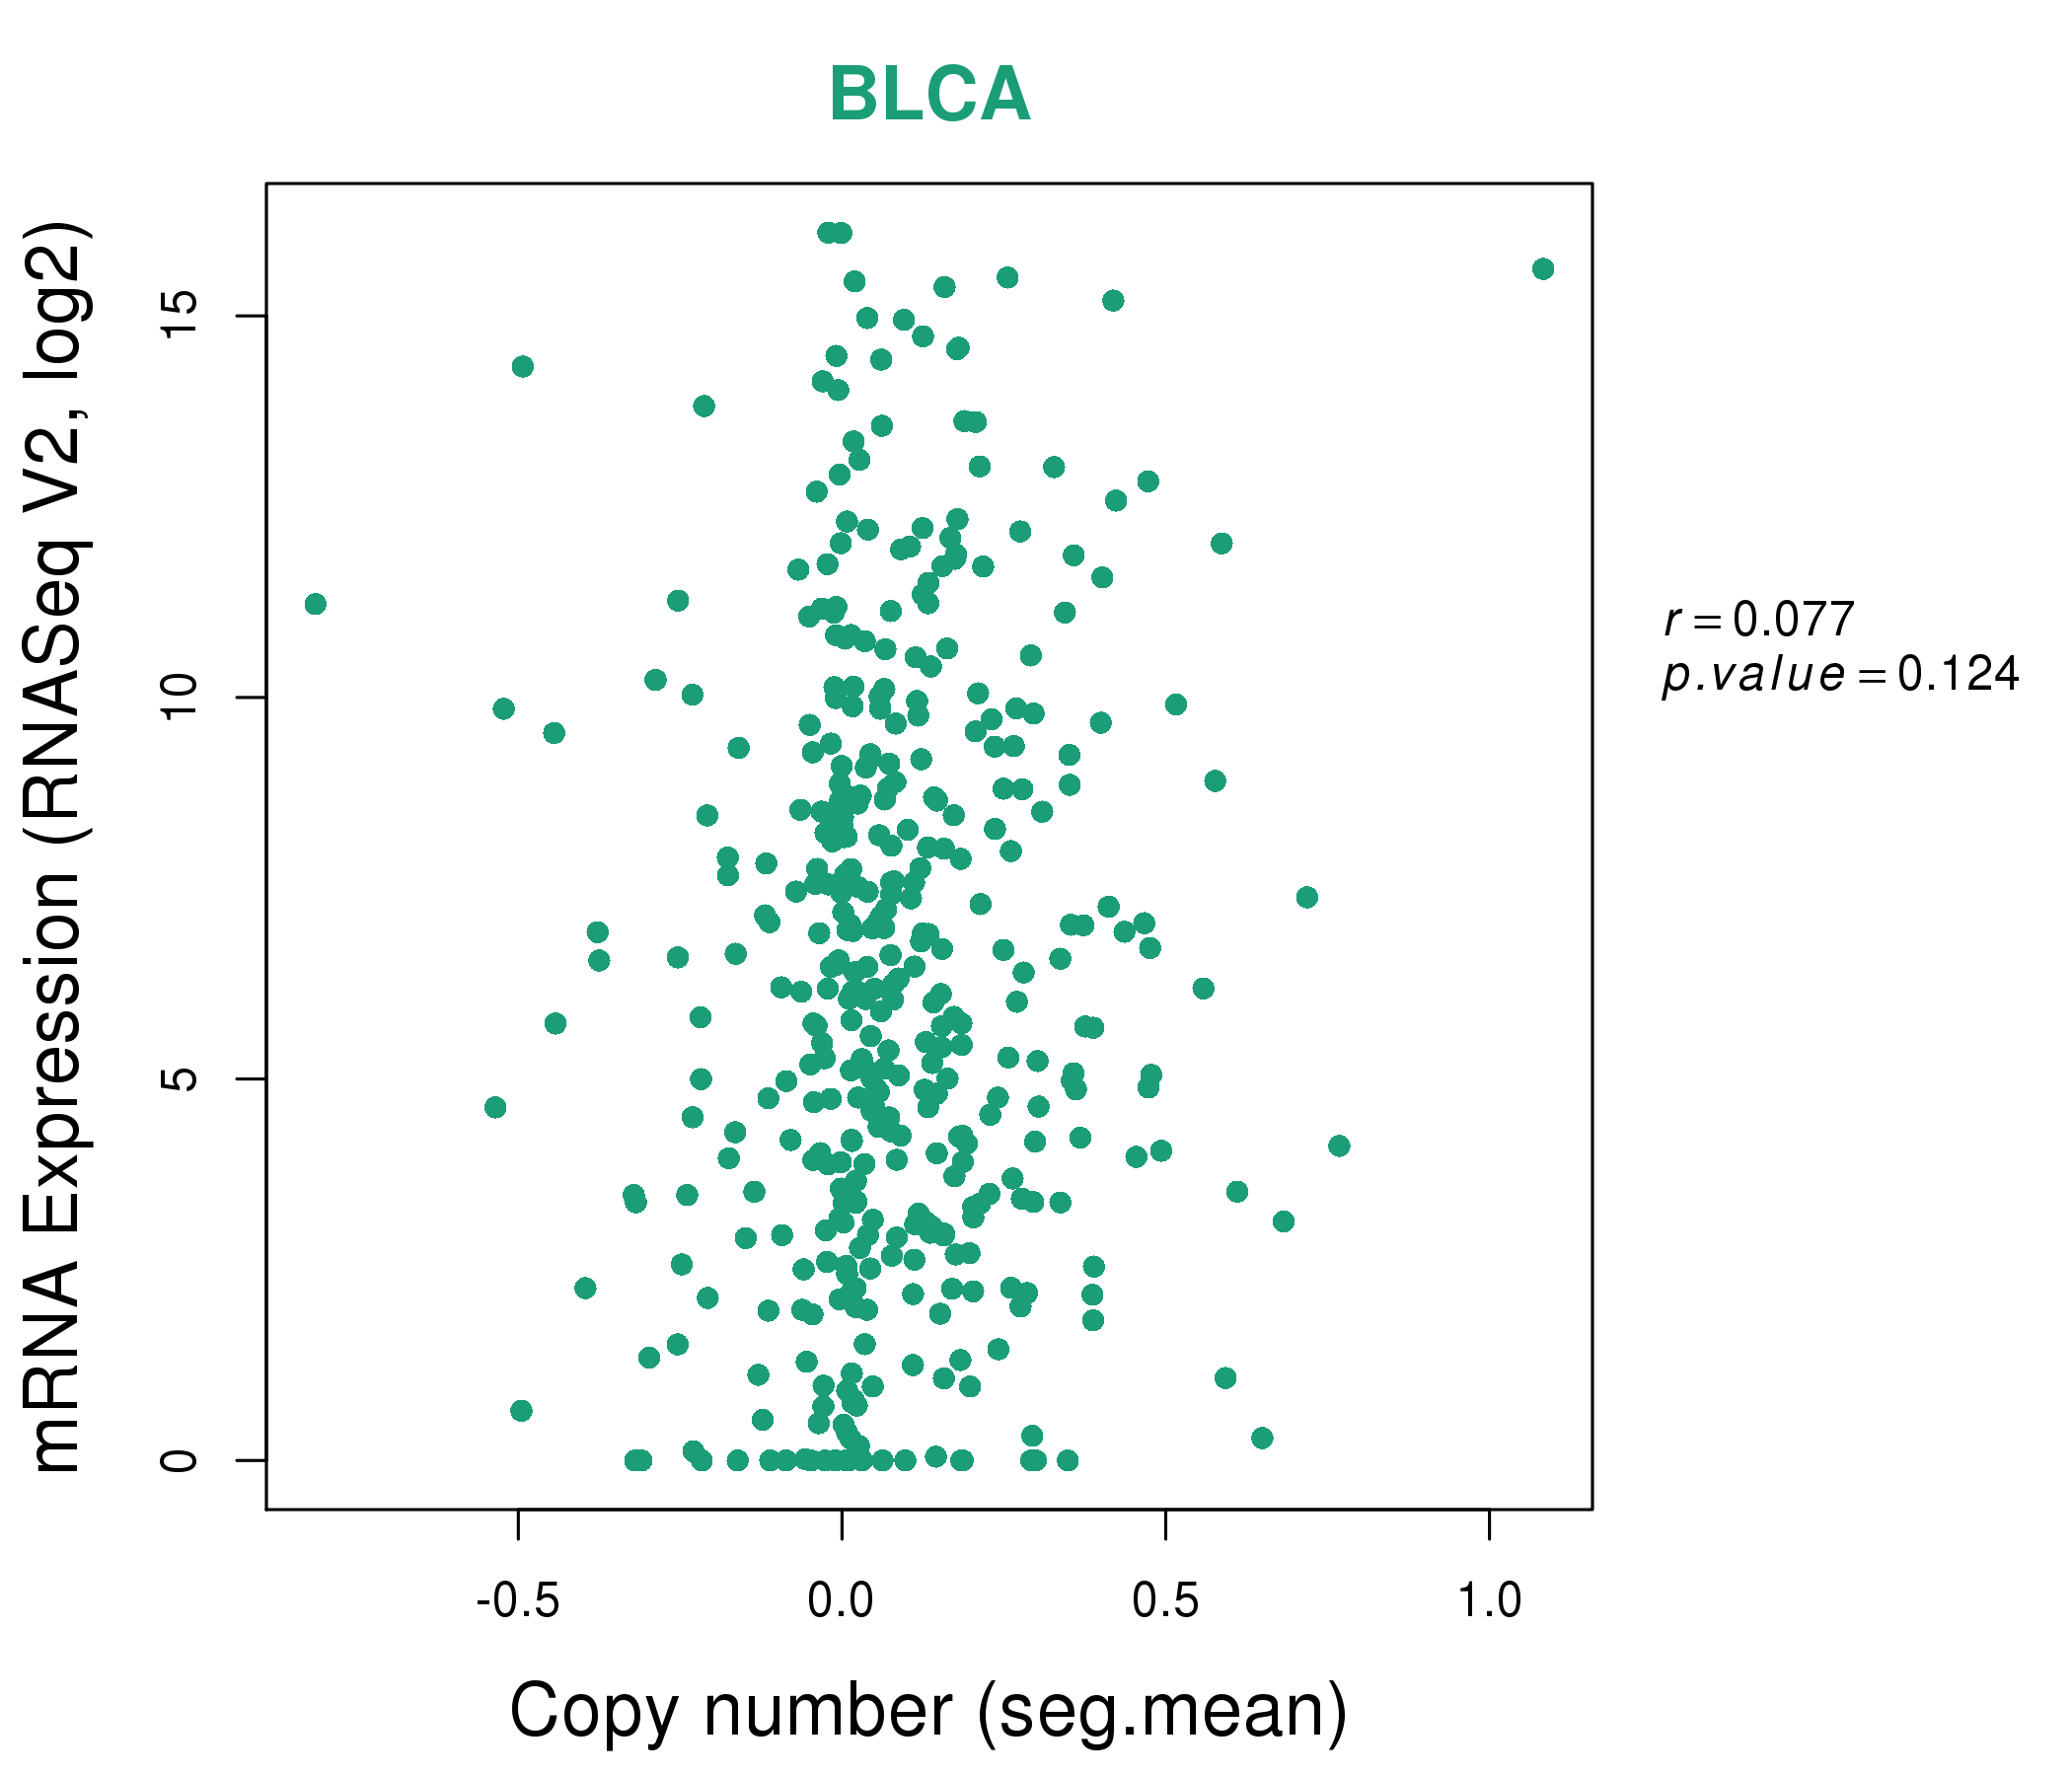
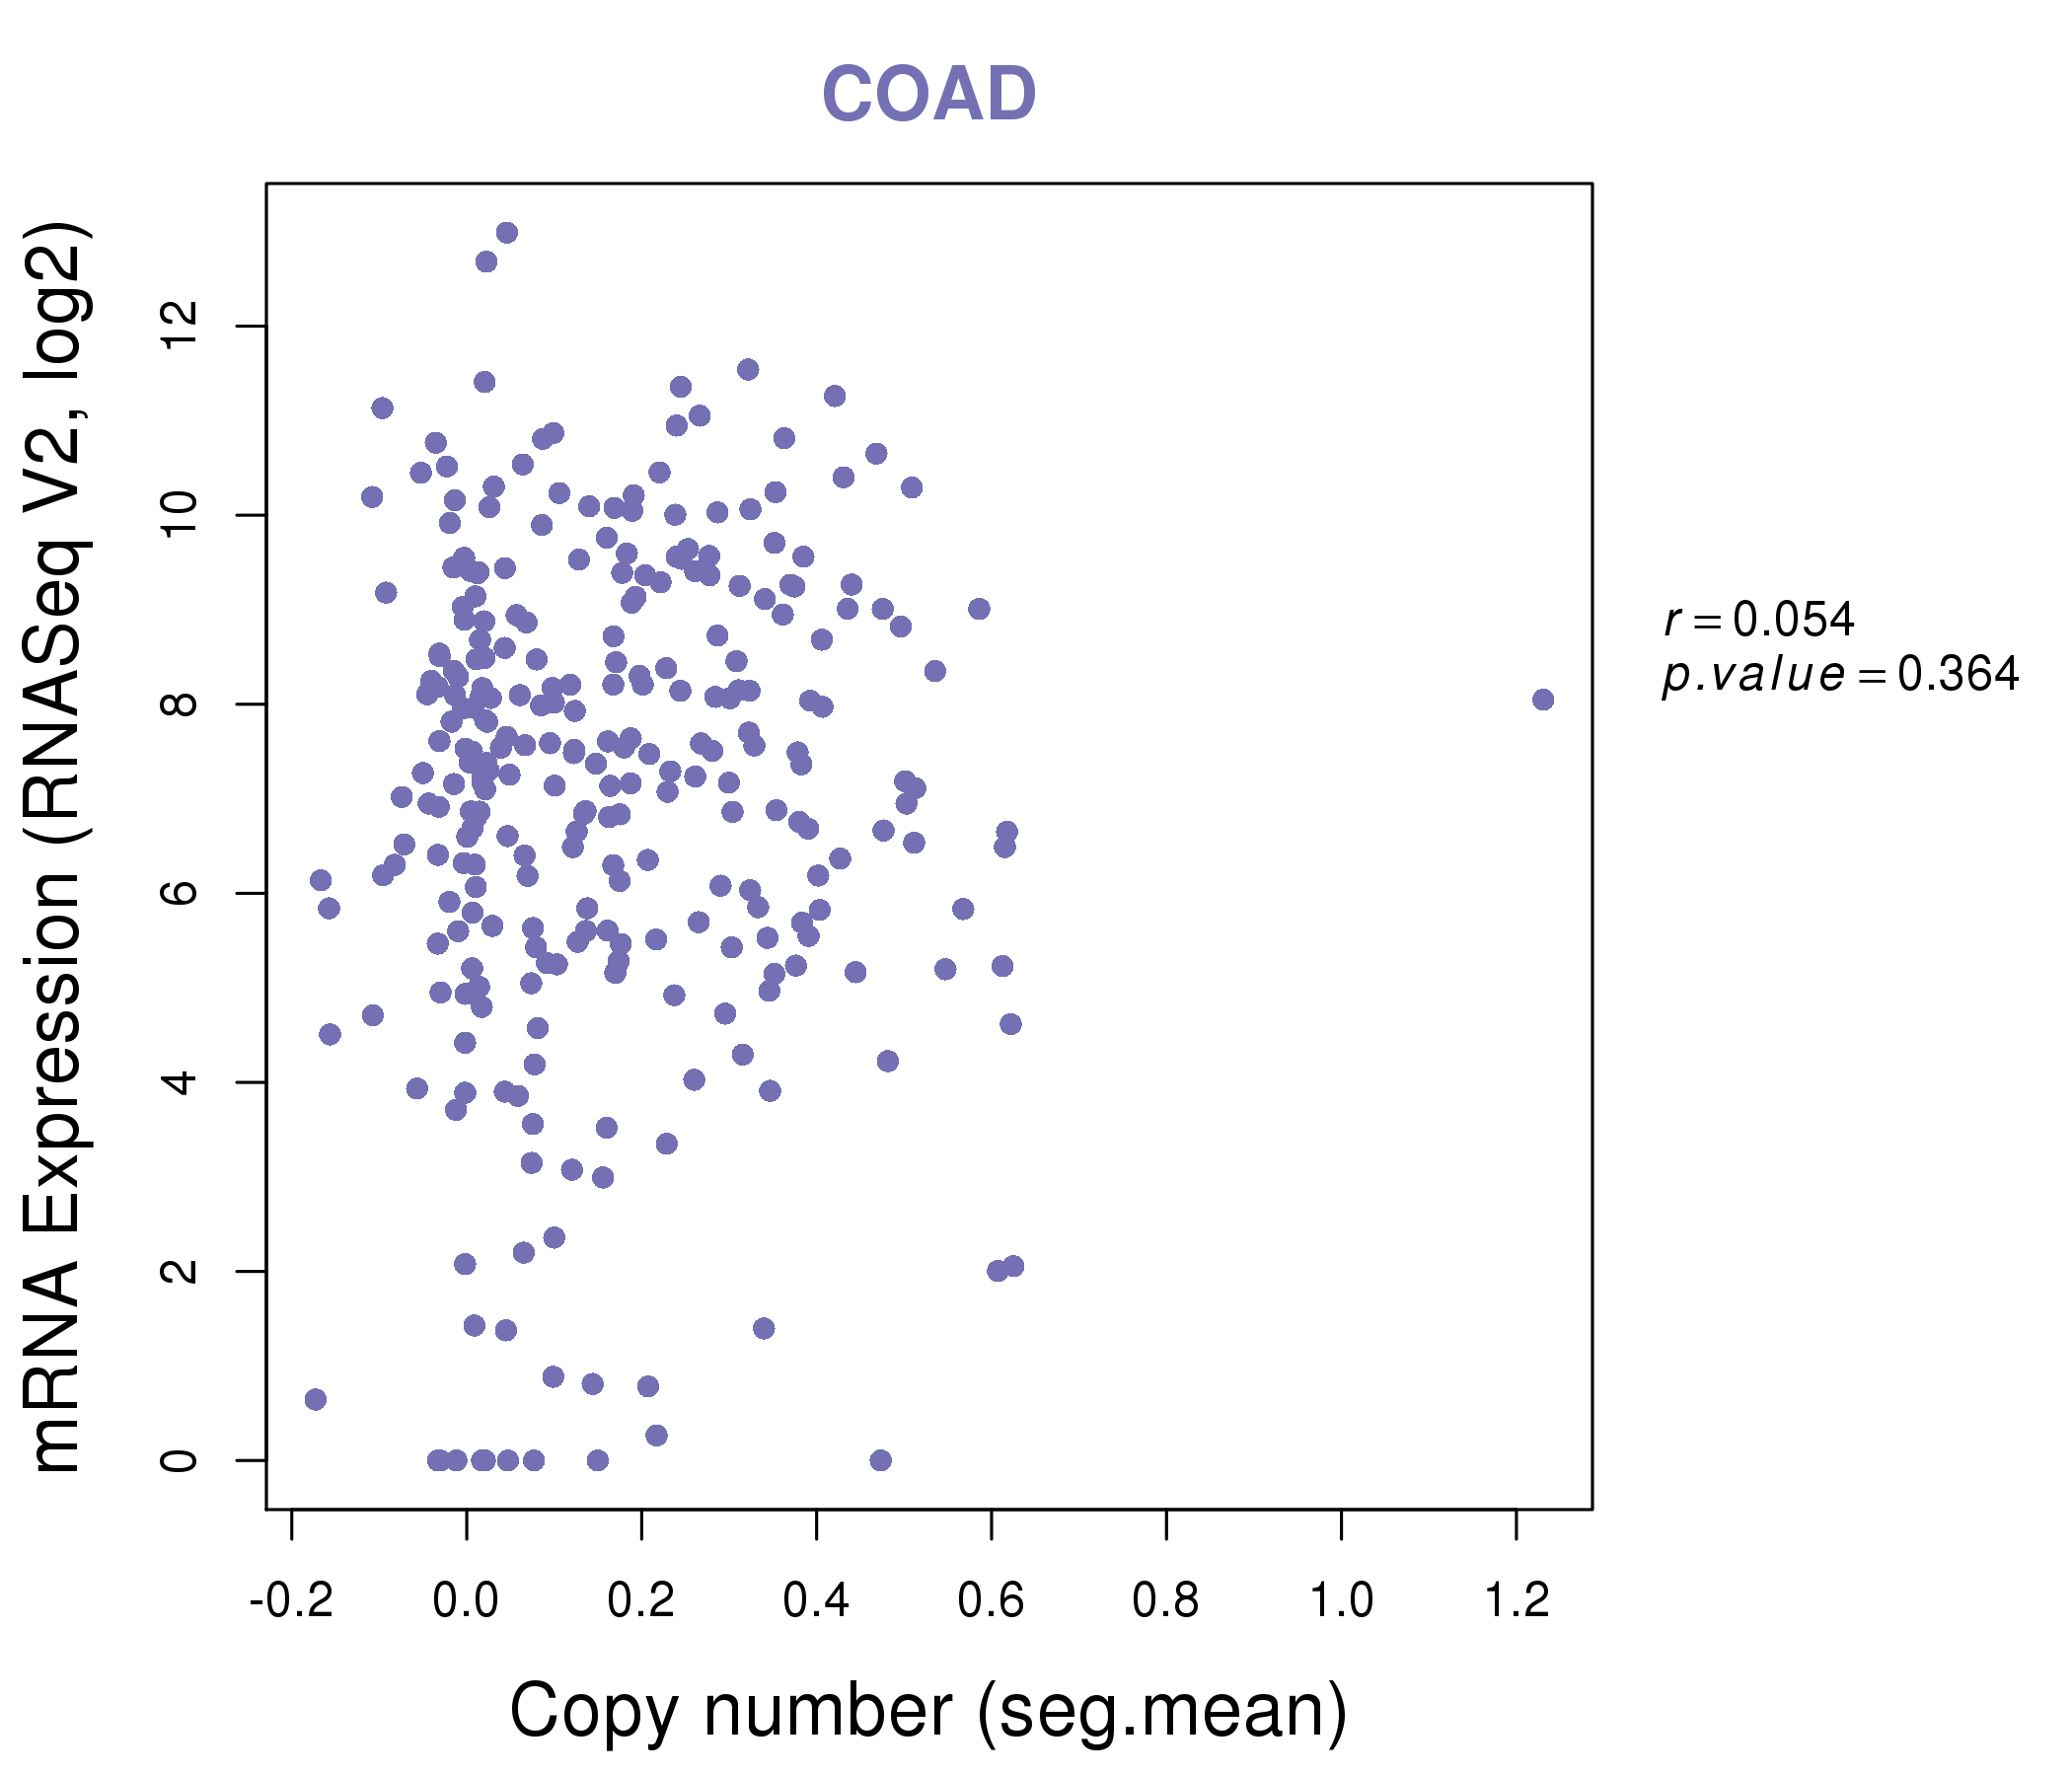
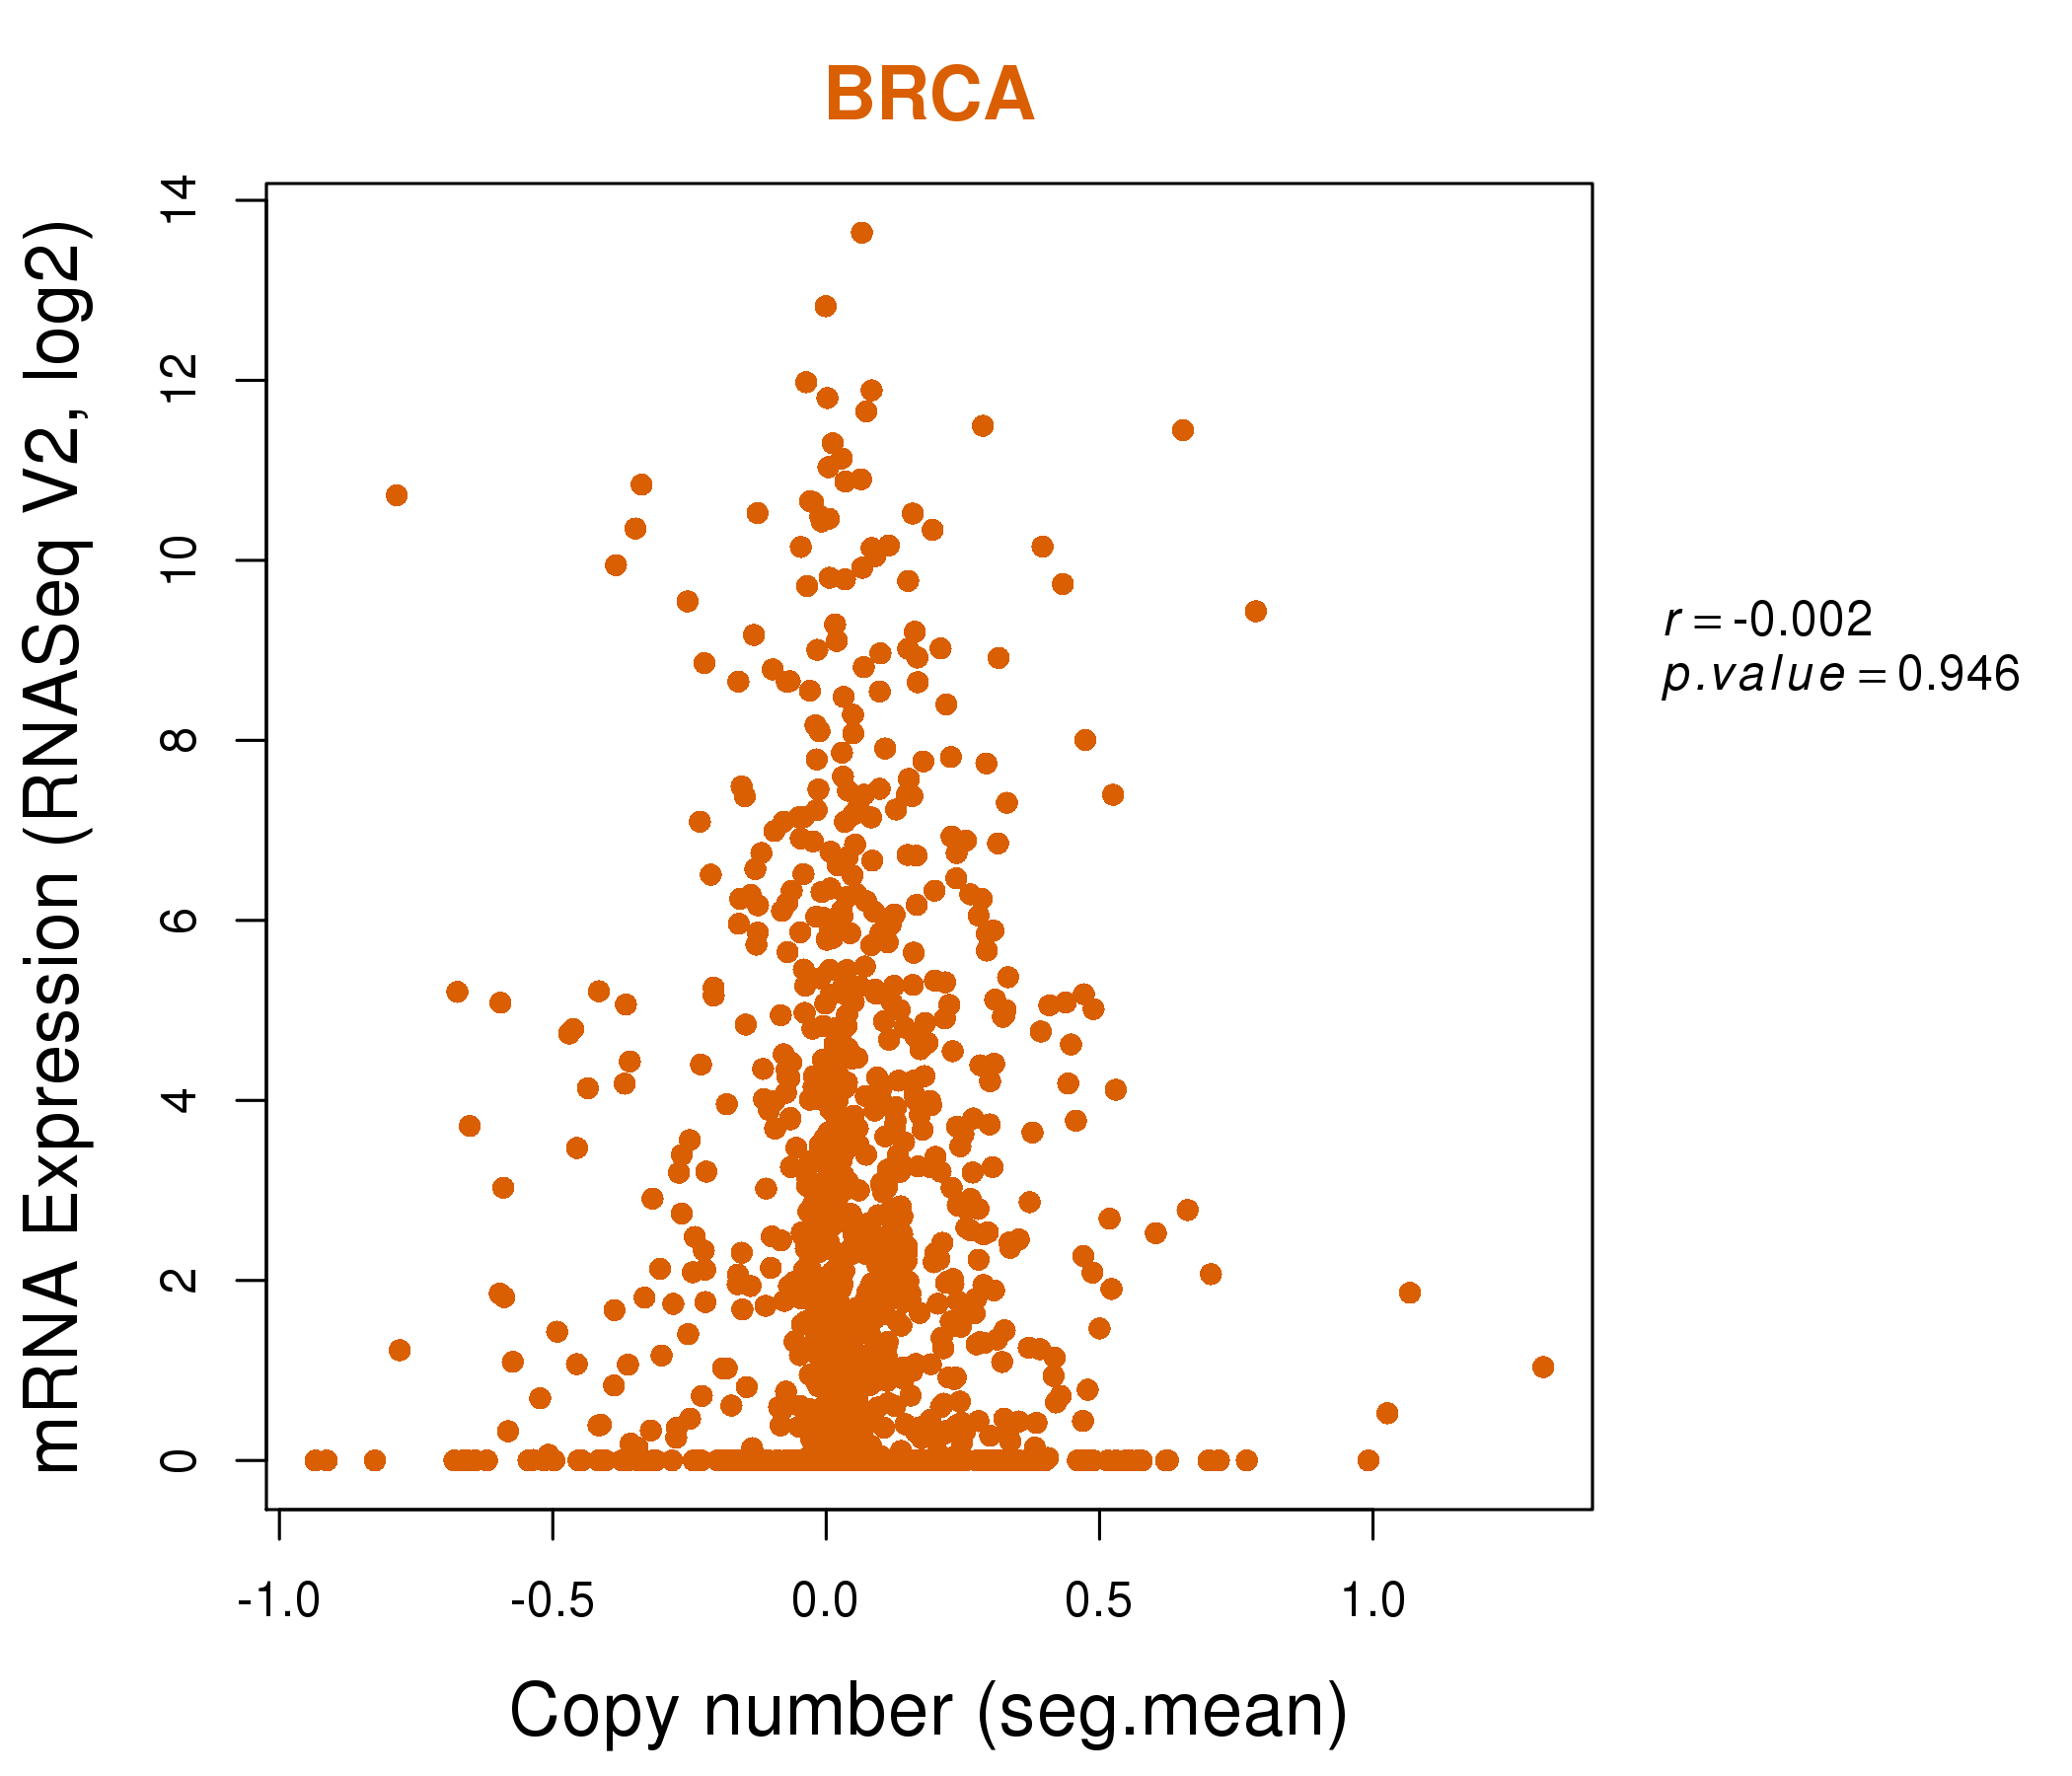
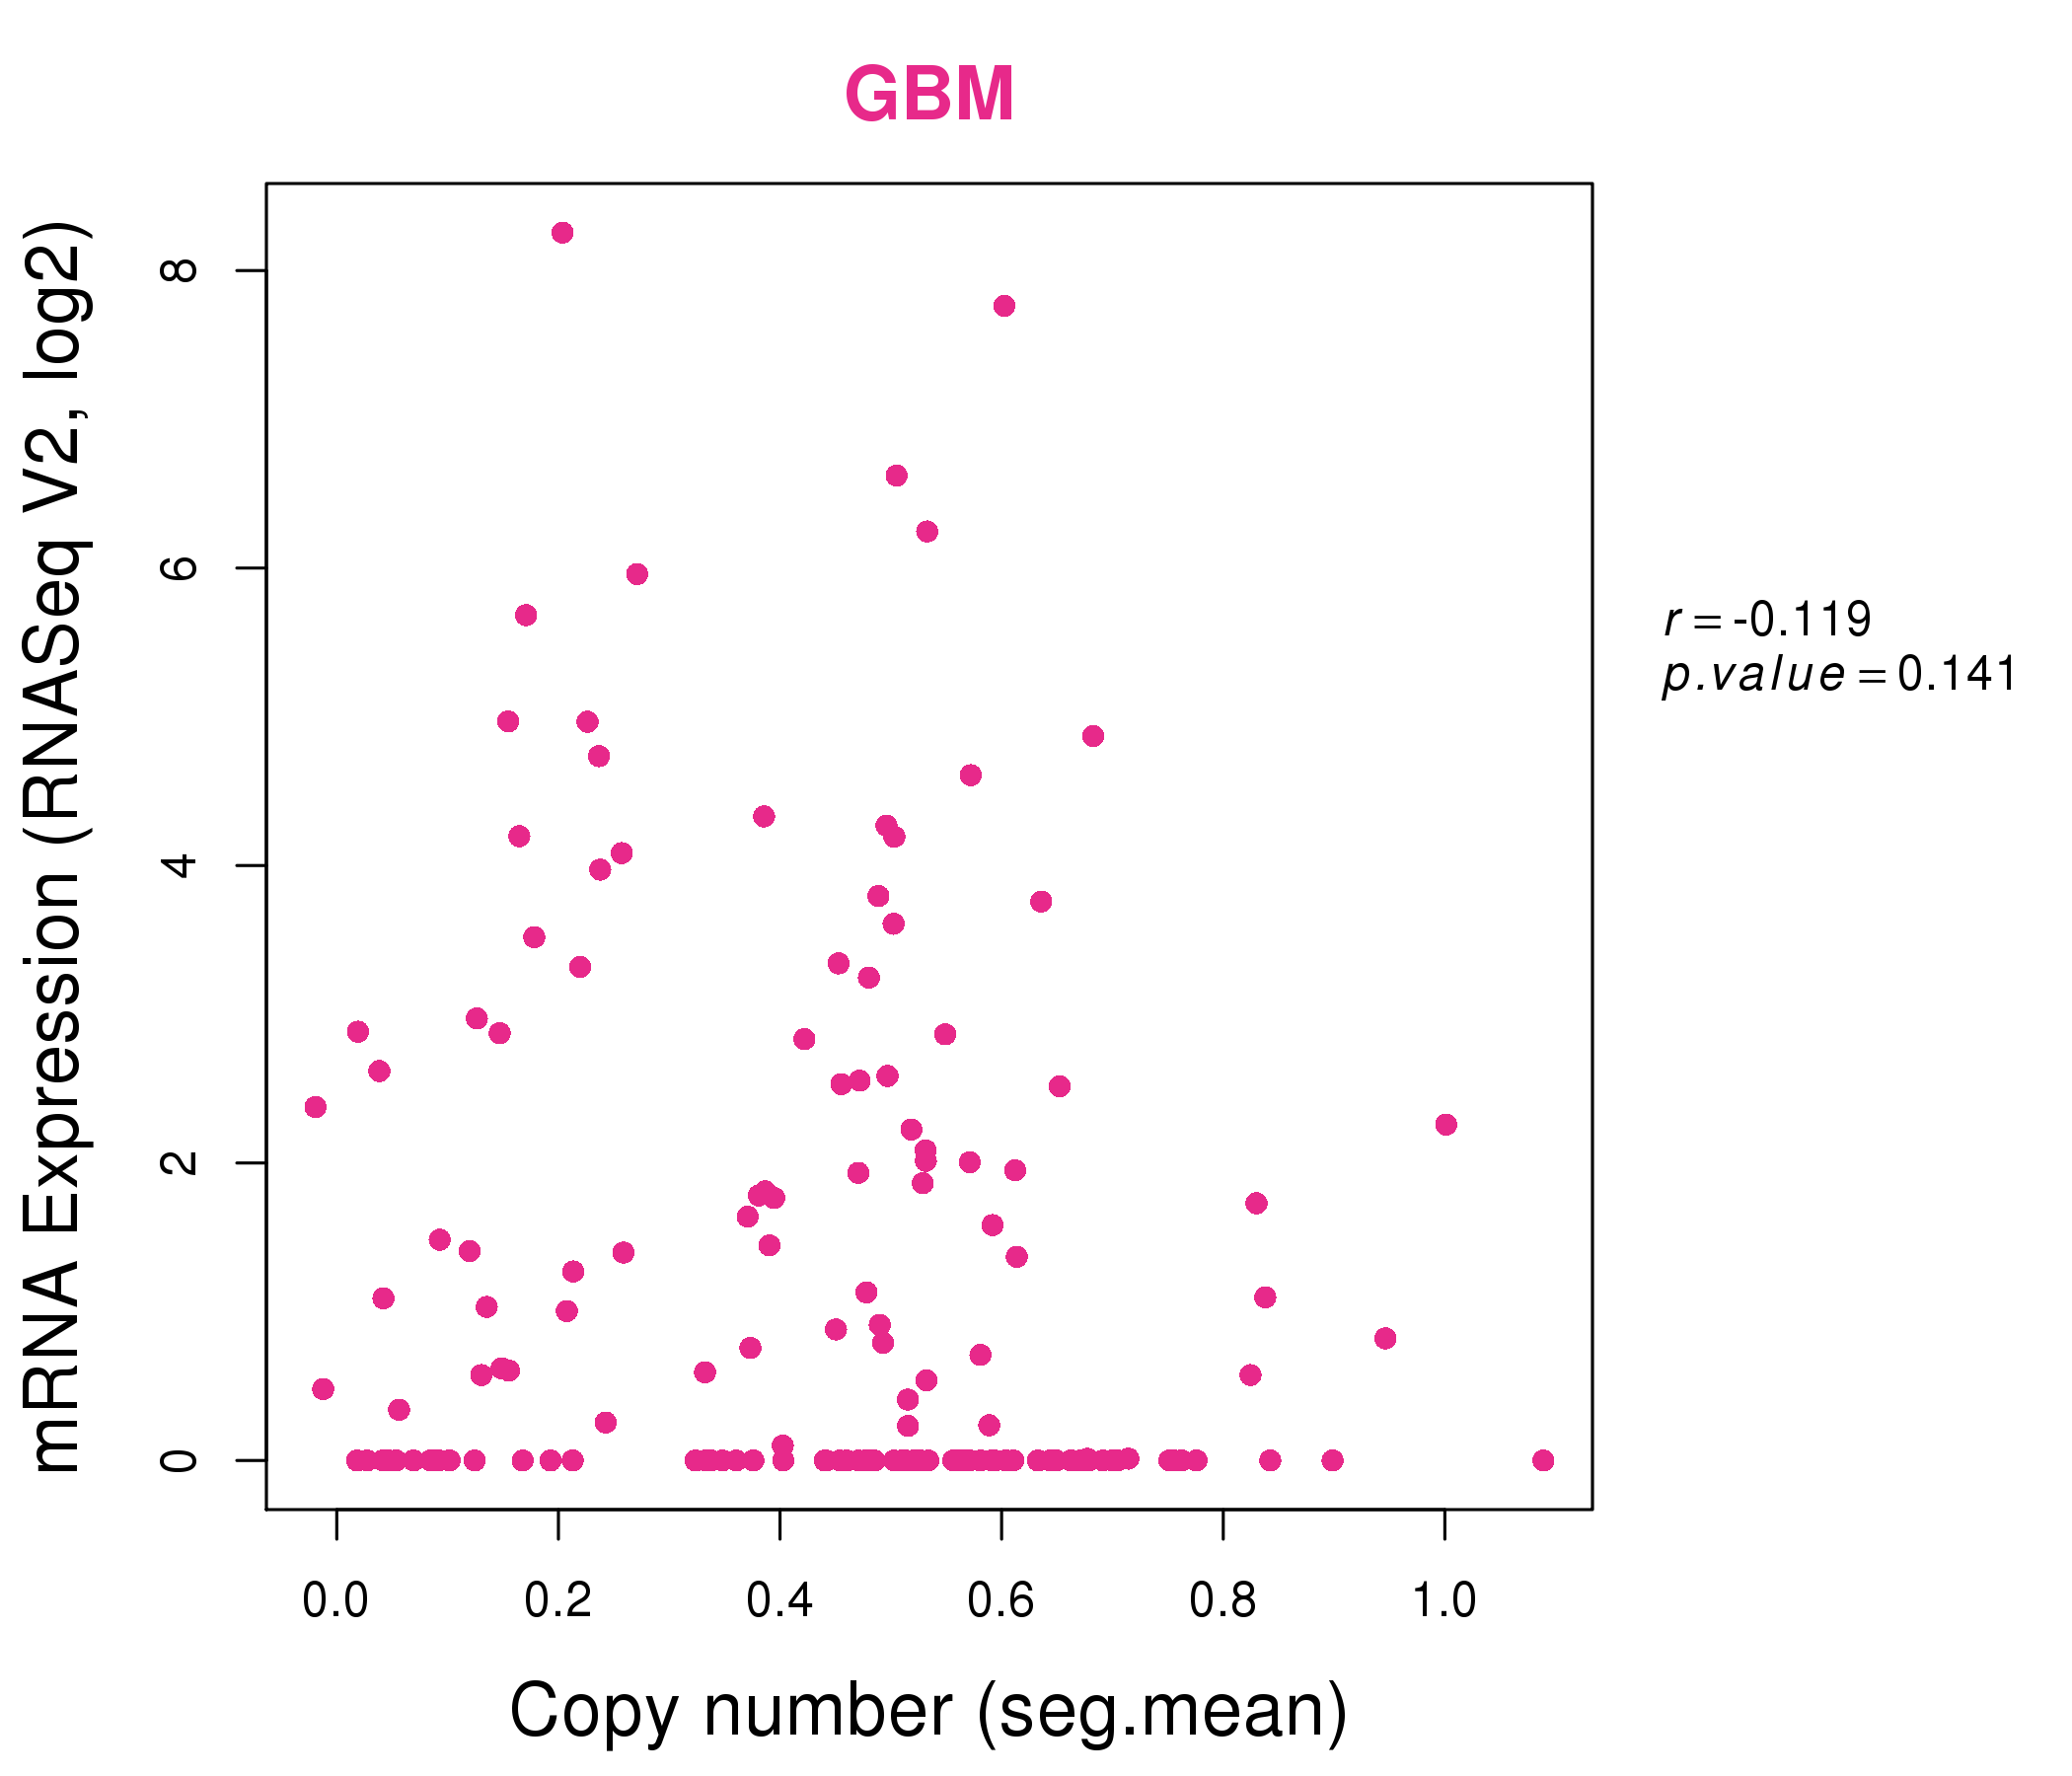
| * This plots show the correlation between CNV and gene expression. |
: Open all plots for all cancer types
 |
|
 |
|
| Top |
| Gene-Gene Network Information |
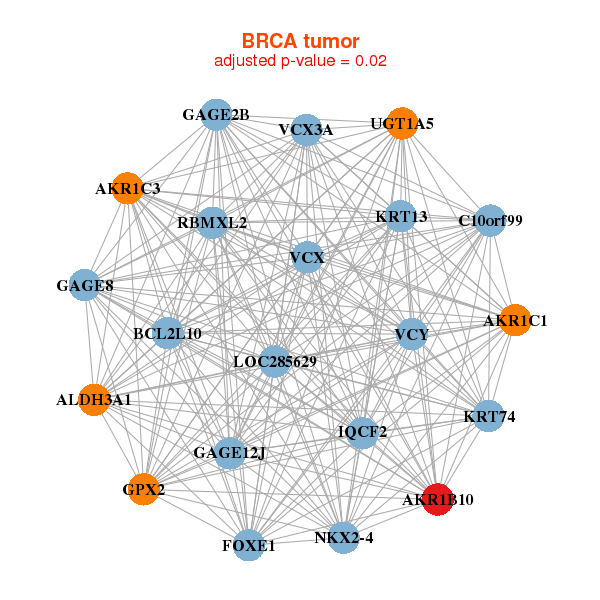
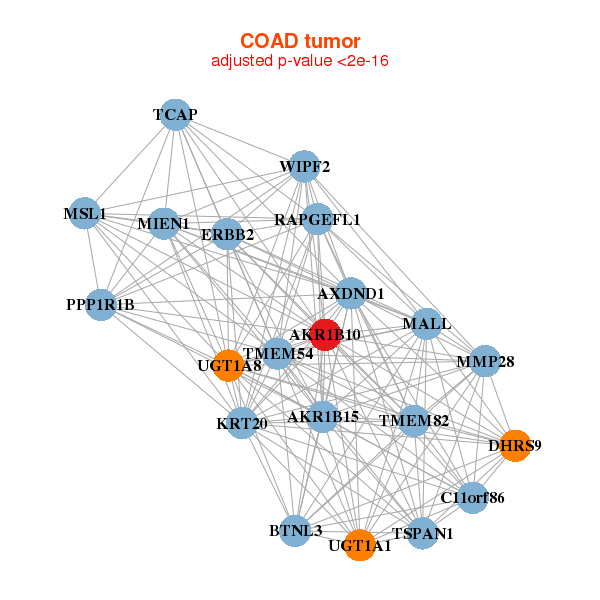
| * Co-Expression network figures were drawn using R package igraph. Only the top 20 genes with the highest correlations were shown. Red circle: input gene, orange circle: cell metabolism gene, sky circle: other gene |
: Open all plots for all cancer types
 |
| ||||
| AKR1B10,AKR1C1,AKR1C3,ALDH3A1,BCL2L10,C10orf99,FOXE1, GAGE12J,GAGE2B,GAGE8,GPX2,IQCF2,KRT13,KRT74, LOC285629,NKX2-4,RBMXL2,UGT1A5,VCX,VCX3A,VCY | ADH7,AKR1B10,ALDH3A1,C10orf99,CAPNS2,CYP4F3,GJB6, KRT13,KRT4,KRT6A,KRT78,KRTDAP,SOX2,SPRR1A, SPRR1B,SPRR2A,SPRR2D,SPRR3,TMPRSS11D,UGT1A7,UPK1B | ||||
 |
| ||||
| AKR1B10,AKR1B15,BTNL3,C11orf86,MIEN1,AXDND1,DHRS9, ERBB2,KRT20,MALL,MMP28,MSL1,PPP1R1B,RAPGEFL1, TCAP,TMEM54,TMEM82,TSPAN1,UGT1A1,UGT1A8,WIPF2 | ABCD3,AKR1B10,AP1AR,CROT,CRYL1,CTAGE5,ETFDH, FAM73B,FLVCR2,HADHB,KALRN,NCOA4,OCIAD2,PDXP, PRR13,RBKS,RRAS2,STK17B,TMEM139,SLC35G1,UGT1A9 |
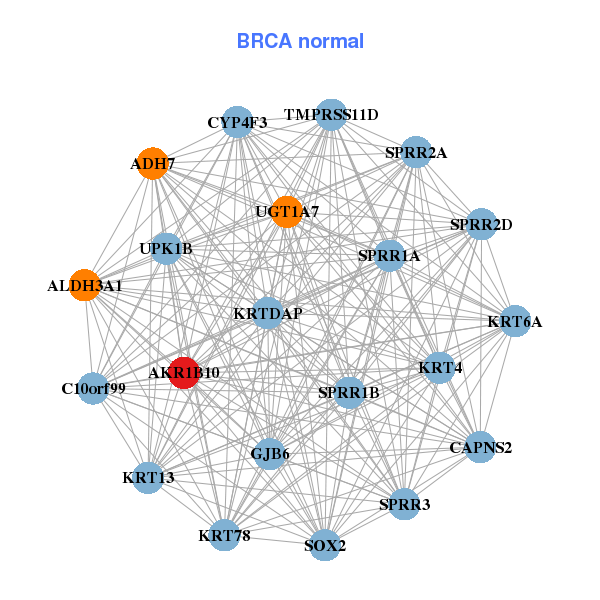
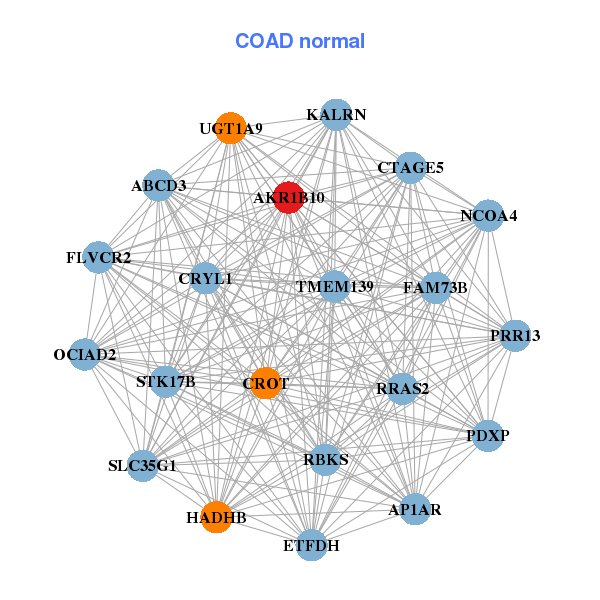
| * Co-Expression network figures were drawn using R package igraph. Only the top 20 genes with the highest correlations were shown. Red circle: input gene, orange circle: cell metabolism gene, sky circle: other gene |
: Open all plots for all cancer types
| Top |
: Open all interacting genes' information including KEGG pathway for all interacting genes from DAVID
| Top |
| Pharmacological Information for AKR1B10 |
| DB Category | DB Name | DB's ID and Url link |
| Chemistry | BindingDB | O60218; -. |
| Chemistry | ChEMBL | CHEMBL5983; -. |
| Organism-specific databases | PharmGKB | PA24676; -. |
| Organism-specific databases | CTD | 57016; -. |
| * Gene Centered Interaction Network. |
 |
| * Drug Centered Interaction Network. |
| DrugBank ID | Target Name | Drug Groups | Generic Name | Drug Centered Network | Drug Structure |
| DB02383 | aldo-keto reductase family 1, member B10 (aldose reductase) | experimental | Tolrestat | 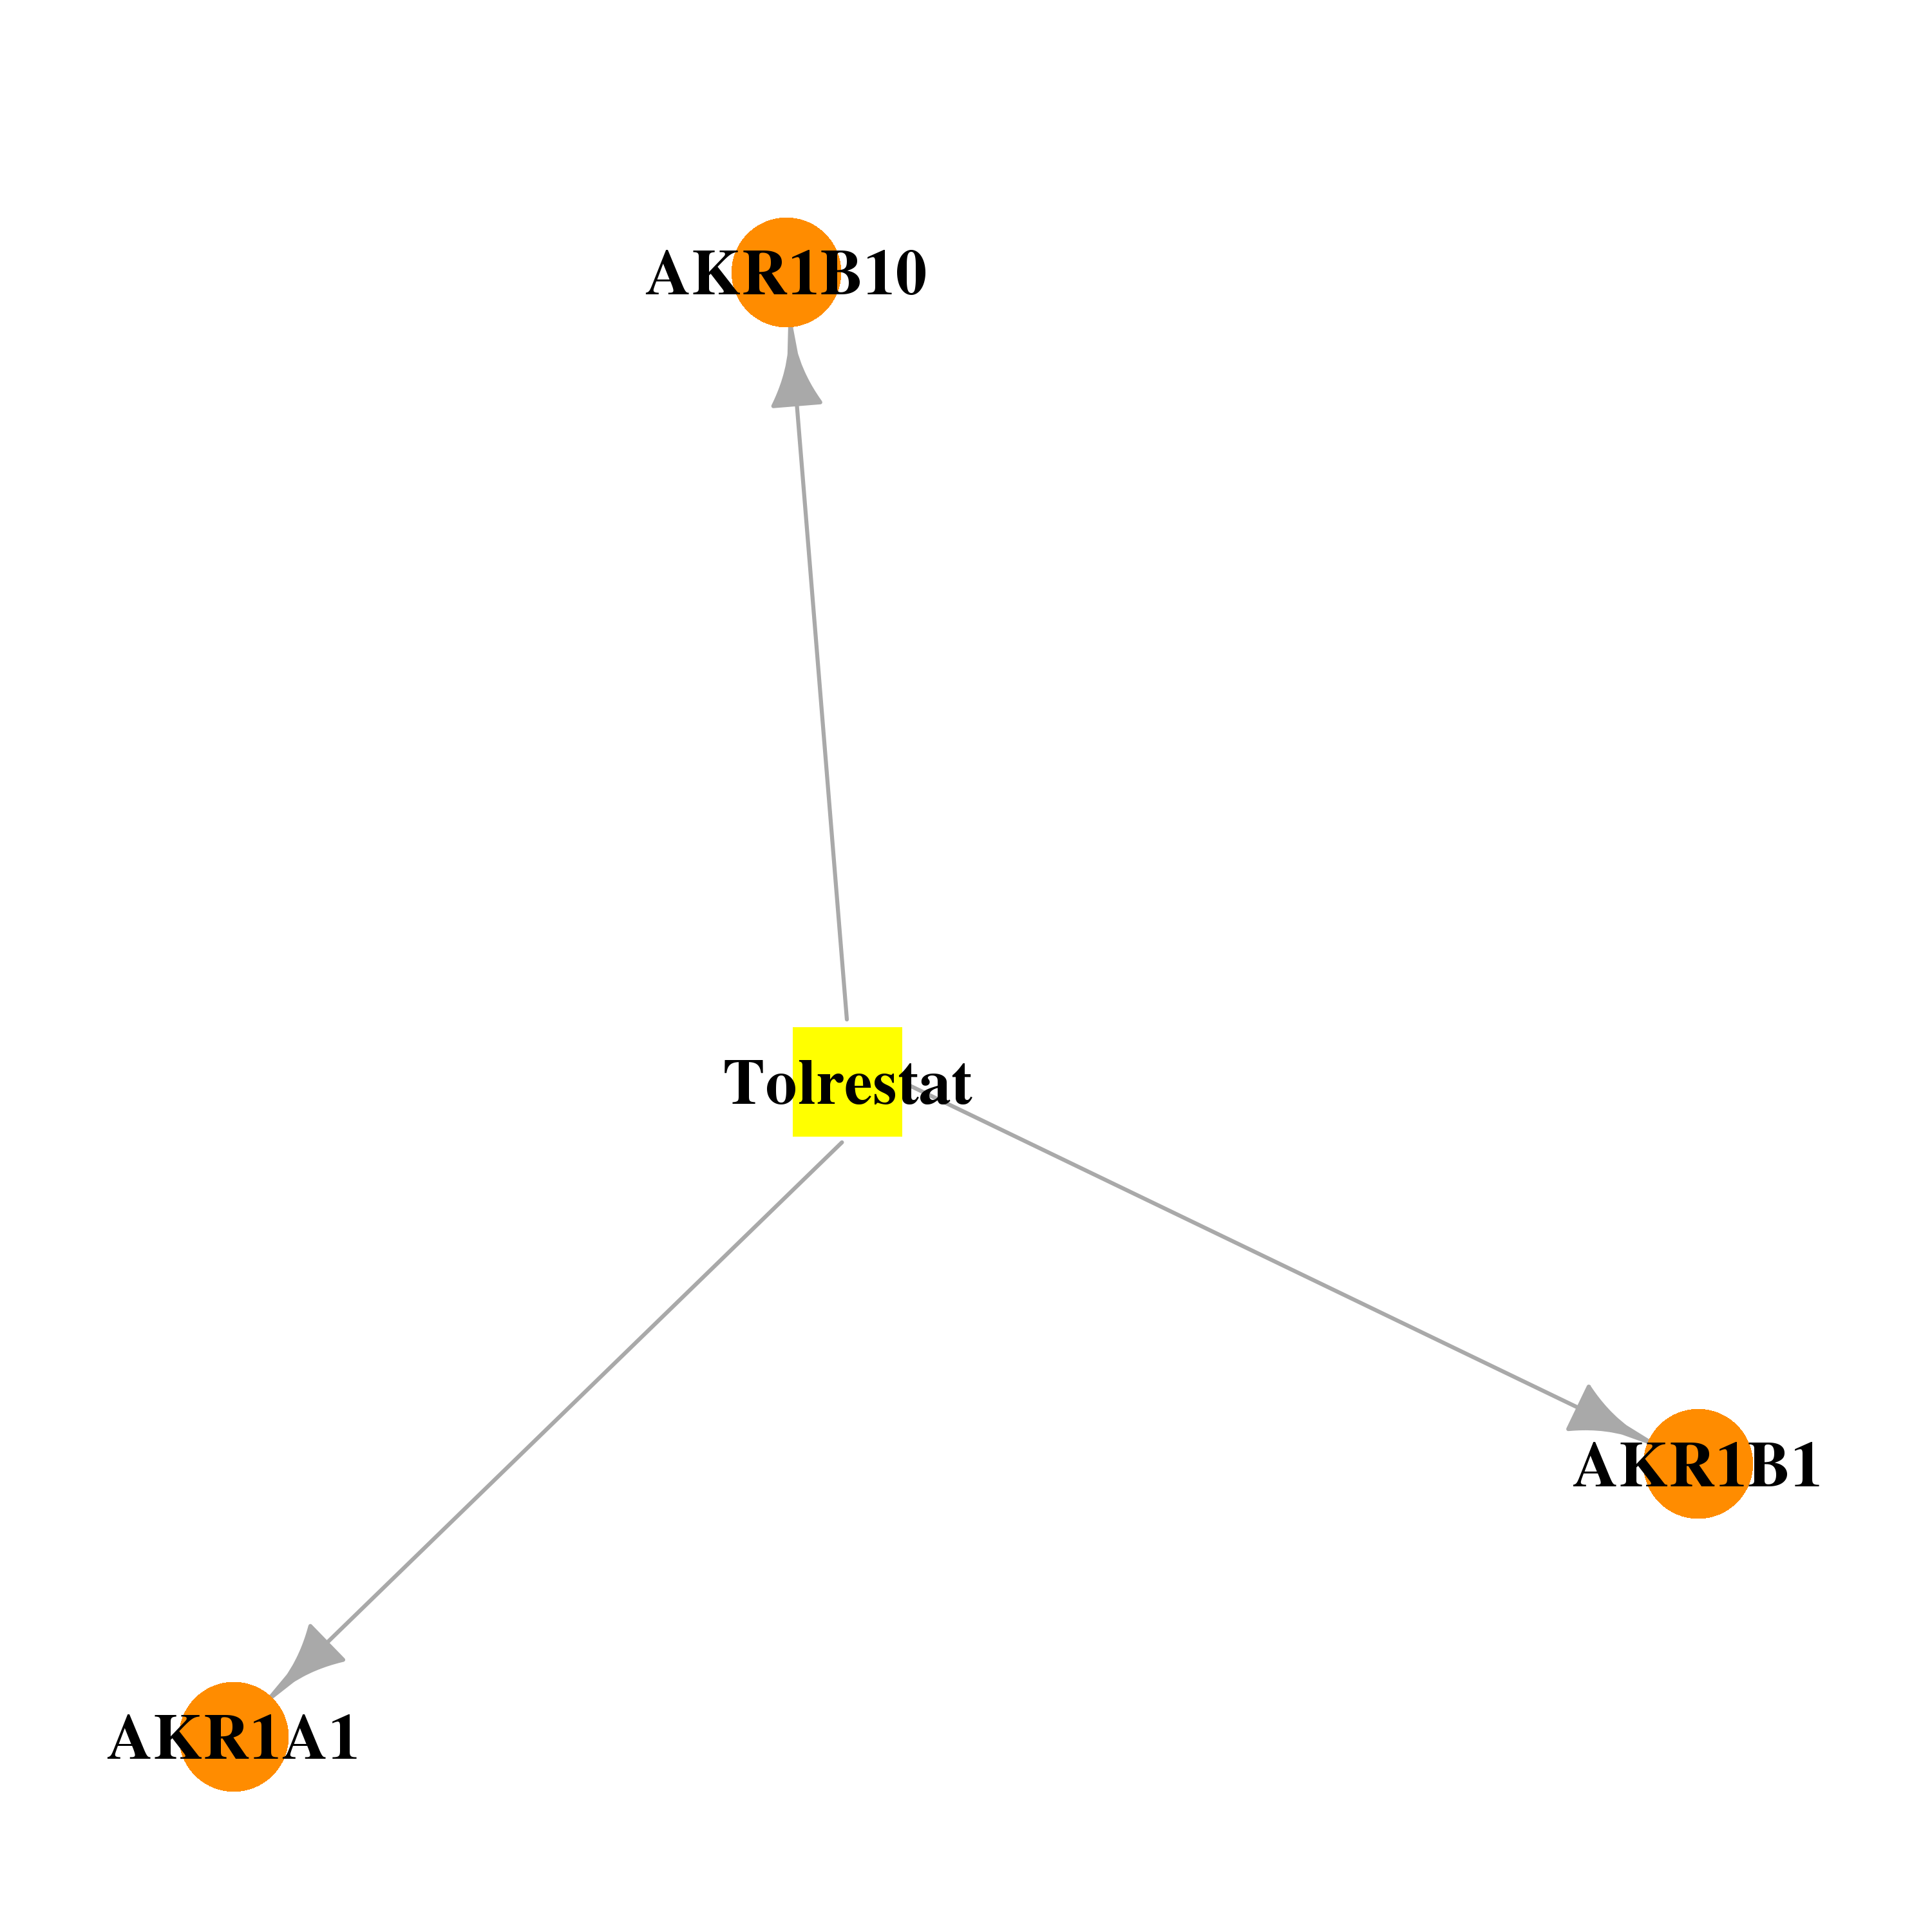 |  |
| DB03461 | aldo-keto reductase family 1, member B10 (aldose reductase) | experimental | 2'-Monophosphoadenosine 5'-Diphosphoribose | 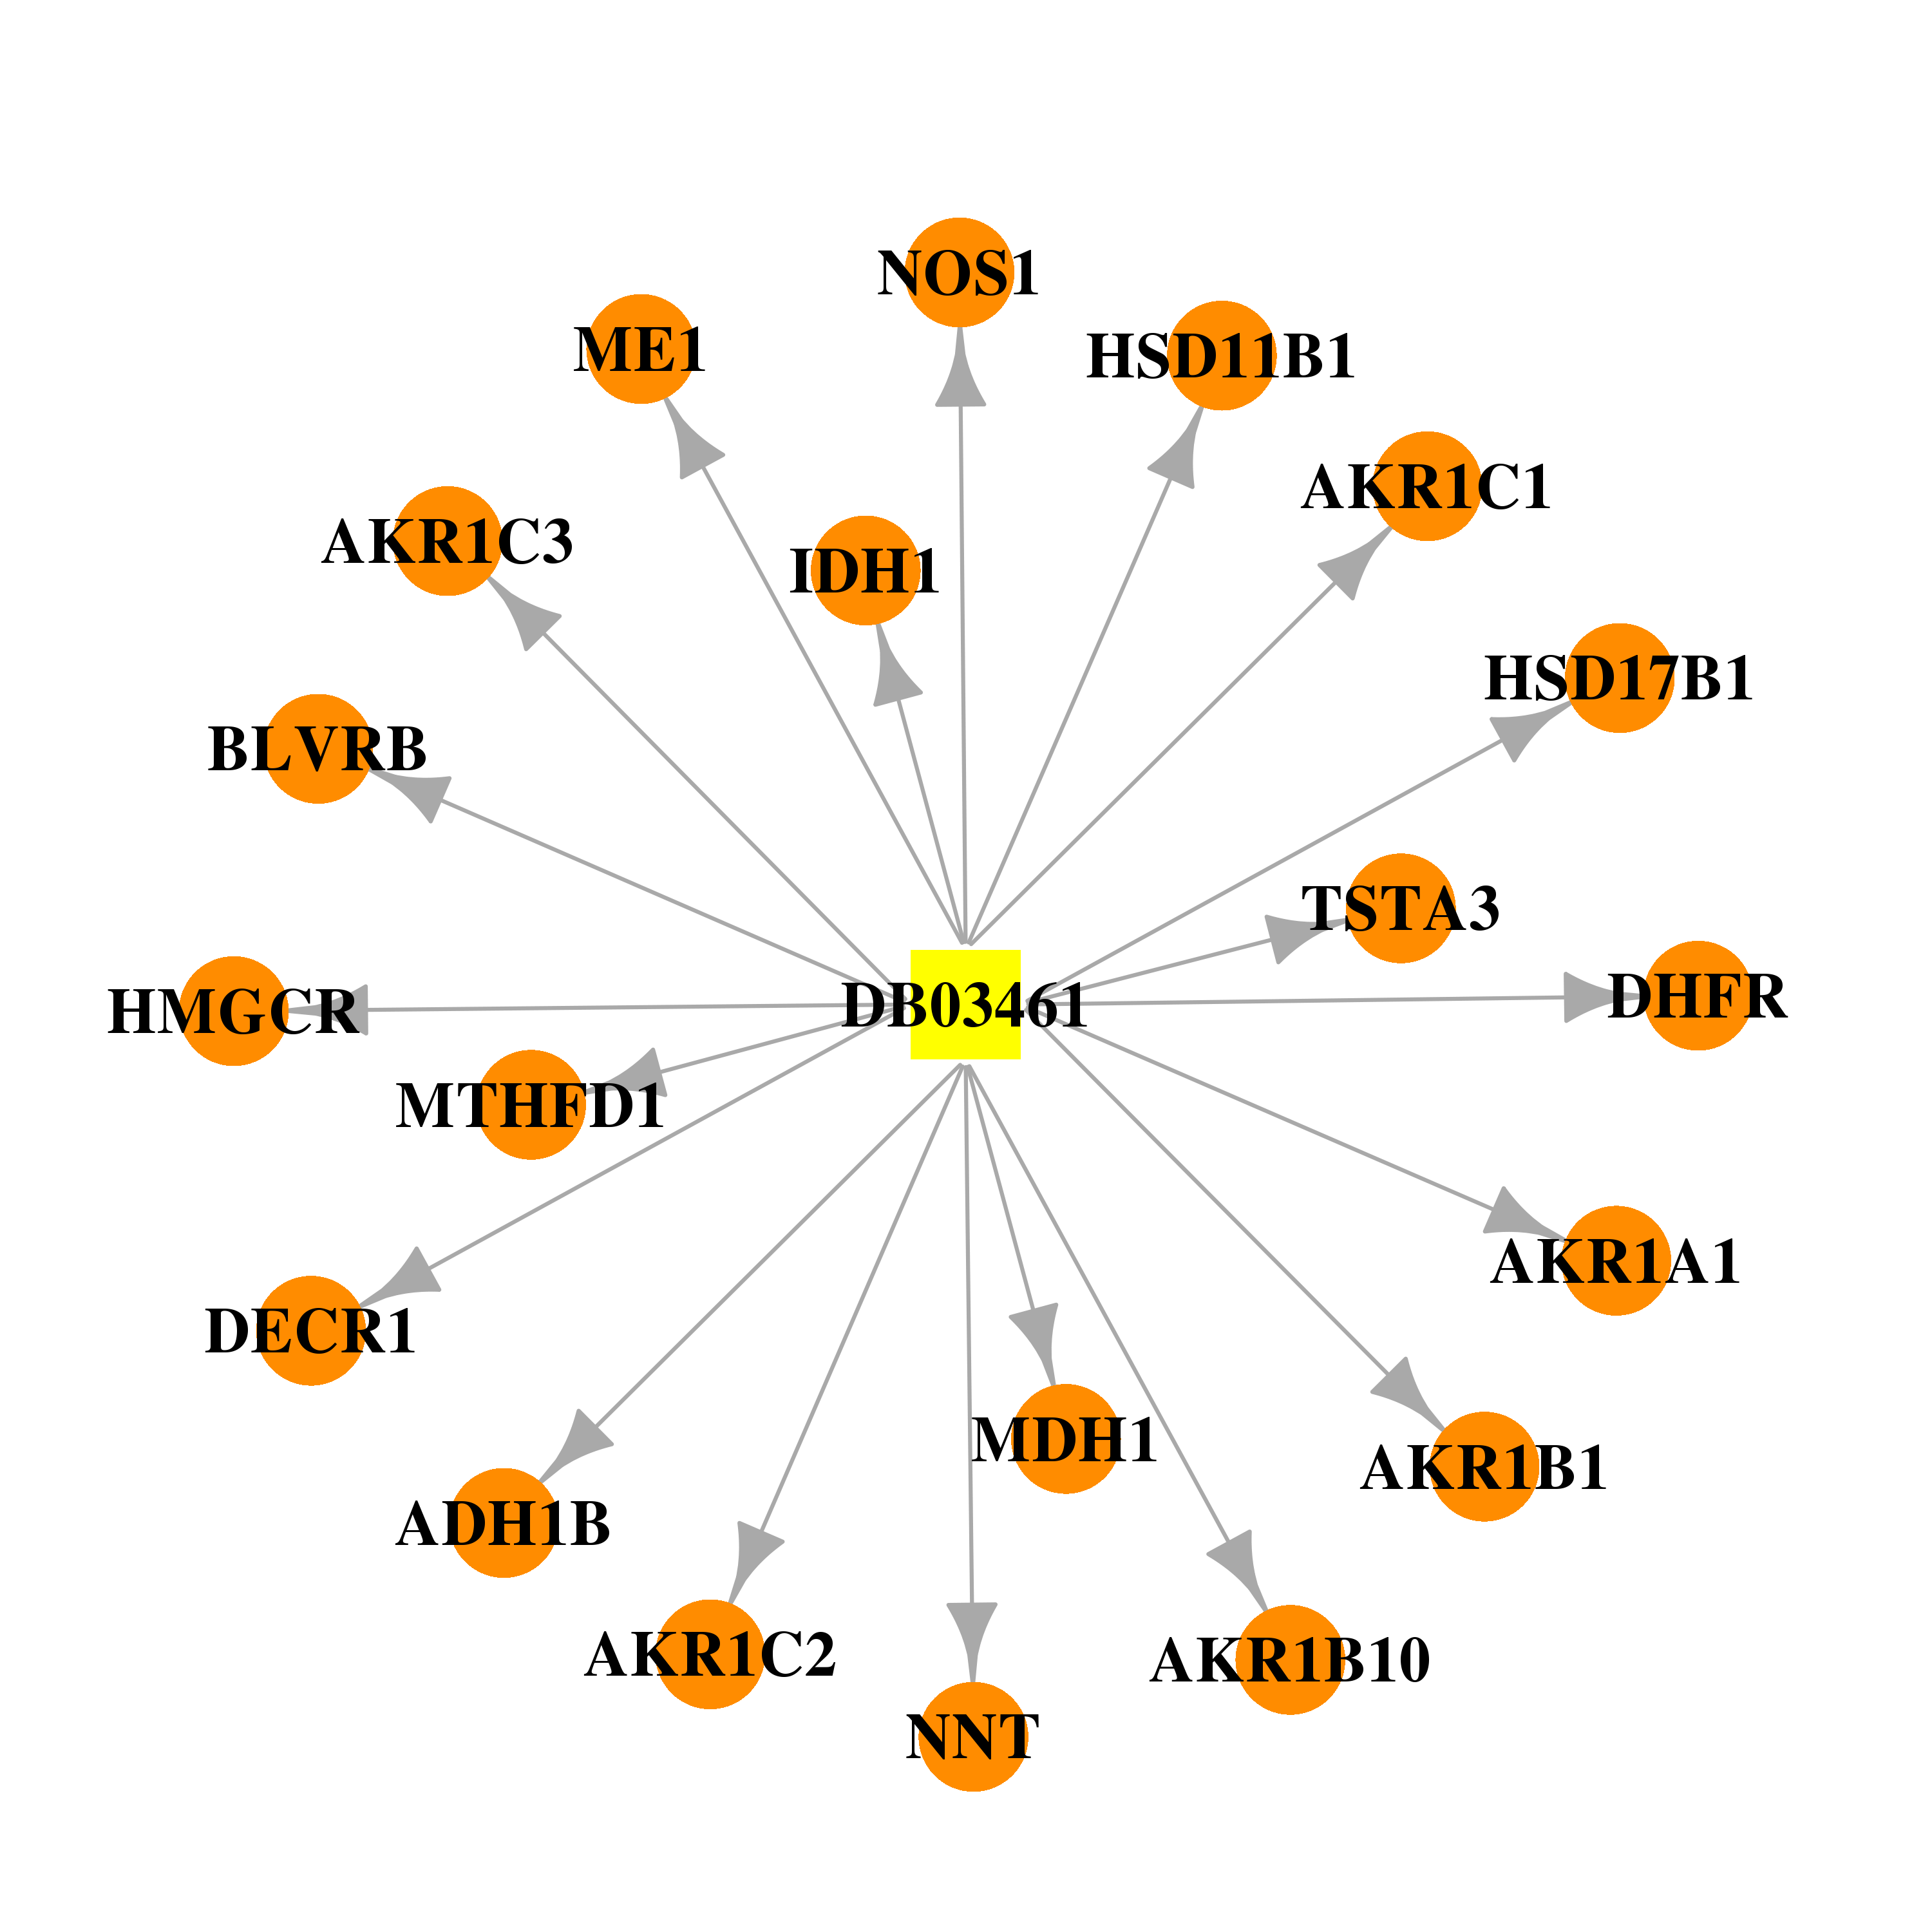 |  |
| DB08772 | aldo-keto reductase family 1, member B10 (aldose reductase) | experimental | 3,4-DIHYDRO-4-OXO-3-((5-TRIFLUOROMETHYL-2-BENZOTHIAZOLYL)METHYL)-1-PHTHALAZINE ACETIC ACID | 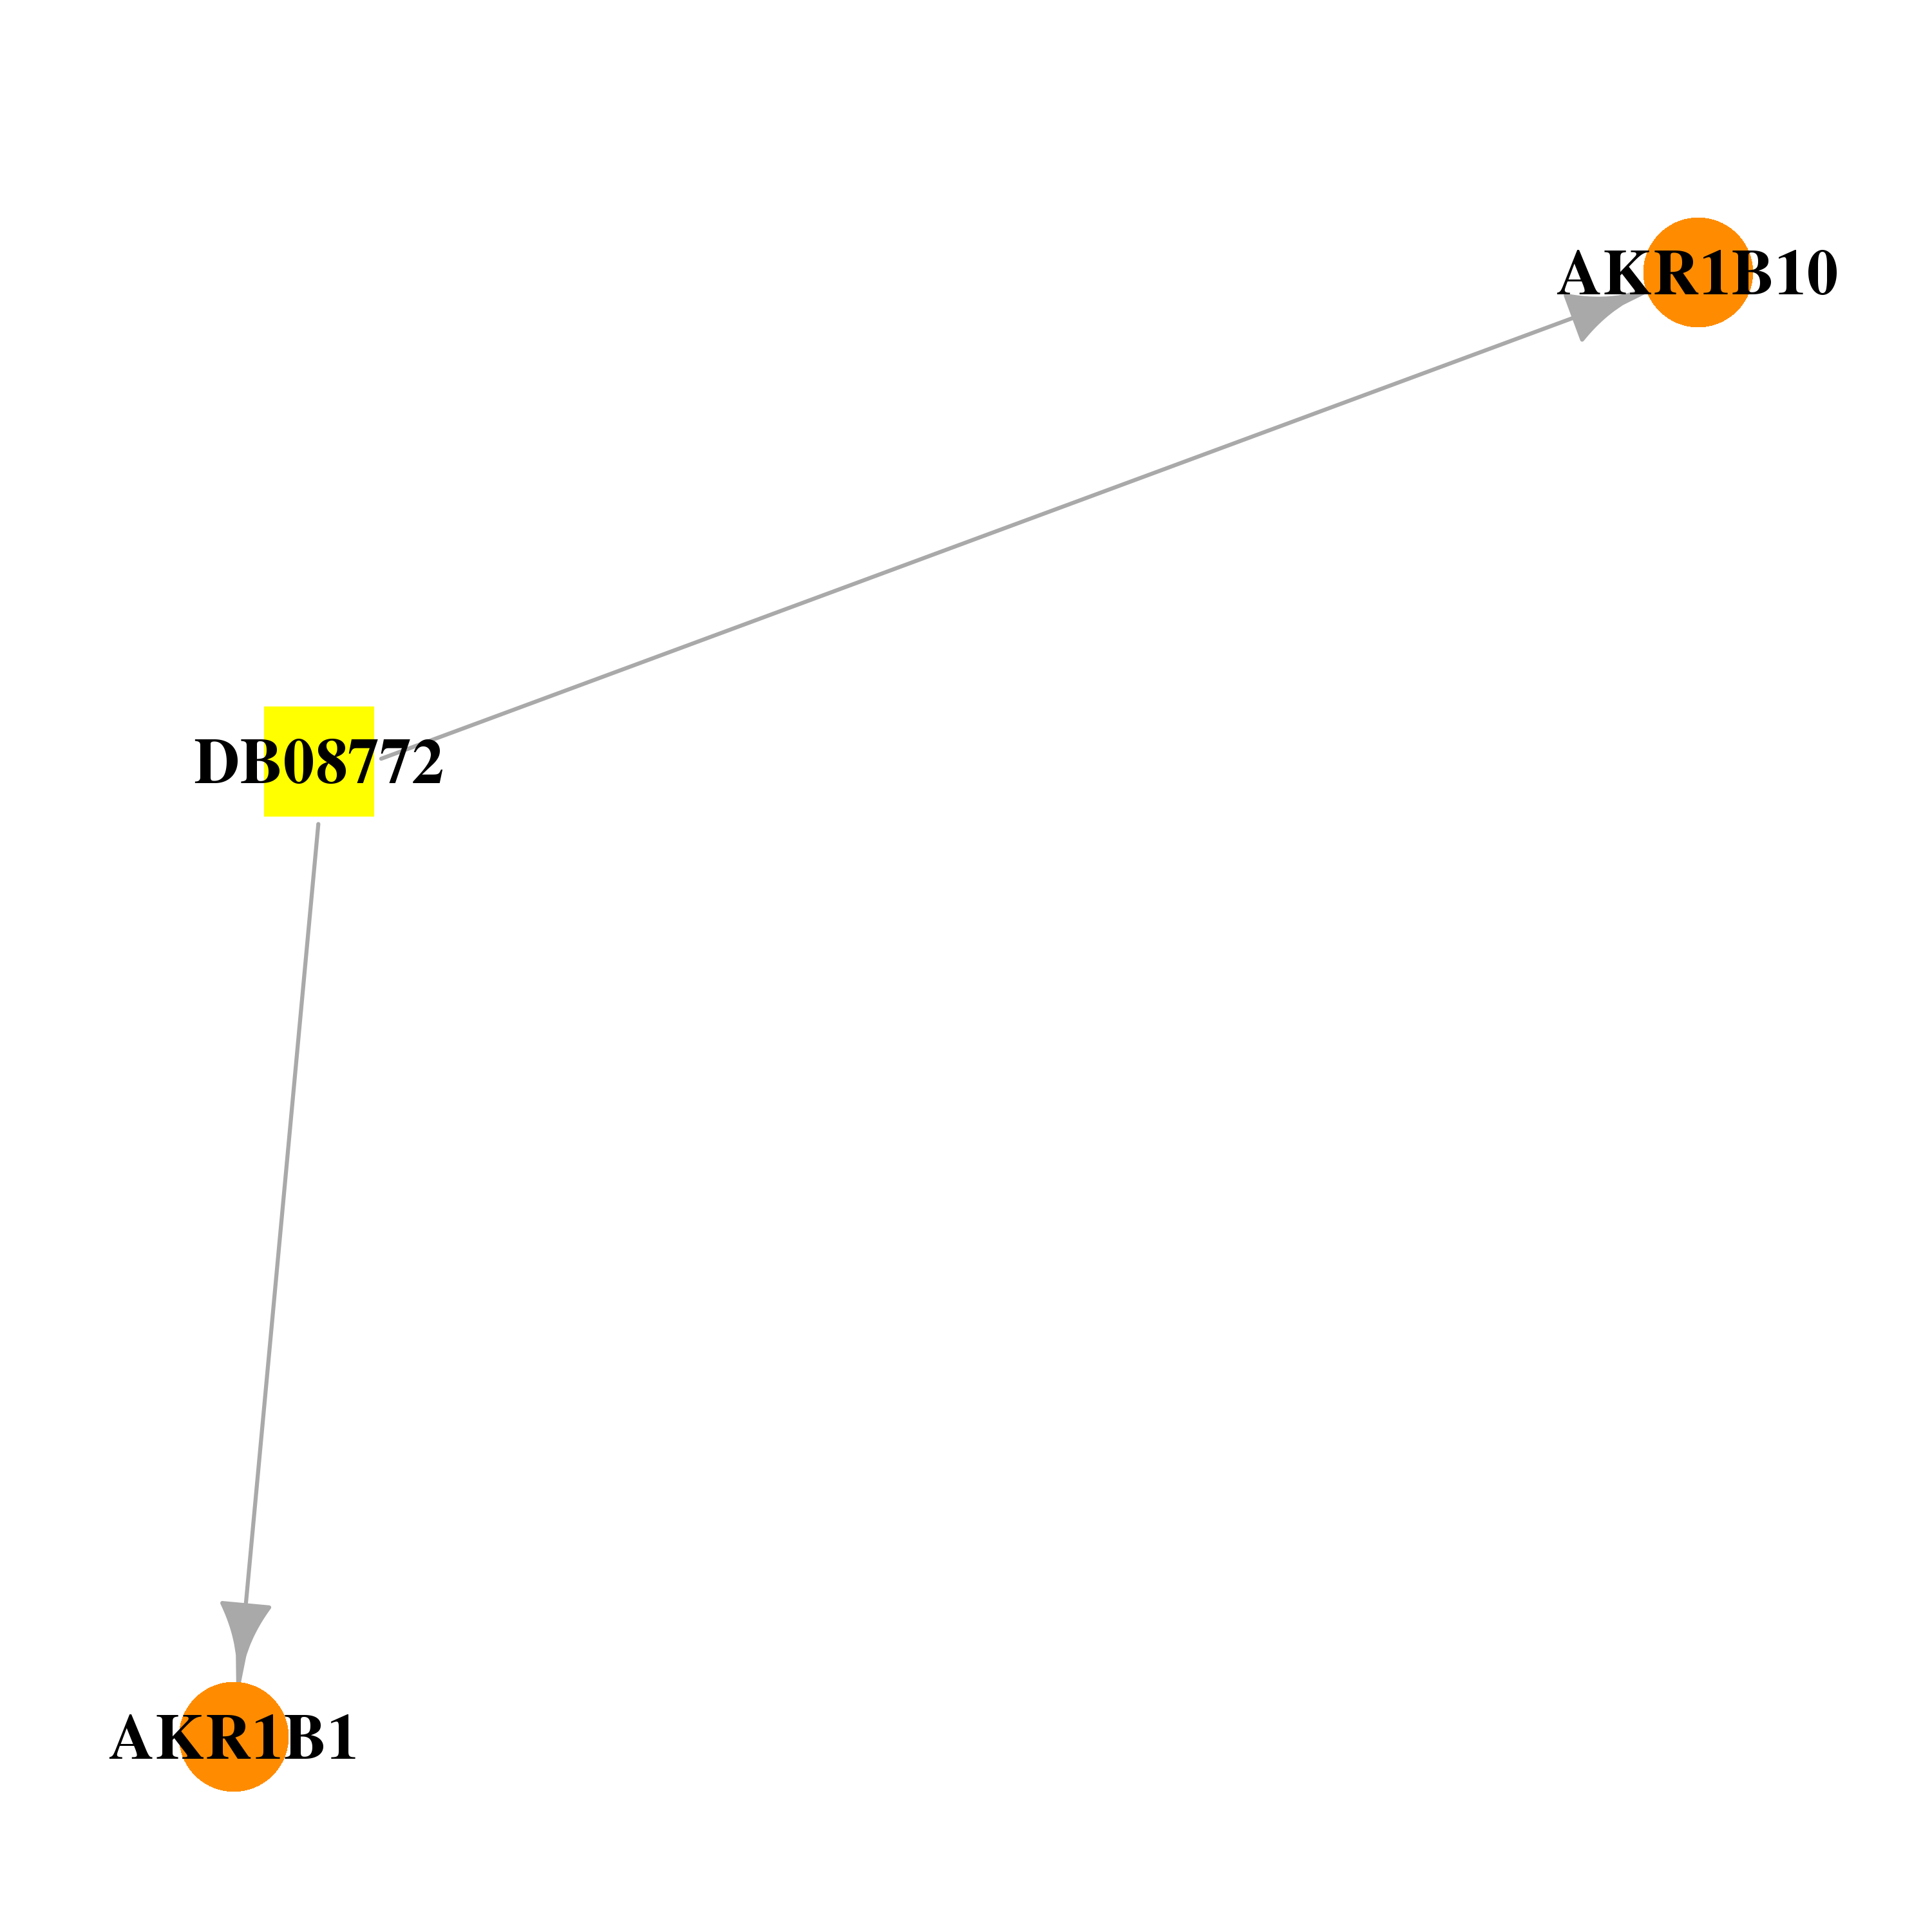 |  |
| Top |
| Cross referenced IDs for AKR1B10 |
| * We obtained these cross-references from Uniprot database. It covers 150 different DBs, 18 categories. http://www.uniprot.org/help/cross_references_section |
: Open all cross reference information
|
Copyright © 2016-Present - The Univsersity of Texas Health Science Center at Houston @ |