|
||||||||||||||||||||||||||||||||||||||||||||||||||||||||||||||||||||||||||||||||||||||||||||||||||||||||||||||||||||||||||||||||||||||||||||||||||||||||||||||||||||||||||||||||||||||||||||||||||||||||||||||||||||||||||||||||||||||||||||||||||||||||||||||||||||||||||||||||||||||||||||||||||||||||||||||||||||||||||
| |
| Phenotypic Information (metabolism pathway, cancer, disease, phenome) |
| |
| |
| Gene-Gene Network Information: Co-Expression Network, Interacting Genes & KEGG |
| |
|


| Gene Summary for MAN1C1 |
| Top |
| Phenotypic Information for MAN1C1(metabolism pathway, cancer, disease, phenome) |
| Cancer | CGAP: MAN1C1 |
| Familial Cancer Database: MAN1C1 | |
| * This gene is included in those cancer gene databases. |
|
|
|
|
|
|
| ||||||||||||||||||||||||||||||||||||||||||||||||||||||||||||||||||||||||||||||||||||||||||||||||||||||||||||||||||||||||||||||||||||||||||||||||||||||||||||||||||||||||||||||||||||||||||||||||||||||||||||||||||||||||||||||||||||||||||||||||||||||||||||||||||||||||||||||||||||||||||||||||||||||||||||||||||||
Oncogene 1 | Significant driver gene in | |||||||||||||||||||||||||||||||||||||||||||||||||||||||||||||||||||||||||||||||||||||||||||||||||||||||||||||||||||||||||||||||||||||||||||||||||||||||||||||||||||||||||||||||||||||||||||||||||||||||||||||||||||||||||||||||||||||||||||||||||||||||||||||||||||||||||||||||||||||||||||||||||||||||||||||||||||||||||
| cf) number; DB name 1 Oncogene; http://nar.oxfordjournals.org/content/35/suppl_1/D721.long, 2 Tumor Suppressor gene; https://bioinfo.uth.edu/TSGene/, 3 Cancer Gene Census; http://www.nature.com/nrc/journal/v4/n3/abs/nrc1299.html, 4 CancerGenes; http://nar.oxfordjournals.org/content/35/suppl_1/D721.long, 5 Network of Cancer Gene; http://ncg.kcl.ac.uk/index.php, 1Therapeutic Vulnerabilities in Cancer; http://cbio.mskcc.org/cancergenomics/statius/ |
| REACTOME_METABOLISM_OF_PROTEINS | |
| OMIM | |
| Orphanet | |
| Disease | KEGG Disease: MAN1C1 |
| MedGen: MAN1C1 (Human Medical Genetics with Condition) | |
| ClinVar: MAN1C1 | |
| Phenotype | MGI: MAN1C1 (International Mouse Phenotyping Consortium) |
| PhenomicDB: MAN1C1 | |
| Mutations for MAN1C1 |
| * Under tables are showing count per each tissue to give us broad intuition about tissue specific mutation patterns.You can go to the detailed page for each mutation database's web site. |
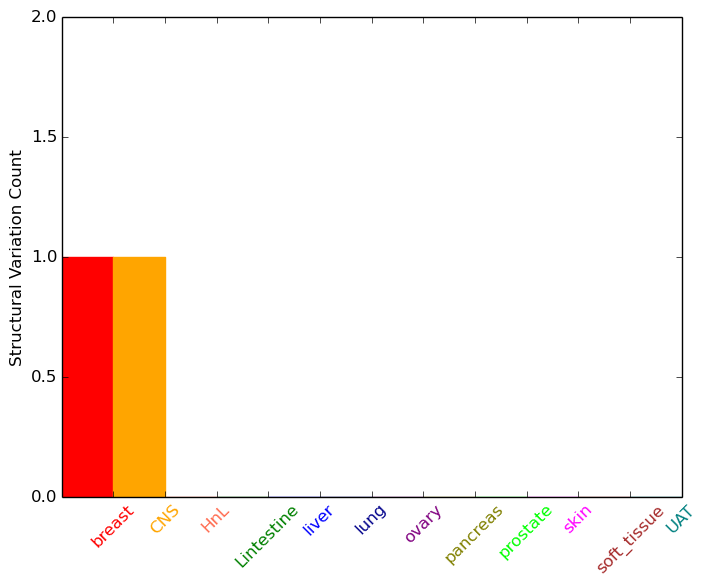
| - Statistics for Tissue and Mutation type | Top |
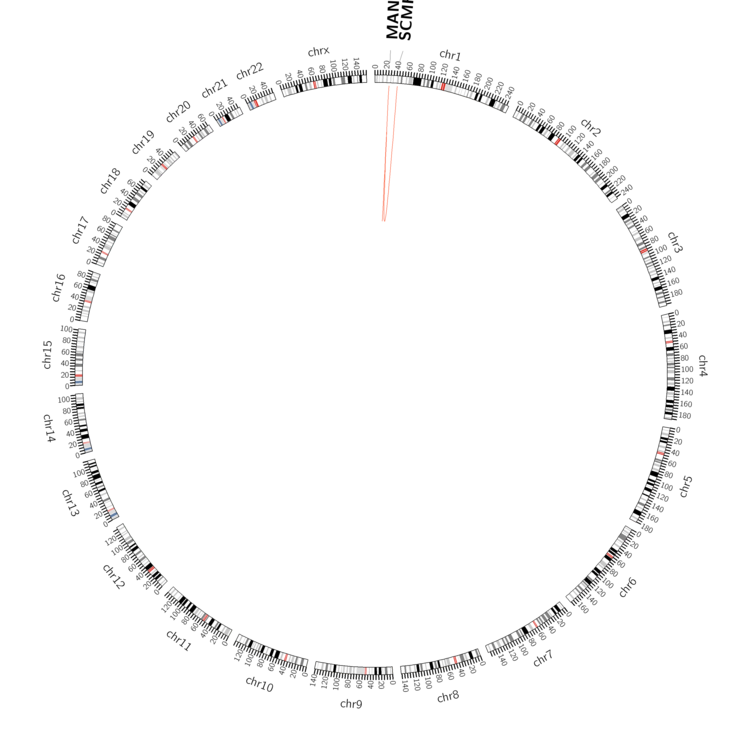 |
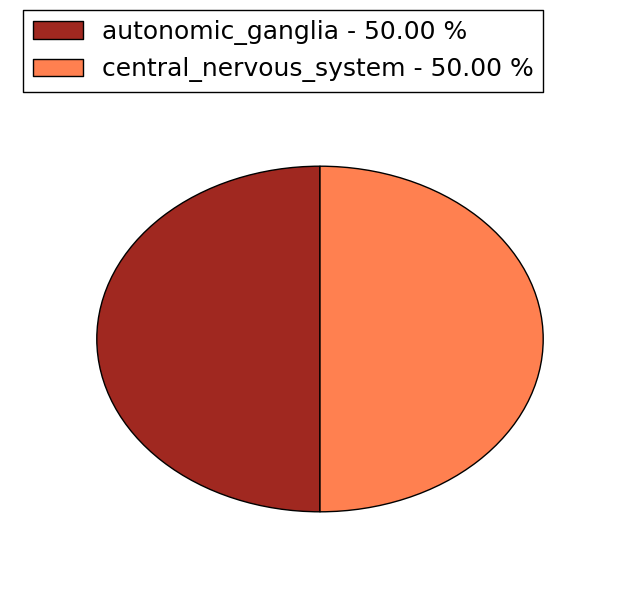
| - For Inter-chromosomal Variations |
| There's no inter-chromosomal structural variation. |
| - For Intra-chromosomal Variations |
| * Intra-chromosomal variantions includes 'intrachromosomal amplicon to amplicon', 'intrachromosomal amplicon to non-amplified dna', 'intrachromosomal deletion', 'intrachromosomal fold-back inversion', 'intrachromosomal inversion', 'intrachromosomal tandem duplication', 'Intrachromosomal unknown type', 'intrachromosomal with inverted orientation', 'intrachromosomal with non-inverted orientation'. |
 |
| Sample | Symbol_a | Chr_a | Start_a | End_a | Symbol_b | Chr_b | Start_b | End_b |
| breast | MAN1C1 | chr1 | 26081668 | 26081668 | SCMH1 | chr1 | 41579950 | 41579950 |
| central_nervous_system | MAN1C1 | chr1 | 26094329 | 26094329 | MAN1C1 | chr1 | 26094843 | 26094843 |
| cf) Tissue number; Tissue name (1;Breast, 2;Central_nervous_system, 3;Haematopoietic_and_lymphoid_tissue, 4;Large_intestine, 5;Liver, 6;Lung, 7;Ovary, 8;Pancreas, 9;Prostate, 10;Skin, 11;Soft_tissue, 12;Upper_aerodigestive_tract) |
| * From mRNA Sanger sequences, Chitars2.0 arranged chimeric transcripts. This table shows MAN1C1 related fusion information. |
| ID | Head Gene | Tail Gene | Accession | Gene_a | qStart_a | qEnd_a | Chromosome_a | tStart_a | tEnd_a | Gene_a | qStart_a | qEnd_a | Chromosome_a | tStart_a | tEnd_a |
| BI036406 | MAN1C1 | 14 | 123 | 1 | 26034333 | 26034445 | THTPA | 119 | 323 | 14 | 24026315 | 24026519 | |
| AF318353 | RNF145 | 17 | 1046 | 5 | 158623238 | 158624266 | MAN1C1 | 1047 | 3676 | 1 | 25944341 | 26110941 | |
| Top |
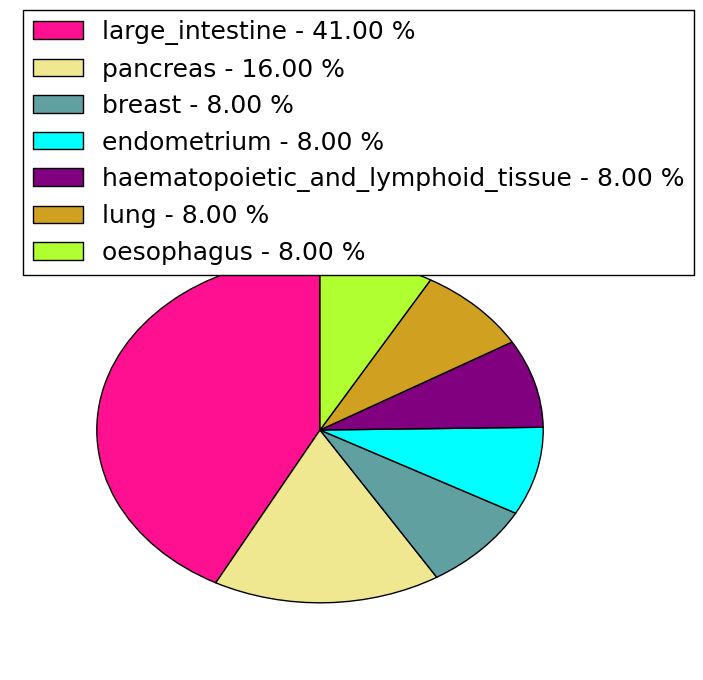
| Mutation type/ Tissue ID | brca | cns | cerv | endome | haematopo | kidn | Lintest | liver | lung | ns | ovary | pancre | prost | skin | stoma | thyro | urina | |||
| Total # sample | 1 | |||||||||||||||||||
| GAIN (# sample) | 1 | |||||||||||||||||||
| LOSS (# sample) |
| cf) Tissue ID; Tissue type (1; Breast, 2; Central_nervous_system, 3; Cervix, 4; Endometrium, 5; Haematopoietic_and_lymphoid_tissue, 6; Kidney, 7; Large_intestine, 8; Liver, 9; Lung, 10; NS, 11; Ovary, 12; Pancreas, 13; Prostate, 14; Skin, 15; Stomach, 16; Thyroid, 17; Urinary_tract) |
| Top |
|
 |
| Top |
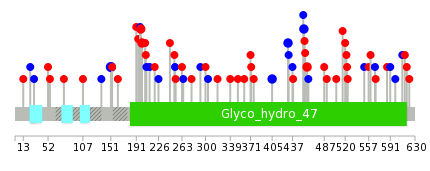
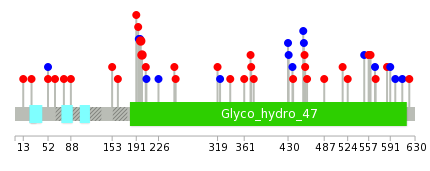
| Stat. for Non-Synonymous SNVs (# total SNVs=33) | (# total SNVs=12) |
 |  |
(# total SNVs=0) | (# total SNVs=2) |
 |
| Top |
| * When you move the cursor on each content, you can see more deailed mutation information on the Tooltip. Those are primary_site,primary_histology,mutation(aa),pubmedID. |
| GRCh37 position | Mutation(aa) | Unique sampleID count |
| chr1:25944741-25944741 | p.R151R | 3 |
| chr1:26012982-26012982 | p.E198K | 2 |
| chr1:26104797-26104797 | p.E487K | 2 |
| chr1:26012988-26012988 | p.R200C | 2 |
| chr1:26104628-26104628 | p.P430P | 2 |
| chr1:26104703-26104703 | p.S455S | 2 |
| chr1:26098221-26098221 | p.K405K | 2 |
| chr1:26104716-26104716 | p.A460T | 2 |
| chr1:26104595-26104595 | p.? | 1 |
| chr1:26073275-26073275 | p.? | 1 |
| Top |
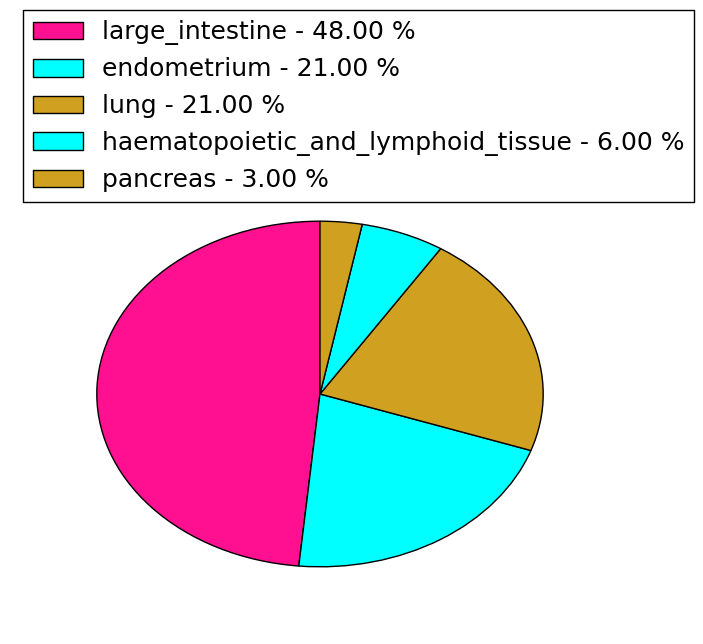
|
 |
| Point Mutation/ Tissue ID | 1 | 2 | 3 | 4 | 5 | 6 | 7 | 8 | 9 | 10 | 11 | 12 | 13 | 14 | 15 | 16 | 17 | 18 | 19 | 20 |
| # sample | 3 | 11 | 3 | 2 | 4 | 8 | 7 | 7 | ||||||||||||
| # mutation | 3 | 12 | 4 | 2 | 4 | 12 | 7 | 7 | ||||||||||||
| nonsynonymous SNV | 3 | 10 | 2 | 2 | 3 | 7 | 2 | 6 | ||||||||||||
| synonymous SNV | 2 | 2 | 1 | 5 | 5 | 1 |
| cf) Tissue ID; Tissue type (1; BLCA[Bladder Urothelial Carcinoma], 2; BRCA[Breast invasive carcinoma], 3; CESC[Cervical squamous cell carcinoma and endocervical adenocarcinoma], 4; COAD[Colon adenocarcinoma], 5; GBM[Glioblastoma multiforme], 6; Glioma Low Grade, 7; HNSC[Head and Neck squamous cell carcinoma], 8; KICH[Kidney Chromophobe], 9; KIRC[Kidney renal clear cell carcinoma], 10; KIRP[Kidney renal papillary cell carcinoma], 11; LAML[Acute Myeloid Leukemia], 12; LUAD[Lung adenocarcinoma], 13; LUSC[Lung squamous cell carcinoma], 14; OV[Ovarian serous cystadenocarcinoma ], 15; PAAD[Pancreatic adenocarcinoma], 16; PRAD[Prostate adenocarcinoma], 17; SKCM[Skin Cutaneous Melanoma], 18:STAD[Stomach adenocarcinoma], 19:THCA[Thyroid carcinoma], 20:UCEC[Uterine Corpus Endometrial Carcinoma]) |
| Top |
| * We represented just top 10 SNVs. When you move the cursor on each content, you can see more deailed mutation information on the Tooltip. Those are primary_site, primary_histology, mutation(aa), pubmedID. |
| Genomic Position | Mutation(aa) | Unique sampleID count |
| chr1:26012982 | p.E198K,MAN1C1 | 2 |
| chr1:26012988 | p.R200C,MAN1C1 | 2 |
| chr1:26073199 | p.M194I,MAN1C1 | 1 |
| chr1:26110248 | p.G376R,MAN1C1 | 1 |
| chr1:26104631 | p.A560T,MAN1C1 | 1 |
| chr1:26107603 | p.G195G,MAN1C1 | 1 |
| chr1:25944746 | p.P430P,MAN1C1 | 1 |
| chr1:26073272 | p.D567D,MAN1C1 | 1 |
| chr1:26104649 | p.N197N,MAN1C1 | 1 |
| chr1:26109095 | p.G431G,MAN1C1 | 1 |
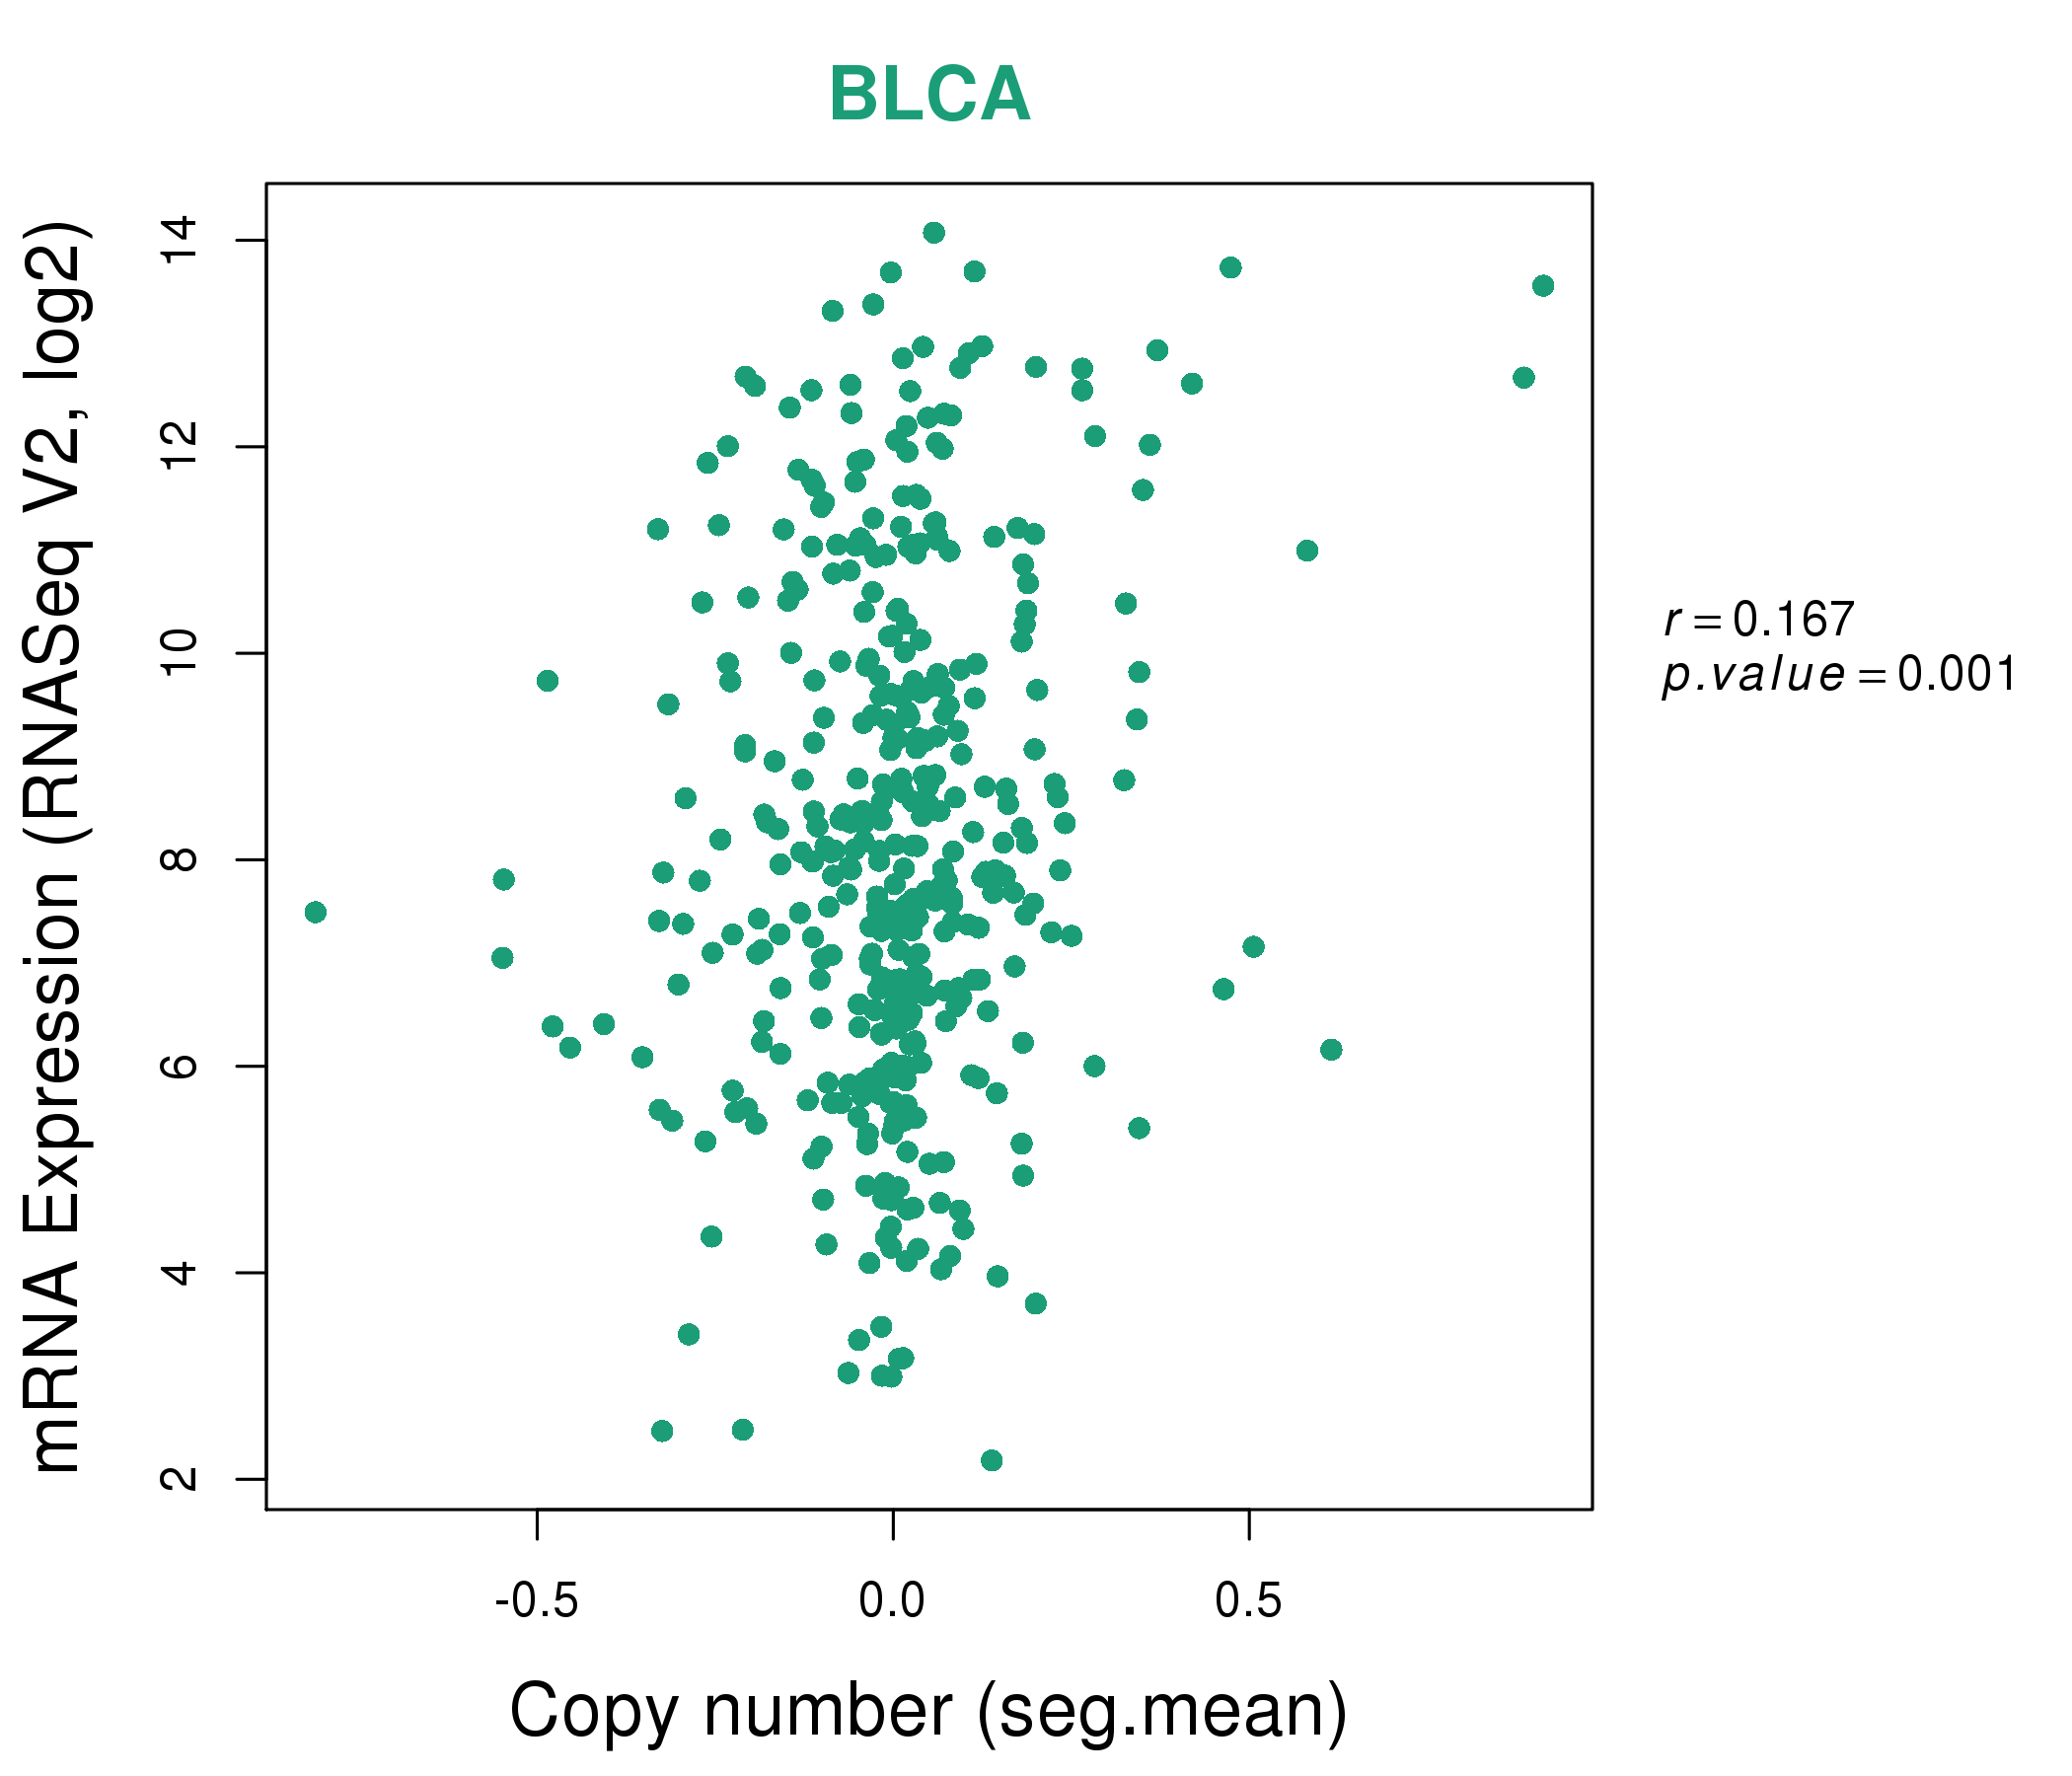
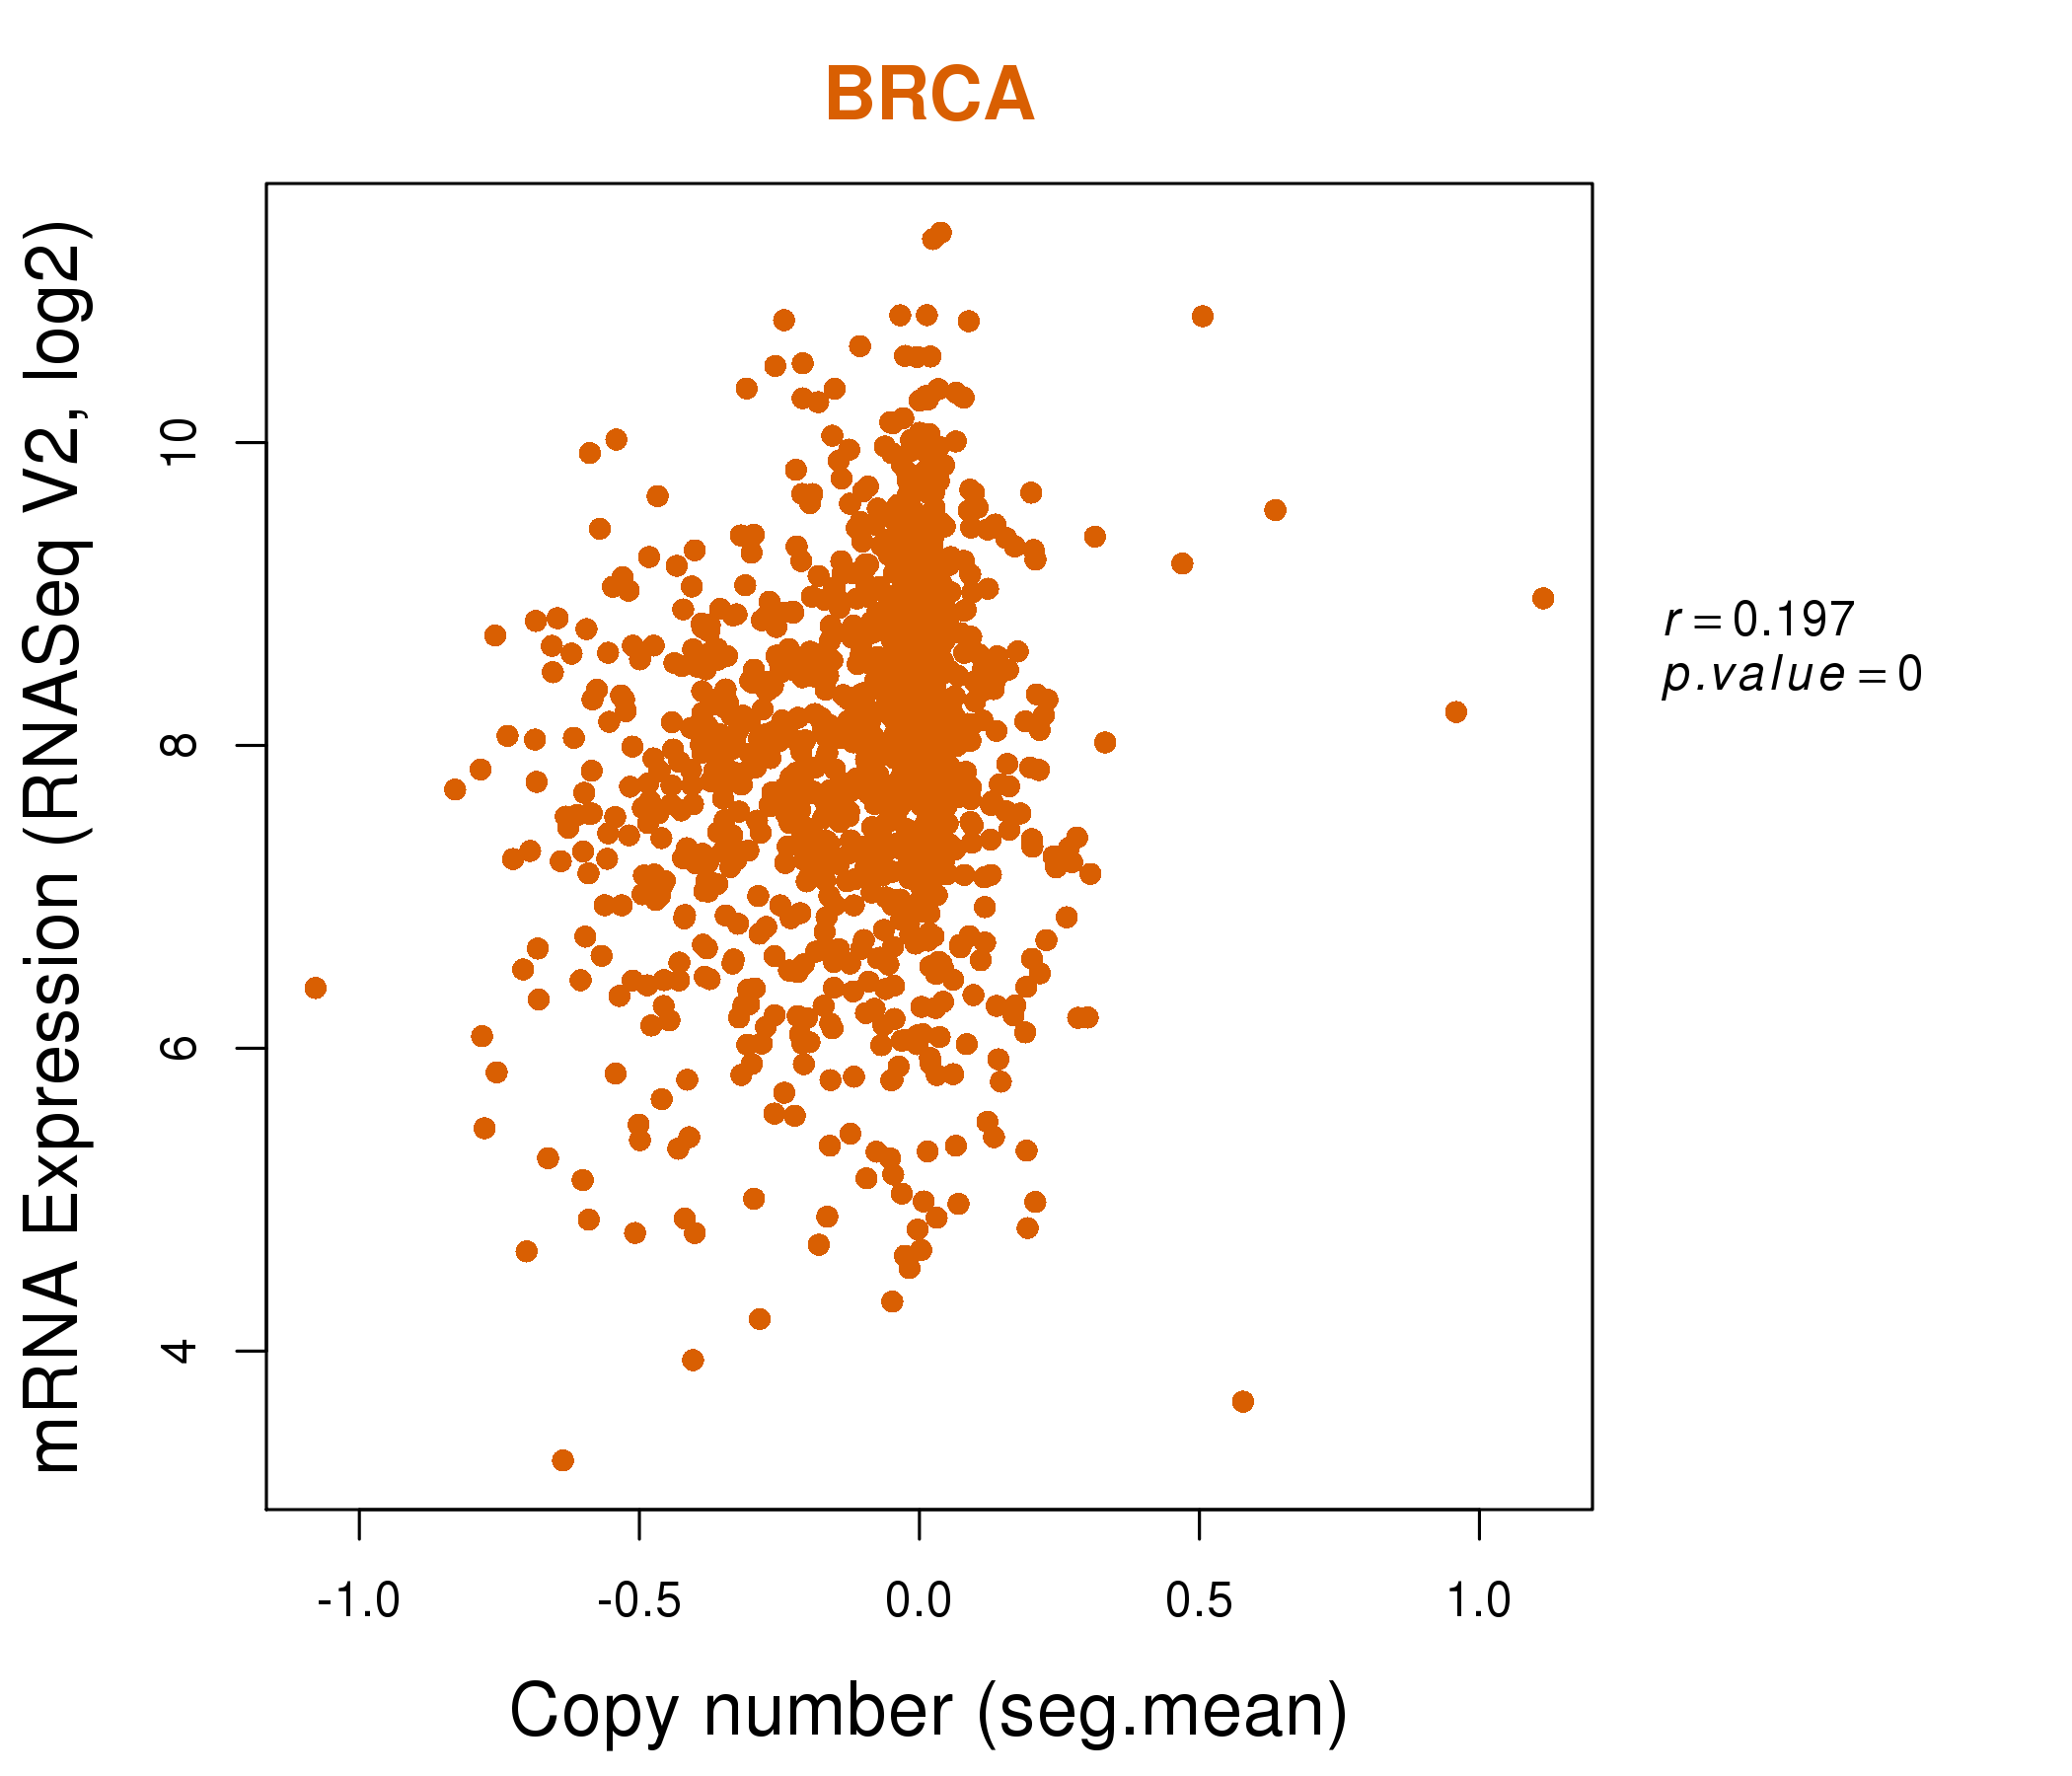
| * Copy number data were extracted from TCGA using R package TCGA-Assembler. The URLs of all public data files on TCGA DCC data server were gathered on Jan-05-2015. Function ProcessCNAData in TCGA-Assembler package was used to obtain gene-level copy number value which is calculated as the average copy number of the genomic region of a gene. |
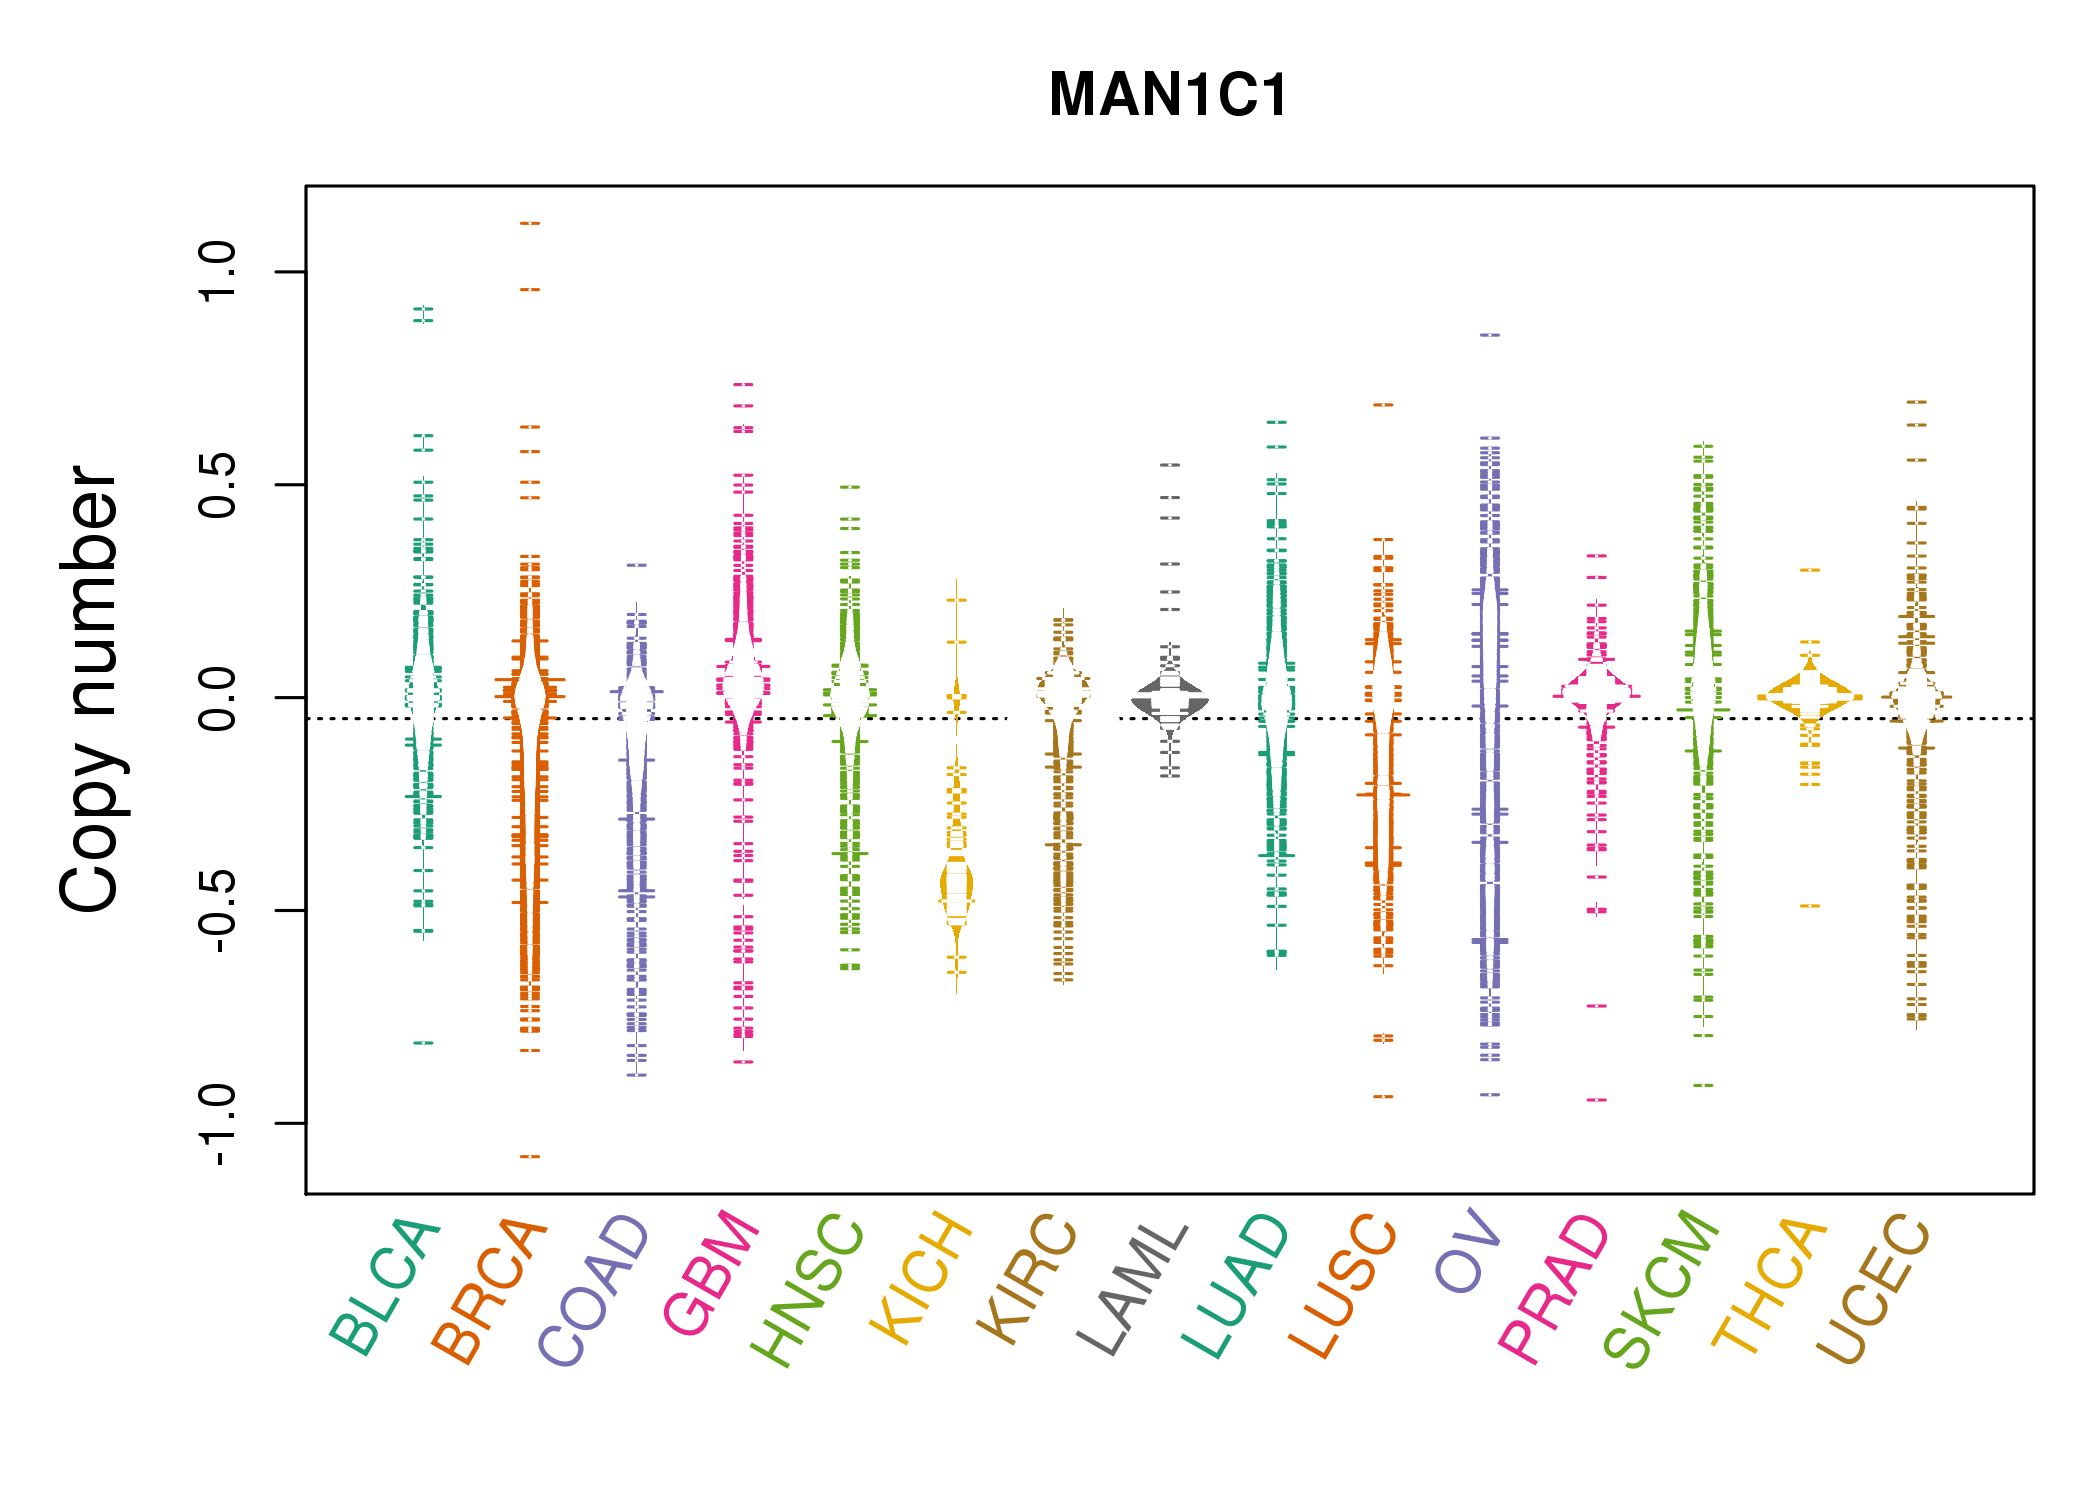 |
| cf) Tissue ID[Tissue type]: BLCA[Bladder Urothelial Carcinoma], BRCA[Breast invasive carcinoma], CESC[Cervical squamous cell carcinoma and endocervical adenocarcinoma], COAD[Colon adenocarcinoma], GBM[Glioblastoma multiforme], Glioma Low Grade, HNSC[Head and Neck squamous cell carcinoma], KICH[Kidney Chromophobe], KIRC[Kidney renal clear cell carcinoma], KIRP[Kidney renal papillary cell carcinoma], LAML[Acute Myeloid Leukemia], LUAD[Lung adenocarcinoma], LUSC[Lung squamous cell carcinoma], OV[Ovarian serous cystadenocarcinoma ], PAAD[Pancreatic adenocarcinoma], PRAD[Prostate adenocarcinoma], SKCM[Skin Cutaneous Melanoma], STAD[Stomach adenocarcinoma], THCA[Thyroid carcinoma], UCEC[Uterine Corpus Endometrial Carcinoma] |
| Top |
| Gene Expression for MAN1C1 |
| * CCLE gene expression data were extracted from CCLE_Expression_Entrez_2012-10-18.res: Gene-centric RMA-normalized mRNA expression data. |
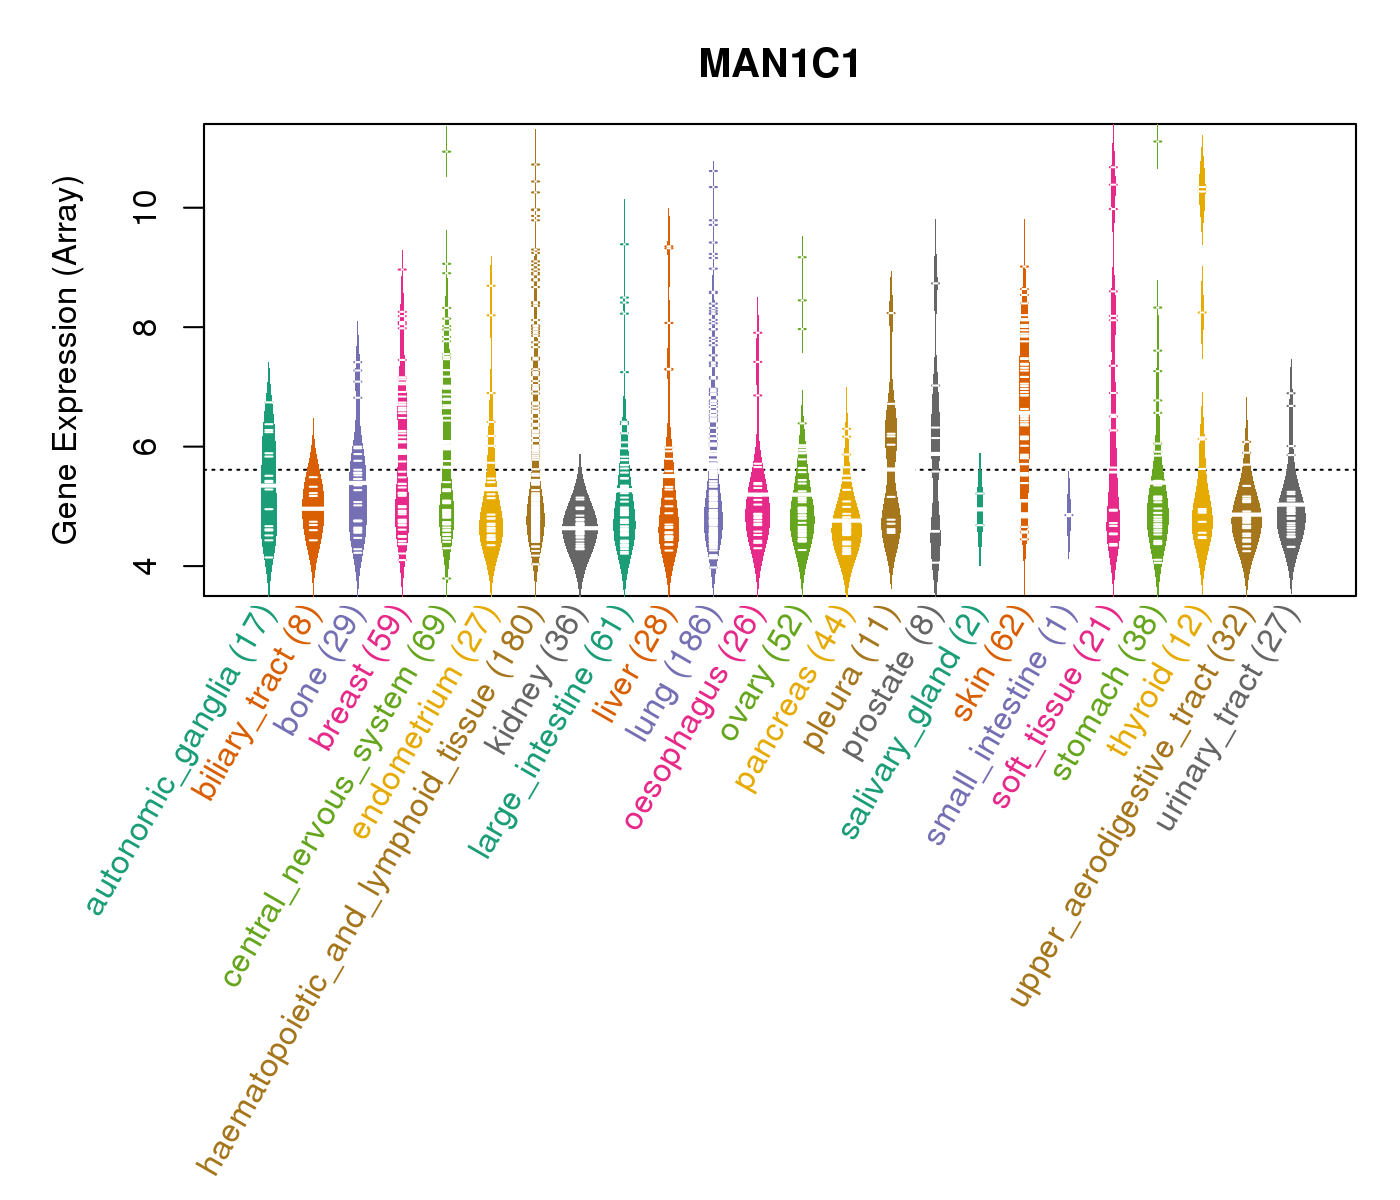 |
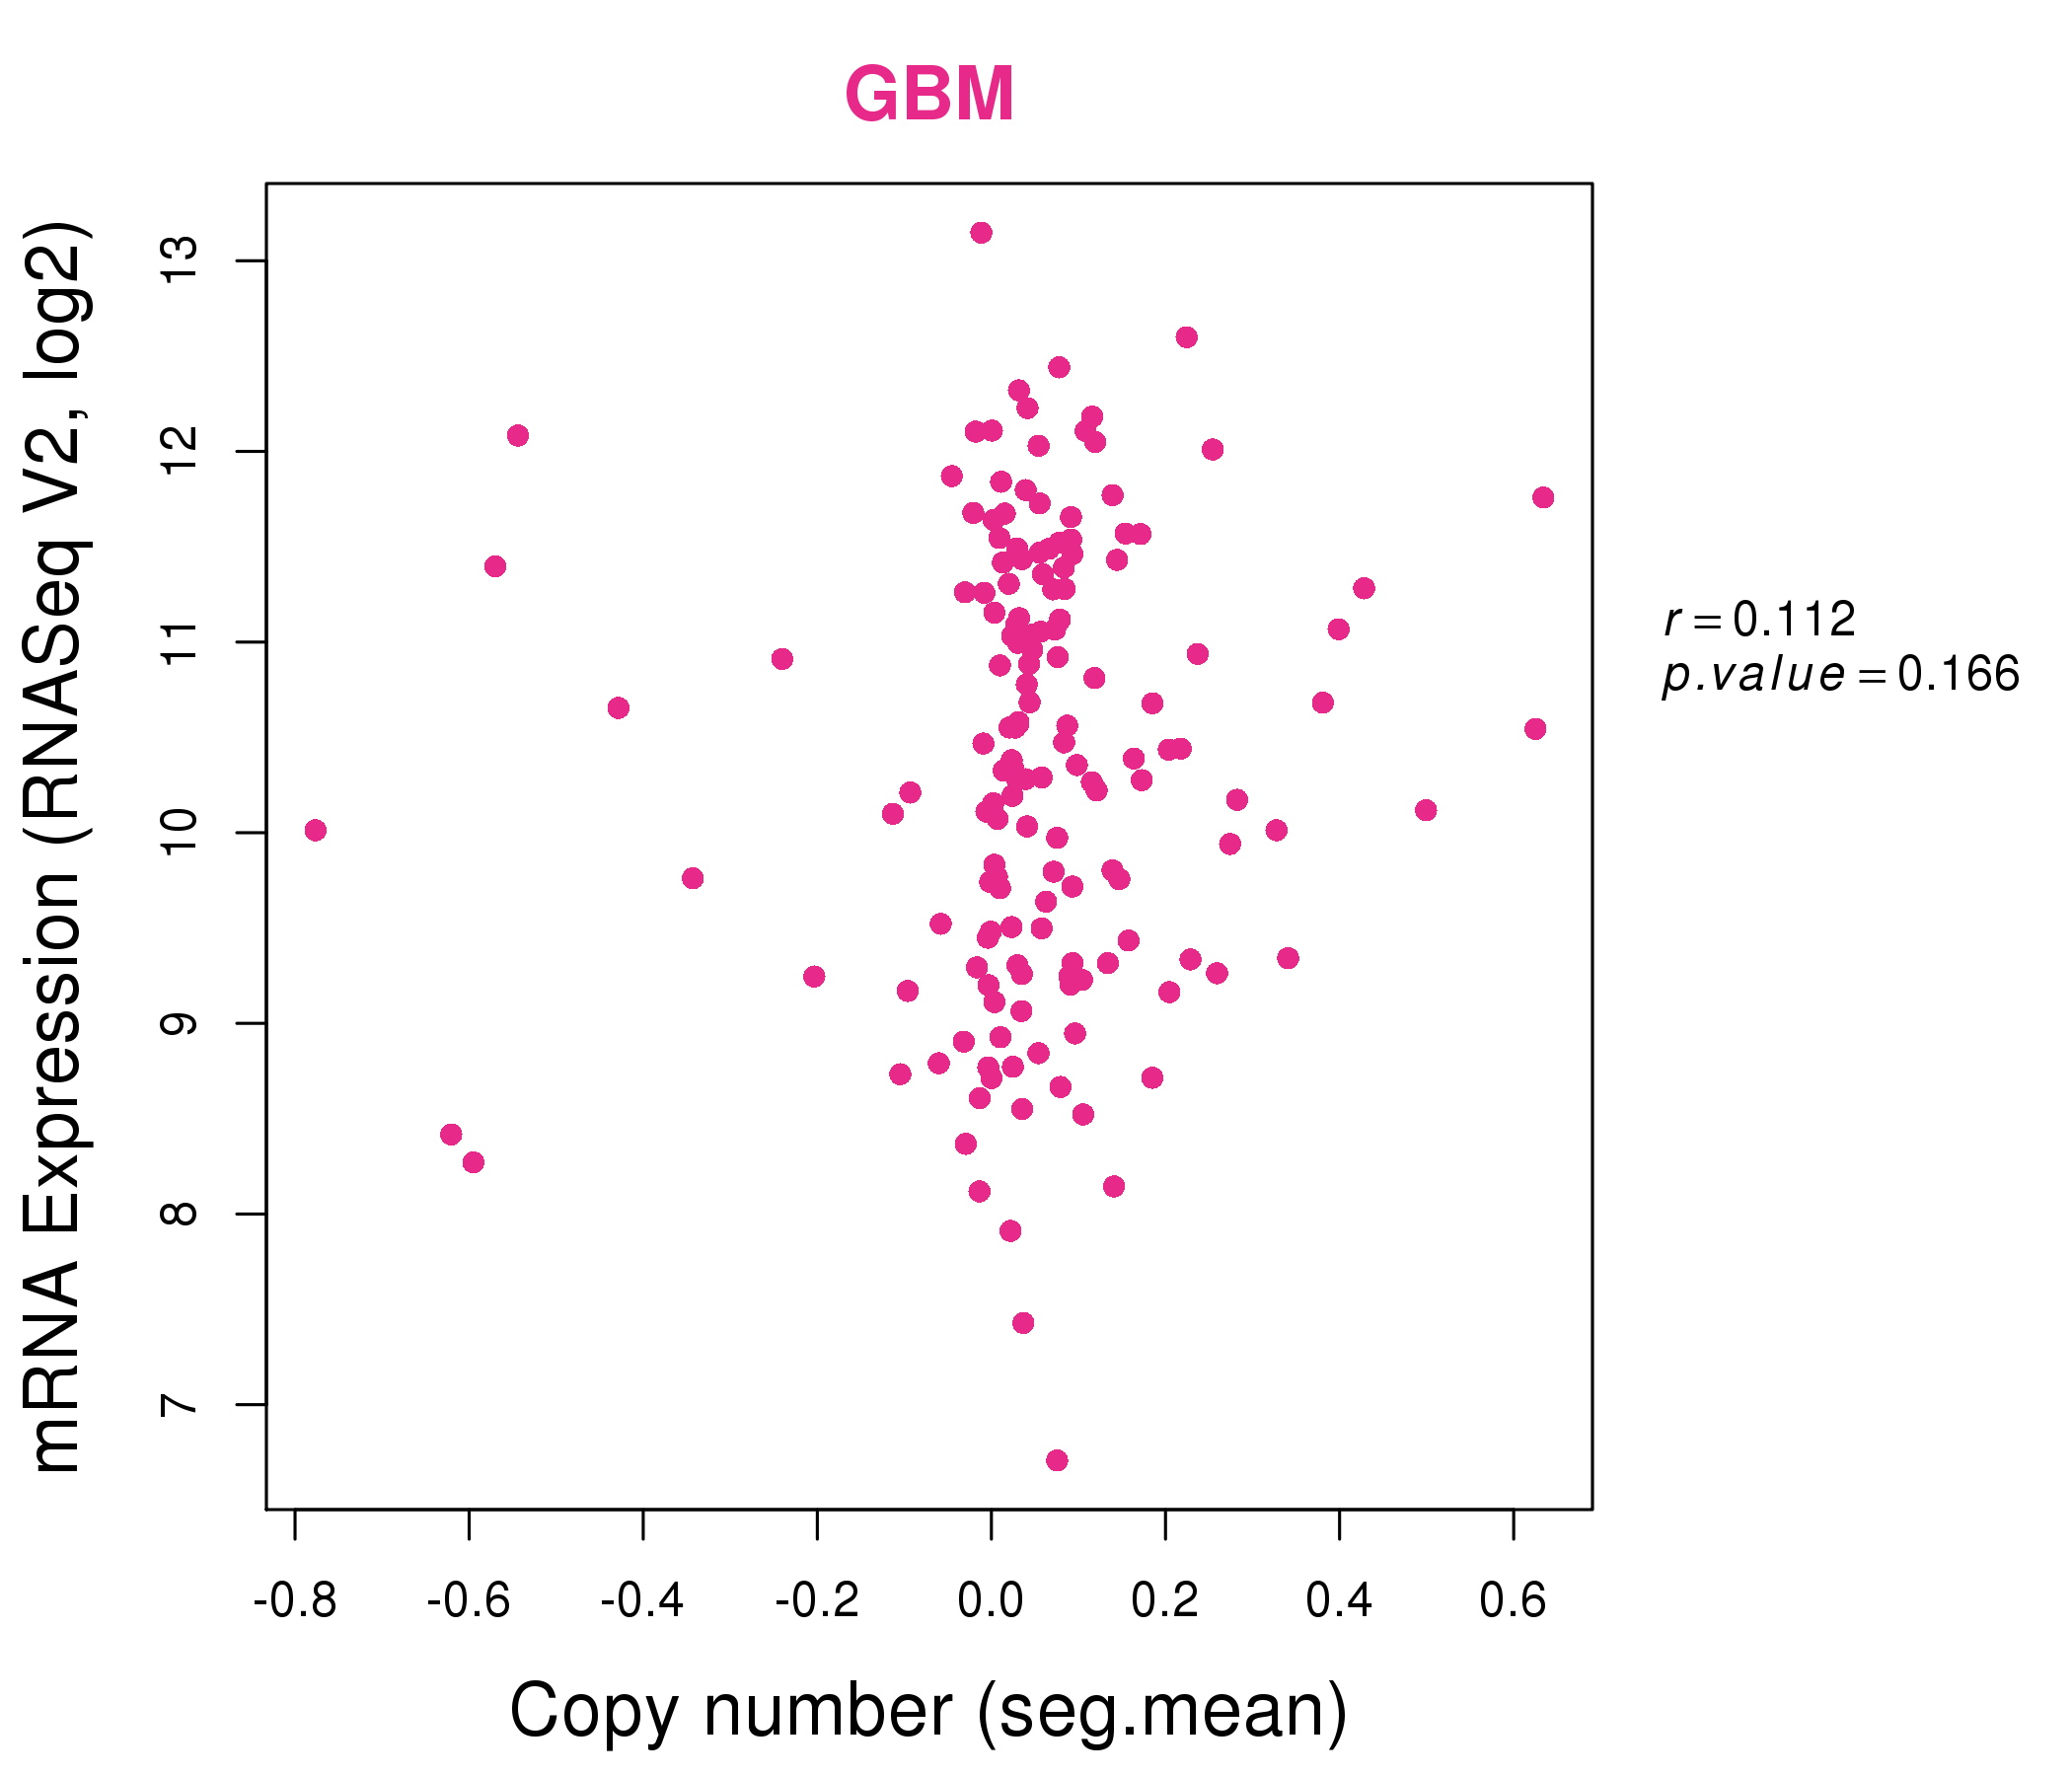
| * Normalized gene expression data of RNASeqV2 was extracted from TCGA using R package TCGA-Assembler. The URLs of all public data files on TCGA DCC data server were gathered at Jan-05-2015. Only eight cancer types have enough normal control samples for differential expression analysis. (t test, adjusted p<0.05 (using Benjamini-Hochberg FDR)) |
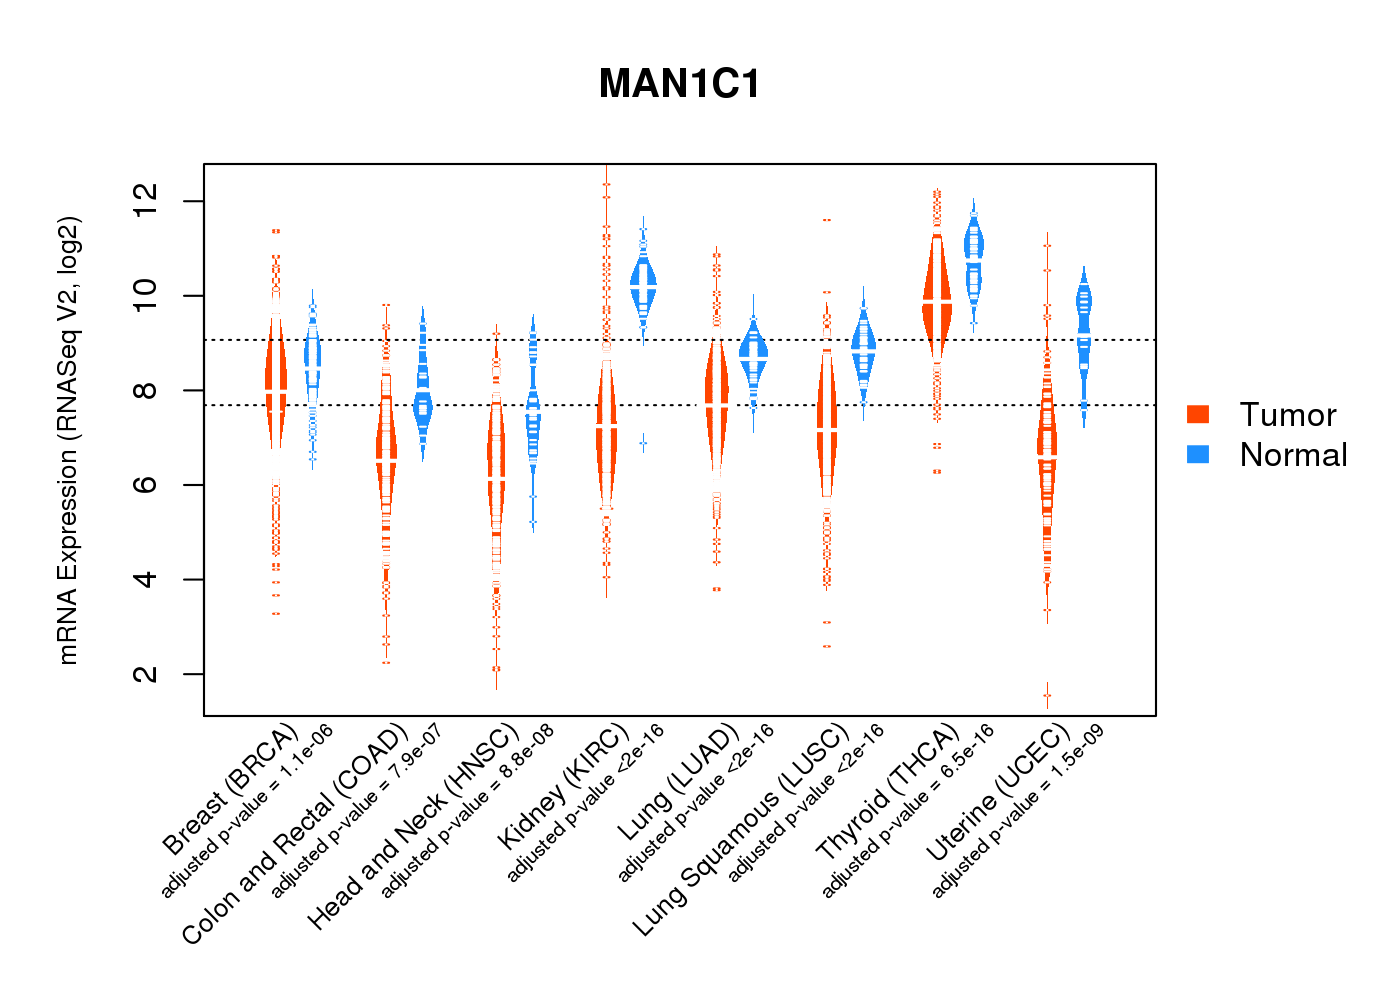 |
| Top |
| * This plots show the correlation between CNV and gene expression. |
: Open all plots for all cancer types
 |
|
 |
|
| Top |
| Gene-Gene Network Information |
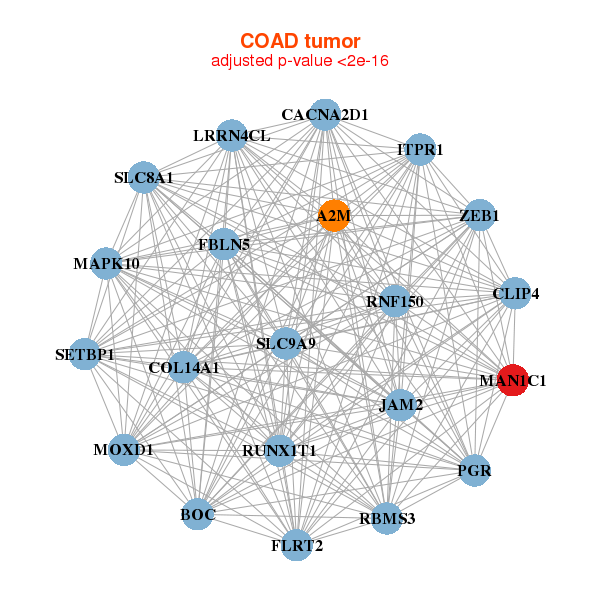
| * Co-Expression network figures were drawn using R package igraph. Only the top 20 genes with the highest correlations were shown. Red circle: input gene, orange circle: cell metabolism gene, sky circle: other gene |
: Open all plots for all cancer types
 |
|
| ADD1,ARHGAP6,CBX7,CLCN6,CRY2,ECE1,FUCA1, LDLRAP1,MAGED2,MAN1C1,PDE2A,PGPEP1,JADE2,SEPN1, SETBP1,SLC9A1,SYTL2,TADA2B,TMEM63C,TRIM62,ZFYVE28 | C1QTNF2,C1S,C3,CCDC80,CD34,FBLN1,FBLN5, GDF10,GPR133,LHFP,LRRN4CL,MAN1C1,MFAP4,OLFML1, CPQ,PODN,PRRX1,PTGIS,SERPING1,TIMP2,TPST1 |
 |
|
| A2M,BOC,CACNA2D1,CLIP4,COL14A1,FBLN5,FLRT2, ITPR1,JAM2,LRRN4CL,MAN1C1,MAPK10,MOXD1,PGR, RBMS3,RNF150,RUNX1T1,SETBP1,SLC8A1,SLC9A9,ZEB1 | ABCB5,CHST14,COL6A3,DCLK1,FKBP10,GPR124,GPRC5B, HHIPL1,LRRC2,MAN1C1,MXRA8,MYH10,NRP1,OLFML1, PODN,PTPRS,RPS6KA2,SERPING1,THBS2,VIM,ZNF521 |
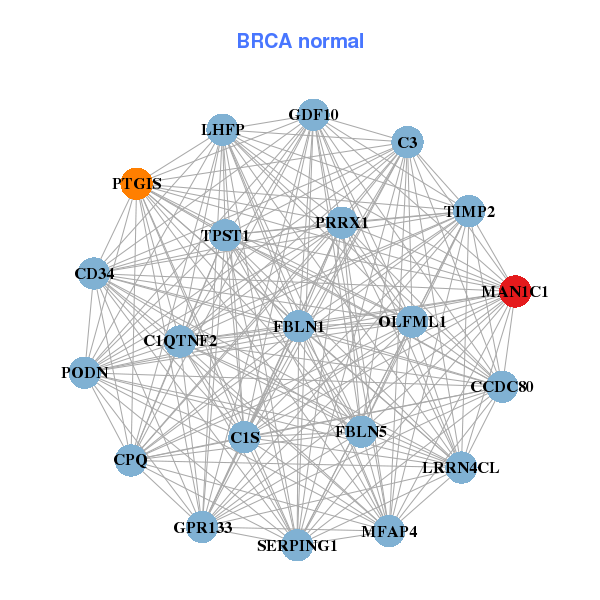
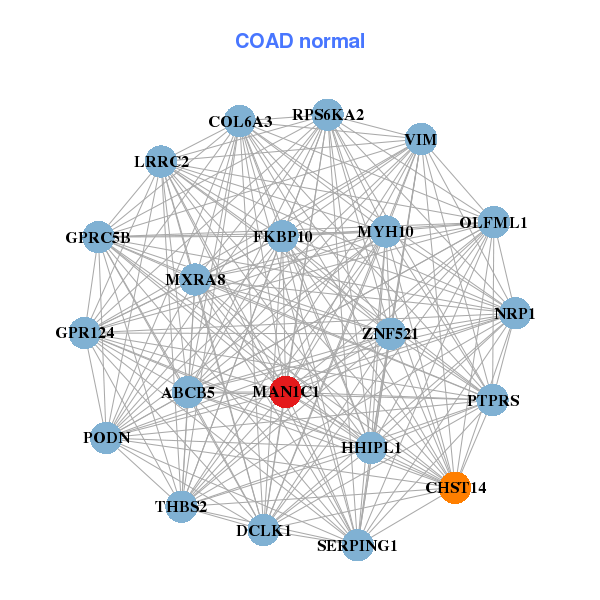
| * Co-Expression network figures were drawn using R package igraph. Only the top 20 genes with the highest correlations were shown. Red circle: input gene, orange circle: cell metabolism gene, sky circle: other gene |
: Open all plots for all cancer types
| Top |
: Open all interacting genes' information including KEGG pathway for all interacting genes from DAVID
| Top |
| Pharmacological Information for MAN1C1 |
| There's no related Drug. |
| Top |
| Cross referenced IDs for MAN1C1 |
| * We obtained these cross-references from Uniprot database. It covers 150 different DBs, 18 categories. http://www.uniprot.org/help/cross_references_section |
: Open all cross reference information
|
Copyright © 2016-Present - The Univsersity of Texas Health Science Center at Houston @ |