|
||||||||||||||||||||||||||||||||||||||||||||||||||||||||||||||||||||||||||||||||||||||||||||||||||||||||||||||||||||||||||||||||||||||||||||||||||||||||||||||||||||||||||||||||||||||||||||||||||||||||||||||||||||||||||||||||||||||||||||||||||||||||||||||||||||||||||||||||||||||||||||||||||||||||||||||||||||||||||
| |
| Phenotypic Information (metabolism pathway, cancer, disease, phenome) |
| |
| |
| Gene-Gene Network Information: Co-Expression Network, Interacting Genes & KEGG |
| |
|


| Gene Summary for TBL1XR1 |
| Basic gene info. | Gene symbol | TBL1XR1 |
| Gene name | transducin (beta)-like 1 X-linked receptor 1 | |
| Synonyms | C21|DC42|IRA1|TBLR1 | |
| Cytomap | UCSC genome browser: 3q26.32 | |
| Genomic location | chr3 :176738541-176915048 | |
| Type of gene | protein-coding | |
| RefGenes | NM_024665.4, | |
| Ensembl id | ENSG00000177565 | |
| Description | F-box-like/WD repeat-containing protein TBL1XR1TBL1-related protein 1nuclear receptor co-repressor/HDAC3 complex subunitnuclear receptor corepressor/HDAC3 complex subunit TBLR1transducin beta-like 1X-related protein 1 | |
| Modification date | 20141222 | |
| dbXrefs | MIM : 608628 | |
| HGNC : HGNC | ||
| Ensembl : ENSG00000177565 | ||
| HPRD : 15476 | ||
| Vega : OTTHUMG00000157140 | ||
| Protein | UniProt: Q9BZK7 go to UniProt's Cross Reference DB Table | |
| Expression | CleanEX: HS_TBL1XR1 | |
| BioGPS: 79718 | ||
| Gene Expression Atlas: ENSG00000177565 | ||
| The Human Protein Atlas: ENSG00000177565 | ||
| Pathway | NCI Pathway Interaction Database: TBL1XR1 | |
| KEGG: TBL1XR1 | ||
| REACTOME: TBL1XR1 | ||
| ConsensusPathDB | ||
| Pathway Commons: TBL1XR1 | ||
| Metabolism | MetaCyc: TBL1XR1 | |
| HUMANCyc: TBL1XR1 | ||
| Regulation | Ensembl's Regulation: ENSG00000177565 | |
| miRBase: chr3 :176,738,541-176,915,048 | ||
| TargetScan: NM_024665 | ||
| cisRED: ENSG00000177565 | ||
| Context | iHOP: TBL1XR1 | |
| cancer metabolism search in PubMed: TBL1XR1 | ||
| UCL Cancer Institute: TBL1XR1 | ||
| Assigned class in ccmGDB | B - This gene belongs to cancer gene. | |
| Top |
| Phenotypic Information for TBL1XR1(metabolism pathway, cancer, disease, phenome) |
| Cancer | CGAP: TBL1XR1 |
| Familial Cancer Database: TBL1XR1 | |
| * This gene is included in those cancer gene databases. |
|
|
|
|
|
| . | ||||||||||||||||||||||||||||||||||||||||||||||||||||||||||||||||||||||||||||||||||||||||||||||||||||||||||||||||||||||||||||||||||||||||||||||||||||||||||||||||||||||||||||||||||||||||||||||||||||||||||||||||||||||||||||||||||||||||||||||||||||||||||||||||||||||||||||||||||||||||||||||||||||||||||||||||||||
Oncogene 1 | ||||||||||||||||||||||||||||||||||||||||||||||||||||||||||||||||||||||||||||||||||||||||||||||||||||||||||||||||||||||||||||||||||||||||||||||||||||||||||||||||||||||||||||||||||||||||||||||||||||||||||||||||||||||||||||||||||||||||||||||||||||||||||||||||||||||||||||||||||||||||||||||||||||||||||||||||||||||||||
| cf) number; DB name 1 Oncogene; http://nar.oxfordjournals.org/content/35/suppl_1/D721.long, 2 Tumor Suppressor gene; https://bioinfo.uth.edu/TSGene/, 3 Cancer Gene Census; http://www.nature.com/nrc/journal/v4/n3/abs/nrc1299.html, 4 CancerGenes; http://nar.oxfordjournals.org/content/35/suppl_1/D721.long, 5 Network of Cancer Gene; http://ncg.kcl.ac.uk/index.php, 6 http://www.nature.com/nature/journal/v490/n7418/full/nature11412.html, 7 http://www.nature.com/nature/journal/v497/n7447/full/nature12113.html, 8 http://www.nature.com/nature/journal/v513/n7517/full/nature13480.html, 9Therapeutic Vulnerabilities in Cancer; http://cbio.mskcc.org/cancergenomics/statius/ |
| REACTOME_METABOLISM_OF_LIPIDS_AND_LIPOPROTEINS | |
| OMIM | 608628; gene. |
| Orphanet | |
| Disease | KEGG Disease: TBL1XR1 |
| MedGen: TBL1XR1 (Human Medical Genetics with Condition) | |
| ClinVar: TBL1XR1 | |
| Phenotype | MGI: TBL1XR1 (International Mouse Phenotyping Consortium) |
| PhenomicDB: TBL1XR1 | |
| Mutations for TBL1XR1 |
| * Under tables are showing count per each tissue to give us broad intuition about tissue specific mutation patterns.You can go to the detailed page for each mutation database's web site. |
| - Statistics for Tissue and Mutation type | Top |
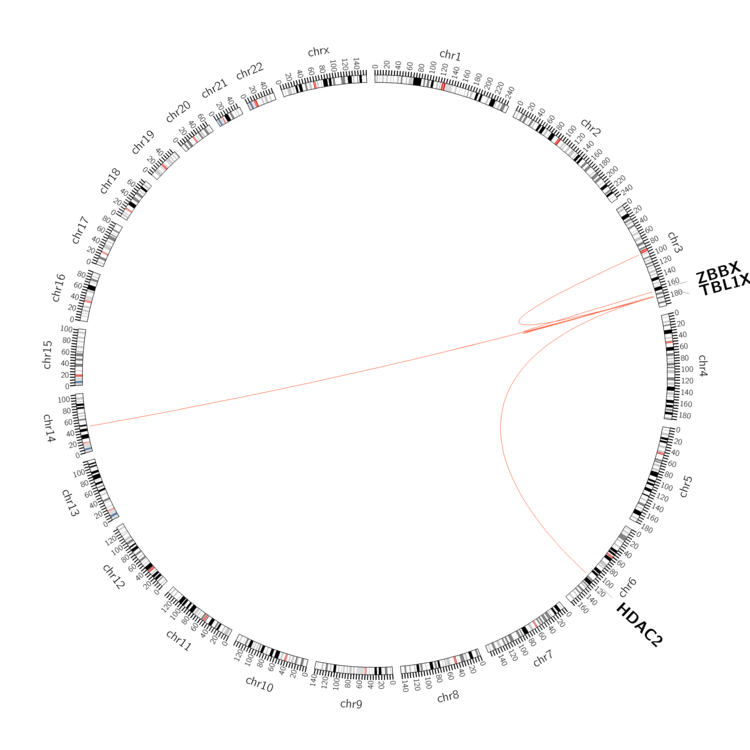 |
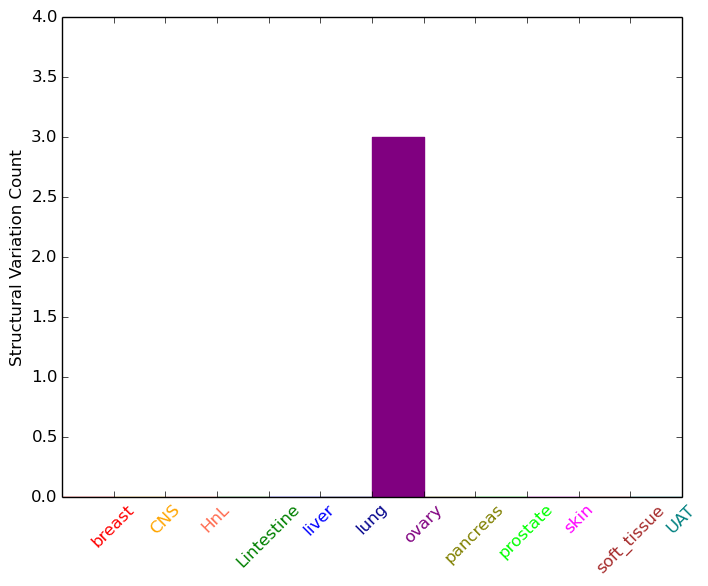
| - For Inter-chromosomal Variations |
| * Inter-chromosomal variantions includes 'interchromosomal amplicon to amplicon', 'interchromosomal amplicon to non-amplified dna', 'interchromosomal insertion', 'Interchromosomal unknown type'. |
 |
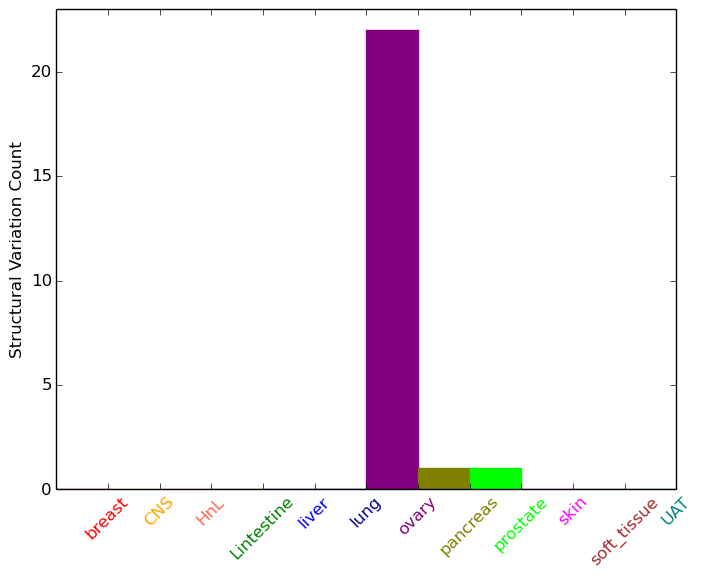
| - For Intra-chromosomal Variations |
| * Intra-chromosomal variantions includes 'intrachromosomal amplicon to amplicon', 'intrachromosomal amplicon to non-amplified dna', 'intrachromosomal deletion', 'intrachromosomal fold-back inversion', 'intrachromosomal inversion', 'intrachromosomal tandem duplication', 'Intrachromosomal unknown type', 'intrachromosomal with inverted orientation', 'intrachromosomal with non-inverted orientation'. |
 |
| Sample | Symbol_a | Chr_a | Start_a | End_a | Symbol_b | Chr_b | Start_b | End_b |
| ovary | TBL1XR1 | chr3 | 176756394 | 176756414 | TBL1XR1 | chr3 | 176823581 | 176823601 |
| ovary | TBL1XR1 | chr3 | 176782070 | 176782090 | chr3 | 175564466 | 175564486 | |
| ovary | TBL1XR1 | chr3 | 176792478 | 176792498 | TBL1XR1 | chr3 | 176793293 | 176793313 |
| ovary | TBL1XR1 | chr3 | 176806208 | 176806228 | TBL1XR1 | chr3 | 176830861 | 176830881 |
| ovary | TBL1XR1 | chr3 | 176811624 | 176811644 | TBL1XR1 | chr3 | 176832855 | 176832875 |
| ovary | TBL1XR1 | chr3 | 176815851 | 176815871 | TBL1XR1 | chr3 | 176808970 | 176808990 |
| ovary | TBL1XR1 | chr3 | 176816154 | 176816174 | chr14 | 46029737 | 46029757 | |
| ovary | TBL1XR1 | chr3 | 176817396 | 176817416 | TBL1XR1 | chr3 | 176898534 | 176898554 |
| ovary | TBL1XR1 | chr3 | 176824517 | 176824537 | TBL1XR1 | chr3 | 176894263 | 176894283 |
| ovary | TBL1XR1 | chr3 | 176824850 | 176824870 | chr3 | 176979266 | 176979286 | |
| ovary | TBL1XR1 | chr3 | 176825233 | 176825253 | TBL1XR1 | chr3 | 176866483 | 176866503 |
| ovary | TBL1XR1 | chr3 | 176830246 | 176830266 | ZBBX | chr3 | 167011994 | 167012014 |
| ovary | TBL1XR1 | chr3 | 176831899 | 176831919 | TBL1XR1 | chr3 | 176830432 | 176830452 |
| ovary | TBL1XR1 | chr3 | 176832143 | 176832163 | HDAC2 | chr6 | 114289185 | 114289205 |
| ovary | TBL1XR1 | chr3 | 176835071 | 176835091 | chr3 | 176955439 | 176955459 | |
| ovary | TBL1XR1 | chr3 | 176840191 | 176840211 | TBL1XR1 | chr3 | 176809643 | 176809663 |
| ovary | TBL1XR1 | chr3 | 176853835 | 176853855 | TBL1XR1 | chr3 | 176858766 | 176858786 |
| ovary | TBL1XR1 | chr3 | 176868448 | 176868468 | TBL1XR1 | chr3 | 176874166 | 176874186 |
| ovary | TBL1XR1 | chr3 | 176873093 | 176873113 | TBL1XR1 | chr3 | 176879302 | 176879322 |
| ovary | TBL1XR1 | chr3 | 176876046 | 176876066 | chr3 | 176961776 | 176961796 | |
| ovary | TBL1XR1 | chr3 | 176893440 | 176893460 | TBL1XR1 | chr3 | 176894828 | 176894848 |
| ovary | TBL1XR1 | chr3 | 176901690 | 176901710 | TBL1XR1 | chr3 | 176903608 | 176903628 |
| pancreas | TBL1XR1 | chr3 | 176888675 | 176888695 | chr3 | 94023754 | 94023774 | |
| prostate | TBL1XR1 | chr3 | 176764643 | 176764643 | TBL1XR1 | chr3 | 176913694 | 176913694 |
| cf) Tissue number; Tissue name (1;Breast, 2;Central_nervous_system, 3;Haematopoietic_and_lymphoid_tissue, 4;Large_intestine, 5;Liver, 6;Lung, 7;Ovary, 8;Pancreas, 9;Prostate, 10;Skin, 11;Soft_tissue, 12;Upper_aerodigestive_tract) |
| * From mRNA Sanger sequences, Chitars2.0 arranged chimeric transcripts. This table shows TBL1XR1 related fusion information. |
| ID | Head Gene | Tail Gene | Accession | Gene_a | qStart_a | qEnd_a | Chromosome_a | tStart_a | tEnd_a | Gene_a | qStart_a | qEnd_a | Chromosome_a | tStart_a | tEnd_a |
| BF083294 | TPM4 | 21 | 353 | 19 | 16199909 | 16212249 | TBL1XR1 | 345 | 555 | 3 | 176807601 | 176807811 | |
| BU859760 | TBL1XR1 | 1 | 222 | 3 | 176914909 | 176915130 | RGS17 | 220 | 810 | 6 | 153332781 | 153365181 | |
| AJ707222 | TBL1XR1 | 20 | 143 | 3 | 176792513 | 176792636 | ZBTB4 | 138 | 396 | 17 | 7377169 | 7377427 | |
| BQ447327 | GRIP1 | 2 | 440 | 12 | 67130698 | 67131135 | TBL1XR1 | 434 | 714 | 3 | 176817152 | 176817432 | |
| AK022268 | TBL1XR1 | 1 | 1532 | 3 | 176902489 | 176904018 | ENPP2 | 1530 | 2256 | 8 | 120643145 | 120643871 | |
| Top |
| Mutation type/ Tissue ID | brca | cns | cerv | endome | haematopo | kidn | Lintest | liver | lung | ns | ovary | pancre | prost | skin | stoma | thyro | urina | |||
| Total # sample | 9 | 1 | 14 | 3 | 7 | 1 | 1 | |||||||||||||
| GAIN (# sample) | 8 | 1 | 3 | 7 | ||||||||||||||||
| LOSS (# sample) | 1 | 14 | 1 | 1 |
| cf) Tissue ID; Tissue type (1; Breast, 2; Central_nervous_system, 3; Cervix, 4; Endometrium, 5; Haematopoietic_and_lymphoid_tissue, 6; Kidney, 7; Large_intestine, 8; Liver, 9; Lung, 10; NS, 11; Ovary, 12; Pancreas, 13; Prostate, 14; Skin, 15; Stomach, 16; Thyroid, 17; Urinary_tract) |
| Top |
|
 |
| Top |
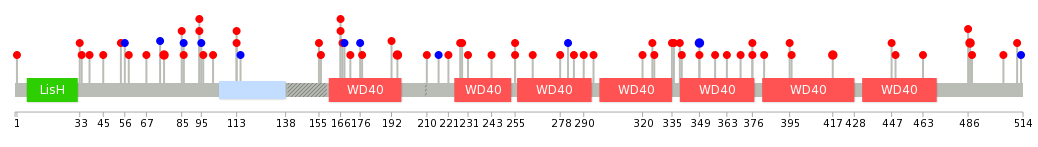
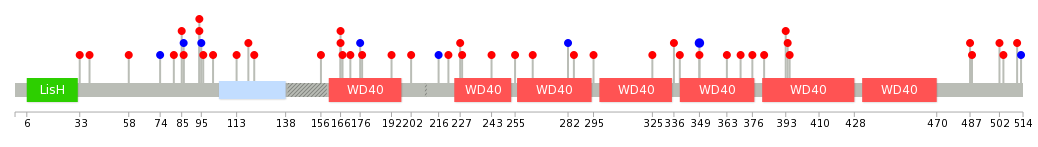
| Stat. for Non-Synonymous SNVs (# total SNVs=66) | (# total SNVs=8) |
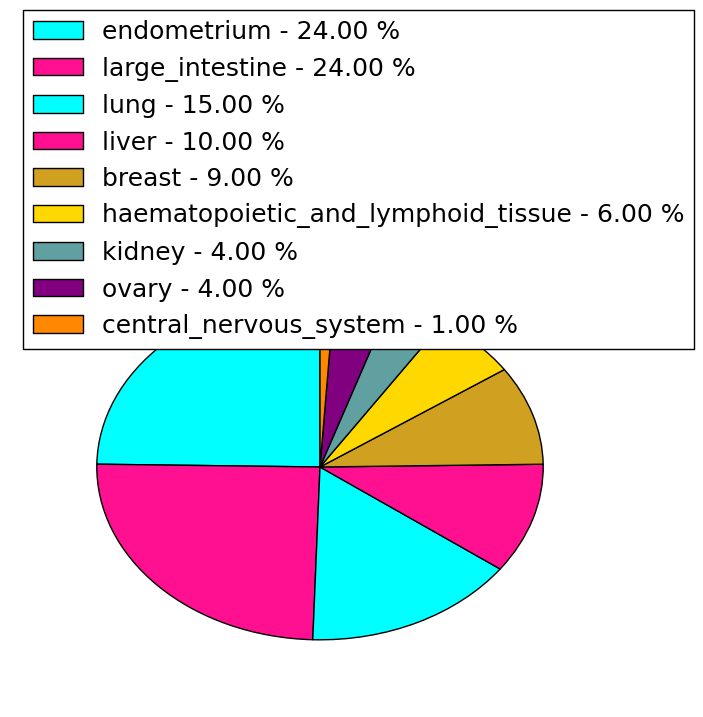 | 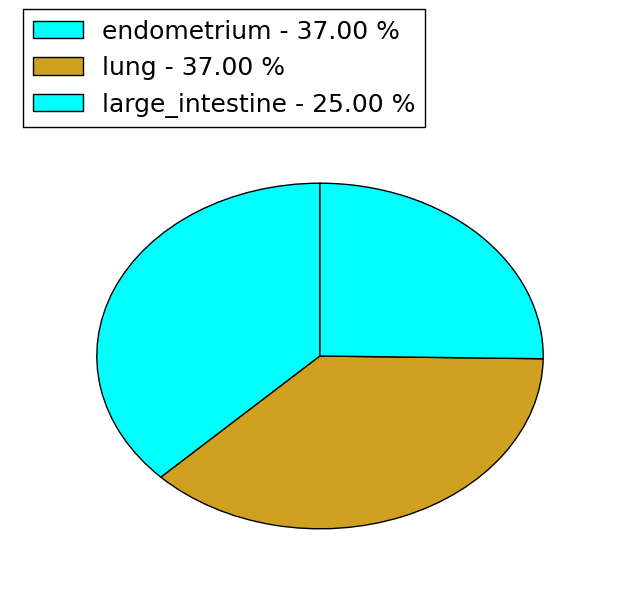 |
(# total SNVs=5) | (# total SNVs=7) |
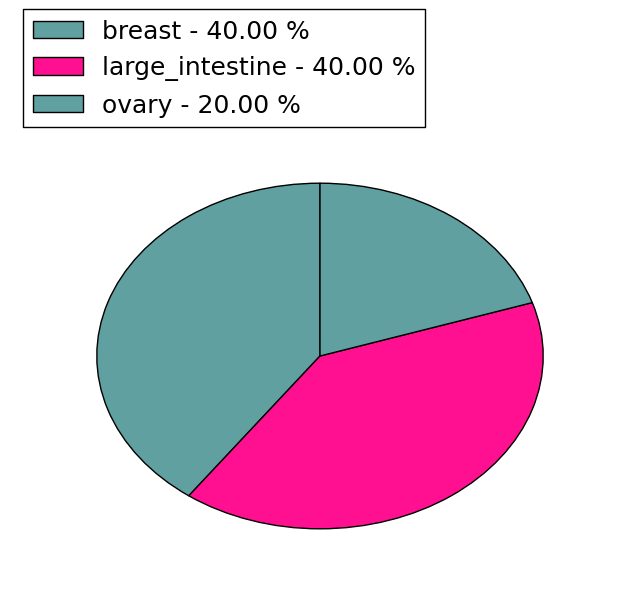 | 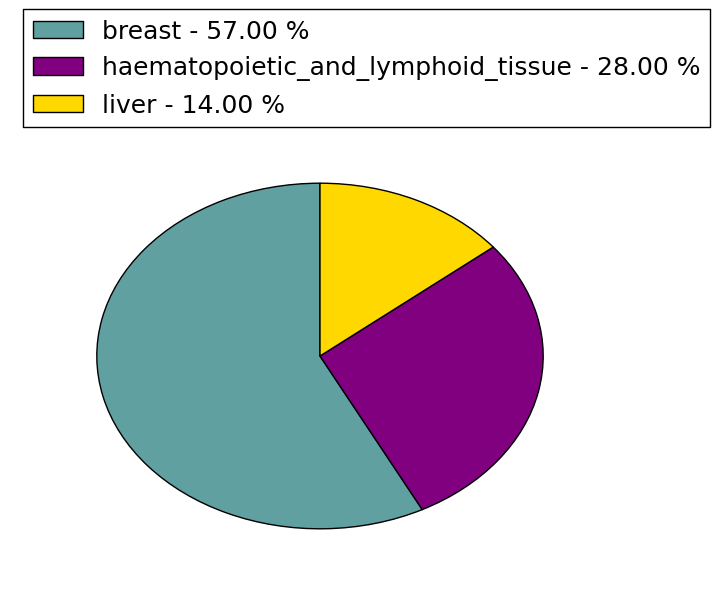 |
| Top |
| * When you move the cursor on each content, you can see more deailed mutation information on the Tooltip. Those are primary_site,primary_histology,mutation(aa),pubmedID. |
| GRCh37 position | Mutation(aa) | Unique sampleID count |
| chr3:176769295-176769296 | p.A142fs*1 | 3 |
| chr3:176752059-176752059 | p.E393* | 3 |
| chr3:176751986-176751986 | p.S417N | 2 |
| chr3:176756101-176756101 | p.T349T | 2 |
| chr3:176769342-176769342 | p.N126fs*16 | 2 |
| chr3:176769492-176769492 | p.R76P | 2 |
| chr3:176769382-176769382 | p.A113S | 2 |
| chr3:176767841-176767841 | p.R216* | 2 |
| chr3:176744219-176744219 | p.F487S | 2 |
| chr3:176769438-176769438 | p.T94R | 2 |
| Top |
|
 |
| Point Mutation/ Tissue ID | 1 | 2 | 3 | 4 | 5 | 6 | 7 | 8 | 9 | 10 | 11 | 12 | 13 | 14 | 15 | 16 | 17 | 18 | 19 | 20 |
| # sample | 2 | 2 | 1 | 12 | 2 | 3 | 1 | 5 | 4 | 1 | 2 | 2 | 10 | |||||||
| # mutation | 2 | 2 | 1 | 13 | 2 | 3 | 1 | 5 | 4 | 1 | 2 | 2 | 16 | |||||||
| nonsynonymous SNV | 2 | 2 | 1 | 11 | 2 | 3 | 1 | 5 | 2 | 1 | 1 | 1 | 13 | |||||||
| synonymous SNV | 2 | 2 | 1 | 1 | 3 |
| cf) Tissue ID; Tissue type (1; BLCA[Bladder Urothelial Carcinoma], 2; BRCA[Breast invasive carcinoma], 3; CESC[Cervical squamous cell carcinoma and endocervical adenocarcinoma], 4; COAD[Colon adenocarcinoma], 5; GBM[Glioblastoma multiforme], 6; Glioma Low Grade, 7; HNSC[Head and Neck squamous cell carcinoma], 8; KICH[Kidney Chromophobe], 9; KIRC[Kidney renal clear cell carcinoma], 10; KIRP[Kidney renal papillary cell carcinoma], 11; LAML[Acute Myeloid Leukemia], 12; LUAD[Lung adenocarcinoma], 13; LUSC[Lung squamous cell carcinoma], 14; OV[Ovarian serous cystadenocarcinoma ], 15; PAAD[Pancreatic adenocarcinoma], 16; PRAD[Prostate adenocarcinoma], 17; SKCM[Skin Cutaneous Melanoma], 18:STAD[Stomach adenocarcinoma], 19:THCA[Thyroid carcinoma], 20:UCEC[Uterine Corpus Endometrial Carcinoma]) |
| Top |
| * We represented just top 10 SNVs. When you move the cursor on each content, you can see more deailed mutation information on the Tooltip. Those are primary_site, primary_histology, mutation(aa), pubmedID. |
| Genomic Position | Mutation(aa) | Unique sampleID count |
| chr3:176769438 | p.T94I | 2 |
| chr3:176756101 | p.T349T | 2 |
| chr3:176767912 | p.W177C | 1 |
| chr3:176752059 | p.D85H | 1 |
| chr3:176769418 | p.T349M | 1 |
| chr3:176765098 | p.A176A | 1 |
| chr3:176771667 | p.L81V | 1 |
| chr3:176768295 | p.D339Y | 1 |
| chr3:176752091 | p.E171K | 1 |
| chr3:176769432 | p.D74D | 1 |
| * Copy number data were extracted from TCGA using R package TCGA-Assembler. The URLs of all public data files on TCGA DCC data server were gathered on Jan-05-2015. Function ProcessCNAData in TCGA-Assembler package was used to obtain gene-level copy number value which is calculated as the average copy number of the genomic region of a gene. |
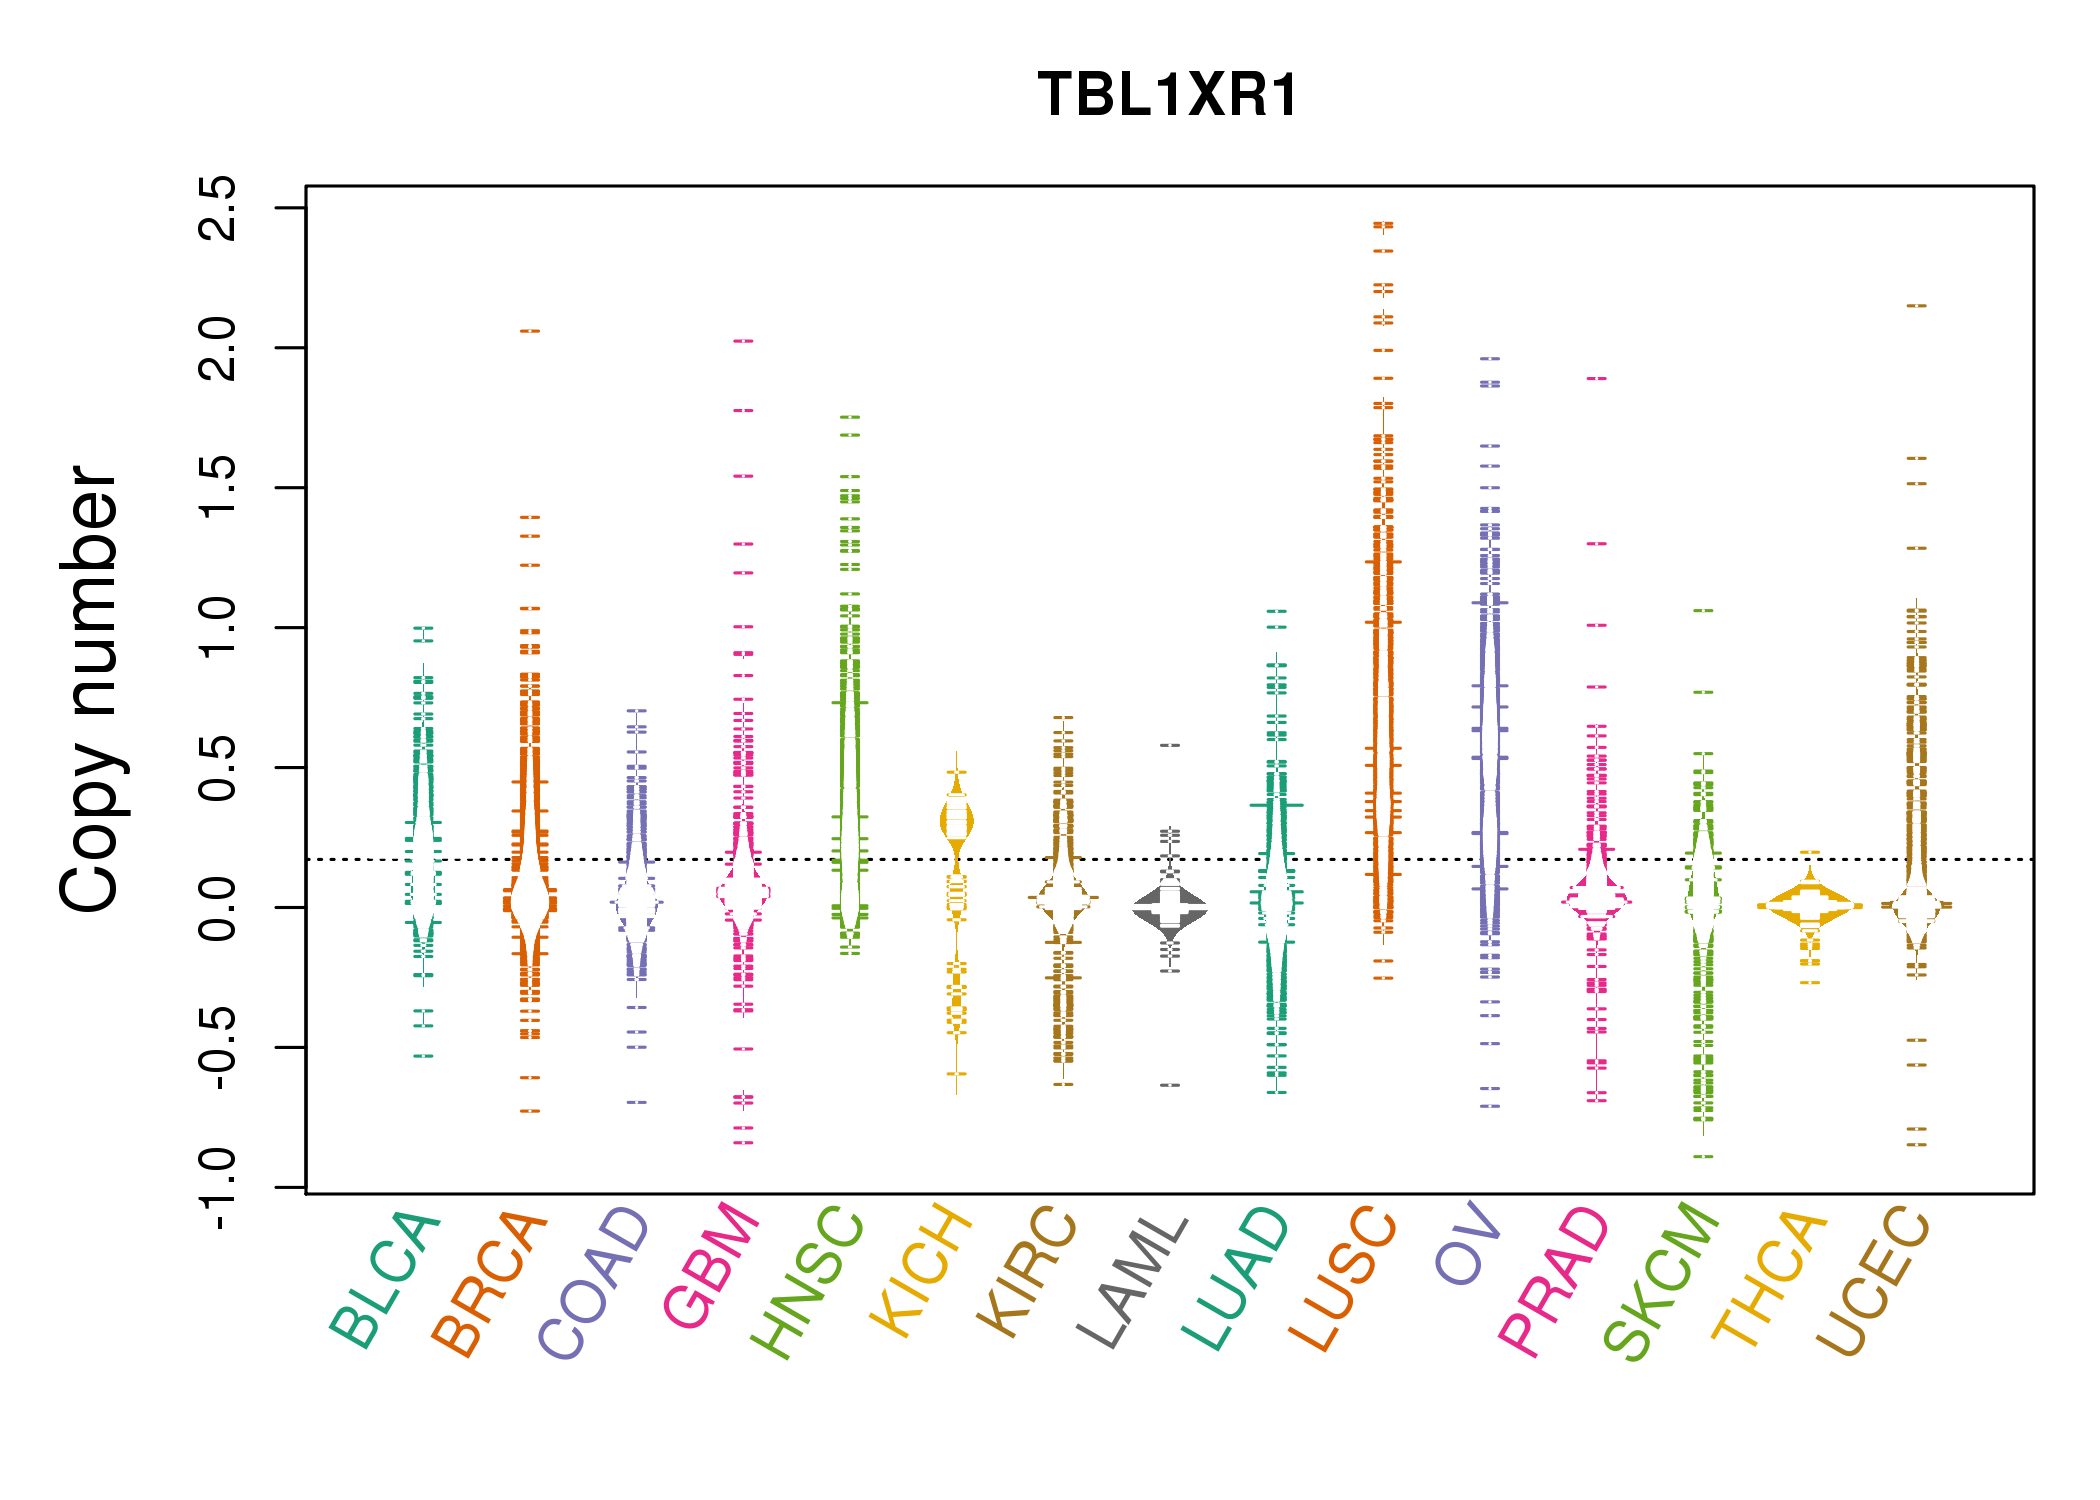 |
| cf) Tissue ID[Tissue type]: BLCA[Bladder Urothelial Carcinoma], BRCA[Breast invasive carcinoma], CESC[Cervical squamous cell carcinoma and endocervical adenocarcinoma], COAD[Colon adenocarcinoma], GBM[Glioblastoma multiforme], Glioma Low Grade, HNSC[Head and Neck squamous cell carcinoma], KICH[Kidney Chromophobe], KIRC[Kidney renal clear cell carcinoma], KIRP[Kidney renal papillary cell carcinoma], LAML[Acute Myeloid Leukemia], LUAD[Lung adenocarcinoma], LUSC[Lung squamous cell carcinoma], OV[Ovarian serous cystadenocarcinoma ], PAAD[Pancreatic adenocarcinoma], PRAD[Prostate adenocarcinoma], SKCM[Skin Cutaneous Melanoma], STAD[Stomach adenocarcinoma], THCA[Thyroid carcinoma], UCEC[Uterine Corpus Endometrial Carcinoma] |
| Top |
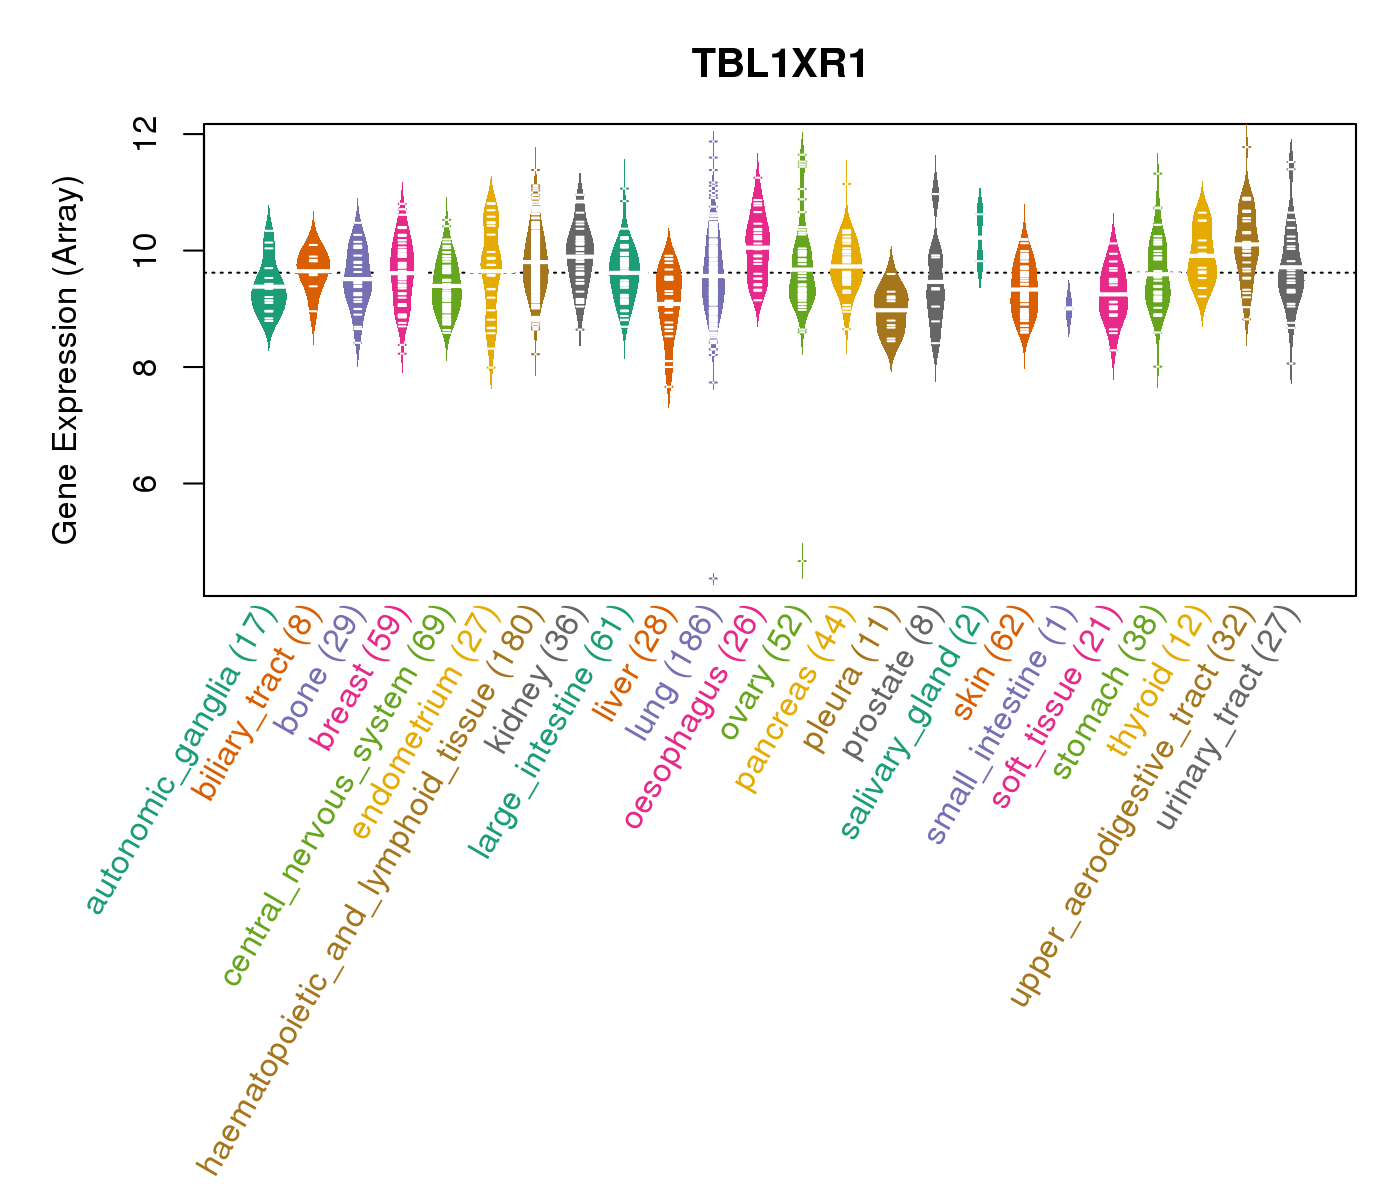
| Gene Expression for TBL1XR1 |
| * CCLE gene expression data were extracted from CCLE_Expression_Entrez_2012-10-18.res: Gene-centric RMA-normalized mRNA expression data. |
 |
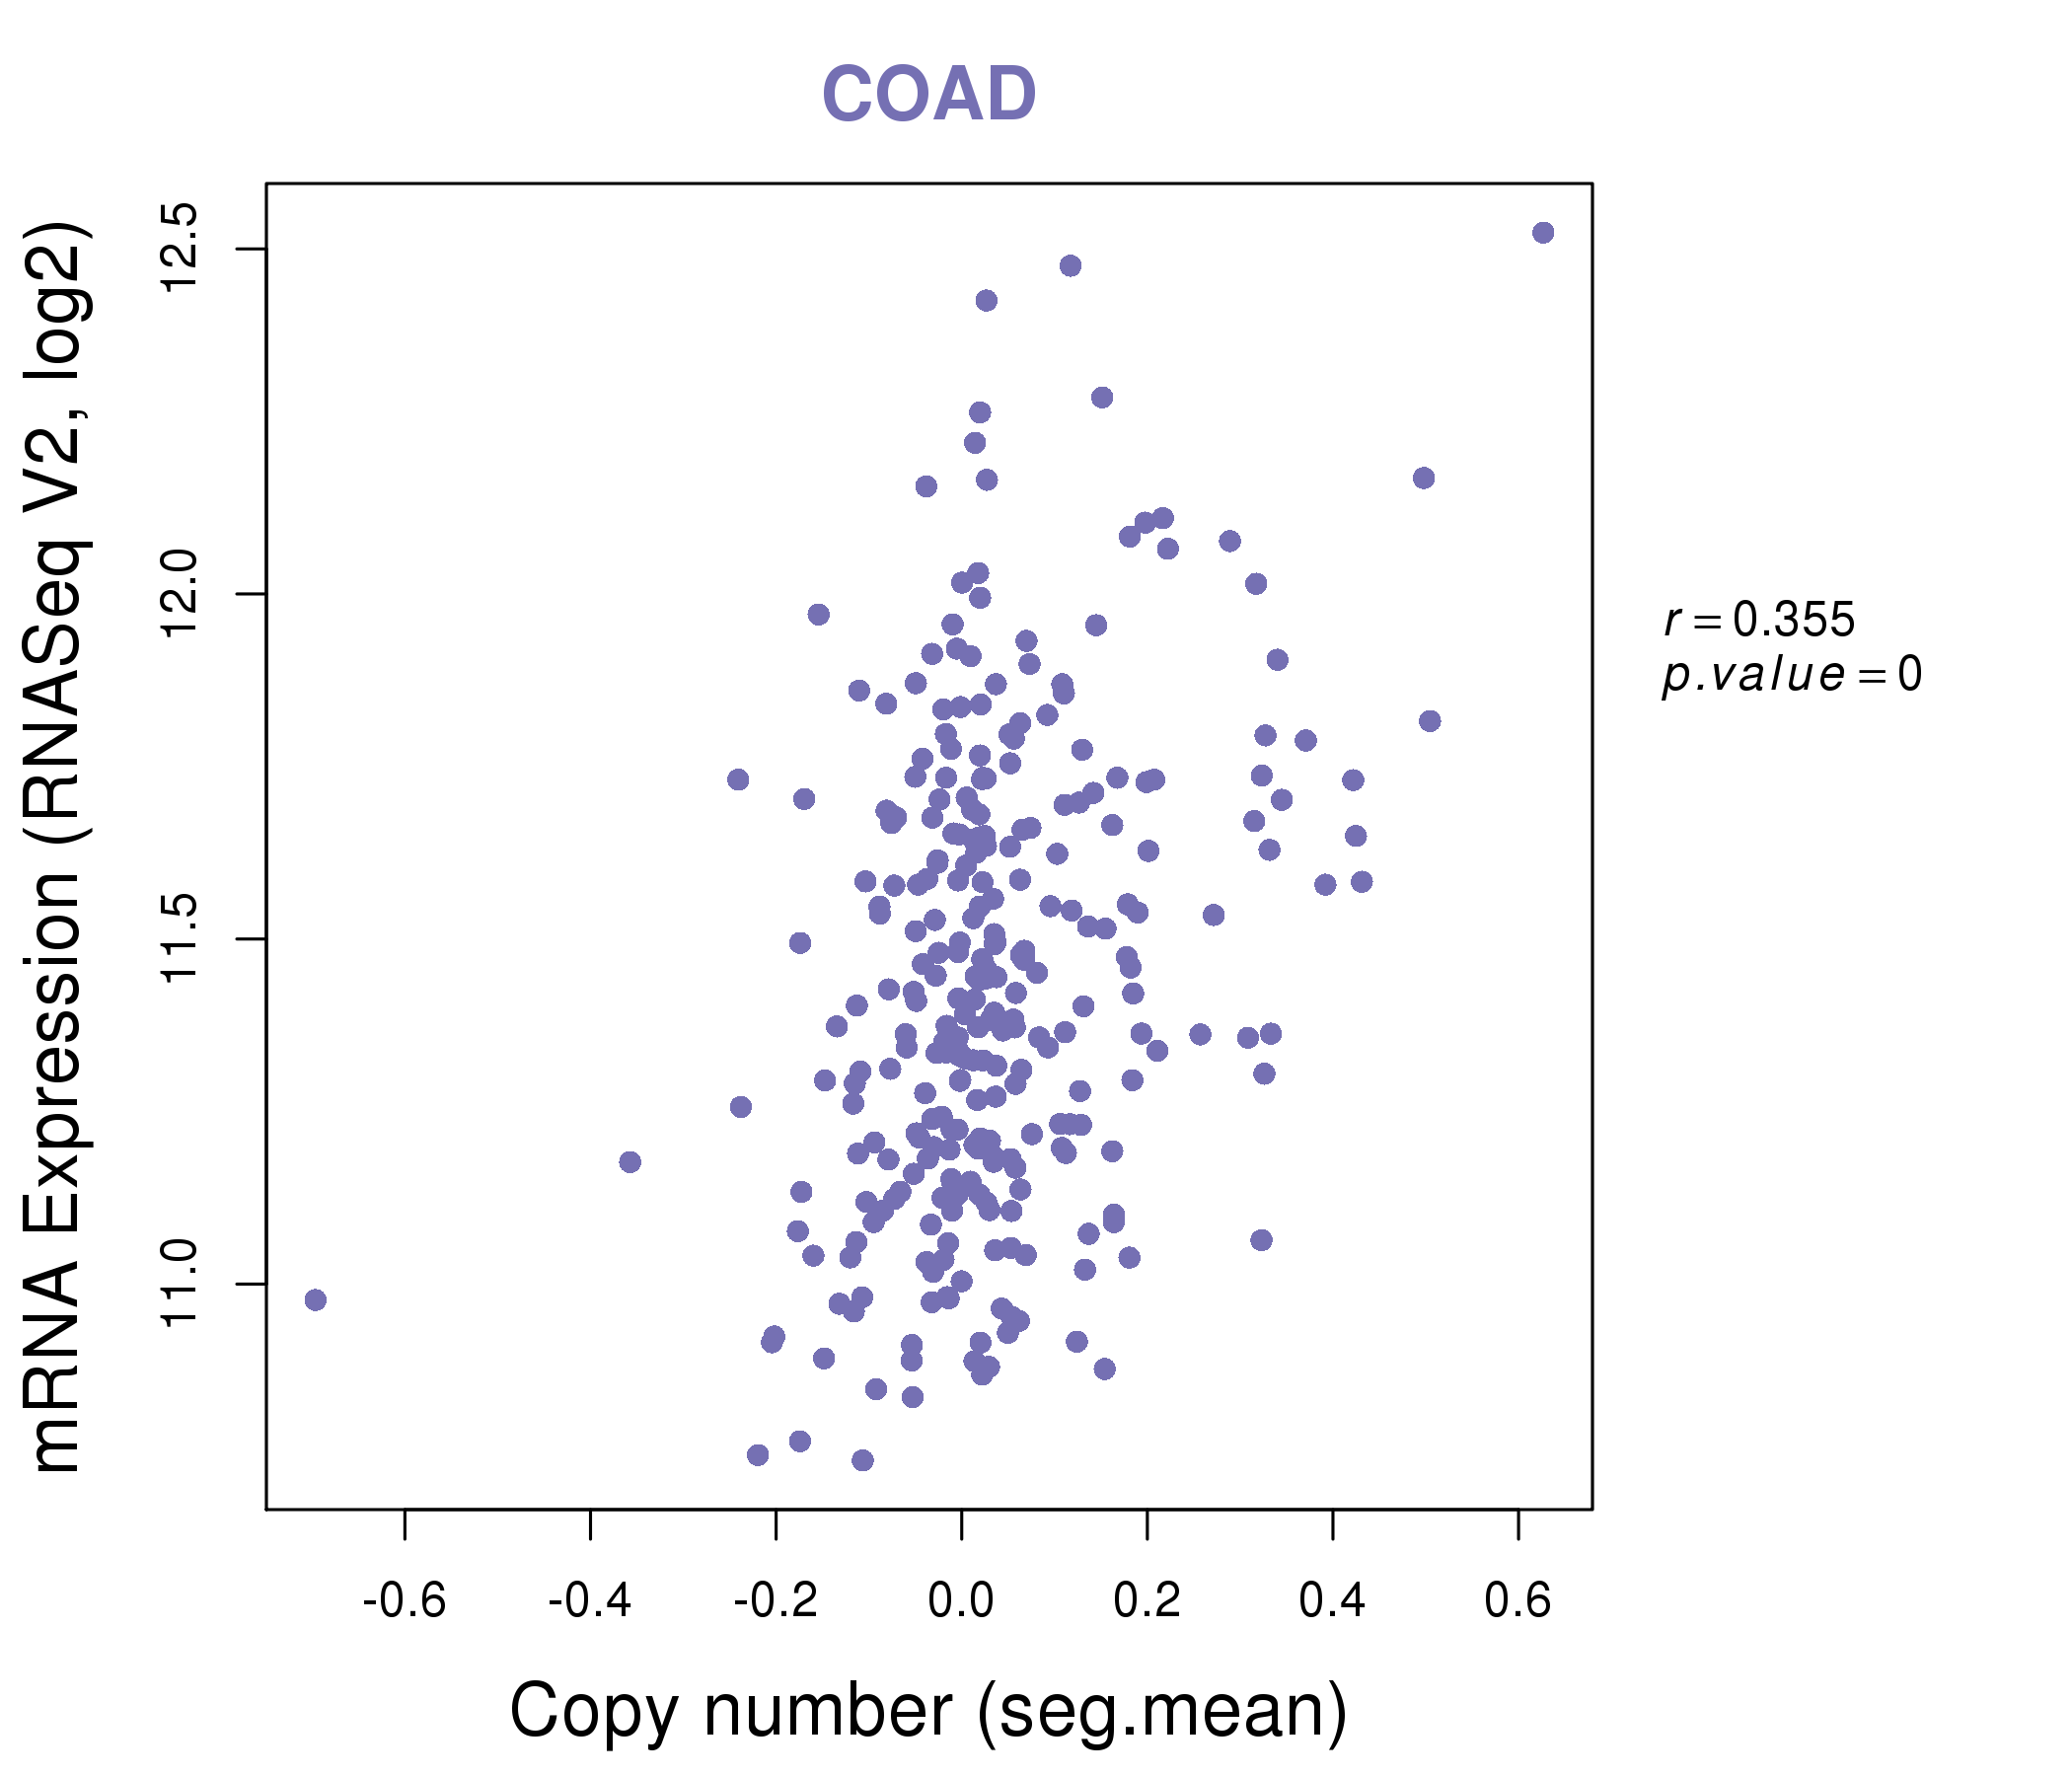
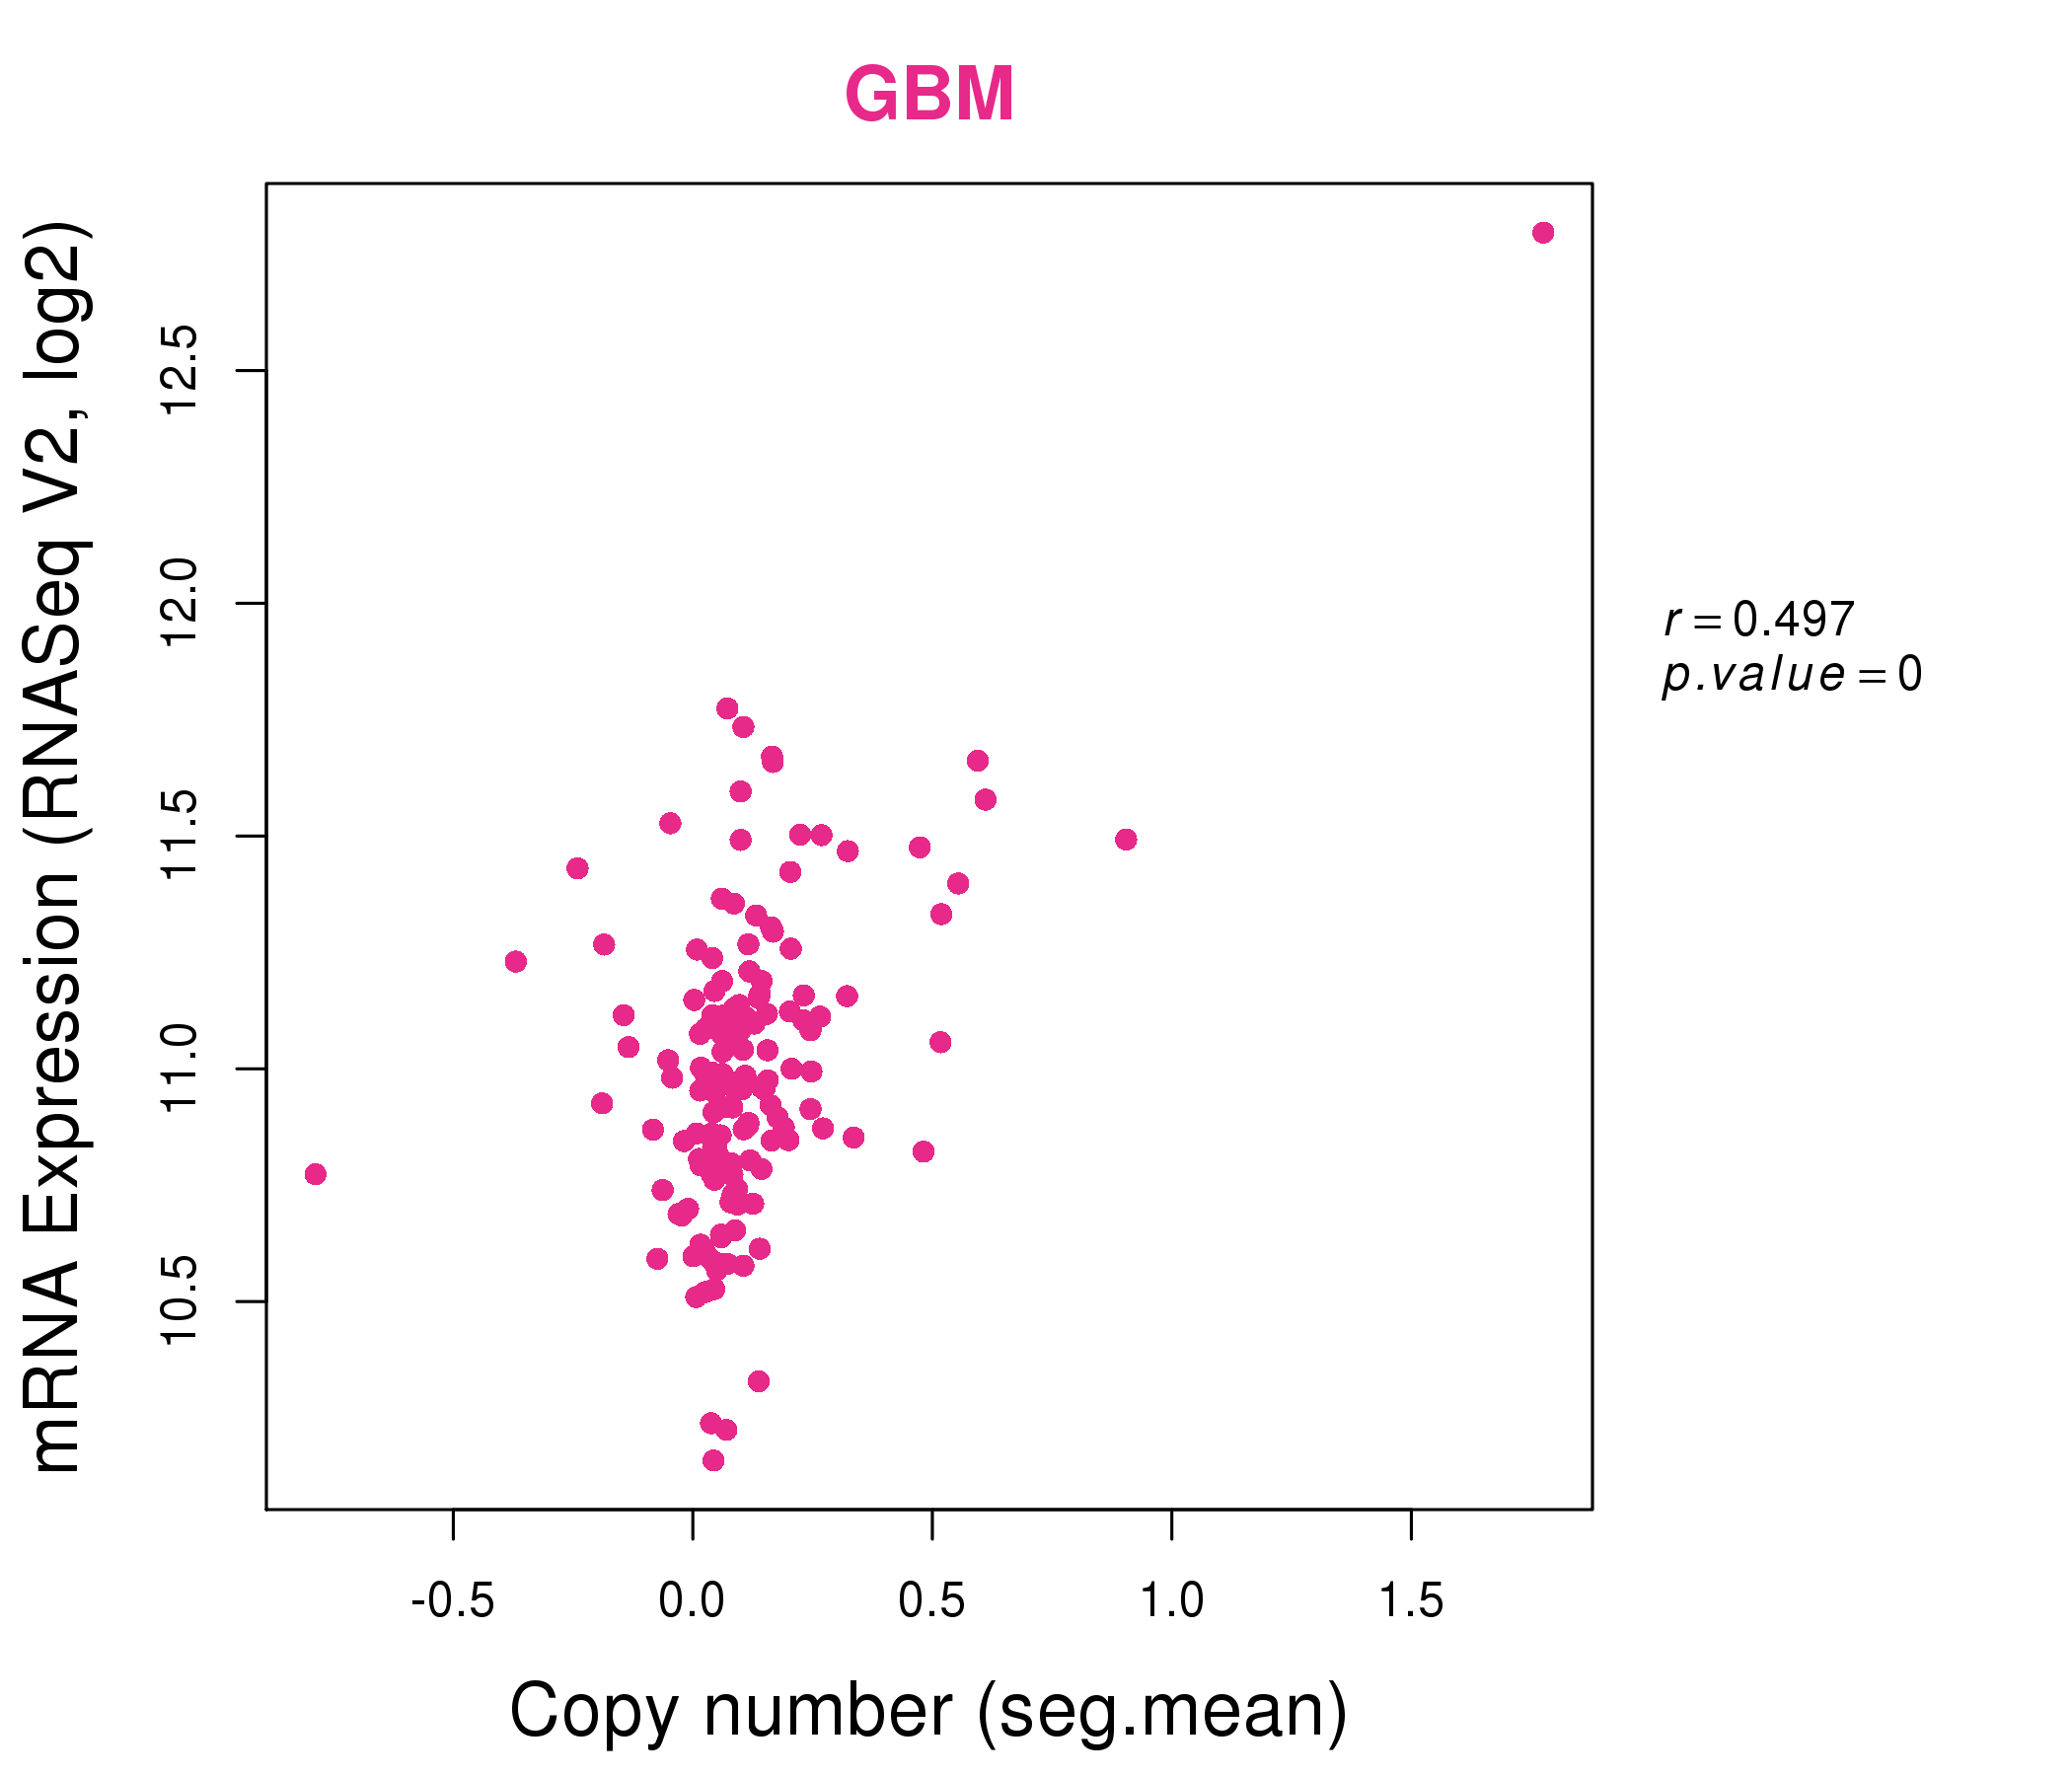
| * Normalized gene expression data of RNASeqV2 was extracted from TCGA using R package TCGA-Assembler. The URLs of all public data files on TCGA DCC data server were gathered at Jan-05-2015. Only eight cancer types have enough normal control samples for differential expression analysis. (t test, adjusted p<0.05 (using Benjamini-Hochberg FDR)) |
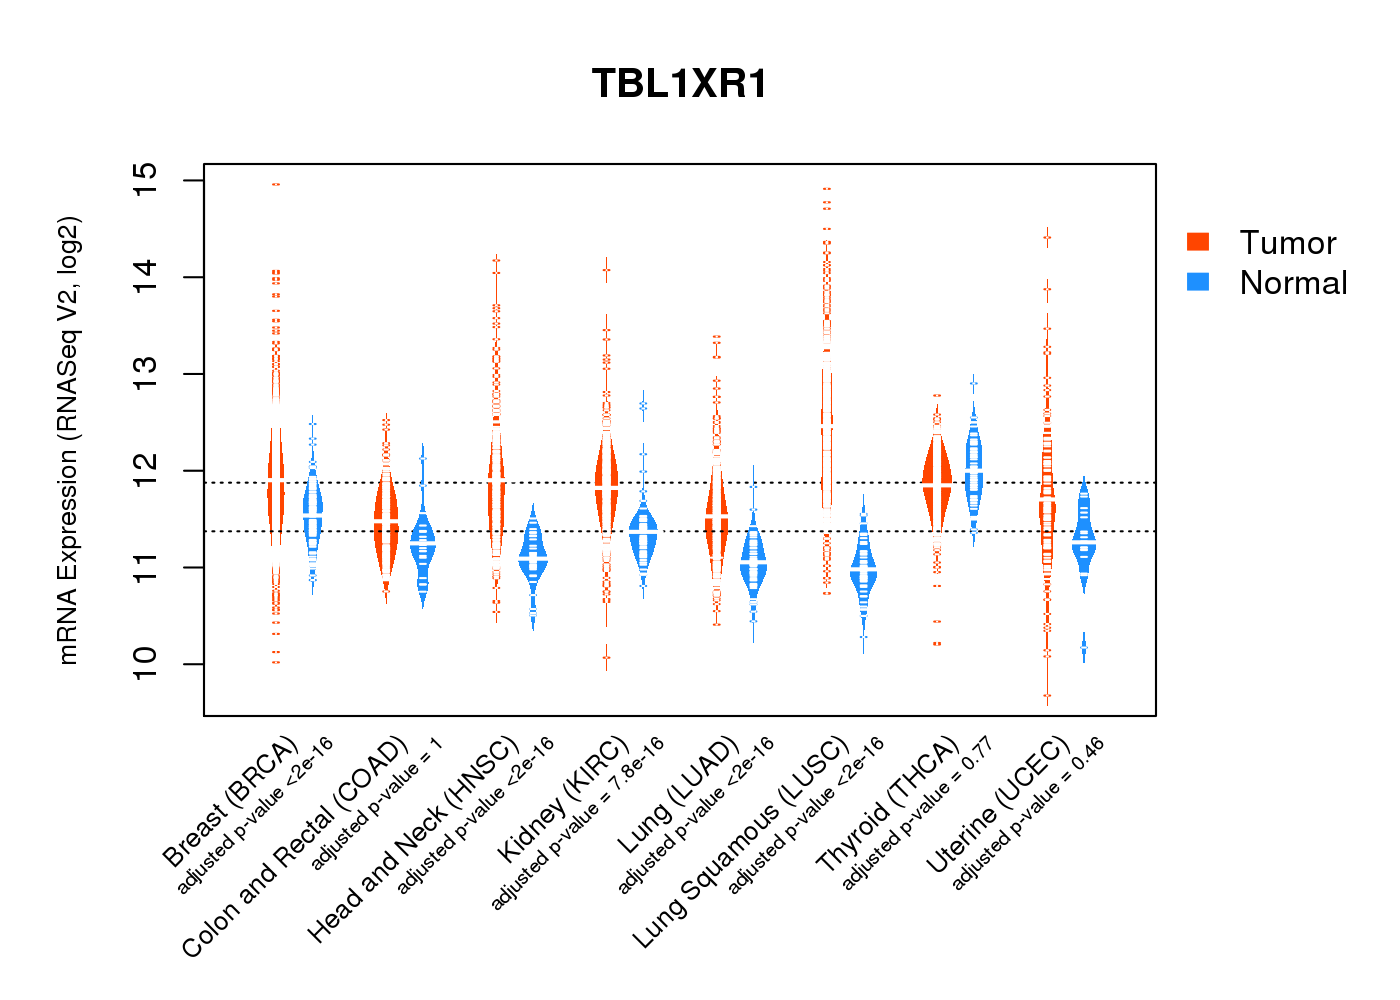 |
| Top |
| * This plots show the correlation between CNV and gene expression. |
: Open all plots for all cancer types
 |
|
 |
|

| Top |
| Gene-Gene Network Information |
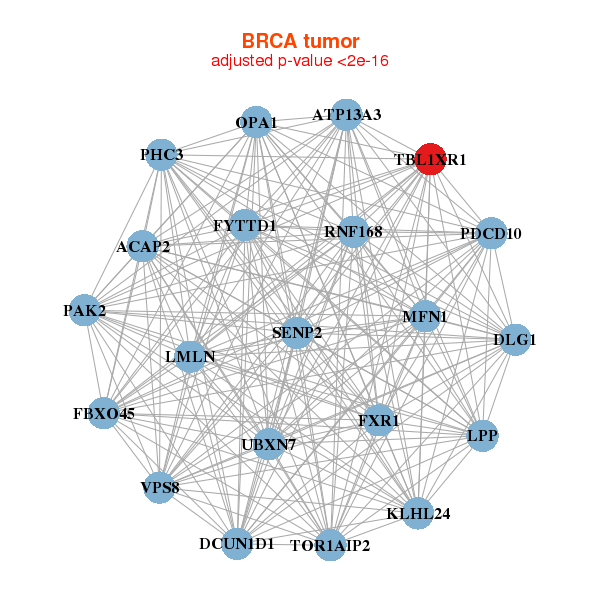
| * Co-Expression network figures were drawn using R package igraph. Only the top 20 genes with the highest correlations were shown. Red circle: input gene, orange circle: cell metabolism gene, sky circle: other gene |
: Open all plots for all cancer types
 |
|
| ACAP2,ATP13A3,DCUN1D1,DLG1,FBXO45,FXR1,FYTTD1, KLHL24,LMLN,LPP,MFN1,OPA1,PAK2,PDCD10, PHC3,RNF168,SENP2,TBL1XR1,TOR1AIP2,UBXN7,VPS8 | BET1,C5orf51,CGGBP1,DCUN1D4,FAM172A,FAM8A1,GABPA, GDAP2,RAB33B,SREK1IP1,SIKE1,SLC30A5,SMAD2,SMAD5, TAF9B,TBL1XR1,TCEA1,TMEM106B,TNPO1,TROVE2,VAMP4 |
 |
|
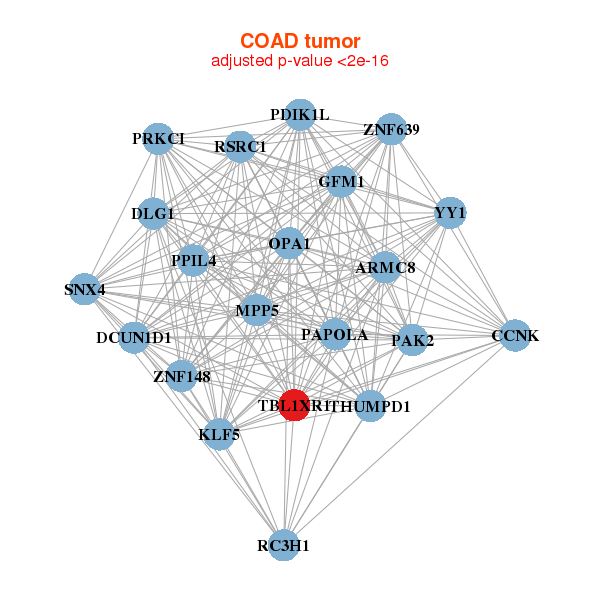
| ARMC8,CCNK,DCUN1D1,DLG1,GFM1,KLF5,MPP5, OPA1,PAK2,PAPOLA,PDIK1L,PPIL4,PRKCI,RC3H1, RSRC1,SNX4,TBL1XR1,THUMPD1,YY1,ZNF148,ZNF639 | ACAP2,CAMK2D,CD2AP,CMAS,CNOT2,FAM126B,FMR1, GDAP2,GPBP1,C2CD5,OPN3,PLOD2,RAB14,SLC20A1, SLC38A9,SP3,TBL1XR1,TMEM65,VCPIP1,YME1L1,ZNF654 |
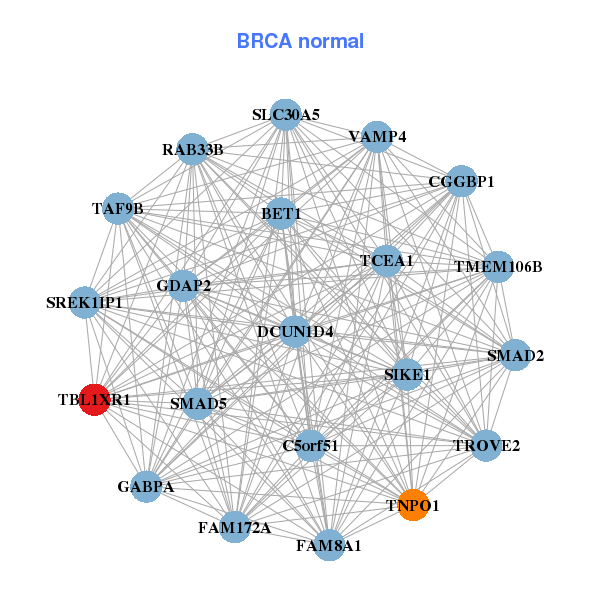
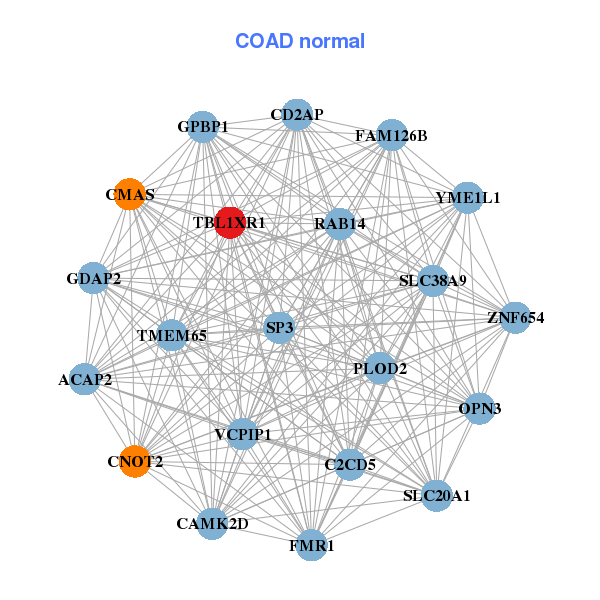
| * Co-Expression network figures were drawn using R package igraph. Only the top 20 genes with the highest correlations were shown. Red circle: input gene, orange circle: cell metabolism gene, sky circle: other gene |
: Open all plots for all cancer types
| Top |
: Open all interacting genes' information including KEGG pathway for all interacting genes from DAVID
| Top |
| Pharmacological Information for TBL1XR1 |
| There's no related Drug. |
| Top |
| Cross referenced IDs for TBL1XR1 |
| * We obtained these cross-references from Uniprot database. It covers 150 different DBs, 18 categories. http://www.uniprot.org/help/cross_references_section |
: Open all cross reference information
|
Copyright © 2016-Present - The Univsersity of Texas Health Science Center at Houston @ |