|
||||||||||||||||||||||||||||||||||||||||||||||||||||||||||||||||||||||||||||||||||||||||||||||||||||||||||||||||||||||||||||||||||||||||||||||||||||||||||||||||||||||||||||||||||||||||||||||||||||||||||||||||||||||||||||||||||||||||||||||||||||||||||||||||||||||||||||||||||||||||||||||||||||||||||||||||||||||||||
| |
| Phenotypic Information (metabolism pathway, cancer, disease, phenome) |
| |
| |
| Gene-Gene Network Information: Co-Expression Network, Interacting Genes & KEGG |
| |
|


| Gene Summary for DEGS1 |
| Basic gene info. | Gene symbol | DEGS1 |
| Gene name | delta(4)-desaturase, sphingolipid 1 | |
| Synonyms | DEGS|DEGS-1|DES1|Des-1|FADS7|MLD | |
| Cytomap | UCSC genome browser: 1q42.11 | |
| Genomic location | chr1 :224370909-224381142 | |
| Type of gene | protein-coding | |
| RefGenes | NM_144780.1, NM_003676.3, | |
| Ensembl id | ENSG00000143753 | |
| Description | cell migration-inducing gene 15 proteindegenerative spermatocyte homolog 1, lipid desaturasedegenerative spermatocyte homolog, lipid desaturasedihydroceramide desaturase 1membrane fatty acid (lipid) desaturasemembrane lipid desaturasemigration-induc | |
| Modification date | 20141207 | |
| dbXrefs | MIM : 615843 | |
| HGNC : HGNC | ||
| Ensembl : ENSG00000143753 | ||
| HPRD : 13133 | ||
| Vega : OTTHUMG00000037496 | ||
| Protein | UniProt: go to UniProt's Cross Reference DB Table | |
| Expression | CleanEX: HS_DEGS1 | |
| BioGPS: 8560 | ||
| Gene Expression Atlas: ENSG00000143753 | ||
| The Human Protein Atlas: ENSG00000143753 | ||
| Pathway | NCI Pathway Interaction Database: DEGS1 | |
| KEGG: DEGS1 | ||
| REACTOME: DEGS1 | ||
| ConsensusPathDB | ||
| Pathway Commons: DEGS1 | ||
| Metabolism | MetaCyc: DEGS1 | |
| HUMANCyc: DEGS1 | ||
| Regulation | Ensembl's Regulation: ENSG00000143753 | |
| miRBase: chr1 :224,370,909-224,381,142 | ||
| TargetScan: NM_144780 | ||
| cisRED: ENSG00000143753 | ||
| Context | iHOP: DEGS1 | |
| cancer metabolism search in PubMed: DEGS1 | ||
| UCL Cancer Institute: DEGS1 | ||
| Assigned class in ccmGDB | C | |
| Top |
| Phenotypic Information for DEGS1(metabolism pathway, cancer, disease, phenome) |
| Cancer | CGAP: DEGS1 |
| Familial Cancer Database: DEGS1 | |
| * This gene is included in those cancer gene databases. |
|
|
|
|
|
| . | ||||||||||||||||||||||||||||||||||||||||||||||||||||||||||||||||||||||||||||||||||||||||||||||||||||||||||||||||||||||||||||||||||||||||||||||||||||||||||||||||||||||||||||||||||||||||||||||||||||||||||||||||||||||||||||||||||||||||||||||||||||||||||||||||||||||||||||||||||||||||||||||||||||||||||||||||||||
Oncogene 1 | Significant driver gene in | |||||||||||||||||||||||||||||||||||||||||||||||||||||||||||||||||||||||||||||||||||||||||||||||||||||||||||||||||||||||||||||||||||||||||||||||||||||||||||||||||||||||||||||||||||||||||||||||||||||||||||||||||||||||||||||||||||||||||||||||||||||||||||||||||||||||||||||||||||||||||||||||||||||||||||||||||||||||||
| cf) number; DB name 1 Oncogene; http://nar.oxfordjournals.org/content/35/suppl_1/D721.long, 2 Tumor Suppressor gene; https://bioinfo.uth.edu/TSGene/, 3 Cancer Gene Census; http://www.nature.com/nrc/journal/v4/n3/abs/nrc1299.html, 4 CancerGenes; http://nar.oxfordjournals.org/content/35/suppl_1/D721.long, 5 Network of Cancer Gene; http://ncg.kcl.ac.uk/index.php, 1Therapeutic Vulnerabilities in Cancer; http://cbio.mskcc.org/cancergenomics/statius/ |
| KEGG_SPHINGOLIPID_METABOLISM REACTOME_PHOSPHOLIPID_METABOLISM REACTOME_SPHINGOLIPID_METABOLISM REACTOME_METABOLISM_OF_LIPIDS_AND_LIPOPROTEINS | |
| OMIM | |
| Orphanet | |
| Disease | KEGG Disease: DEGS1 |
| MedGen: DEGS1 (Human Medical Genetics with Condition) | |
| ClinVar: DEGS1 | |
| Phenotype | MGI: DEGS1 (International Mouse Phenotyping Consortium) |
| PhenomicDB: DEGS1 | |
| Mutations for DEGS1 |
| * Under tables are showing count per each tissue to give us broad intuition about tissue specific mutation patterns.You can go to the detailed page for each mutation database's web site. |
| There's no structural variation information in COSMIC data for this gene. |
| * From mRNA Sanger sequences, Chitars2.0 arranged chimeric transcripts. This table shows DEGS1 related fusion information. |
| ID | Head Gene | Tail Gene | Accession | Gene_a | qStart_a | qEnd_a | Chromosome_a | tStart_a | tEnd_a | Gene_a | qStart_a | qEnd_a | Chromosome_a | tStart_a | tEnd_a |
| BF944194 | DEGS1 | 24 | 243 | 1 | 224377512 | 224377733 | DMPK | 243 | 402 | 19 | 46283369 | 46283522 | |
| BG249152 | DEGS1 | 1 | 60 | 1 | 224377865 | 224377924 | SERINC1 | 58 | 753 | 6 | 122765667 | 122767951 | |
| AI167570 | DEGS1 | 1 | 181 | 1 | 224379907 | 224380087 | CDC73 | 178 | 478 | 1 | 193189506 | 193189807 | |
| AL079576 | DEGS1 | 41 | 108 | 1 | 224377681 | 224377748 | DEGS1 | 104 | 331 | 1 | 224377728 | 224377955 | |
| Top |
| Mutation type/ Tissue ID | brca | cns | cerv | endome | haematopo | kidn | Lintest | liver | lung | ns | ovary | pancre | prost | skin | stoma | thyro | urina | |||
| Total # sample | 1 | |||||||||||||||||||
| GAIN (# sample) | 1 | |||||||||||||||||||
| LOSS (# sample) |
| cf) Tissue ID; Tissue type (1; Breast, 2; Central_nervous_system, 3; Cervix, 4; Endometrium, 5; Haematopoietic_and_lymphoid_tissue, 6; Kidney, 7; Large_intestine, 8; Liver, 9; Lung, 10; NS, 11; Ovary, 12; Pancreas, 13; Prostate, 14; Skin, 15; Stomach, 16; Thyroid, 17; Urinary_tract) |
| Top |
|
 |
| Top |
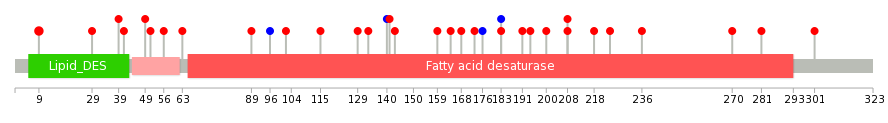
| Stat. for Non-Synonymous SNVs (# total SNVs=29) | (# total SNVs=2) |
 |  |
(# total SNVs=1) | (# total SNVs=0) |
 |
| Top |
| * When you move the cursor on each content, you can see more deailed mutation information on the Tooltip. Those are primary_site,primary_histology,mutation(aa),pubmedID. |
| GRCh37 position | Mutation(aa) | Unique sampleID count |
| chr1:224377819-224377819 | p.S208Y | 2 |
| chr1:224371065-224371065 | p.D9E | 2 |
| chr1:224380110-224380110 | p.V301A | 1 |
| chr1:224377317-224377317 | p.P41T | 1 |
| chr1:224377616-224377616 | p.V140V | 1 |
| chr1:224377767-224377767 | p.V191M | 1 |
| chr1:224377343-224377343 | p.M49I | 1 |
| chr1:224377618-224377618 | p.D141G | 1 |
| chr1:224377776-224377776 | p.V194I | 1 |
| chr1:224377347-224377347 | p.V51L | 1 |
| Top |
|
 |
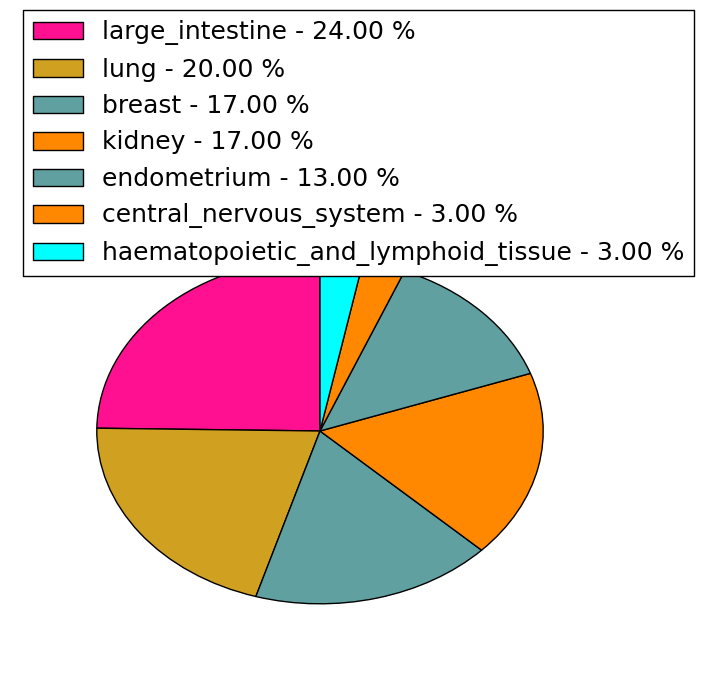
| Point Mutation/ Tissue ID | 1 | 2 | 3 | 4 | 5 | 6 | 7 | 8 | 9 | 10 | 11 | 12 | 13 | 14 | 15 | 16 | 17 | 18 | 19 | 20 |
| # sample | 3 | 2 | 1 | 3 | 3 | 1 | 1 | 2 | 4 | |||||||||||
| # mutation | 3 | 2 | 1 | 3 | 3 | 1 | 1 | 2 | 6 | |||||||||||
| nonsynonymous SNV | 3 | 2 | 1 | 3 | 3 | 1 | 1 | 2 | 4 | |||||||||||
| synonymous SNV | 2 |
| cf) Tissue ID; Tissue type (1; BLCA[Bladder Urothelial Carcinoma], 2; BRCA[Breast invasive carcinoma], 3; CESC[Cervical squamous cell carcinoma and endocervical adenocarcinoma], 4; COAD[Colon adenocarcinoma], 5; GBM[Glioblastoma multiforme], 6; Glioma Low Grade, 7; HNSC[Head and Neck squamous cell carcinoma], 8; KICH[Kidney Chromophobe], 9; KIRC[Kidney renal clear cell carcinoma], 10; KIRP[Kidney renal papillary cell carcinoma], 11; LAML[Acute Myeloid Leukemia], 12; LUAD[Lung adenocarcinoma], 13; LUSC[Lung squamous cell carcinoma], 14; OV[Ovarian serous cystadenocarcinoma ], 15; PAAD[Pancreatic adenocarcinoma], 16; PRAD[Prostate adenocarcinoma], 17; SKCM[Skin Cutaneous Melanoma], 18:STAD[Stomach adenocarcinoma], 19:THCA[Thyroid carcinoma], 20:UCEC[Uterine Corpus Endometrial Carcinoma]) |
| Top |
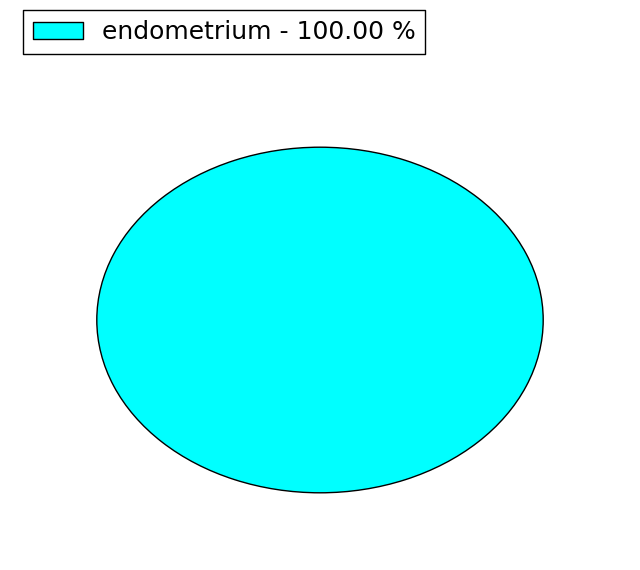
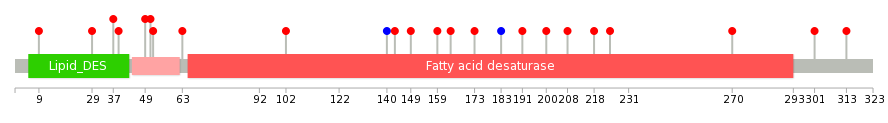
| * We represented just top 10 SNVs. When you move the cursor on each content, you can see more deailed mutation information on the Tooltip. Those are primary_site, primary_histology, mutation(aa), pubmedID. |
| Genomic Position | Mutation(aa) | Unique sampleID count |
| chr1:224377312 | p.G270A | 1 |
| chr1:224377714 | p.V51L | 1 |
| chr1:224377343 | p.V301A | 1 |
| chr1:224377745 | p.L52H | 1 |
| chr1:224377347 | p.K313N | 1 |
| chr1:224377767 | p.D63Y | 1 |
| chr1:224377351 | p.A102T | 1 |
| chr1:224377794 | p.V140V | 1 |
| chr1:224377383 | p.D143N | 1 |
| chr1:224377819 | p.E149D | 1 |
| * Copy number data were extracted from TCGA using R package TCGA-Assembler. The URLs of all public data files on TCGA DCC data server were gathered on Jan-05-2015. Function ProcessCNAData in TCGA-Assembler package was used to obtain gene-level copy number value which is calculated as the average copy number of the genomic region of a gene. |
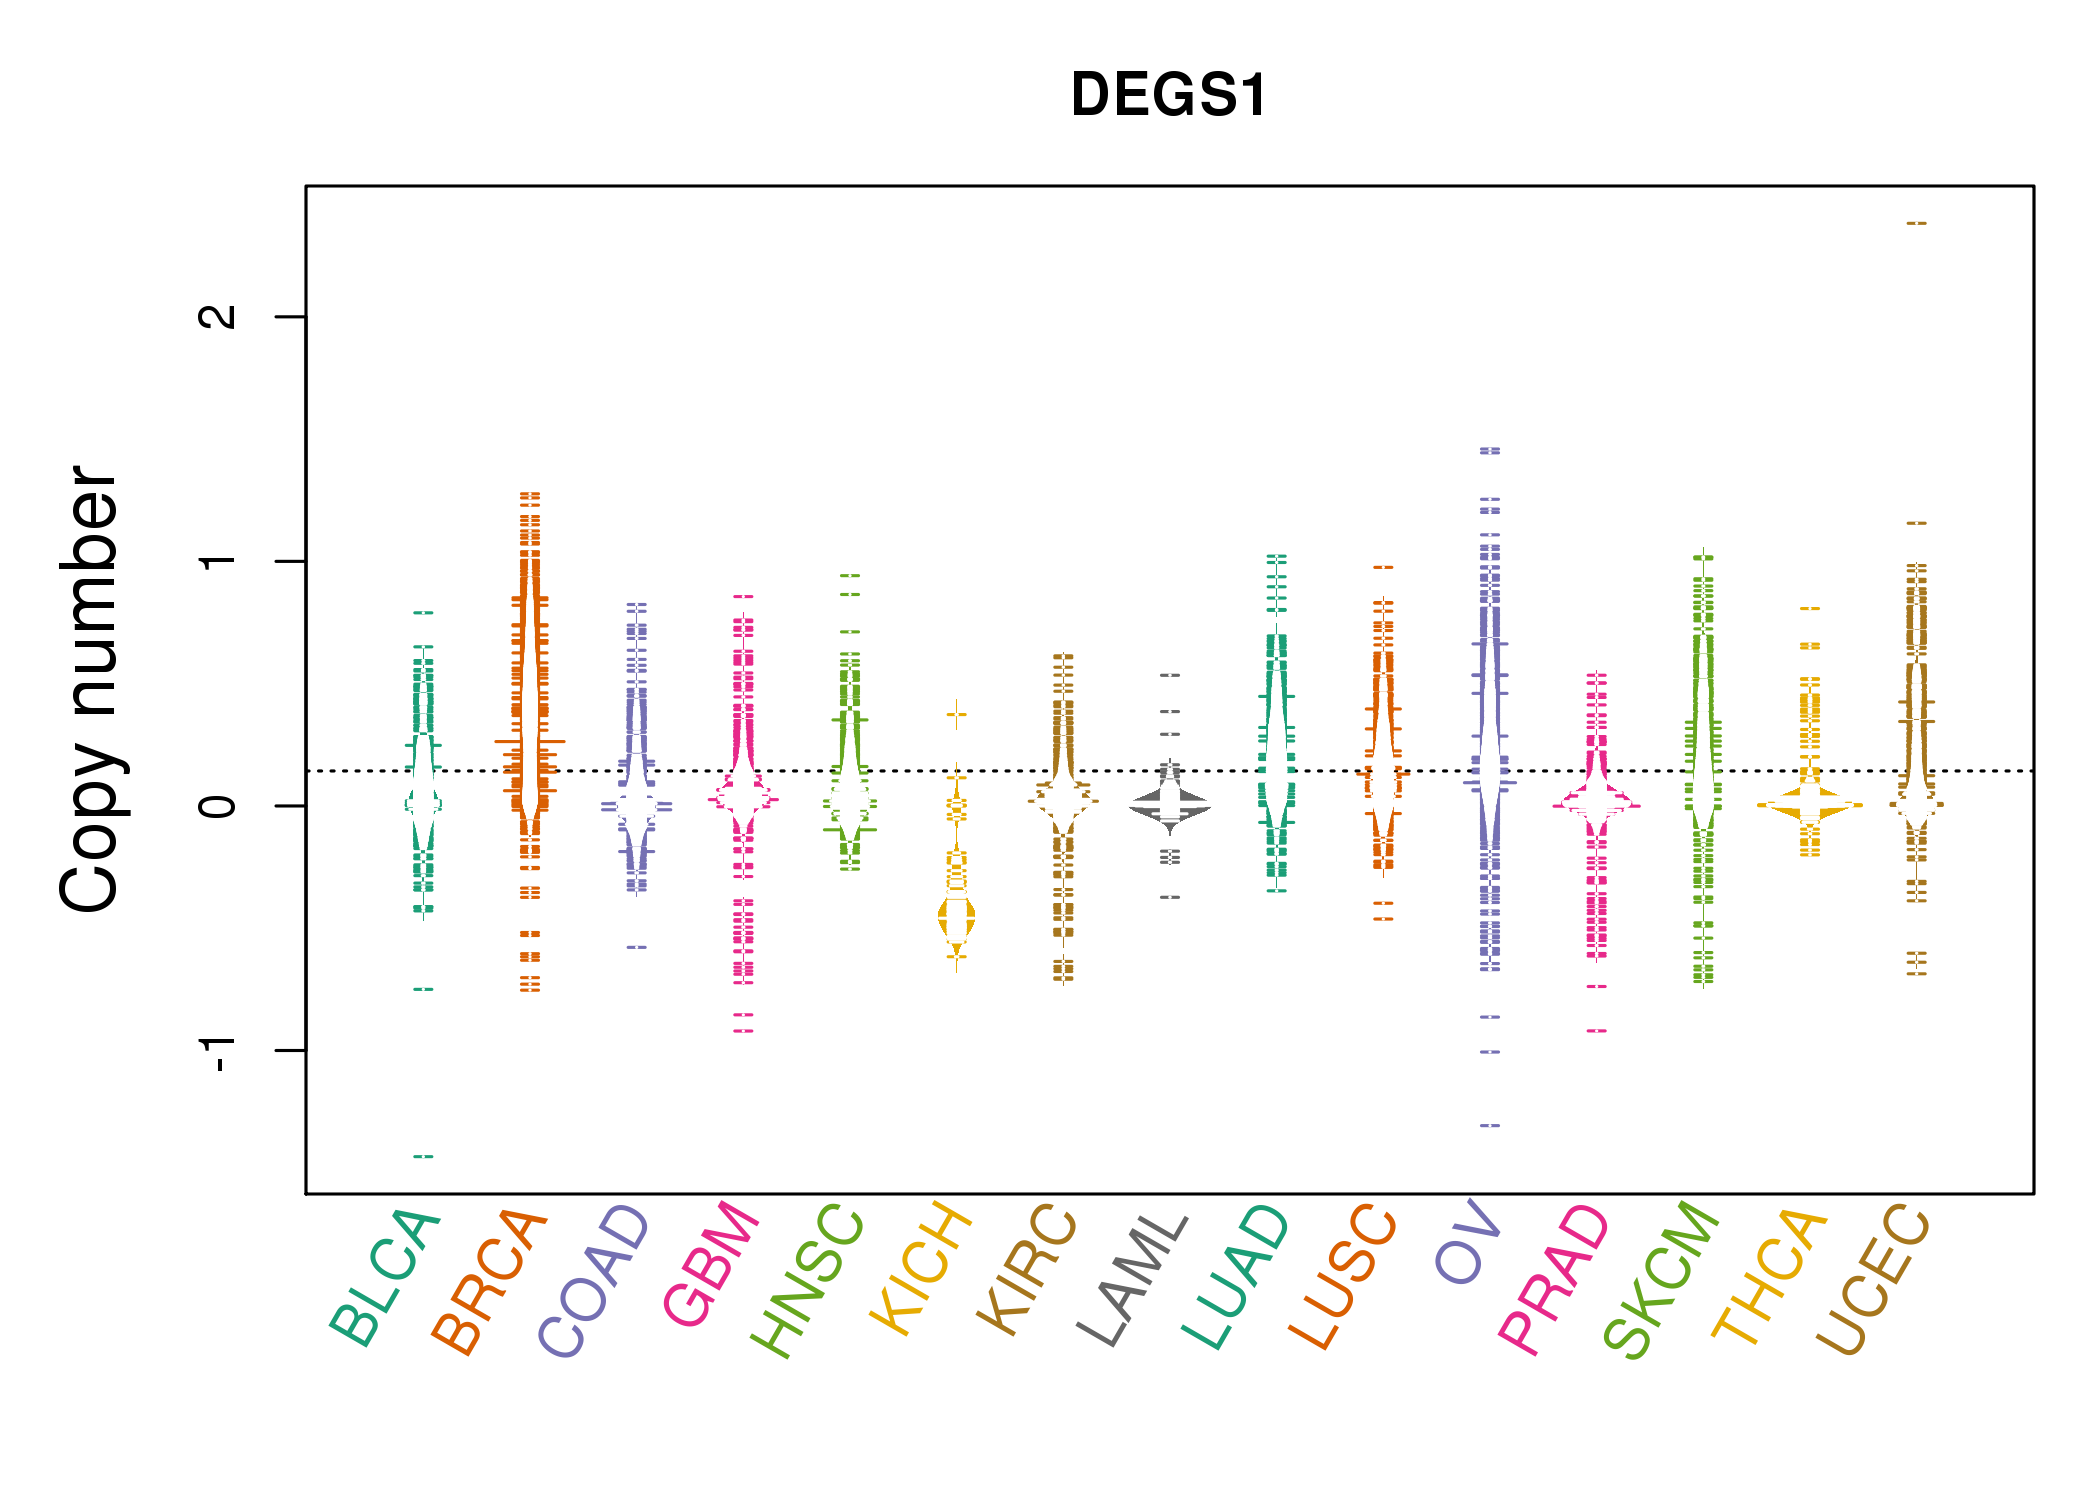 |
| cf) Tissue ID[Tissue type]: BLCA[Bladder Urothelial Carcinoma], BRCA[Breast invasive carcinoma], CESC[Cervical squamous cell carcinoma and endocervical adenocarcinoma], COAD[Colon adenocarcinoma], GBM[Glioblastoma multiforme], Glioma Low Grade, HNSC[Head and Neck squamous cell carcinoma], KICH[Kidney Chromophobe], KIRC[Kidney renal clear cell carcinoma], KIRP[Kidney renal papillary cell carcinoma], LAML[Acute Myeloid Leukemia], LUAD[Lung adenocarcinoma], LUSC[Lung squamous cell carcinoma], OV[Ovarian serous cystadenocarcinoma ], PAAD[Pancreatic adenocarcinoma], PRAD[Prostate adenocarcinoma], SKCM[Skin Cutaneous Melanoma], STAD[Stomach adenocarcinoma], THCA[Thyroid carcinoma], UCEC[Uterine Corpus Endometrial Carcinoma] |
| Top |
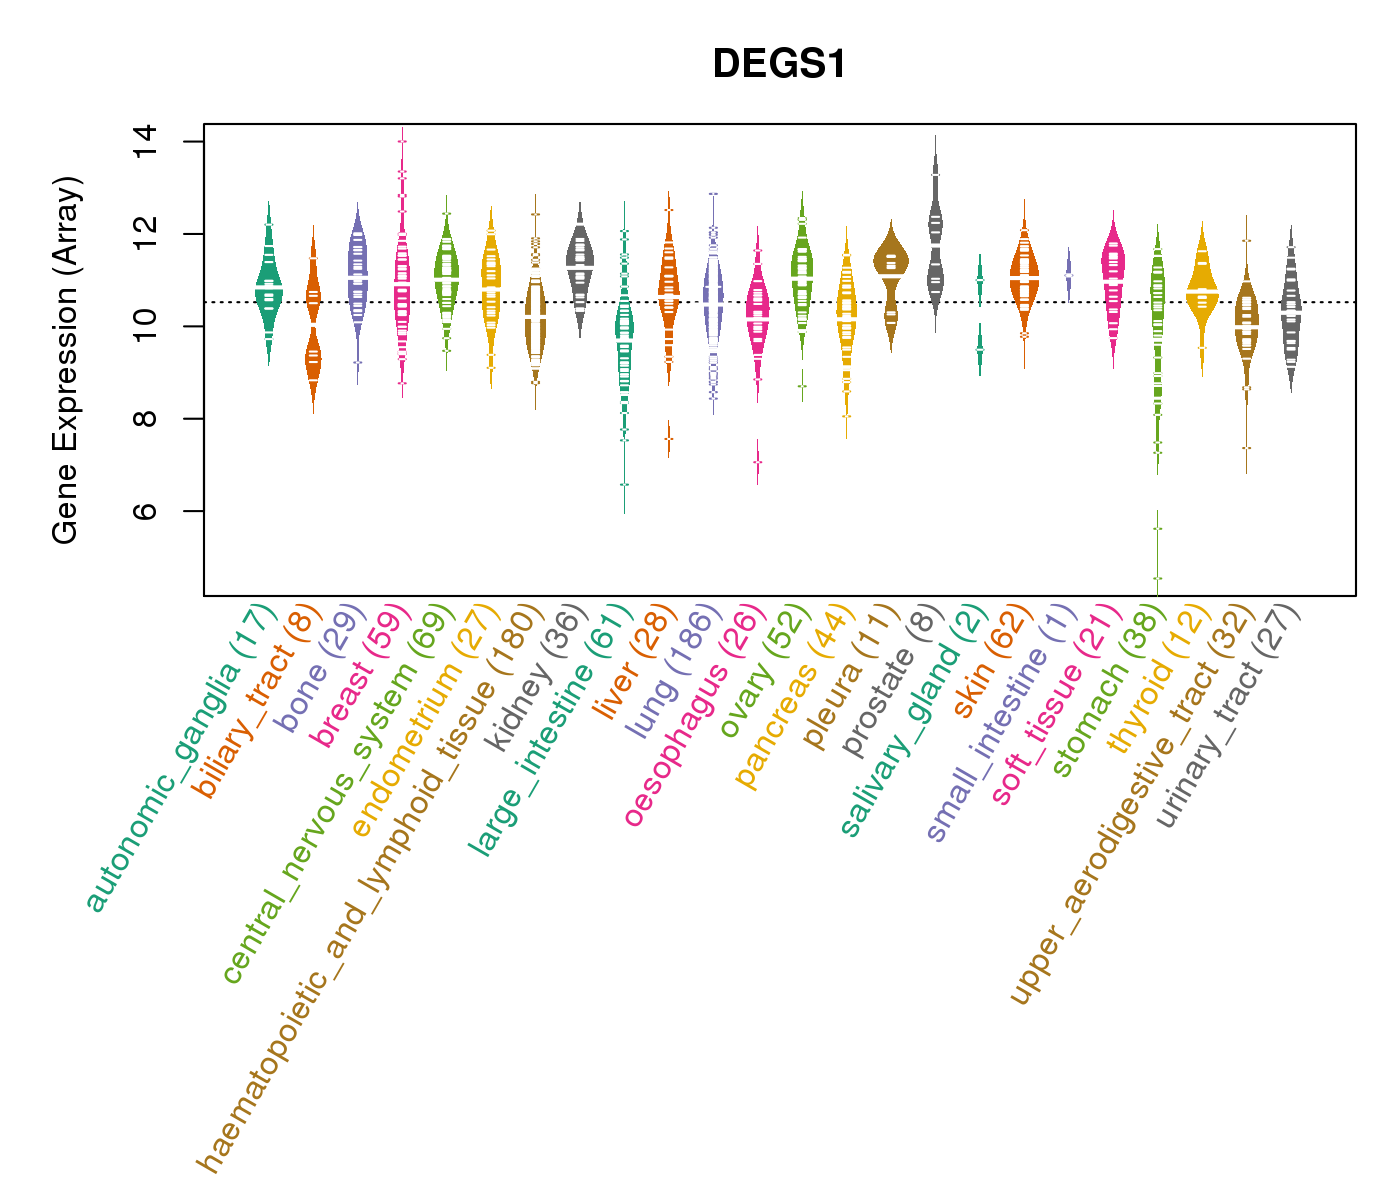
| Gene Expression for DEGS1 |
| * CCLE gene expression data were extracted from CCLE_Expression_Entrez_2012-10-18.res: Gene-centric RMA-normalized mRNA expression data. |
 |
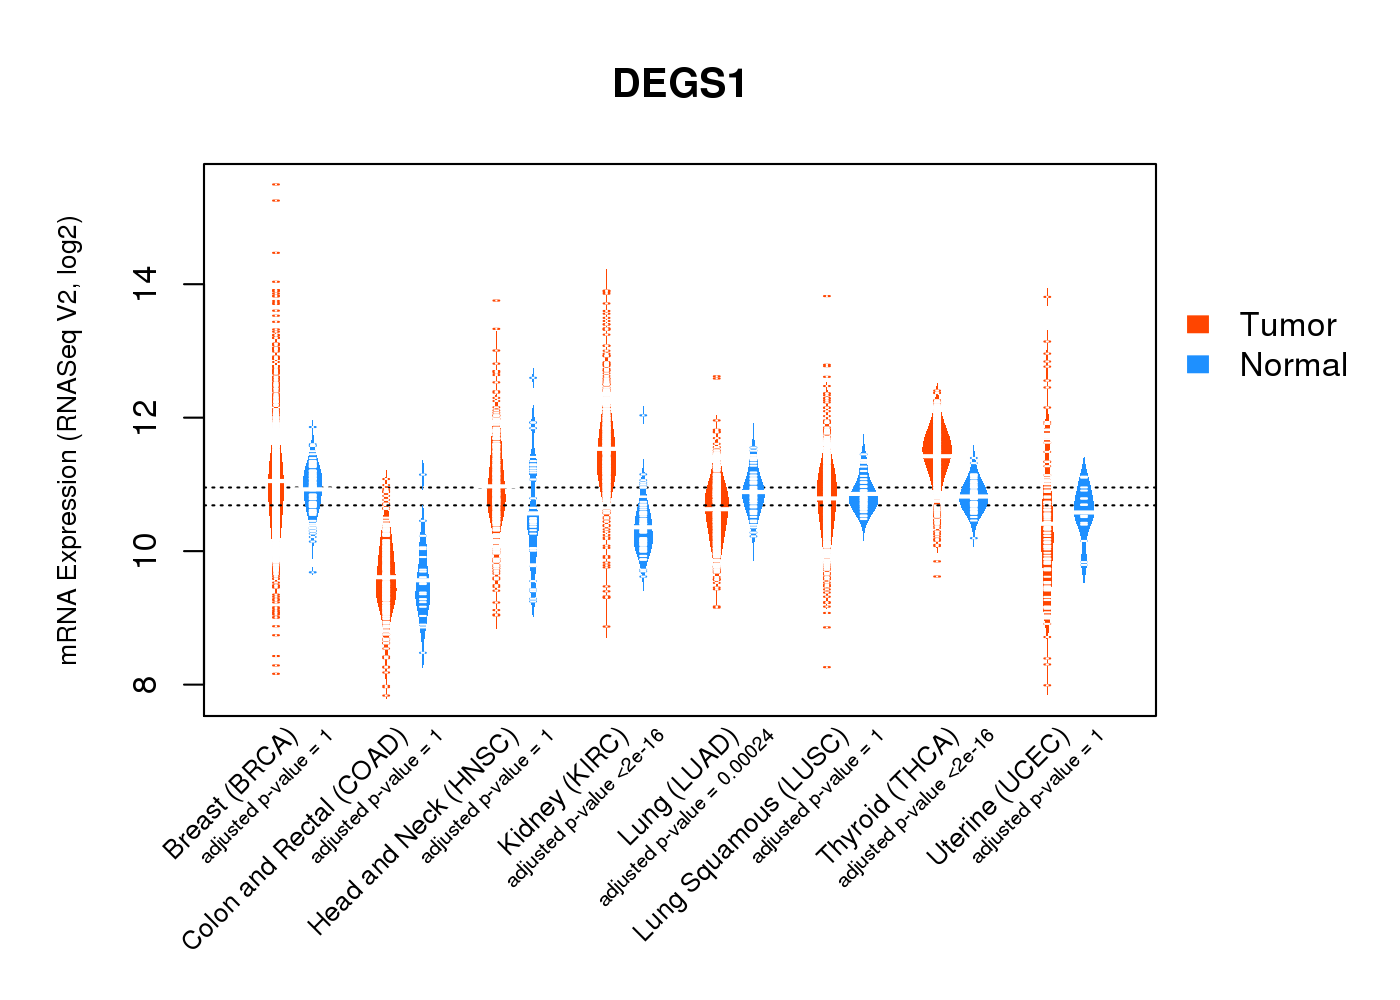
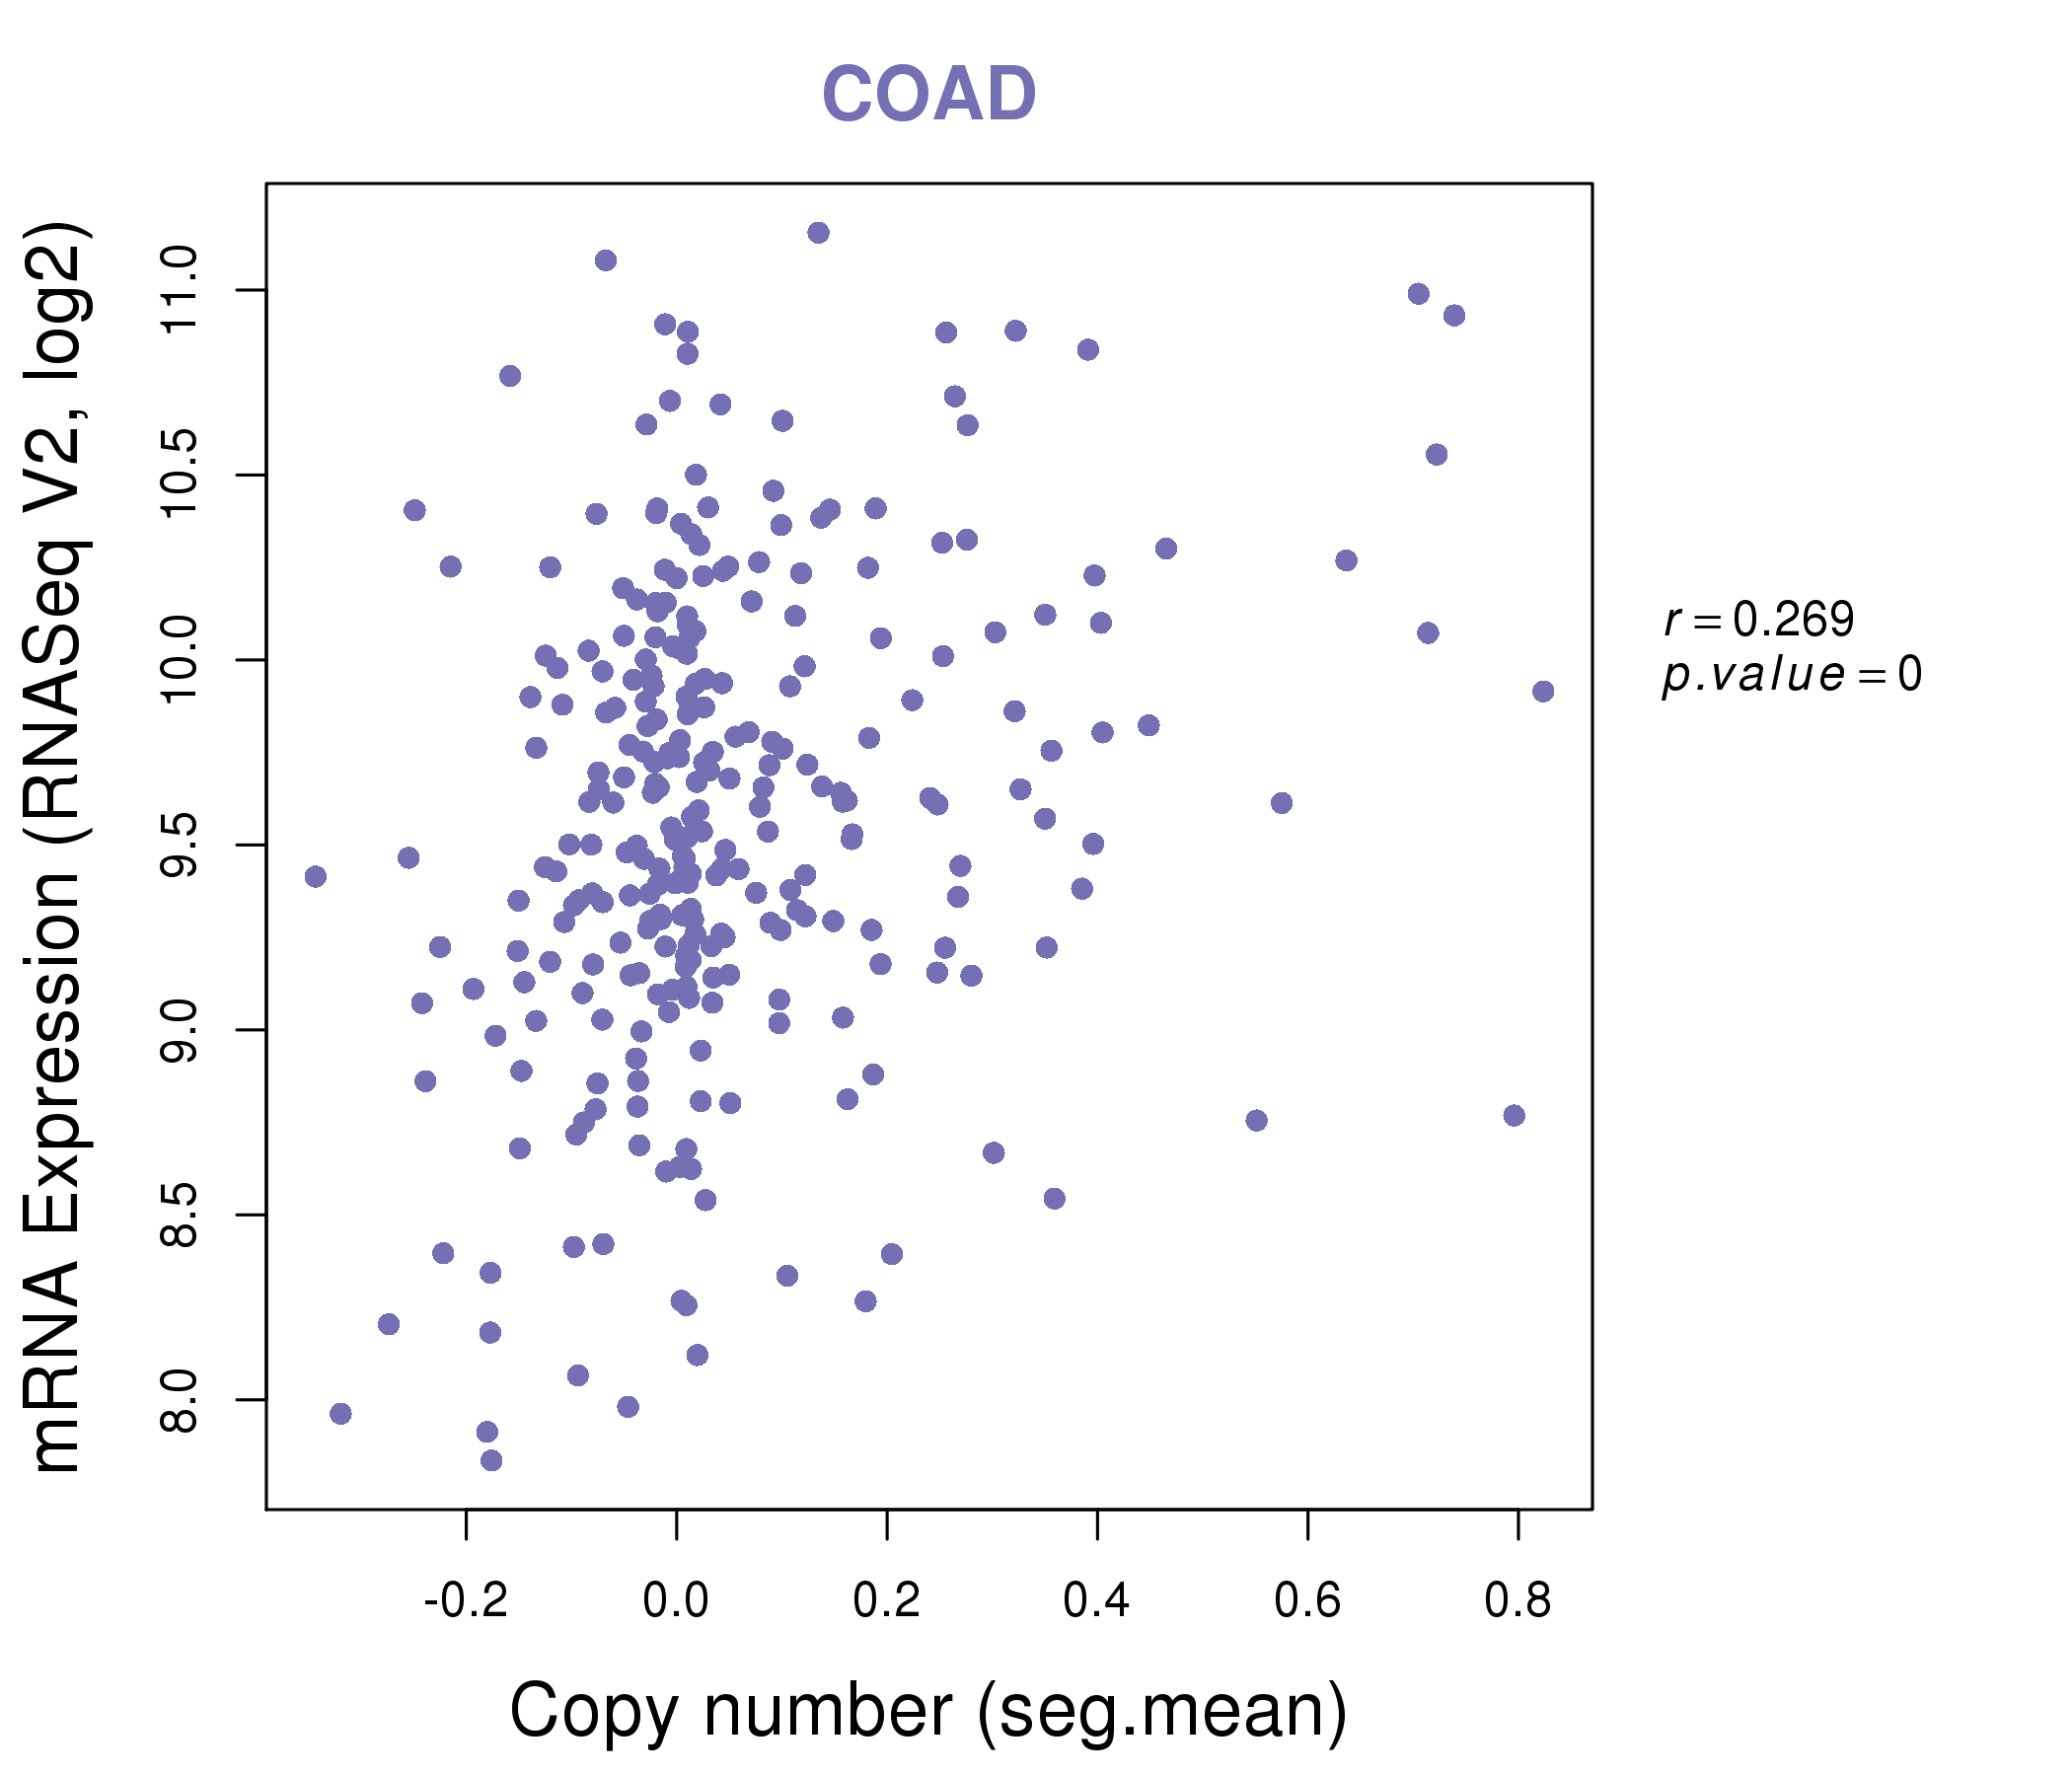
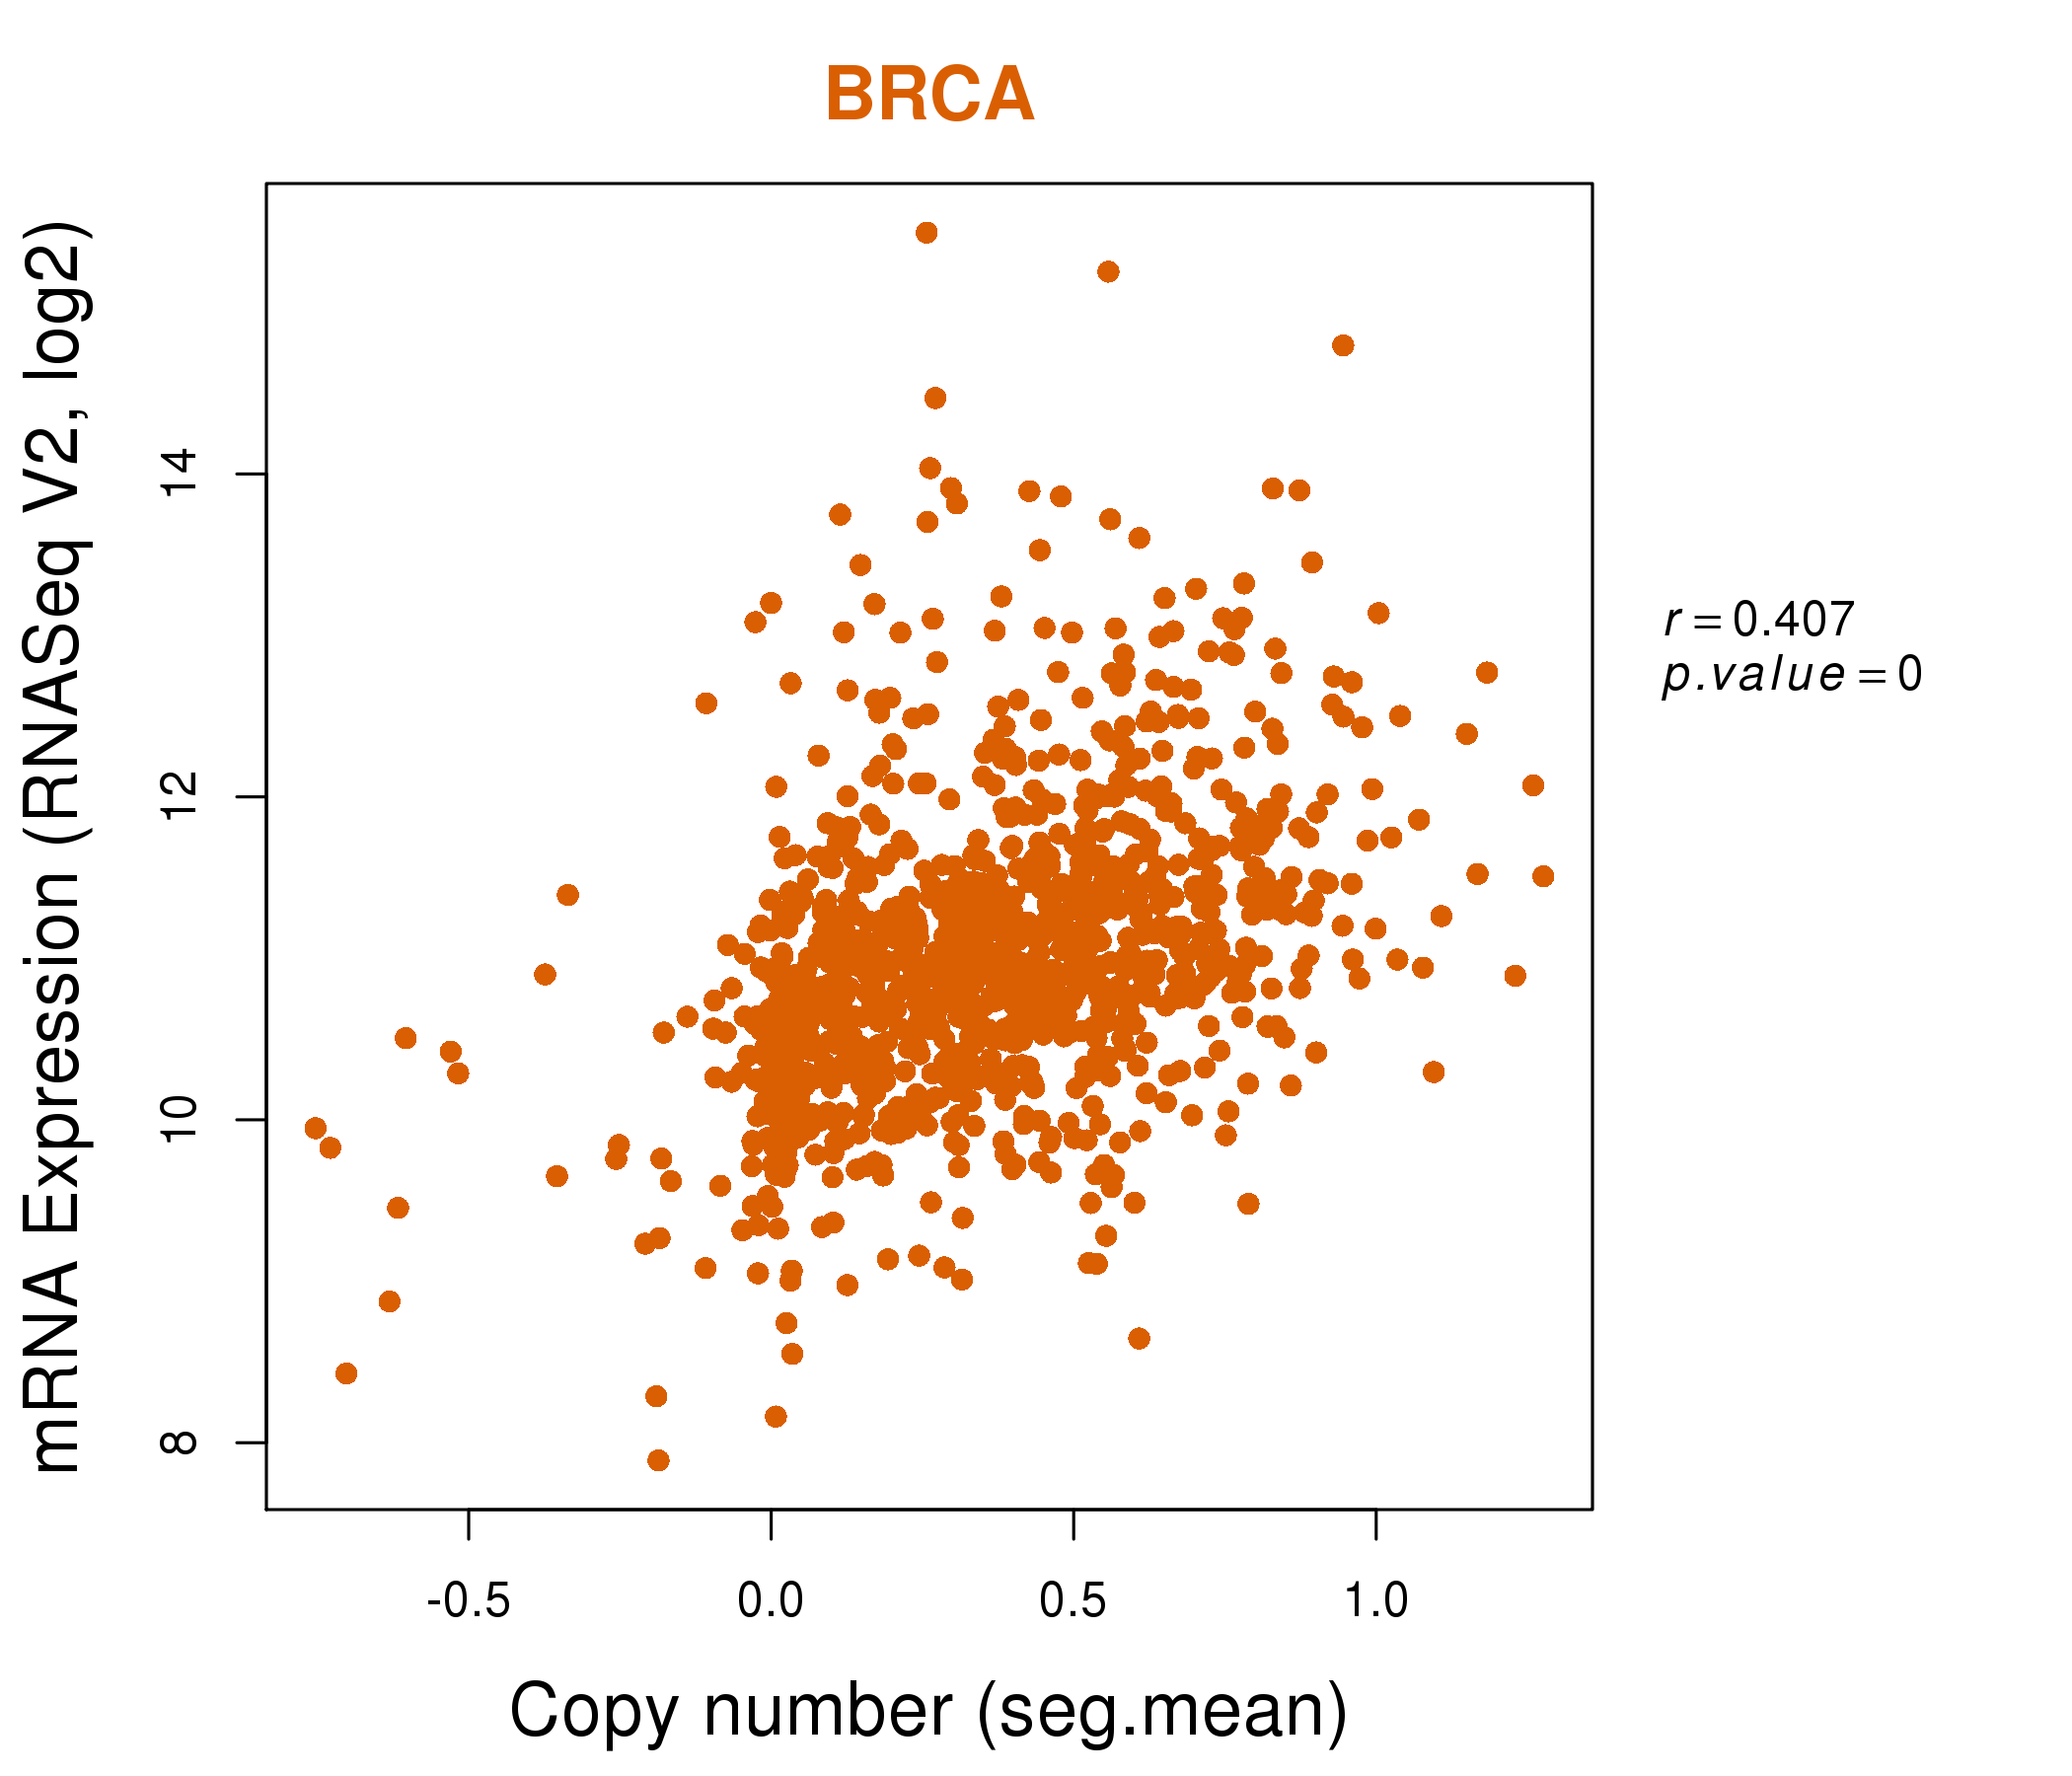
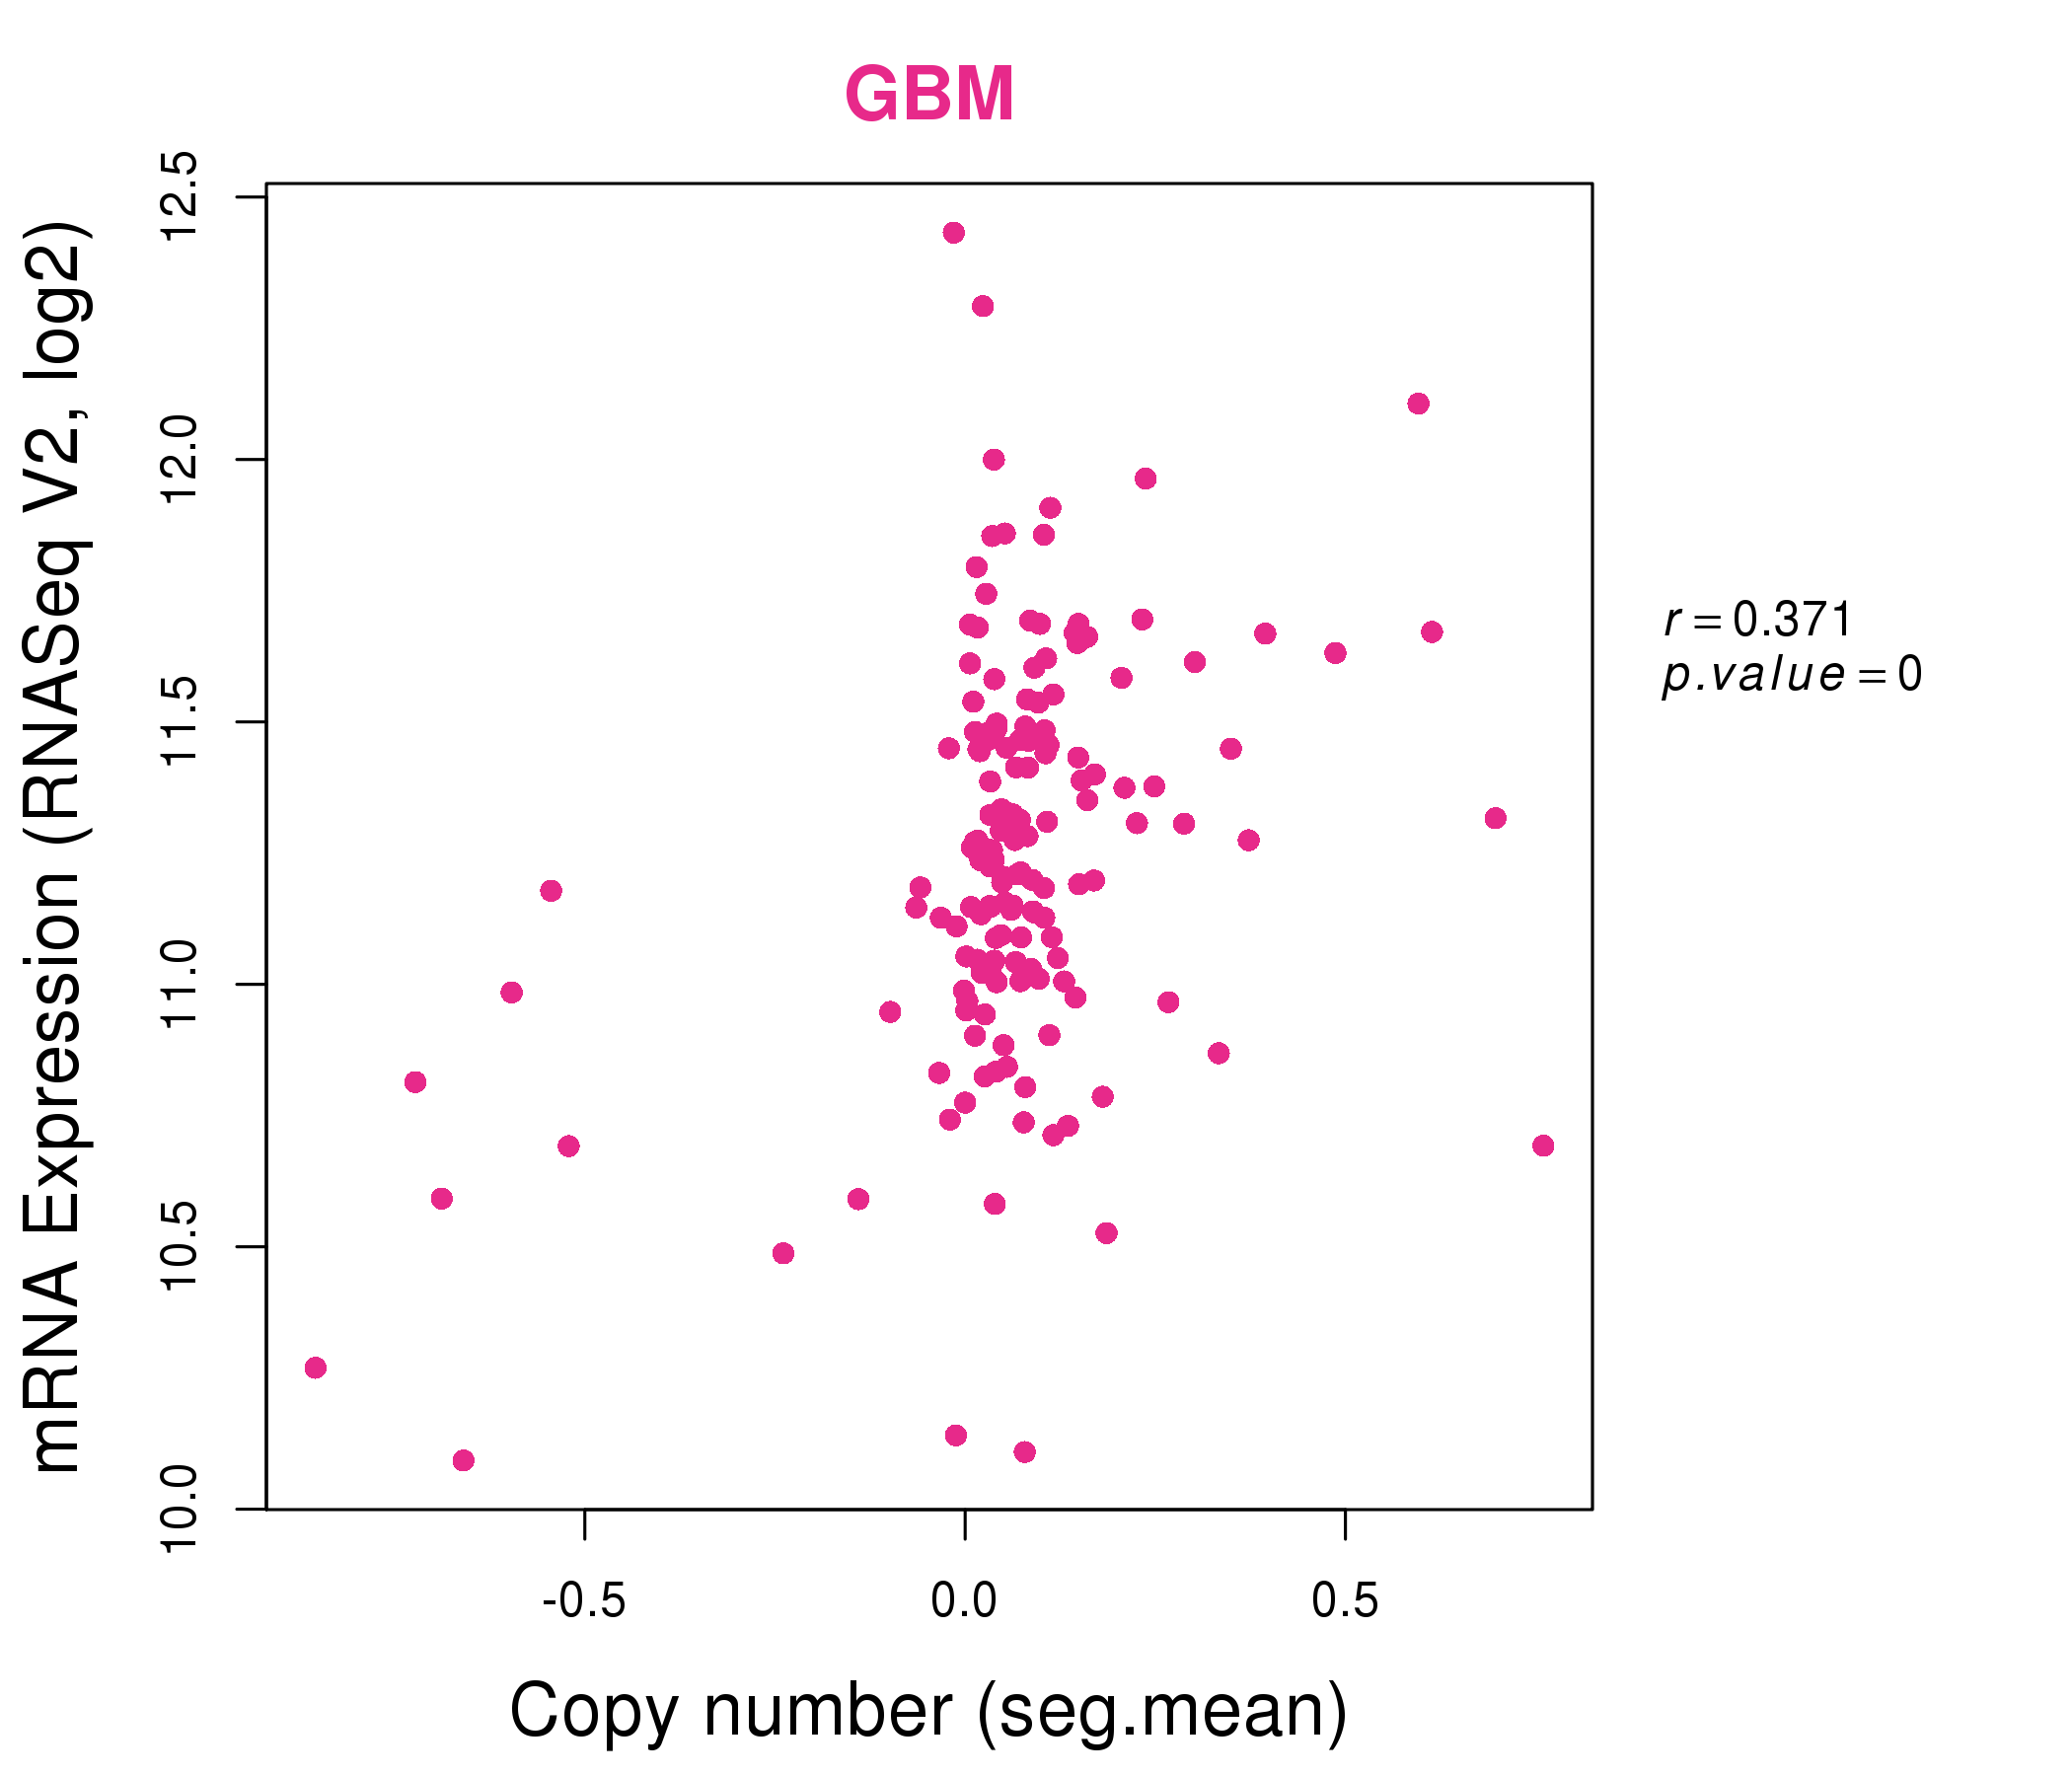
| * Normalized gene expression data of RNASeqV2 was extracted from TCGA using R package TCGA-Assembler. The URLs of all public data files on TCGA DCC data server were gathered at Jan-05-2015. Only eight cancer types have enough normal control samples for differential expression analysis. (t test, adjusted p<0.05 (using Benjamini-Hochberg FDR)) |
 |
| Top |
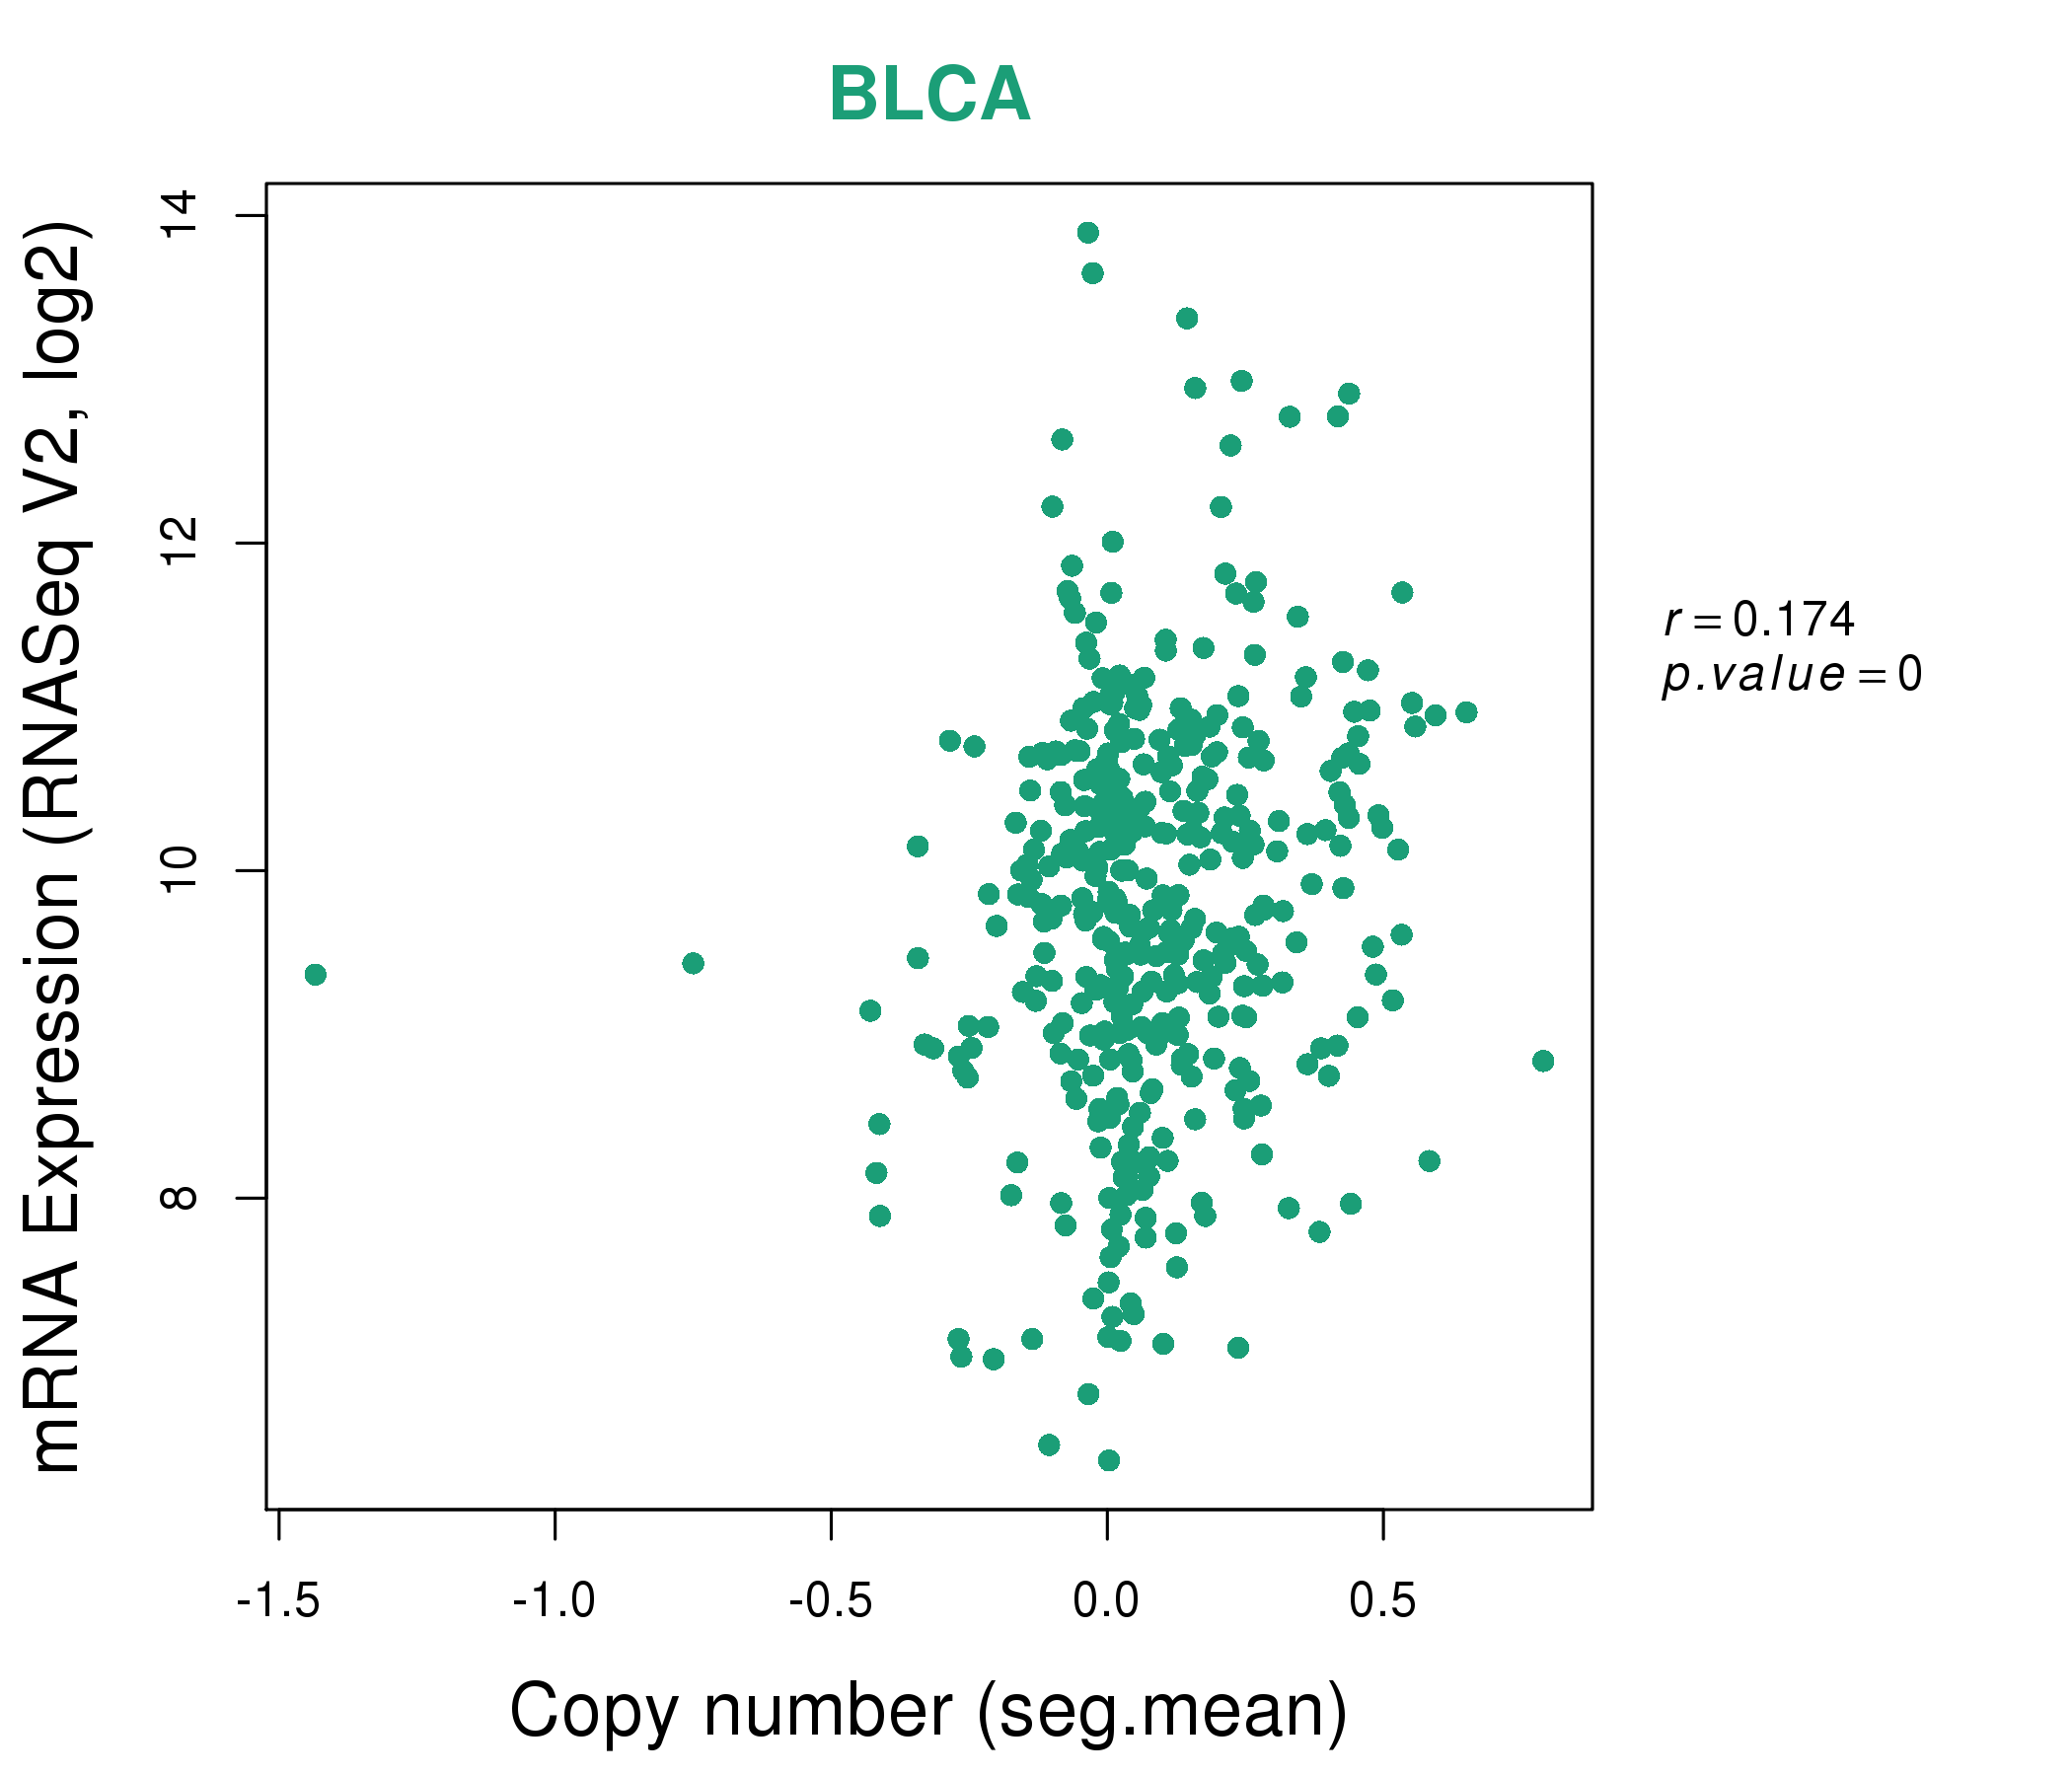
| * This plots show the correlation between CNV and gene expression. |
: Open all plots for all cancer types
 |
|
 |
|
| Top |
| Gene-Gene Network Information |
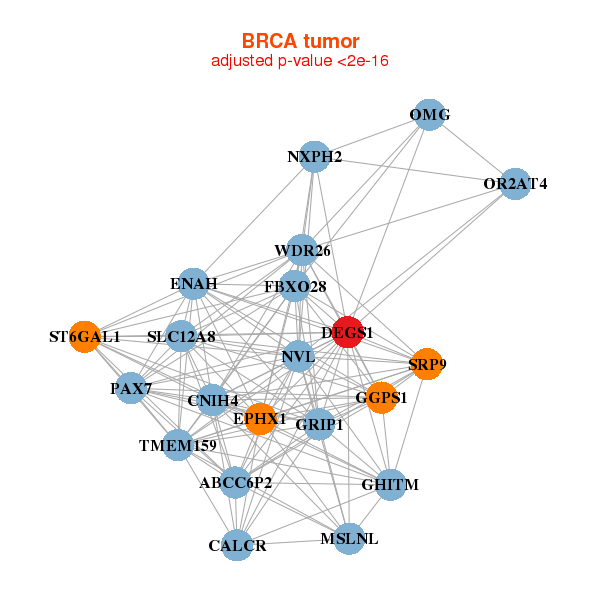
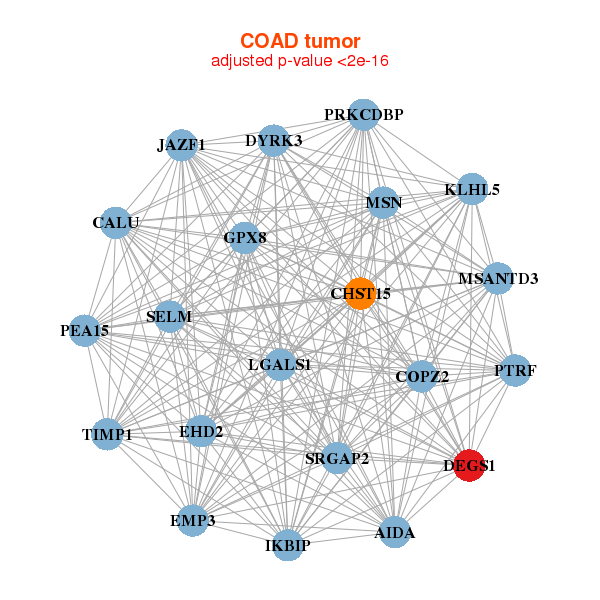
| * Co-Expression network figures were drawn using R package igraph. Only the top 20 genes with the highest correlations were shown. Red circle: input gene, orange circle: cell metabolism gene, sky circle: other gene |
: Open all plots for all cancer types
 |
|
| ABCC6P2,CALCR,CNIH4,DEGS1,ENAH,EPHX1,FBXO28, GGPS1,GHITM,GRIP1,MSLNL,NVL,NXPH2,OMG, OR2AT4,PAX7,SLC12A8,SRP9,ST6GAL1,TMEM159,WDR26 | ANXA1,ARF4,ARL2BP,ATP6AP2,DTD2,TPGS2,C1orf198, CALM2,CCNY,CMPK1,DEGS1,ETF1,MAPRE1,PPA1, PPP2CB,PWP1,RAB1A,RAB9A,RAP1B,SLC25A43,UBE2E2 |
 |
|
| AIDA,MSANTD3,CALU,CHST15,COPZ2,DEGS1,DYRK3, EHD2,EMP3,GPX8,IKBIP,JAZF1,KLHL5,LGALS1, MSN,PEA15,PRKCDBP,PTRF,SELM,SRGAP2,TIMP1 | ARL4D,CLMP,BAG2,CALU,CCDC69,CFL2,DEGS1, DTNA,GUCY1B3,KCNJ8,PEA15,PLEKHO1,RAB31,RAB34, RAMP1,RASSF8,RPS6KC1,SCRG1,SELM,TEAD2,TMEM55A |
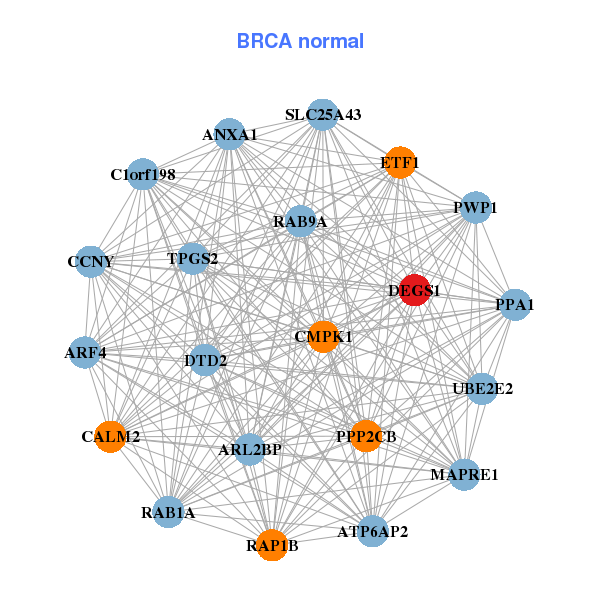
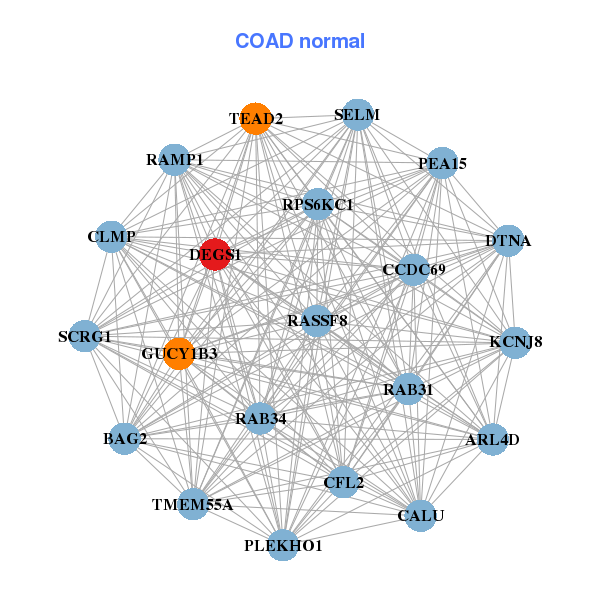
| * Co-Expression network figures were drawn using R package igraph. Only the top 20 genes with the highest correlations were shown. Red circle: input gene, orange circle: cell metabolism gene, sky circle: other gene |
: Open all plots for all cancer types
| Top |
: Open all interacting genes' information including KEGG pathway for all interacting genes from DAVID
| Top |
| Pharmacological Information for DEGS1 |
| There's no related Drug. |
| Top |
| Cross referenced IDs for DEGS1 |
| * We obtained these cross-references from Uniprot database. It covers 150 different DBs, 18 categories. http://www.uniprot.org/help/cross_references_section |
: Open all cross reference information
|
Copyright © 2016-Present - The Univsersity of Texas Health Science Center at Houston @ |