|
||||||||||||||||||||||||||||||||||||||||||||||||||||||||||||||||||||||||||||||||||||||||||||||||||||||||||||||||||||||||||||||||||||||||||||||||||||||||||||||||||||||||||||||||||||||||||||||||||||||||||||||||||||||||||||||||||||||||||||||||||||||||||||||||||||||||||||||||||||||||||||||||||||||||||||||||||||||||||
| |
| Phenotypic Information (metabolism pathway, cancer, disease, phenome) |
| |
| |
| Gene-Gene Network Information: Co-Expression Network, Interacting Genes & KEGG |
| |
|


| Gene Summary for EIF3B |
| Basic gene info. | Gene symbol | EIF3B |
| Gene name | eukaryotic translation initiation factor 3, subunit B | |
| Synonyms | EIF3-ETA|EIF3-P110|EIF3-P116|EIF3S9|PRT1 | |
| Cytomap | UCSC genome browser: 7p22.3 | |
| Genomic location | chr7 :2394473-2420377 | |
| Type of gene | protein-coding | |
| RefGenes | NM_001037283.1, NM_003751.3, | |
| Ensembl id | ENSG00000106263 | |
| Description | eIF-3-etaeIF3 p110eIF3 p116eukaryotic translation initiation factor 3 subunit 9eukaryotic translation initiation factor 3 subunit Beukaryotic translation initiation factor 3, subunit 9 (eta, 116kD)eukaryotic translation initiation factor 3, subunit | |
| Modification date | 20141207 | |
| dbXrefs | MIM : 603917 | |
| HGNC : HGNC | ||
| Ensembl : ENSG00000106263 | ||
| HPRD : 06795 | ||
| Vega : OTTHUMG00000022839 | ||
| Protein | UniProt: go to UniProt's Cross Reference DB Table | |
| Expression | CleanEX: HS_EIF3B | |
| BioGPS: 8662 | ||
| Gene Expression Atlas: ENSG00000106263 | ||
| The Human Protein Atlas: ENSG00000106263 | ||
| Pathway | NCI Pathway Interaction Database: EIF3B | |
| KEGG: EIF3B | ||
| REACTOME: EIF3B | ||
| ConsensusPathDB | ||
| Pathway Commons: EIF3B | ||
| Metabolism | MetaCyc: EIF3B | |
| HUMANCyc: EIF3B | ||
| Regulation | Ensembl's Regulation: ENSG00000106263 | |
| miRBase: chr7 :2,394,473-2,420,377 | ||
| TargetScan: NM_001037283 | ||
| cisRED: ENSG00000106263 | ||
| Context | iHOP: EIF3B | |
| cancer metabolism search in PubMed: EIF3B | ||
| UCL Cancer Institute: EIF3B | ||
| Assigned class in ccmGDB | C | |
| Top |
| Phenotypic Information for EIF3B(metabolism pathway, cancer, disease, phenome) |
| Cancer | CGAP: EIF3B |
| Familial Cancer Database: EIF3B | |
| * This gene is included in those cancer gene databases. |
|
|
|
|
|
| . | ||||||||||||||||||||||||||||||||||||||||||||||||||||||||||||||||||||||||||||||||||||||||||||||||||||||||||||||||||||||||||||||||||||||||||||||||||||||||||||||||||||||||||||||||||||||||||||||||||||||||||||||||||||||||||||||||||||||||||||||||||||||||||||||||||||||||||||||||||||||||||||||||||||||||||||||||||||
Oncogene 1 | Significant driver gene in | |||||||||||||||||||||||||||||||||||||||||||||||||||||||||||||||||||||||||||||||||||||||||||||||||||||||||||||||||||||||||||||||||||||||||||||||||||||||||||||||||||||||||||||||||||||||||||||||||||||||||||||||||||||||||||||||||||||||||||||||||||||||||||||||||||||||||||||||||||||||||||||||||||||||||||||||||||||||||
| cf) number; DB name 1 Oncogene; http://nar.oxfordjournals.org/content/35/suppl_1/D721.long, 2 Tumor Suppressor gene; https://bioinfo.uth.edu/TSGene/, 3 Cancer Gene Census; http://www.nature.com/nrc/journal/v4/n3/abs/nrc1299.html, 4 CancerGenes; http://nar.oxfordjournals.org/content/35/suppl_1/D721.long, 5 Network of Cancer Gene; http://ncg.kcl.ac.uk/index.php, 1Therapeutic Vulnerabilities in Cancer; http://cbio.mskcc.org/cancergenomics/statius/ |
| REACTOME_METABOLISM_OF_PROTEINS | |
| OMIM | |
| Orphanet | |
| Disease | KEGG Disease: EIF3B |
| MedGen: EIF3B (Human Medical Genetics with Condition) | |
| ClinVar: EIF3B | |
| Phenotype | MGI: EIF3B (International Mouse Phenotyping Consortium) |
| PhenomicDB: EIF3B | |
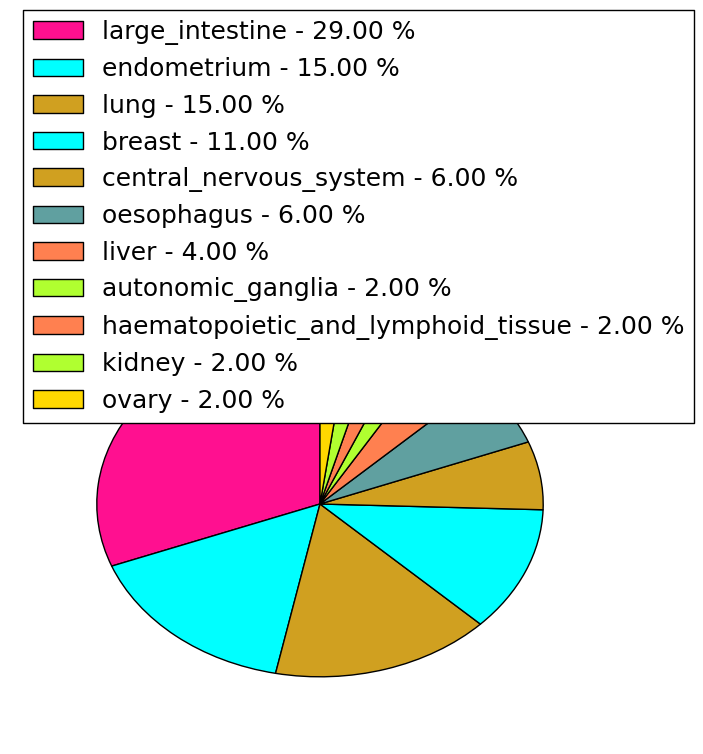
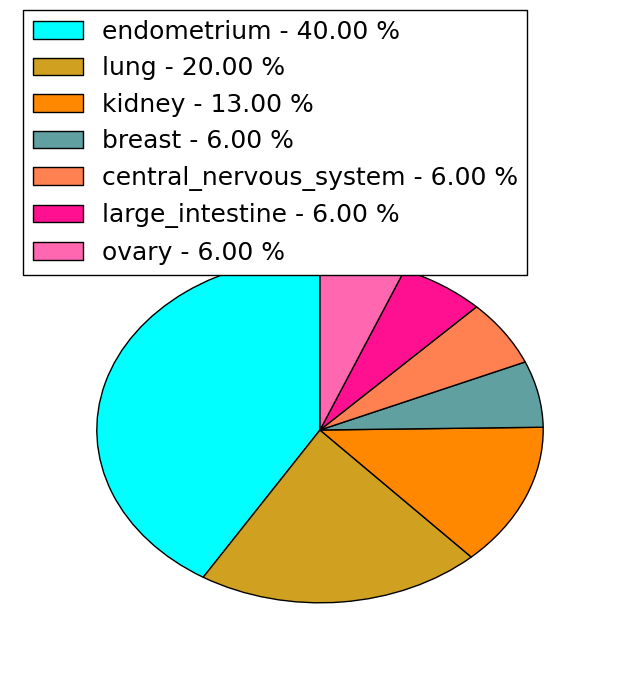
| Mutations for EIF3B |
| * Under tables are showing count per each tissue to give us broad intuition about tissue specific mutation patterns.You can go to the detailed page for each mutation database's web site. |
| - Statistics for Tissue and Mutation type | Top |
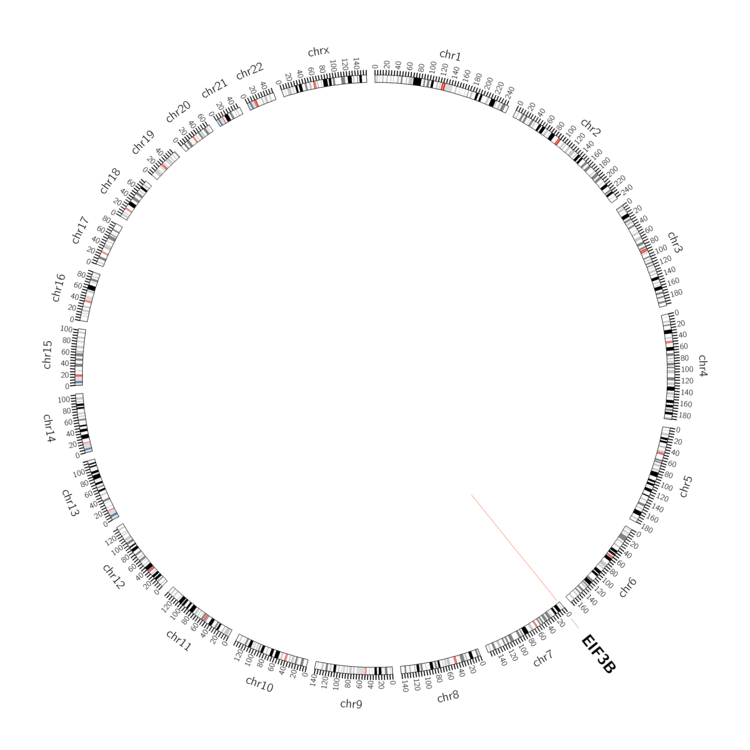 |
| - For Inter-chromosomal Variations |
| There's no inter-chromosomal structural variation. |
| - For Intra-chromosomal Variations |
| * Intra-chromosomal variantions includes 'intrachromosomal amplicon to amplicon', 'intrachromosomal amplicon to non-amplified dna', 'intrachromosomal deletion', 'intrachromosomal fold-back inversion', 'intrachromosomal inversion', 'intrachromosomal tandem duplication', 'Intrachromosomal unknown type', 'intrachromosomal with inverted orientation', 'intrachromosomal with non-inverted orientation'. |
 |
| Sample | Symbol_a | Chr_a | Start_a | End_a | Symbol_b | Chr_b | Start_b | End_b |
| pancreas | EIF3B | chr7 | 2417053 | 2417253 | EIF3B | chr7 | 2417723 | 2417923 |
| cf) Tissue number; Tissue name (1;Breast, 2;Central_nervous_system, 3;Haematopoietic_and_lymphoid_tissue, 4;Large_intestine, 5;Liver, 6;Lung, 7;Ovary, 8;Pancreas, 9;Prostate, 10;Skin, 11;Soft_tissue, 12;Upper_aerodigestive_tract) |
| * From mRNA Sanger sequences, Chitars2.0 arranged chimeric transcripts. This table shows EIF3B related fusion information. |
| ID | Head Gene | Tail Gene | Accession | Gene_a | qStart_a | qEnd_a | Chromosome_a | tStart_a | tEnd_a | Gene_a | qStart_a | qEnd_a | Chromosome_a | tStart_a | tEnd_a |
| BI010845 | EIF3B | 21 | 152 | 7 | 2418772 | 2419055 | POLA2 | 146 | 303 | 11 | 65047202 | 65047359 | |
| BF812060 | EIF3B | 1 | 289 | 7 | 2408040 | 2408331 | FAM107B | 275 | 448 | 10 | 14633560 | 14633732 | |
| AW368037 | EIF3B | 7 | 164 | 7 | 2418767 | 2419075 | EIF3B | 163 | 522 | 7 | 2409262 | 2415052 | |
| AI909918 | PLEKHF1 | 1 | 52 | 19 | 30166214 | 30166265 | EIF3B | 44 | 187 | 7 | 2419072 | 2419982 | |
| BQ376118 | EIF3B | 1 | 333 | 7 | 2411532 | 2411865 | COL6A6 | 323 | 515 | 3 | 130311389 | 130312095 | |
| BF813428 | ERGIC1 | 1 | 87 | 5 | 172336727 | 172341765 | EIF3B | 84 | 139 | 7 | 2419937 | 2419992 | |
| AW855179 | EIF3B | 32 | 348 | 7 | 2405457 | 2405778 | HSPG2 | 336 | 416 | 1 | 22178575 | 22178654 | |
| BG253176 | EIF3B | 23 | 76 | 7 | 2418349 | 2418402 | EIF3B | 64 | 774 | 7 | 2418354 | 2420380 | |
| CN267276 | EIF3B | 23 | 83 | 7 | 2402295 | 2402355 | EIF3B | 82 | 681 | 7 | 2402339 | 2409314 | |
| BF813436 | EIF3B | 1 | 253 | 7 | 2416672 | 2419055 | EIF3B | 252 | 303 | 7 | 2419064 | 2419115 | |
| Top |
| Mutation type/ Tissue ID | brca | cns | cerv | endome | haematopo | kidn | Lintest | liver | lung | ns | ovary | pancre | prost | skin | stoma | thyro | urina | |||
| Total # sample | 1 | 1 | ||||||||||||||||||
| GAIN (# sample) | 1 | 1 | ||||||||||||||||||
| LOSS (# sample) |
| cf) Tissue ID; Tissue type (1; Breast, 2; Central_nervous_system, 3; Cervix, 4; Endometrium, 5; Haematopoietic_and_lymphoid_tissue, 6; Kidney, 7; Large_intestine, 8; Liver, 9; Lung, 10; NS, 11; Ovary, 12; Pancreas, 13; Prostate, 14; Skin, 15; Stomach, 16; Thyroid, 17; Urinary_tract) |
| Top |
|
 |
| Top |
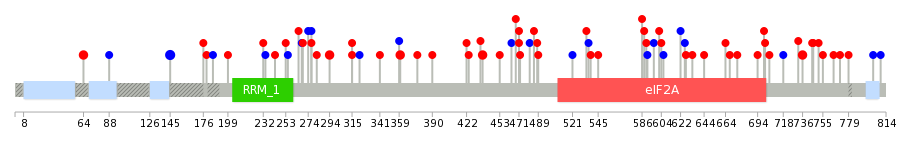
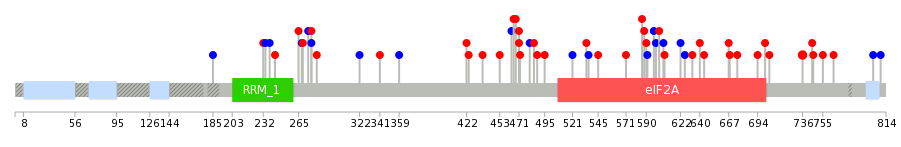
| Stat. for Non-Synonymous SNVs (# total SNVs=44) | (# total SNVs=15) |
 |  |
(# total SNVs=0) | (# total SNVs=0) |
| Top |
| * When you move the cursor on each content, you can see more deailed mutation information on the Tooltip. Those are primary_site,primary_histology,mutation(aa),pubmedID. |
| GRCh37 position | Mutation(aa) | Unique sampleID count |
| chr7:2394991-2394991 | p.N145N | 3 |
| chr7:2404086-2404086 | p.W360L | 2 |
| chr7:2409115-2409115 | p.S471Y | 2 |
| chr7:2402723-2402723 | p.D277D | 2 |
| chr7:2418375-2418375 | p.R736C | 2 |
| chr7:2394746-2394746 | p.S64P | 2 |
| chr7:2406181-2406181 | p.F437L | 2 |
| chr7:2418830-2418830 | p.Q765R | 1 |
| chr7:2402391-2402391 | p.D268D | 1 |
| chr7:2409317-2409317 | p.Q538H | 1 |
| Top |
|
 |
| Point Mutation/ Tissue ID | 1 | 2 | 3 | 4 | 5 | 6 | 7 | 8 | 9 | 10 | 11 | 12 | 13 | 14 | 15 | 16 | 17 | 18 | 19 | 20 |
| # sample | 2 | 1 | 8 | 1 | 3 | 2 | 6 | 4 | 2 | 9 | 7 | 10 | ||||||||
| # mutation | 2 | 1 | 9 | 1 | 3 | 2 | 6 | 4 | 2 | 10 | 8 | 13 | ||||||||
| nonsynonymous SNV | 1 | 8 | 1 | 3 | 4 | 3 | 1 | 7 | 6 | 7 | ||||||||||
| synonymous SNV | 1 | 1 | 1 | 2 | 2 | 1 | 1 | 3 | 2 | 6 |
| cf) Tissue ID; Tissue type (1; BLCA[Bladder Urothelial Carcinoma], 2; BRCA[Breast invasive carcinoma], 3; CESC[Cervical squamous cell carcinoma and endocervical adenocarcinoma], 4; COAD[Colon adenocarcinoma], 5; GBM[Glioblastoma multiforme], 6; Glioma Low Grade, 7; HNSC[Head and Neck squamous cell carcinoma], 8; KICH[Kidney Chromophobe], 9; KIRC[Kidney renal clear cell carcinoma], 10; KIRP[Kidney renal papillary cell carcinoma], 11; LAML[Acute Myeloid Leukemia], 12; LUAD[Lung adenocarcinoma], 13; LUSC[Lung squamous cell carcinoma], 14; OV[Ovarian serous cystadenocarcinoma ], 15; PAAD[Pancreatic adenocarcinoma], 16; PRAD[Prostate adenocarcinoma], 17; SKCM[Skin Cutaneous Melanoma], 18:STAD[Stomach adenocarcinoma], 19:THCA[Thyroid carcinoma], 20:UCEC[Uterine Corpus Endometrial Carcinoma]) |
| Top |
| * We represented just top 10 SNVs. When you move the cursor on each content, you can see more deailed mutation information on the Tooltip. Those are primary_site, primary_histology, mutation(aa), pubmedID. |
| Genomic Position | Mutation(aa) | Unique sampleID count |
| chr7:2402723 | p.R736C,EIF3B | 2 |
| chr7:2418375 | p.S471F,EIF3B | 2 |
| chr7:2409115 | p.D277E,EIF3B | 2 |
| chr7:2404084 | p.N597N,EIF3B | 1 |
| chr7:2415065 | p.A243D,EIF3B | 1 |
| chr7:2418830 | p.K468Q,EIF3B | 1 |
| chr7:2409156 | p.K599K,EIF3B | 1 |
| chr7:2402301 | p.E745G,EIF3B | 1 |
| chr7:2412393 | p.L265I,EIF3B | 1 |
| chr7:2406060 | p.L602V,EIF3B | 1 |
| * Copy number data were extracted from TCGA using R package TCGA-Assembler. The URLs of all public data files on TCGA DCC data server were gathered on Jan-05-2015. Function ProcessCNAData in TCGA-Assembler package was used to obtain gene-level copy number value which is calculated as the average copy number of the genomic region of a gene. |
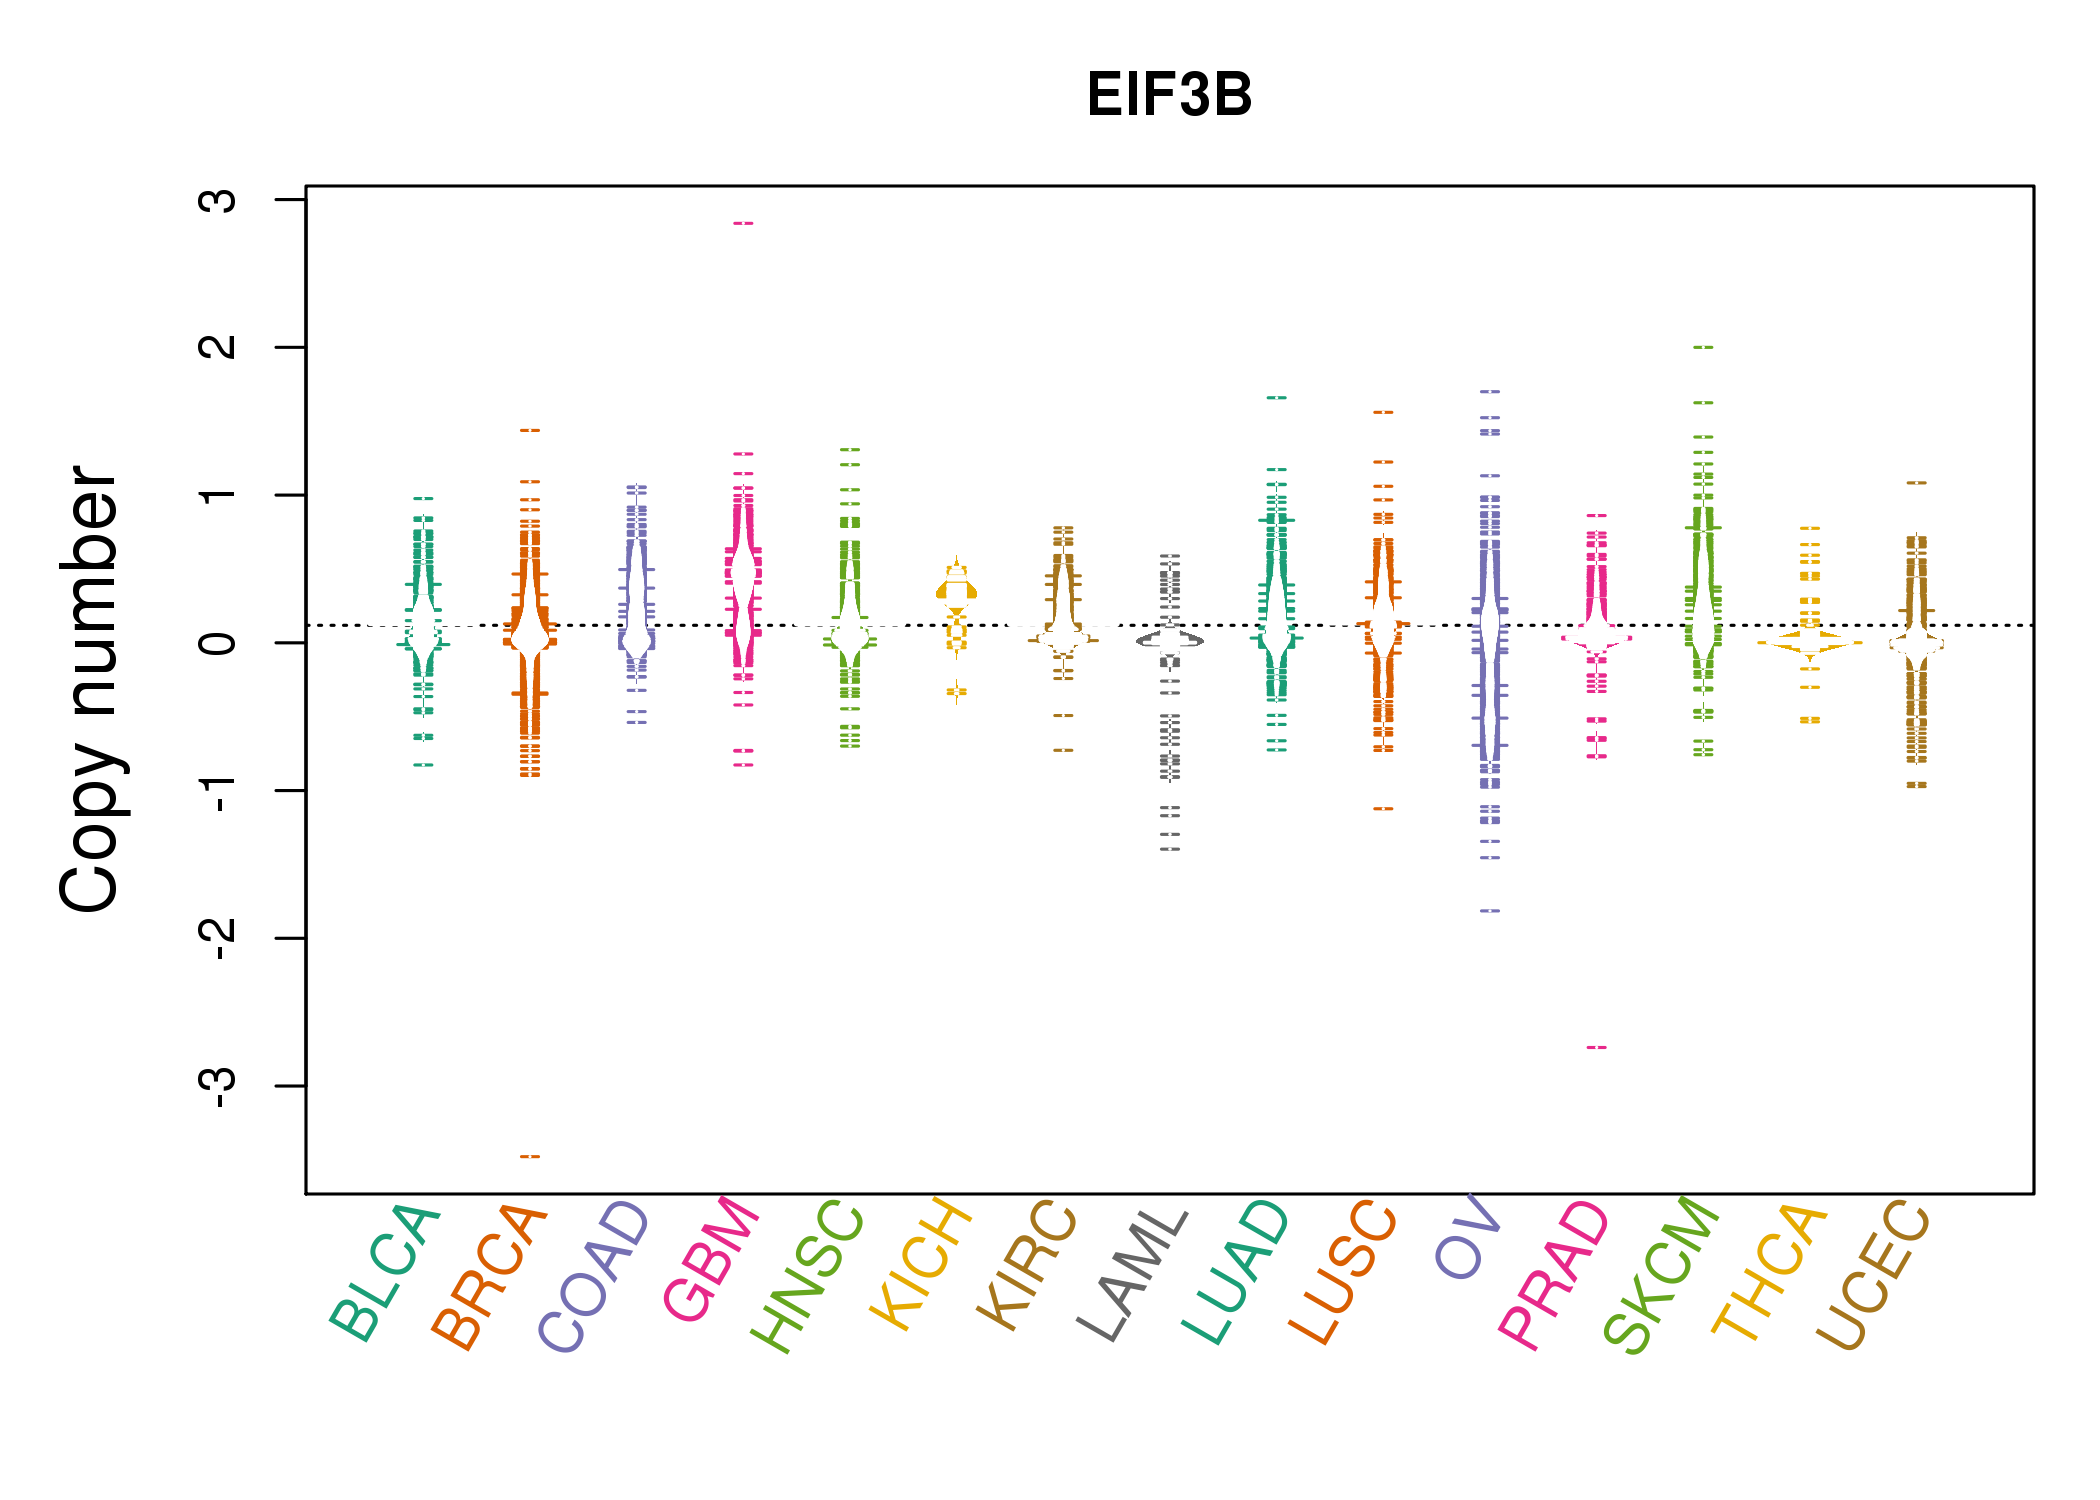 |
| cf) Tissue ID[Tissue type]: BLCA[Bladder Urothelial Carcinoma], BRCA[Breast invasive carcinoma], CESC[Cervical squamous cell carcinoma and endocervical adenocarcinoma], COAD[Colon adenocarcinoma], GBM[Glioblastoma multiforme], Glioma Low Grade, HNSC[Head and Neck squamous cell carcinoma], KICH[Kidney Chromophobe], KIRC[Kidney renal clear cell carcinoma], KIRP[Kidney renal papillary cell carcinoma], LAML[Acute Myeloid Leukemia], LUAD[Lung adenocarcinoma], LUSC[Lung squamous cell carcinoma], OV[Ovarian serous cystadenocarcinoma ], PAAD[Pancreatic adenocarcinoma], PRAD[Prostate adenocarcinoma], SKCM[Skin Cutaneous Melanoma], STAD[Stomach adenocarcinoma], THCA[Thyroid carcinoma], UCEC[Uterine Corpus Endometrial Carcinoma] |
| Top |
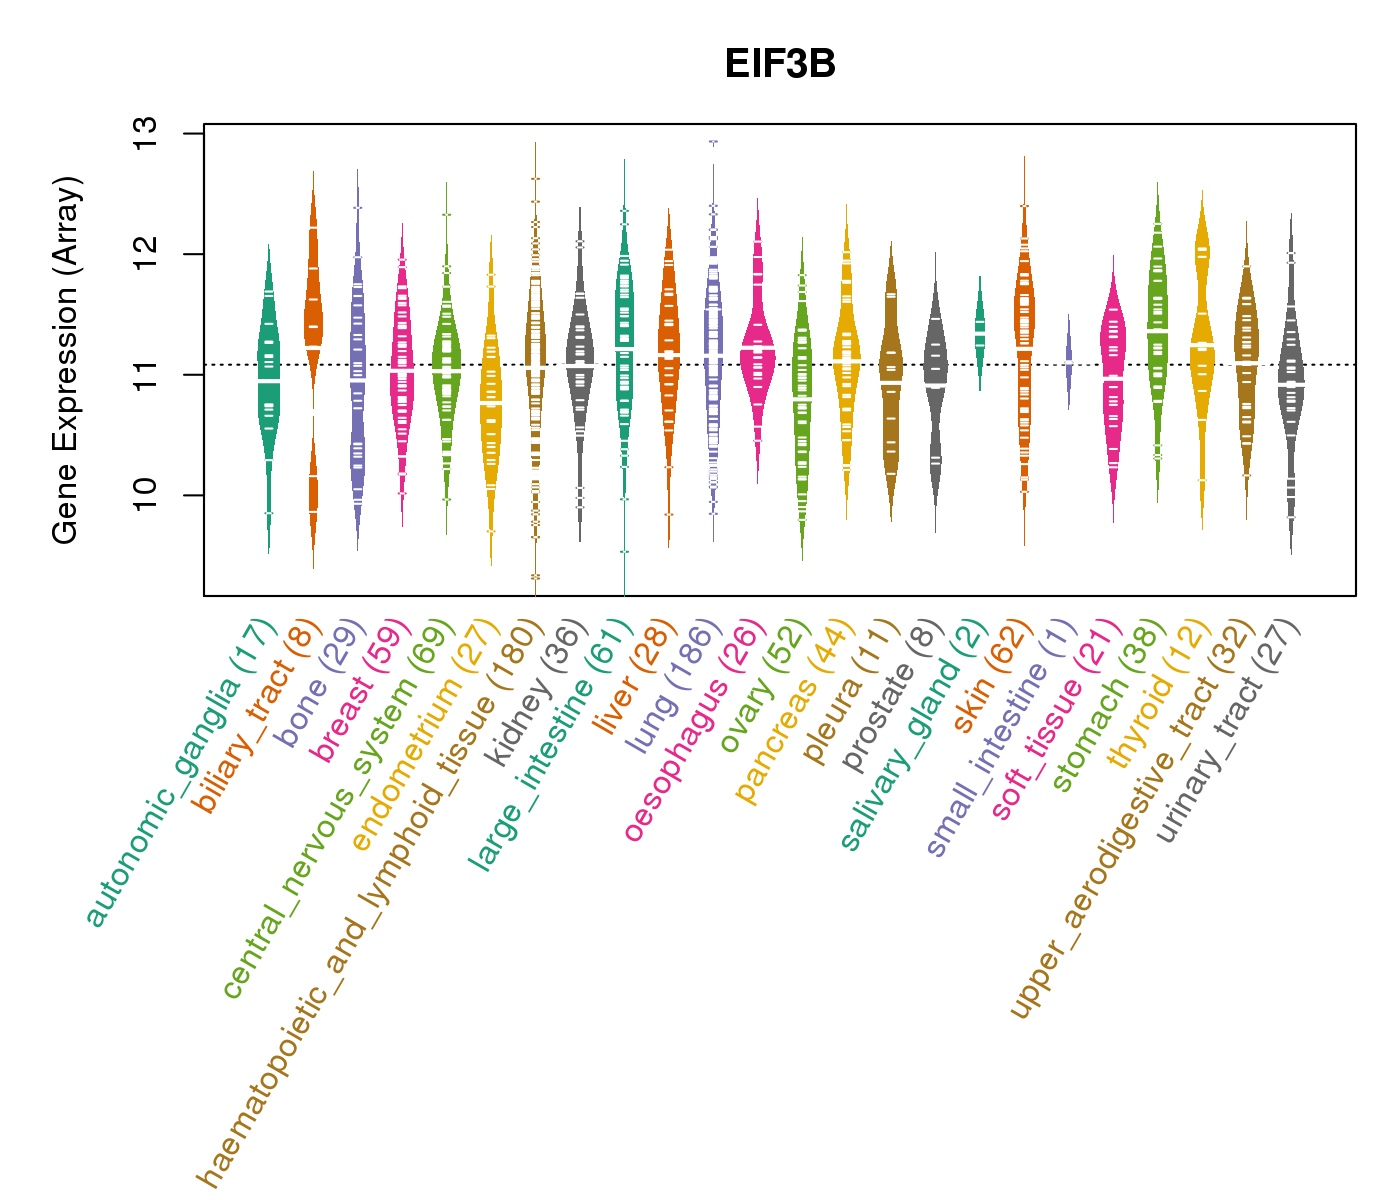
| Gene Expression for EIF3B |
| * CCLE gene expression data were extracted from CCLE_Expression_Entrez_2012-10-18.res: Gene-centric RMA-normalized mRNA expression data. |
 |
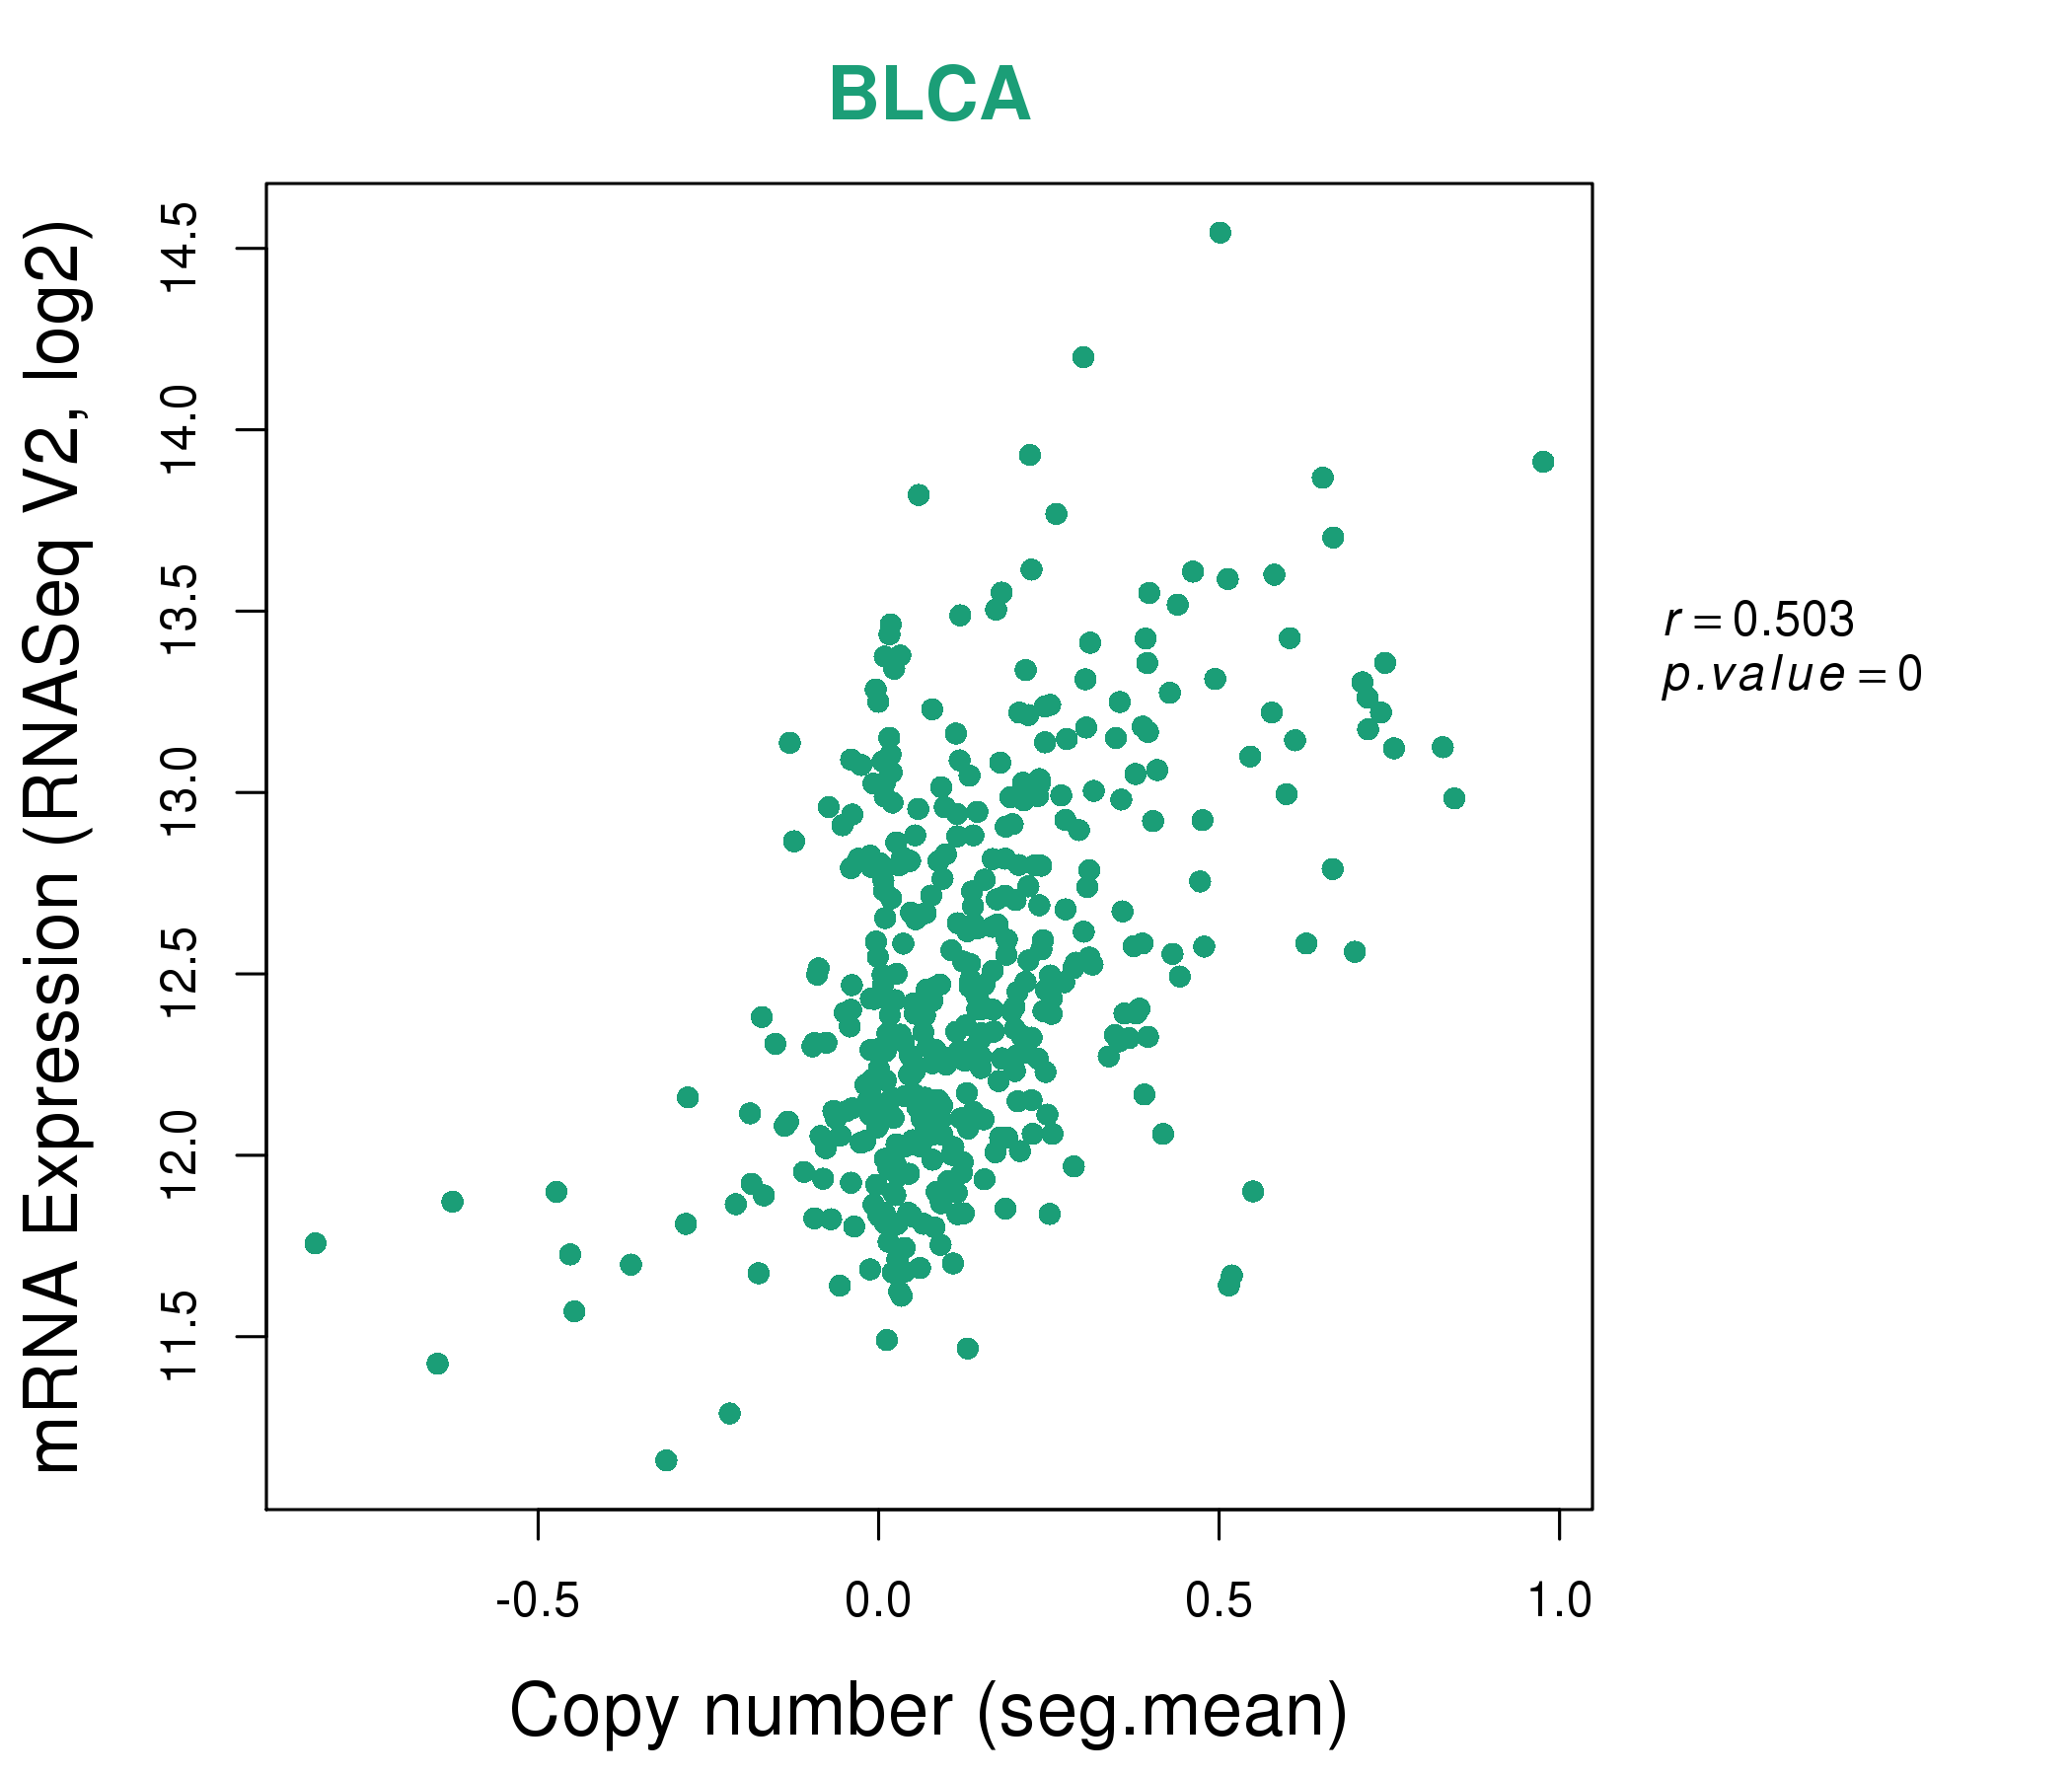
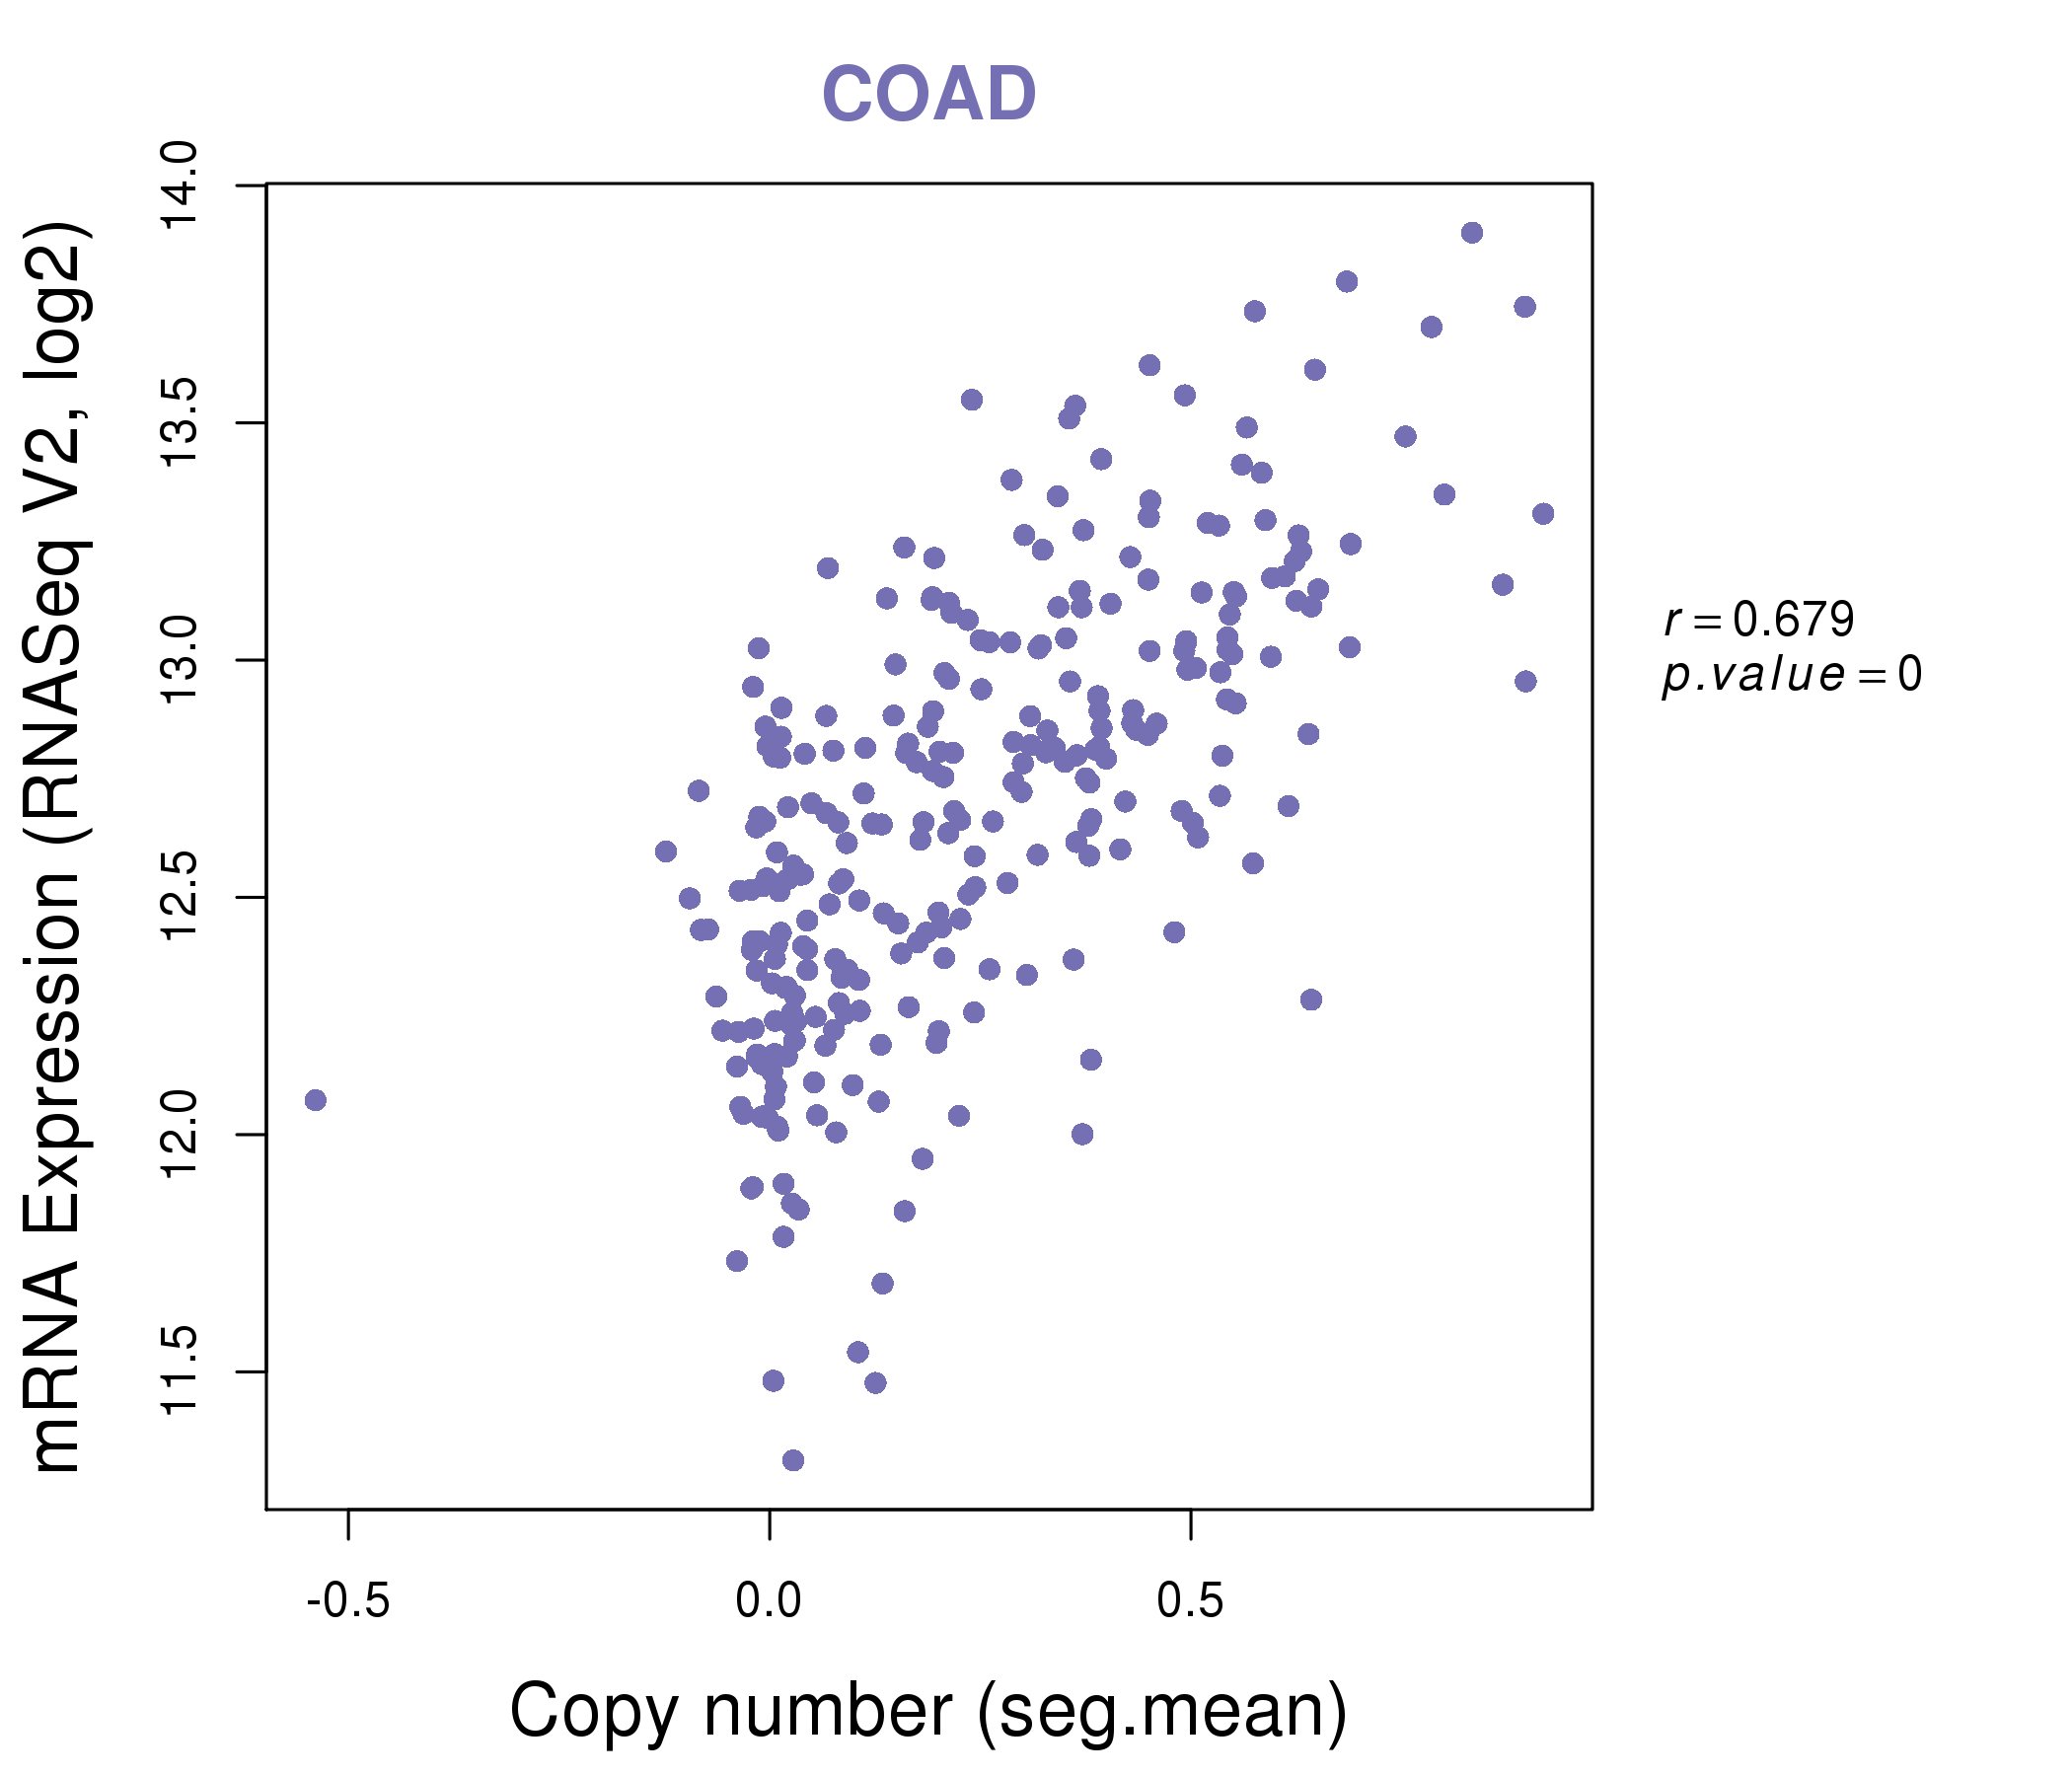
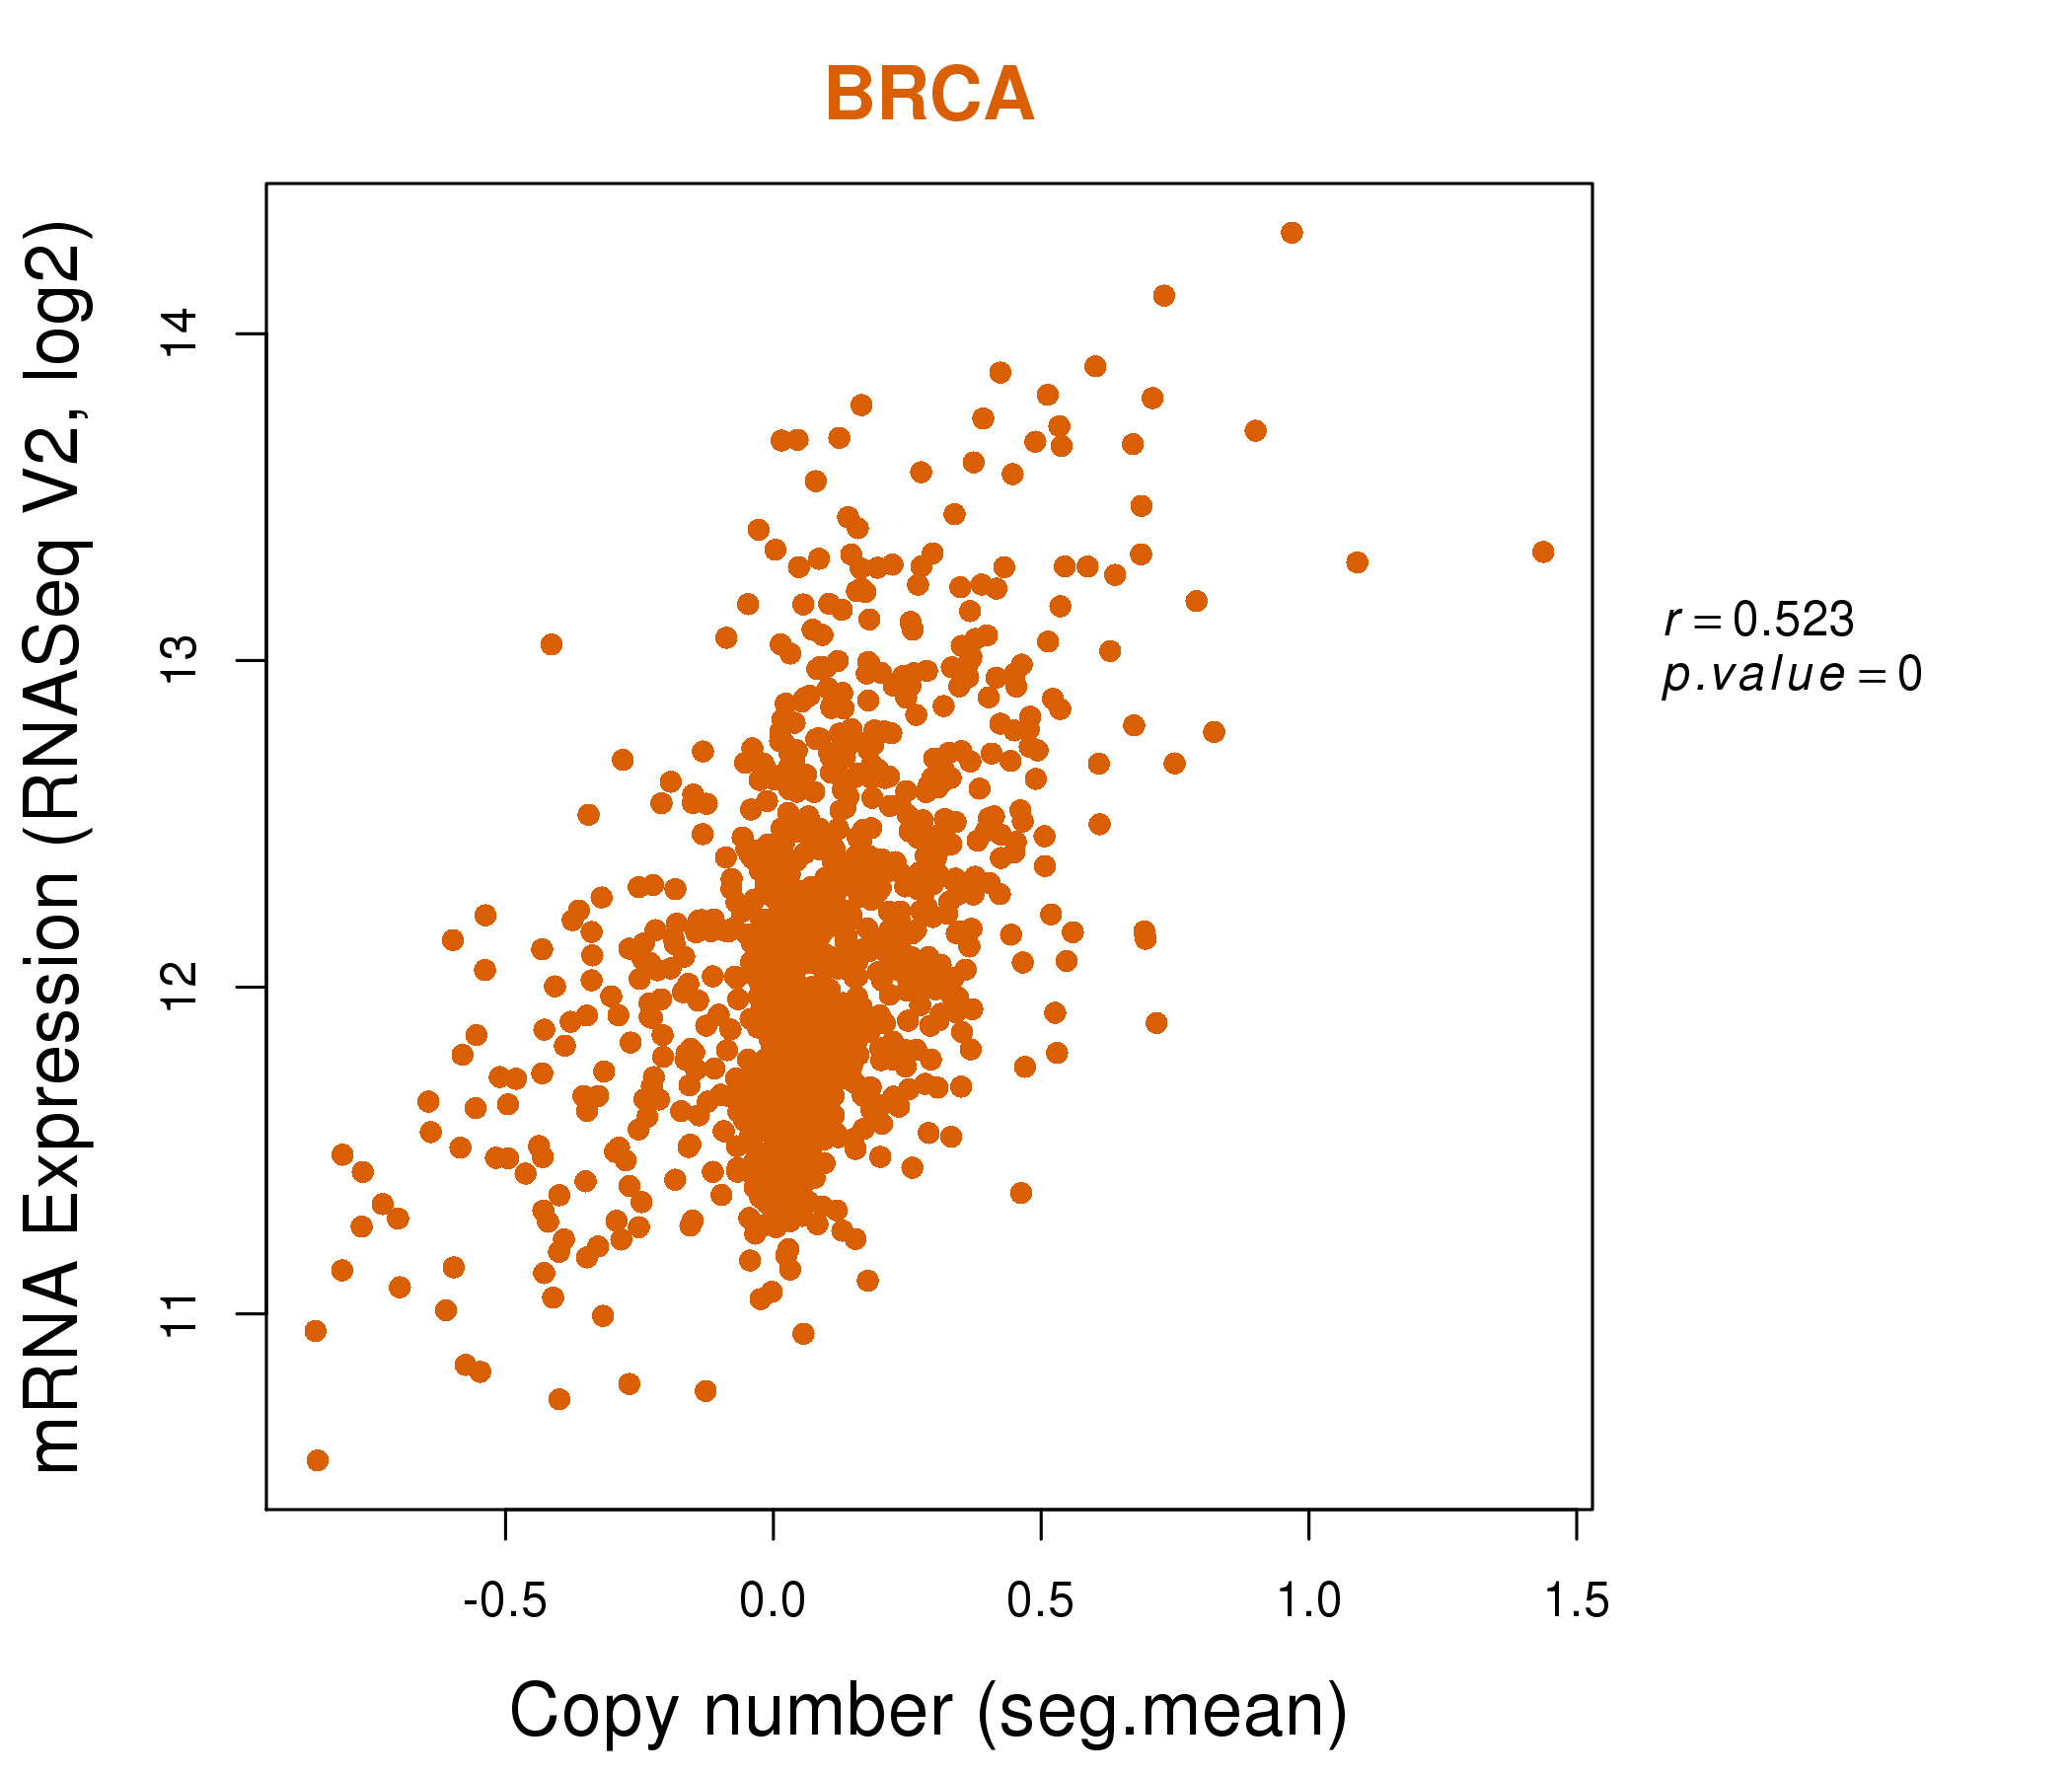
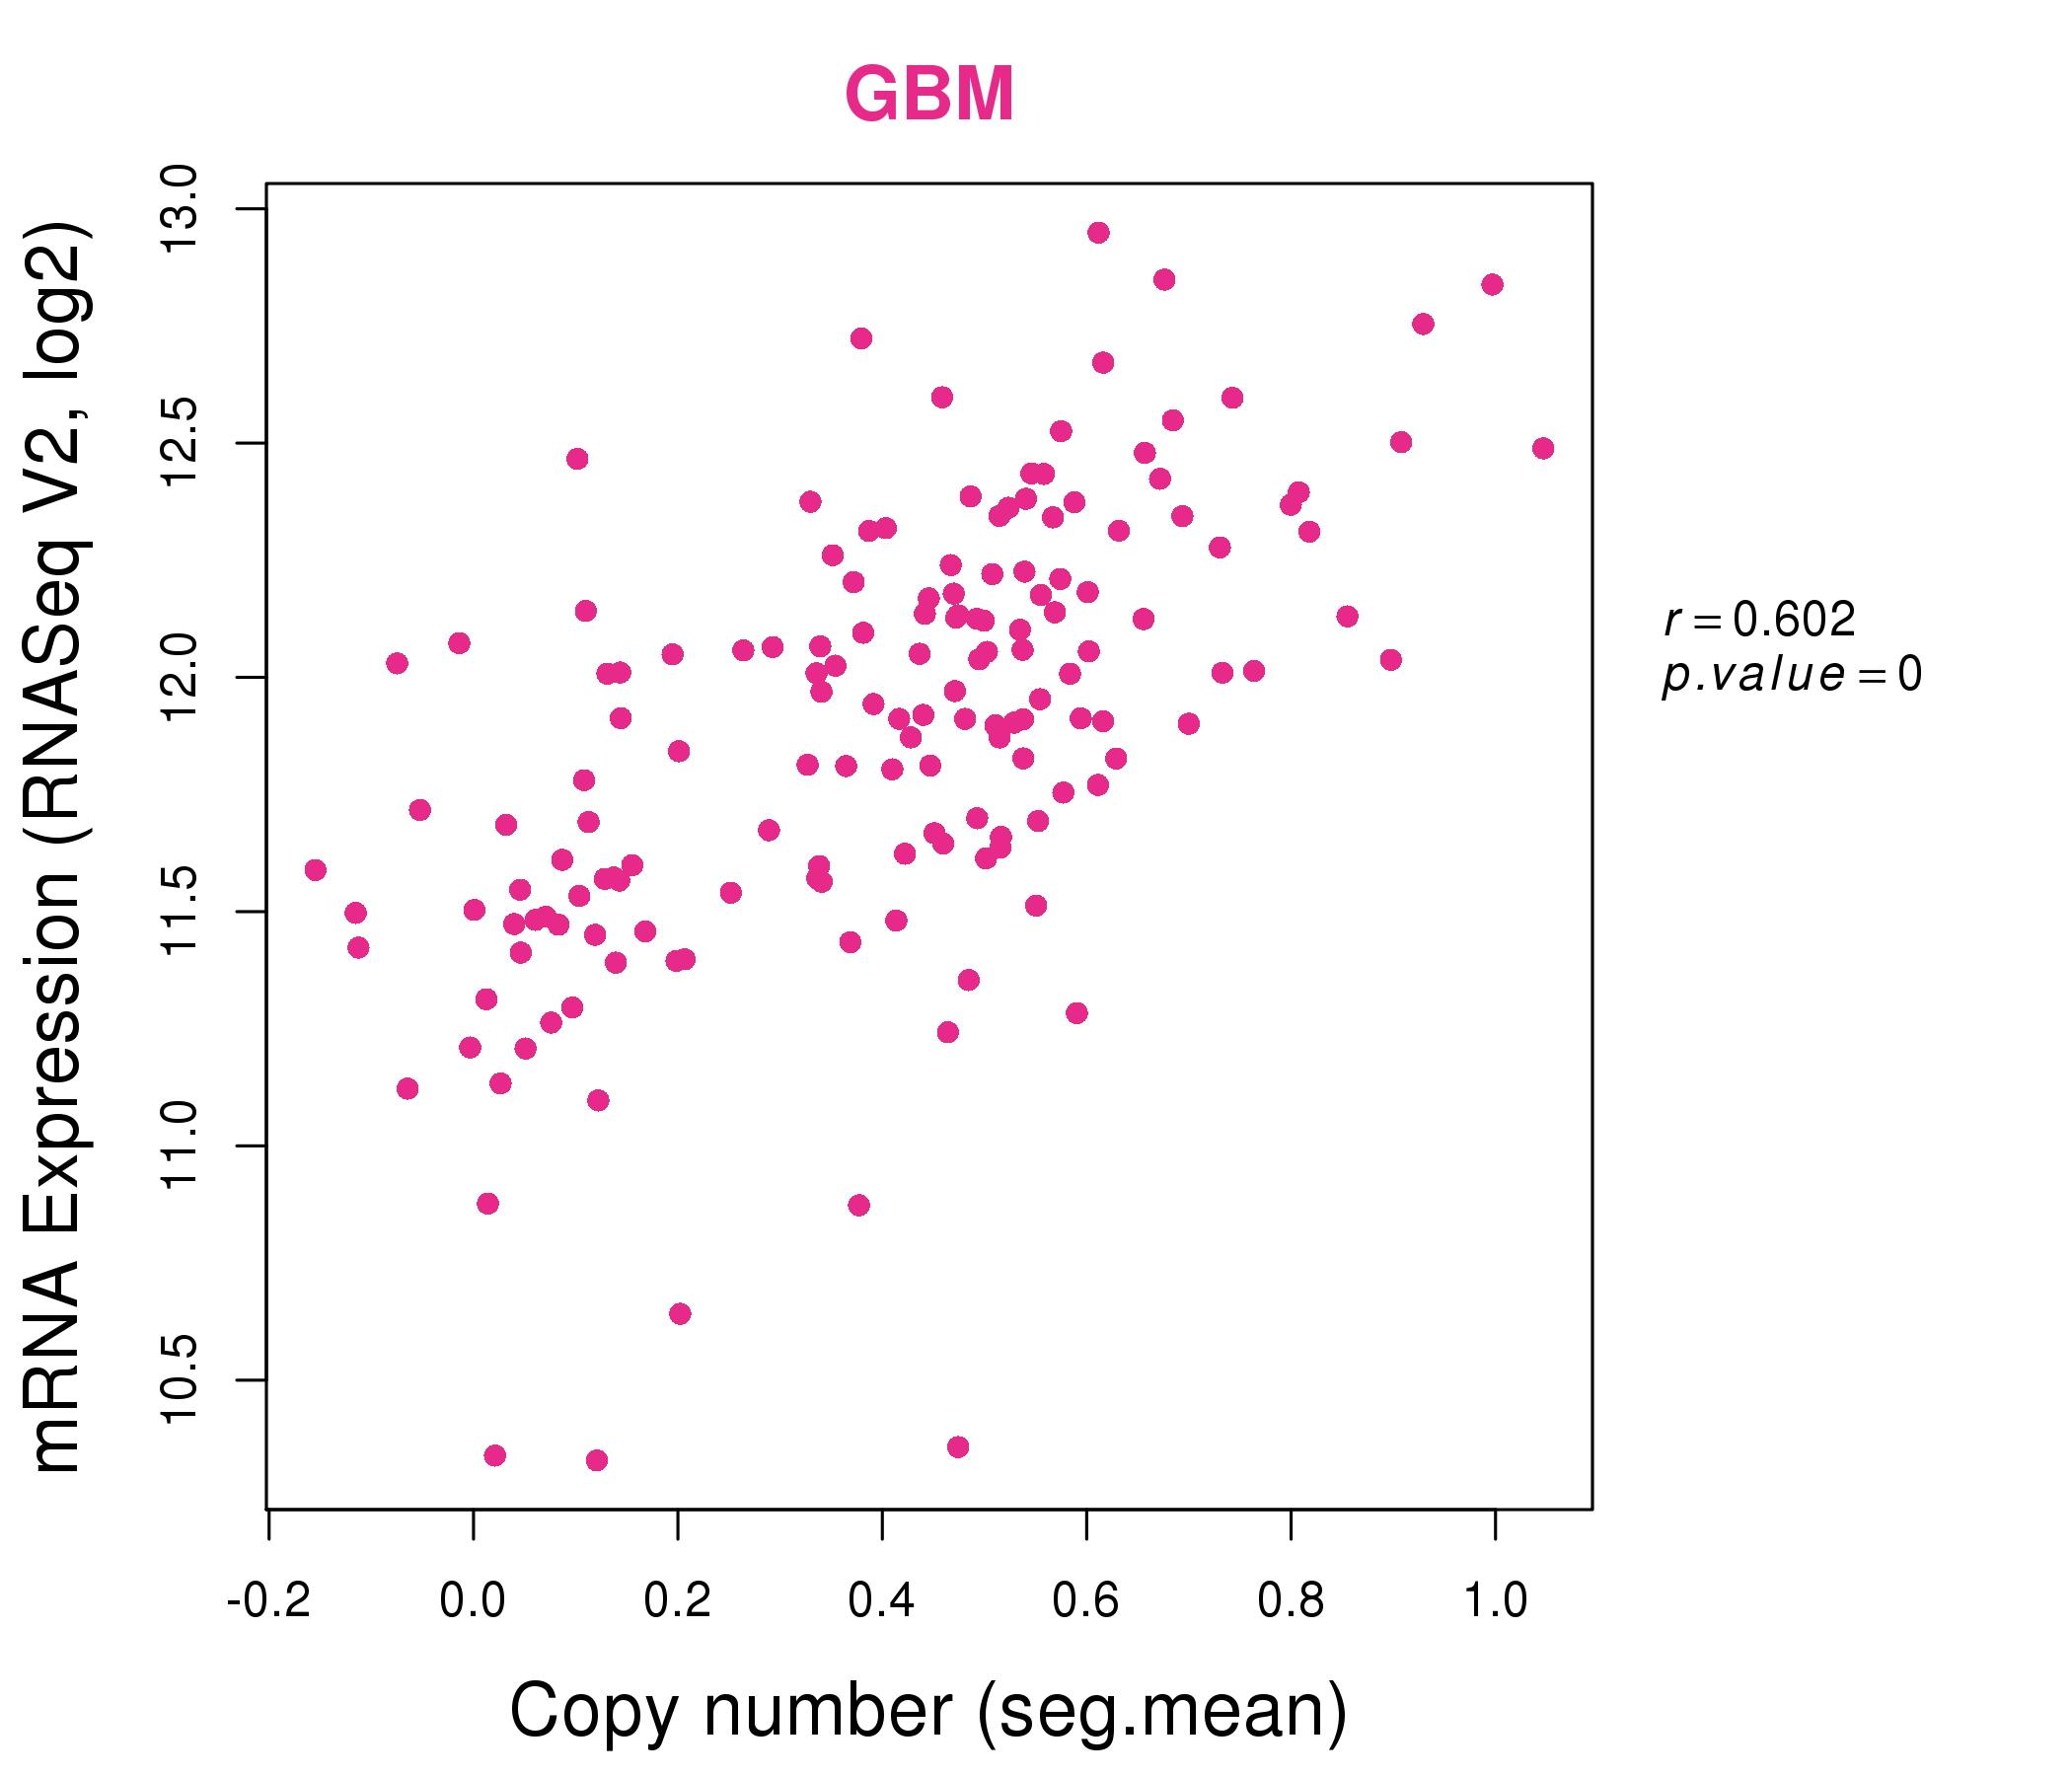
| * Normalized gene expression data of RNASeqV2 was extracted from TCGA using R package TCGA-Assembler. The URLs of all public data files on TCGA DCC data server were gathered at Jan-05-2015. Only eight cancer types have enough normal control samples for differential expression analysis. (t test, adjusted p<0.05 (using Benjamini-Hochberg FDR)) |
 |
| Top |
| * This plots show the correlation between CNV and gene expression. |
: Open all plots for all cancer types
 |
|
 |
|
| Top |
| Gene-Gene Network Information |
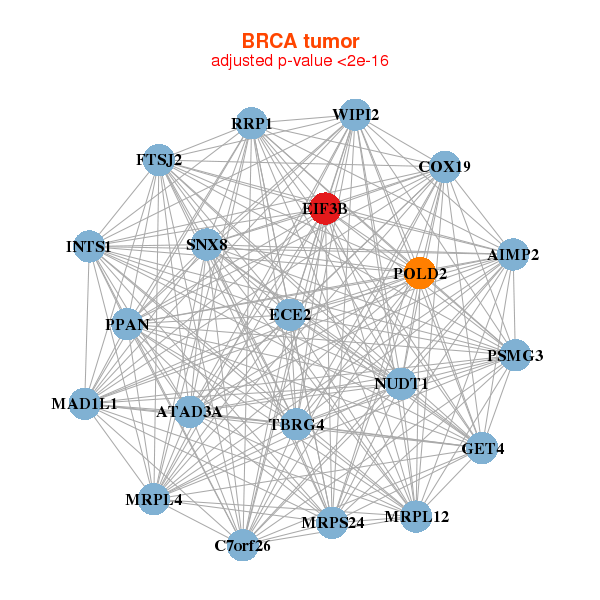
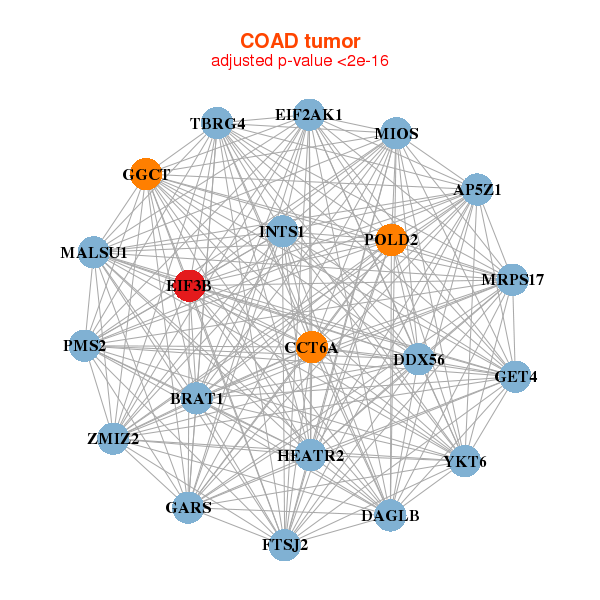
| * Co-Expression network figures were drawn using R package igraph. Only the top 20 genes with the highest correlations were shown. Red circle: input gene, orange circle: cell metabolism gene, sky circle: other gene |
: Open all plots for all cancer types
 |
|
| AIMP2,ATAD3A,C7orf26,COX19,ECE2,EIF3B,FTSJ2, GET4,INTS1,MAD1L1,MRPL12,MRPL4,MRPS24,NUDT1, POLD2,PPAN,PSMG3,RRP1,SNX8,TBRG4,WIPI2 | ALKBH2,APRT,VPS51___IFT46,CCT3,CECR5,DDX54,EEF2, EIF3B,EXOSC5,MRTO4,NLE1,NOB1,PES1,PHB2, QARS,RPL19,RPL3,RPL7A,RUVBL2,SHMT2,SMARCD2 |
 |
|
| BRAT1,MALSU1,CCT6A,DAGLB,DDX56,EIF2AK1,EIF3B, FTSJ2,GARS,GET4,GGCT,HEATR2,INTS1,AP5Z1, MIOS,MRPS17,PMS2,POLD2,TBRG4,YKT6,ZMIZ2 | DIS3L2,DOHH,EIF3B,EIF4G1,ELAVL1,HIRA,HNRNPA0, HNRNPM,KHSRP,LAS1L,MYBBP1A,NAT10,NOC2L,NUP188, RANGAP1,RRP12,SF3B3,SLC7A1,TBL3,TMEM201,VARS |
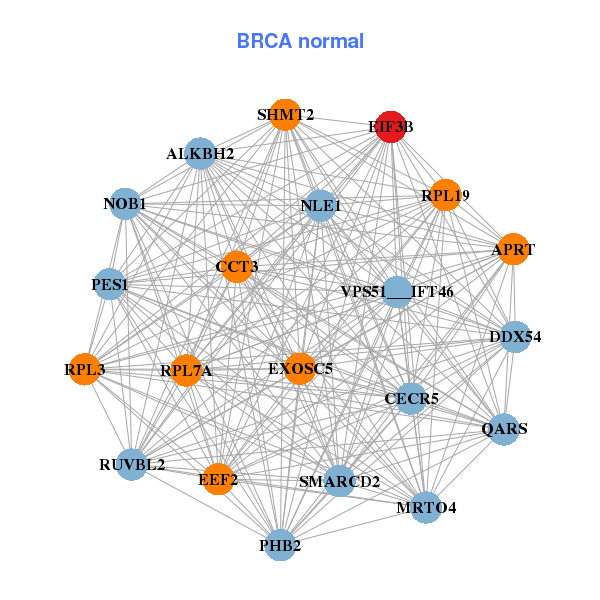
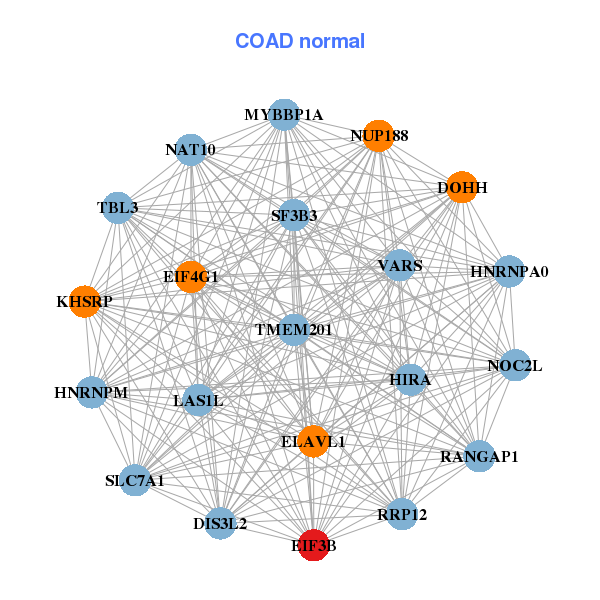
| * Co-Expression network figures were drawn using R package igraph. Only the top 20 genes with the highest correlations were shown. Red circle: input gene, orange circle: cell metabolism gene, sky circle: other gene |
: Open all plots for all cancer types
| Top |
: Open all interacting genes' information including KEGG pathway for all interacting genes from DAVID
| Top |
| Pharmacological Information for EIF3B |
| There's no related Drug. |
| Top |
| Cross referenced IDs for EIF3B |
| * We obtained these cross-references from Uniprot database. It covers 150 different DBs, 18 categories. http://www.uniprot.org/help/cross_references_section |
: Open all cross reference information
|
Copyright © 2016-Present - The Univsersity of Texas Health Science Center at Houston @ |