|
|||||||||||||||||||||||||||||||||||||||||||||||||||||||||||||||||||||||||||||||||||||||||||||||||||||||||||||||||||||||||||||||||||||||||||||||||||||||||||||||||||||||||||||||||||||||||||||||||||||||||||||||||||||||||||||||||||||||||||||||||||||||||||||||||||||||||||||||||||||||||||||||||||||||||||||||||||||||||||||||||||||||||||||||||||||||||||||||||||||||||||||||||||||||||||||||||||||||||||||||||||||||||||||||||||||||||||||||||||||||||||||||||||||||||||||||||
| |
| Phenotypic Information (metabolism pathway, cancer, disease, phenome) |
| |
| |
| Gene-Gene Network Information: Co-Expression Network, Interacting Genes & KEGG |
| |
|


| Gene Summary for NAT2 |
| Basic gene info. | Gene symbol | NAT2 |
| Gene name | N-acetyltransferase 2 (arylamine N-acetyltransferase) | |
| Synonyms | AAC2|NAT-2|PNAT | |
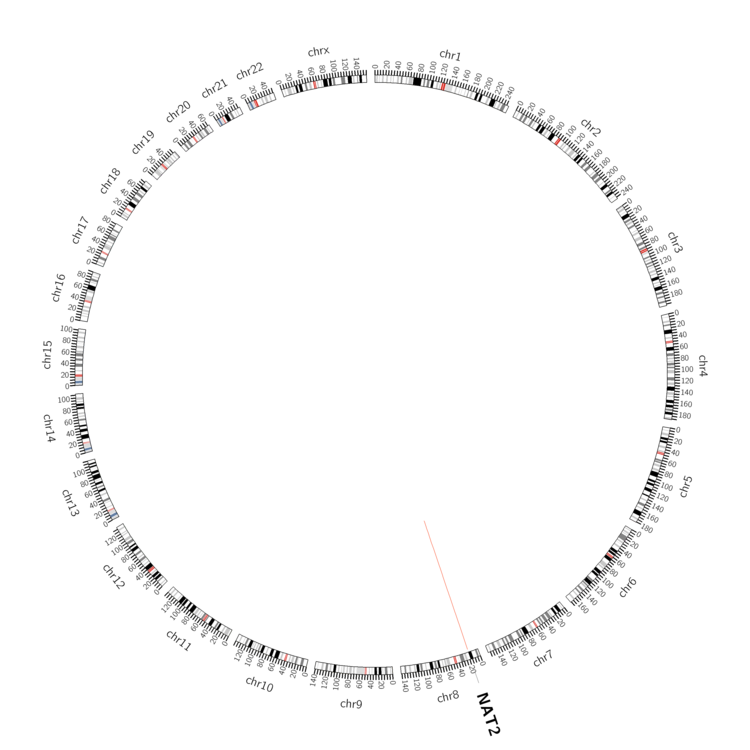
| Cytomap | UCSC genome browser: 8p22 | |
| Genomic location | chr8 :18248754-18258723 | |
| Type of gene | protein-coding | |
| RefGenes | NM_000015.2, | |
| Ensembl id | ENSG00000156006 | |
| Description | N-acetyltransferase type 2arylamide acetylase 2arylamine N-acetyltransferase 2 | |
| Modification date | 20141211 | |
| dbXrefs | MIM : 612182 | |
| HGNC : HGNC | ||
| Ensembl : ENSG00000156006 | ||
| HPRD : 02000 | ||
| Vega : OTTHUMG00000130826 | ||
| Protein | UniProt: P11245 go to UniProt's Cross Reference DB Table | |
| Expression | CleanEX: HS_NAT2 | |
| BioGPS: 10 | ||
| Gene Expression Atlas: ENSG00000156006 | ||
| The Human Protein Atlas: ENSG00000156006 | ||
| Pathway | NCI Pathway Interaction Database: NAT2 | |
| KEGG: NAT2 | ||
| REACTOME: NAT2 | ||
| ConsensusPathDB | ||
| Pathway Commons: NAT2 | ||
| Metabolism | MetaCyc: NAT2 | |
| HUMANCyc: NAT2 | ||
| Regulation | Ensembl's Regulation: ENSG00000156006 | |
| miRBase: chr8 :18,248,754-18,258,723 | ||
| TargetScan: NM_000015 | ||
| cisRED: ENSG00000156006 | ||
| Context | iHOP: NAT2 | |
| cancer metabolism search in PubMed: NAT2 | ||
| UCL Cancer Institute: NAT2 | ||
| Assigned class in ccmGDB | A - This gene has a literature evidence and it belongs to cancer gene. | |
| References showing role of NAT2 in cancer cell metabolism | 1. Matejcic M, Vogelsang M, Wang Y, Parker M (2015) NAT1 and NAT2 genetic polymorphisms and environmental exposure as risk factors for oesophageal squamous cell carcinoma: a case-control study. BMC cancer 15: 150. go to article | |
| Top |
| Phenotypic Information for NAT2(metabolism pathway, cancer, disease, phenome) |
| Cancer | CGAP: NAT2 |
| Familial Cancer Database: NAT2 | |
| * This gene is included in those cancer gene databases. |
|
|
|
|
|
|
| |||||||||||||||||||||||||||||||||||||||||||||||||||||||||||||||||||||||||||||||||||||||||||||||||||||||||||||||||||||||||||||||||||||||||||||||||||||||||||||||||||||||||||||||||||||||||||||||||||||||||||||||||||||||||||||||||||||||||||||||||||||||||||||||||||||||||||||||||||||||||||||||||||||||||||||||||||||||||||||||||||||||||||||||||||||||||||||||||||||||||||||||||||||||||||||||||||||||||||||||||||||||||||||||||||||||||||||||||||||||||||||||||||||||||||
Oncogene 1 | Significant driver gene in | ||||||||||||||||||||||||||||||||||||||||||||||||||||||||||||||||||||||||||||||||||||||||||||||||||||||||||||||||||||||||||||||||||||||||||||||||||||||||||||||||||||||||||||||||||||||||||||||||||||||||||||||||||||||||||||||||||||||||||||||||||||||||||||||||||||||||||||||||||||||||||||||||||||||||||||||||||||||||||||||||||||||||||||||||||||||||||||||||||||||||||||||||||||||||||||||||||||||||||||||||||||||||||||||||||||||||||||||||||||||||||||||||||||||||||||||||
| cf) number; DB name 1 Oncogene; http://nar.oxfordjournals.org/content/35/suppl_1/D721.long, 2 Tumor Suppressor gene; https://bioinfo.uth.edu/TSGene/, 3 Cancer Gene Census; http://www.nature.com/nrc/journal/v4/n3/abs/nrc1299.html, 4 CancerGenes; http://nar.oxfordjournals.org/content/35/suppl_1/D721.long, 5 Network of Cancer Gene; http://ncg.kcl.ac.uk/index.php, 1Therapeutic Vulnerabilities in Cancer; http://cbio.mskcc.org/cancergenomics/statius/ |
| KEGG_DRUG_METABOLISM_OTHER_ENZYMES | |
| OMIM | 243400; phenotype. 243400; phenotype. 612182; gene. 612182; gene. |
| Orphanet | 240887; Isoniazid toxicity. 240887; Isoniazid toxicity. 240975; Susceptibility to adverse reaction due to isoniazide treatment. 240975; Susceptibility to adverse reaction due to isoniazide treatment. |
| Disease | KEGG Disease: NAT2 |
| MedGen: NAT2 (Human Medical Genetics with Condition) | |
| ClinVar: NAT2 | |
| Phenotype | MGI: NAT2 (International Mouse Phenotyping Consortium) |
| PhenomicDB: NAT2 | |
| Mutations for NAT2 |
| * Under tables are showing count per each tissue to give us broad intuition about tissue specific mutation patterns.You can go to the detailed page for each mutation database's web site. |
| - Statistics for Tissue and Mutation type | Top |
 |
| - For Inter-chromosomal Variations |
| There's no inter-chromosomal structural variation. |
| - For Intra-chromosomal Variations |
| * Intra-chromosomal variantions includes 'intrachromosomal amplicon to amplicon', 'intrachromosomal amplicon to non-amplified dna', 'intrachromosomal deletion', 'intrachromosomal fold-back inversion', 'intrachromosomal inversion', 'intrachromosomal tandem duplication', 'Intrachromosomal unknown type', 'intrachromosomal with inverted orientation', 'intrachromosomal with non-inverted orientation'. |
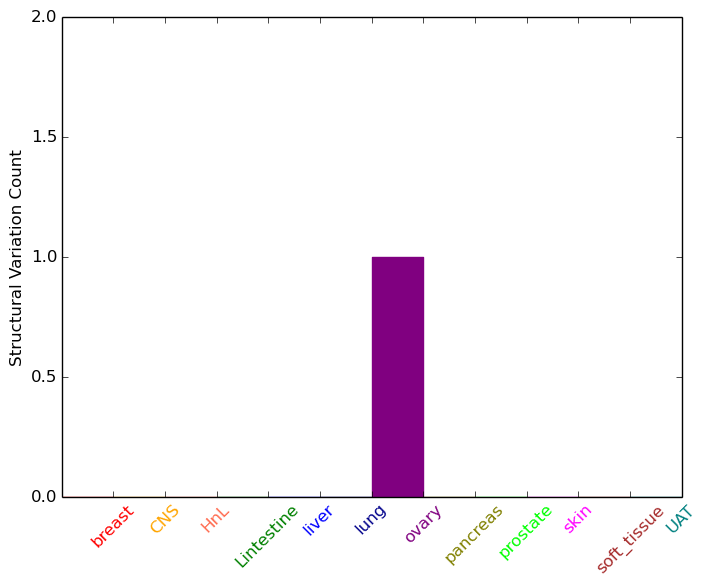 |
| Sample | Symbol_a | Chr_a | Start_a | End_a | Symbol_b | Chr_b | Start_b | End_b |
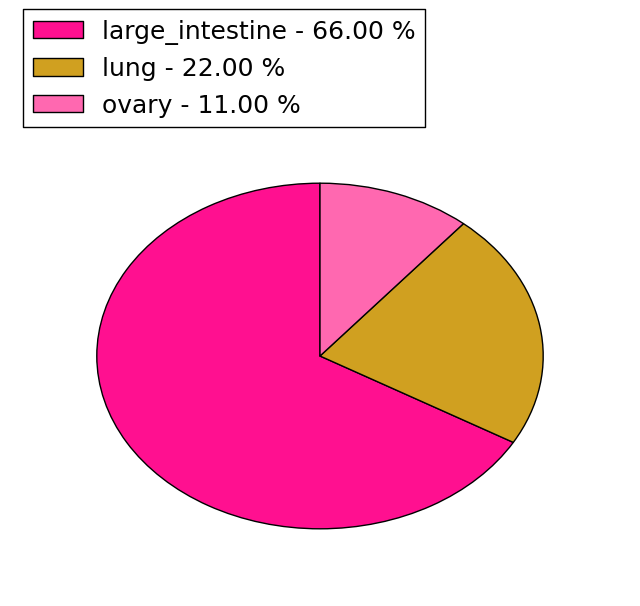
| ovary | NAT2 | chr8 | 18254952 | 18254972 | chr8 | 18244772 | 18244792 |
| cf) Tissue number; Tissue name (1;Breast, 2;Central_nervous_system, 3;Haematopoietic_and_lymphoid_tissue, 4;Large_intestine, 5;Liver, 6;Lung, 7;Ovary, 8;Pancreas, 9;Prostate, 10;Skin, 11;Soft_tissue, 12;Upper_aerodigestive_tract) |
| * From mRNA Sanger sequences, Chitars2.0 arranged chimeric transcripts. This table shows NAT2 related fusion information. |
| ID | Head Gene | Tail Gene | Accession | Gene_a | qStart_a | qEnd_a | Chromosome_a | tStart_a | tEnd_a | Gene_a | qStart_a | qEnd_a | Chromosome_a | tStart_a | tEnd_a |
| Top |
| Mutation type/ Tissue ID | brca | cns | cerv | endome | haematopo | kidn | Lintest | liver | lung | ns | ovary | pancre | prost | skin | stoma | thyro | urina | |||
| Total # sample | 1 | 1 | ||||||||||||||||||
| GAIN (# sample) | 1 | |||||||||||||||||||
| LOSS (# sample) | 1 |
| cf) Tissue ID; Tissue type (1; Breast, 2; Central_nervous_system, 3; Cervix, 4; Endometrium, 5; Haematopoietic_and_lymphoid_tissue, 6; Kidney, 7; Large_intestine, 8; Liver, 9; Lung, 10; NS, 11; Ovary, 12; Pancreas, 13; Prostate, 14; Skin, 15; Stomach, 16; Thyroid, 17; Urinary_tract) |
| Top |
|
 |
| Top |
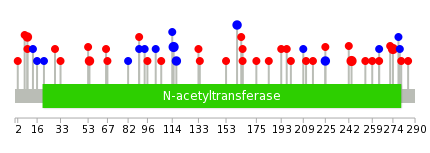
| Stat. for Non-Synonymous SNVs (# total SNVs=25) | (# total SNVs=9) |
 |  |
(# total SNVs=0) | (# total SNVs=0) |
| Top |
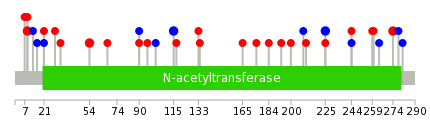
| * When you move the cursor on each content, you can see more deailed mutation information on the Tooltip. Those are primary_site,primary_histology,mutation(aa),pubmedID. |
| GRCh37 position | Mutation(aa) | Unique sampleID count |
| chr8:18258334-18258334 | p.S274F | 3 |
| chr8:18257858-18257858 | p.D115D | 3 |
| chr8:18257539-18257539 | p.R9I | 3 |
| chr8:18258273-18258273 | p.E254K | 2 |
| chr8:18257994-18257994 | p.L161L | 2 |
| chr8:18257673-18257673 | p.A54T | 2 |
| chr8:18258186-18258186 | p.L225L | 2 |
| chr8:18257864-18257864 | p.R117R | 2 |
| chr8:18257721-18257721 | p.Q70* | 2 |
| chr8:18258245-18258245 | p.F244L | 2 |
| Top |
|
 |
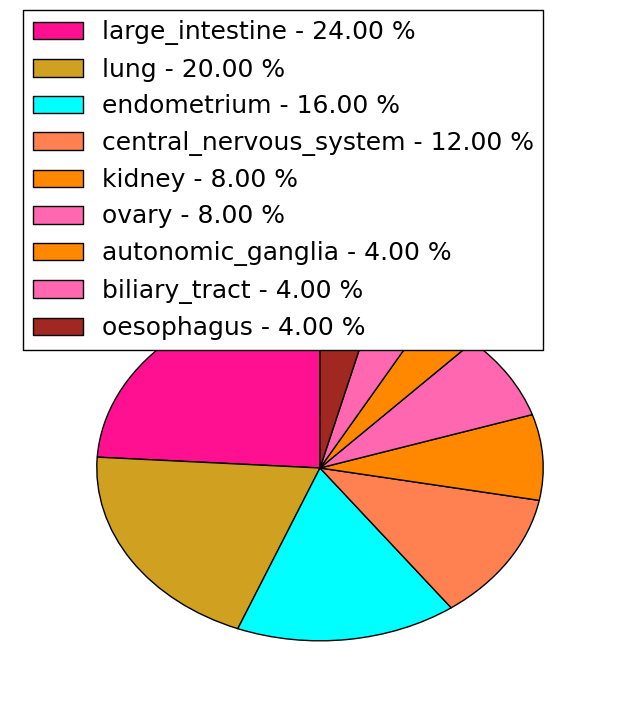
| Point Mutation/ Tissue ID | 1 | 2 | 3 | 4 | 5 | 6 | 7 | 8 | 9 | 10 | 11 | 12 | 13 | 14 | 15 | 16 | 17 | 18 | 19 | 20 |
| # sample | 7 | 1 | 2 | 4 | 1 | 2 | 10 | 6 | 3 | |||||||||||
| # mutation | 5 | 2 | 2 | 4 | 1 | 2 | 10 | 6 | 3 | |||||||||||
| nonsynonymous SNV | 2 | 2 | 2 | 2 | 1 | 1 | 5 | 4 | 3 | |||||||||||
| synonymous SNV | 3 | 2 | 1 | 5 | 2 |
| cf) Tissue ID; Tissue type (1; BLCA[Bladder Urothelial Carcinoma], 2; BRCA[Breast invasive carcinoma], 3; CESC[Cervical squamous cell carcinoma and endocervical adenocarcinoma], 4; COAD[Colon adenocarcinoma], 5; GBM[Glioblastoma multiforme], 6; Glioma Low Grade, 7; HNSC[Head and Neck squamous cell carcinoma], 8; KICH[Kidney Chromophobe], 9; KIRC[Kidney renal clear cell carcinoma], 10; KIRP[Kidney renal papillary cell carcinoma], 11; LAML[Acute Myeloid Leukemia], 12; LUAD[Lung adenocarcinoma], 13; LUSC[Lung squamous cell carcinoma], 14; OV[Ovarian serous cystadenocarcinoma ], 15; PAAD[Pancreatic adenocarcinoma], 16; PRAD[Prostate adenocarcinoma], 17; SKCM[Skin Cutaneous Melanoma], 18:STAD[Stomach adenocarcinoma], 19:THCA[Thyroid carcinoma], 20:UCEC[Uterine Corpus Endometrial Carcinoma]) |
| Top |
| * We represented just top 10 SNVs. When you move the cursor on each content, you can see more deailed mutation information on the Tooltip. Those are primary_site, primary_histology, mutation(aa), pubmedID. |
| Genomic Position | Mutation(aa) | Unique sampleID count |
| chr8:18257539 | p.R9K | 3 |
| chr8:18258186 | p.L21F | 2 |
| chr8:18257576 | p.A54T | 2 |
| chr8:18257673 | p.L225L | 2 |
| chr8:18258334 | p.D115D | 2 |
| chr8:18257858 | p.S274F | 2 |
| chr8:18257561 | p.T193M | 1 |
| chr8:18257862 | p.E29D | 1 |
| chr8:18258187 | p.E200K | 1 |
| chr8:18257912 | p.R33Q | 1 |
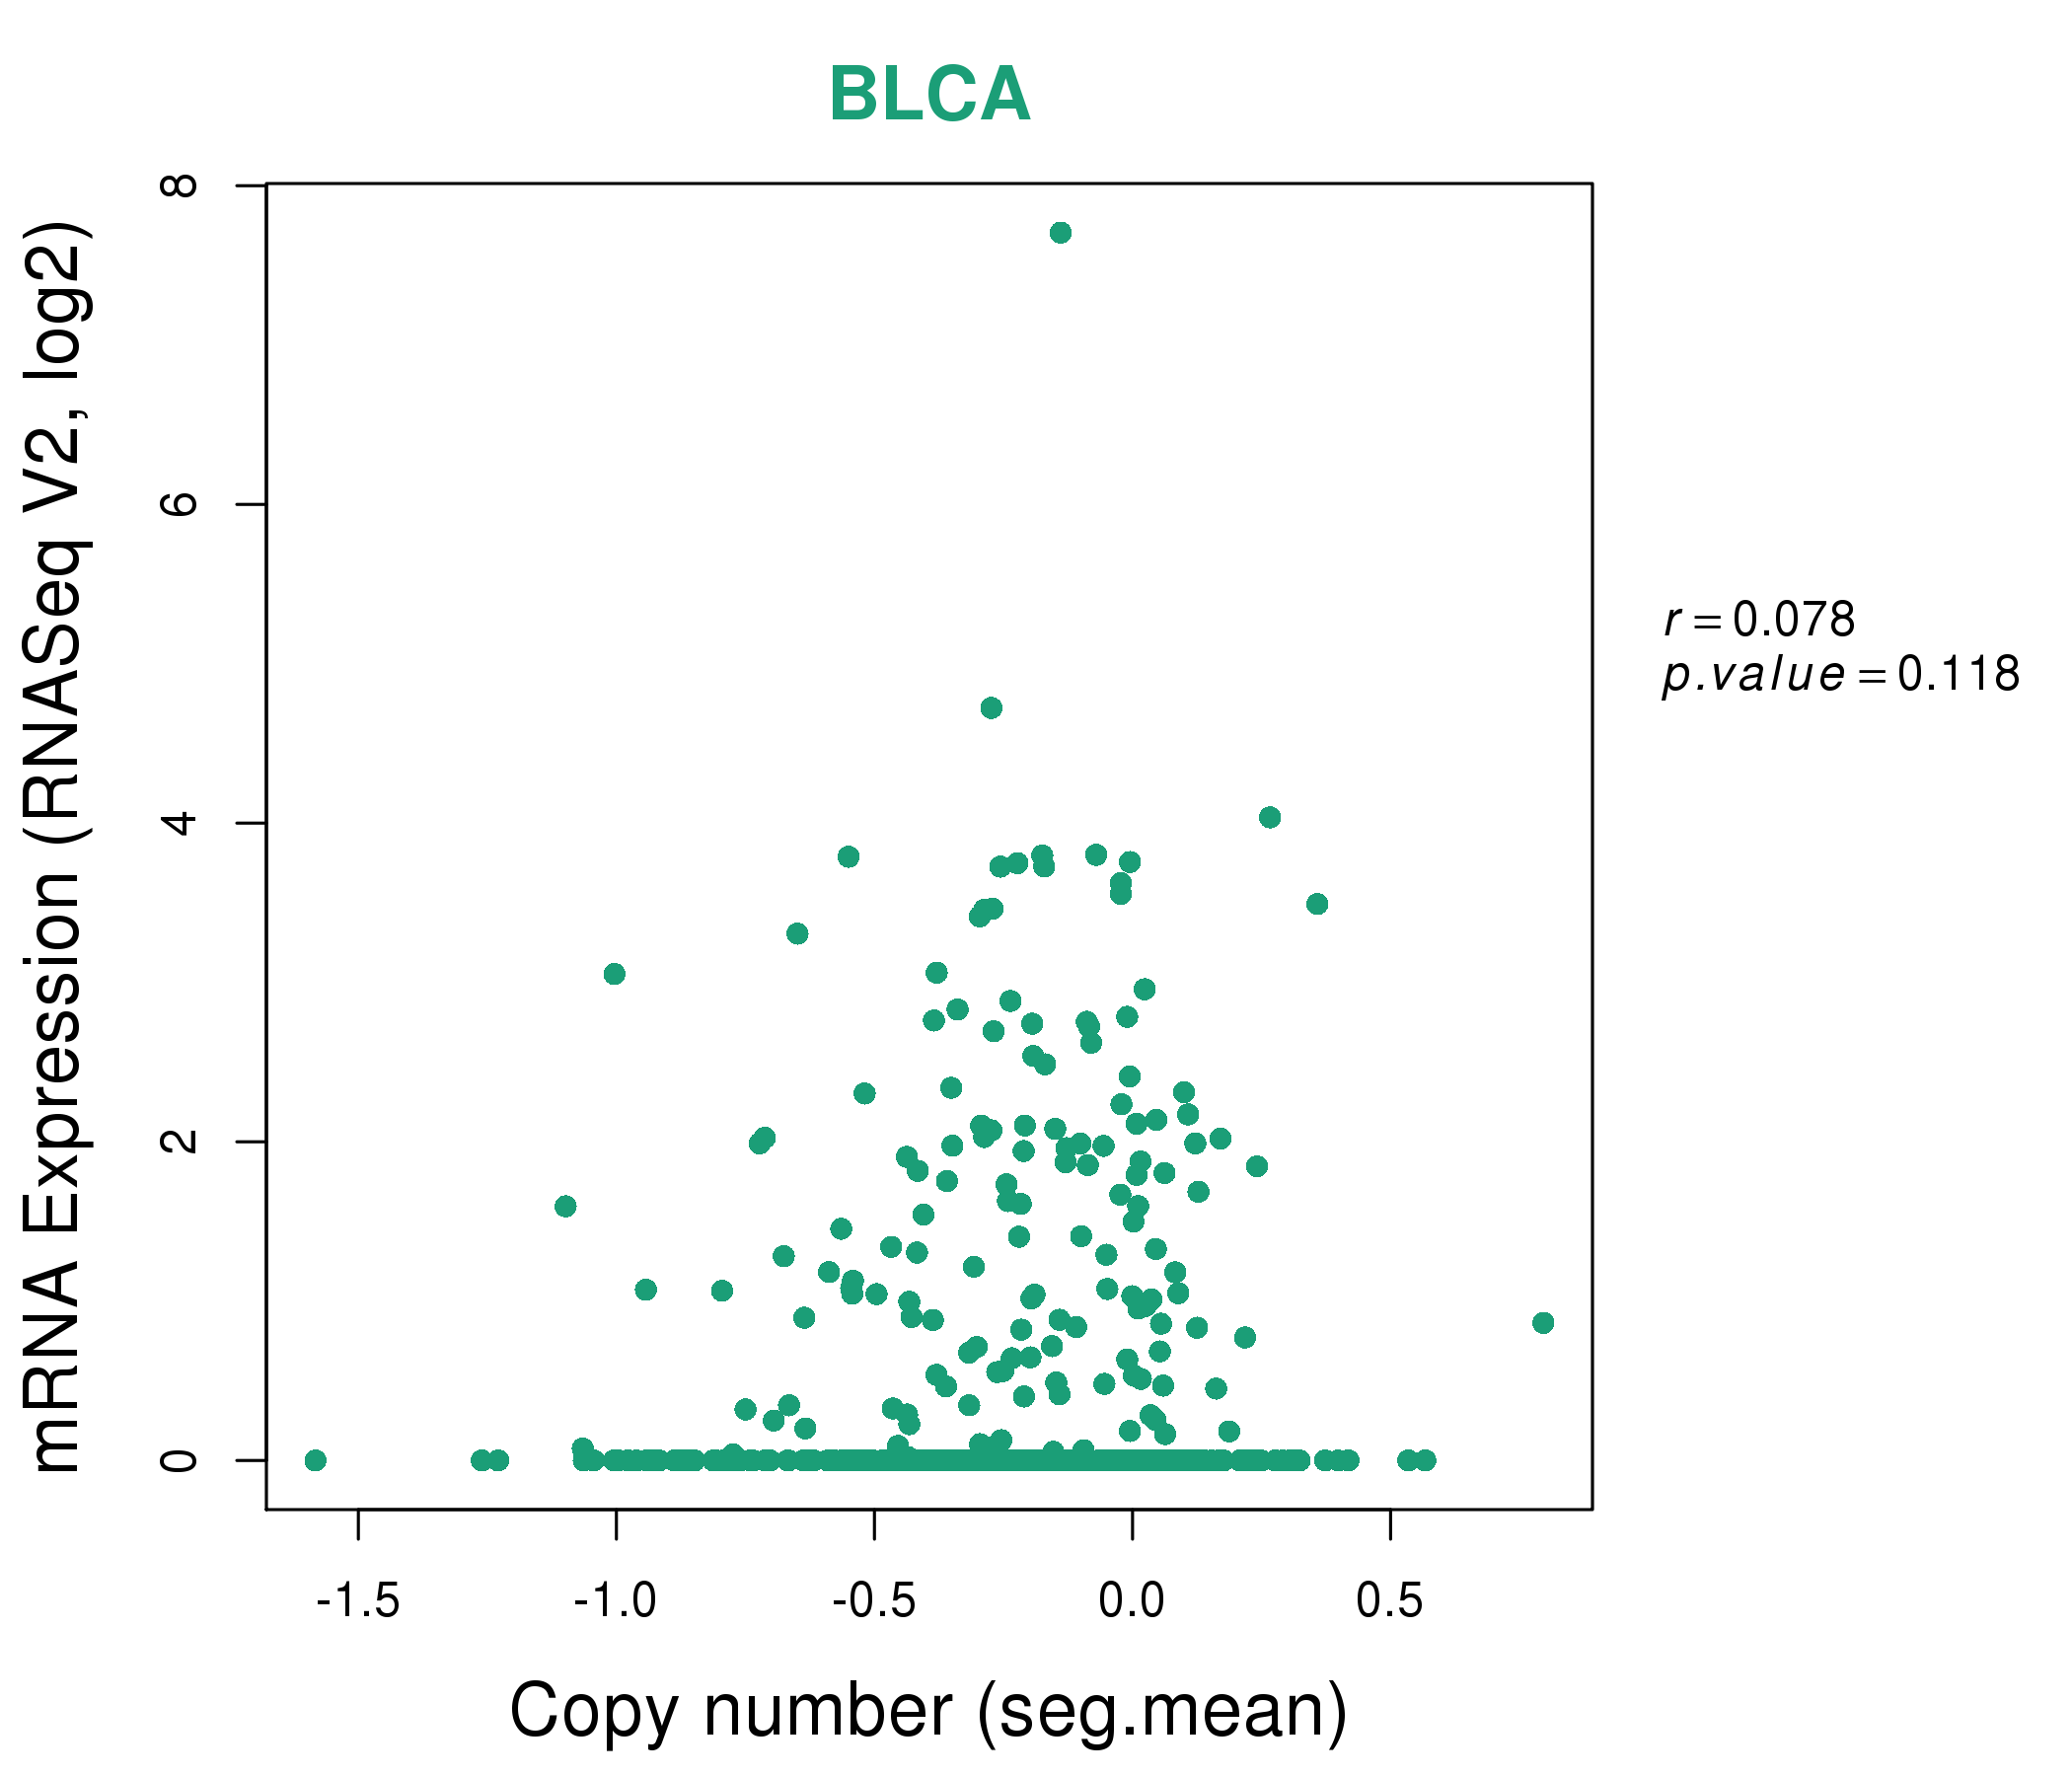
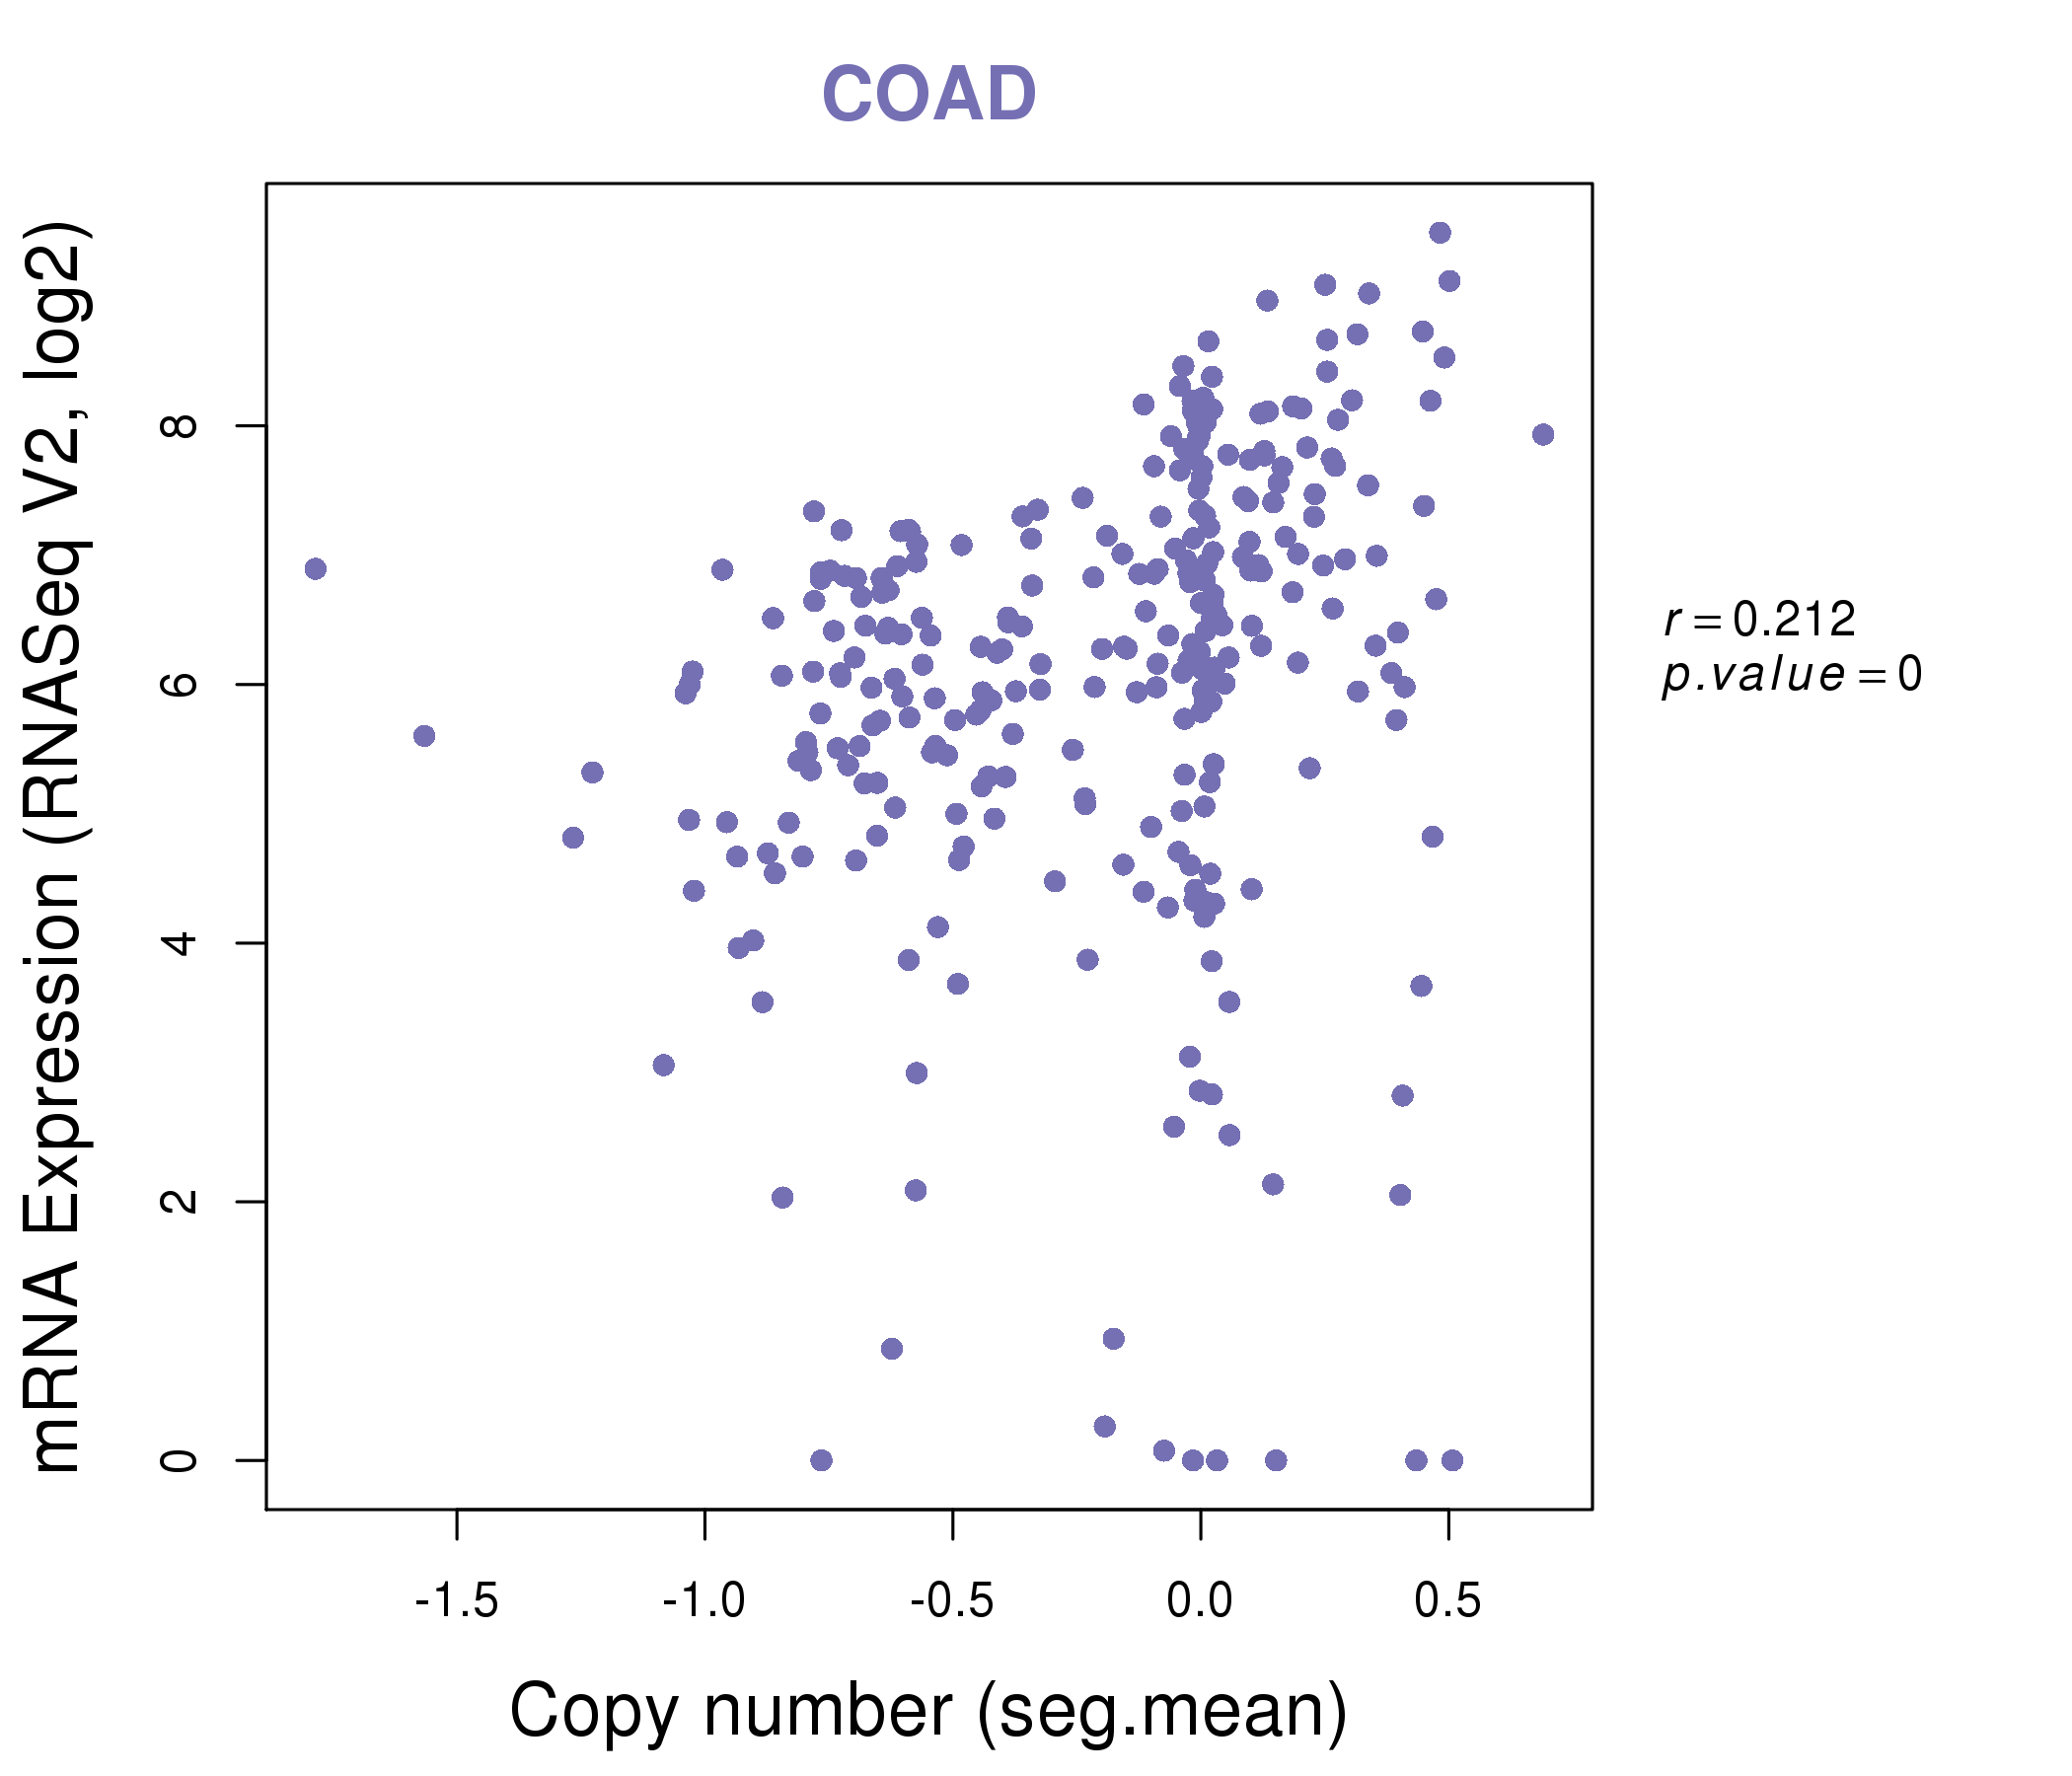
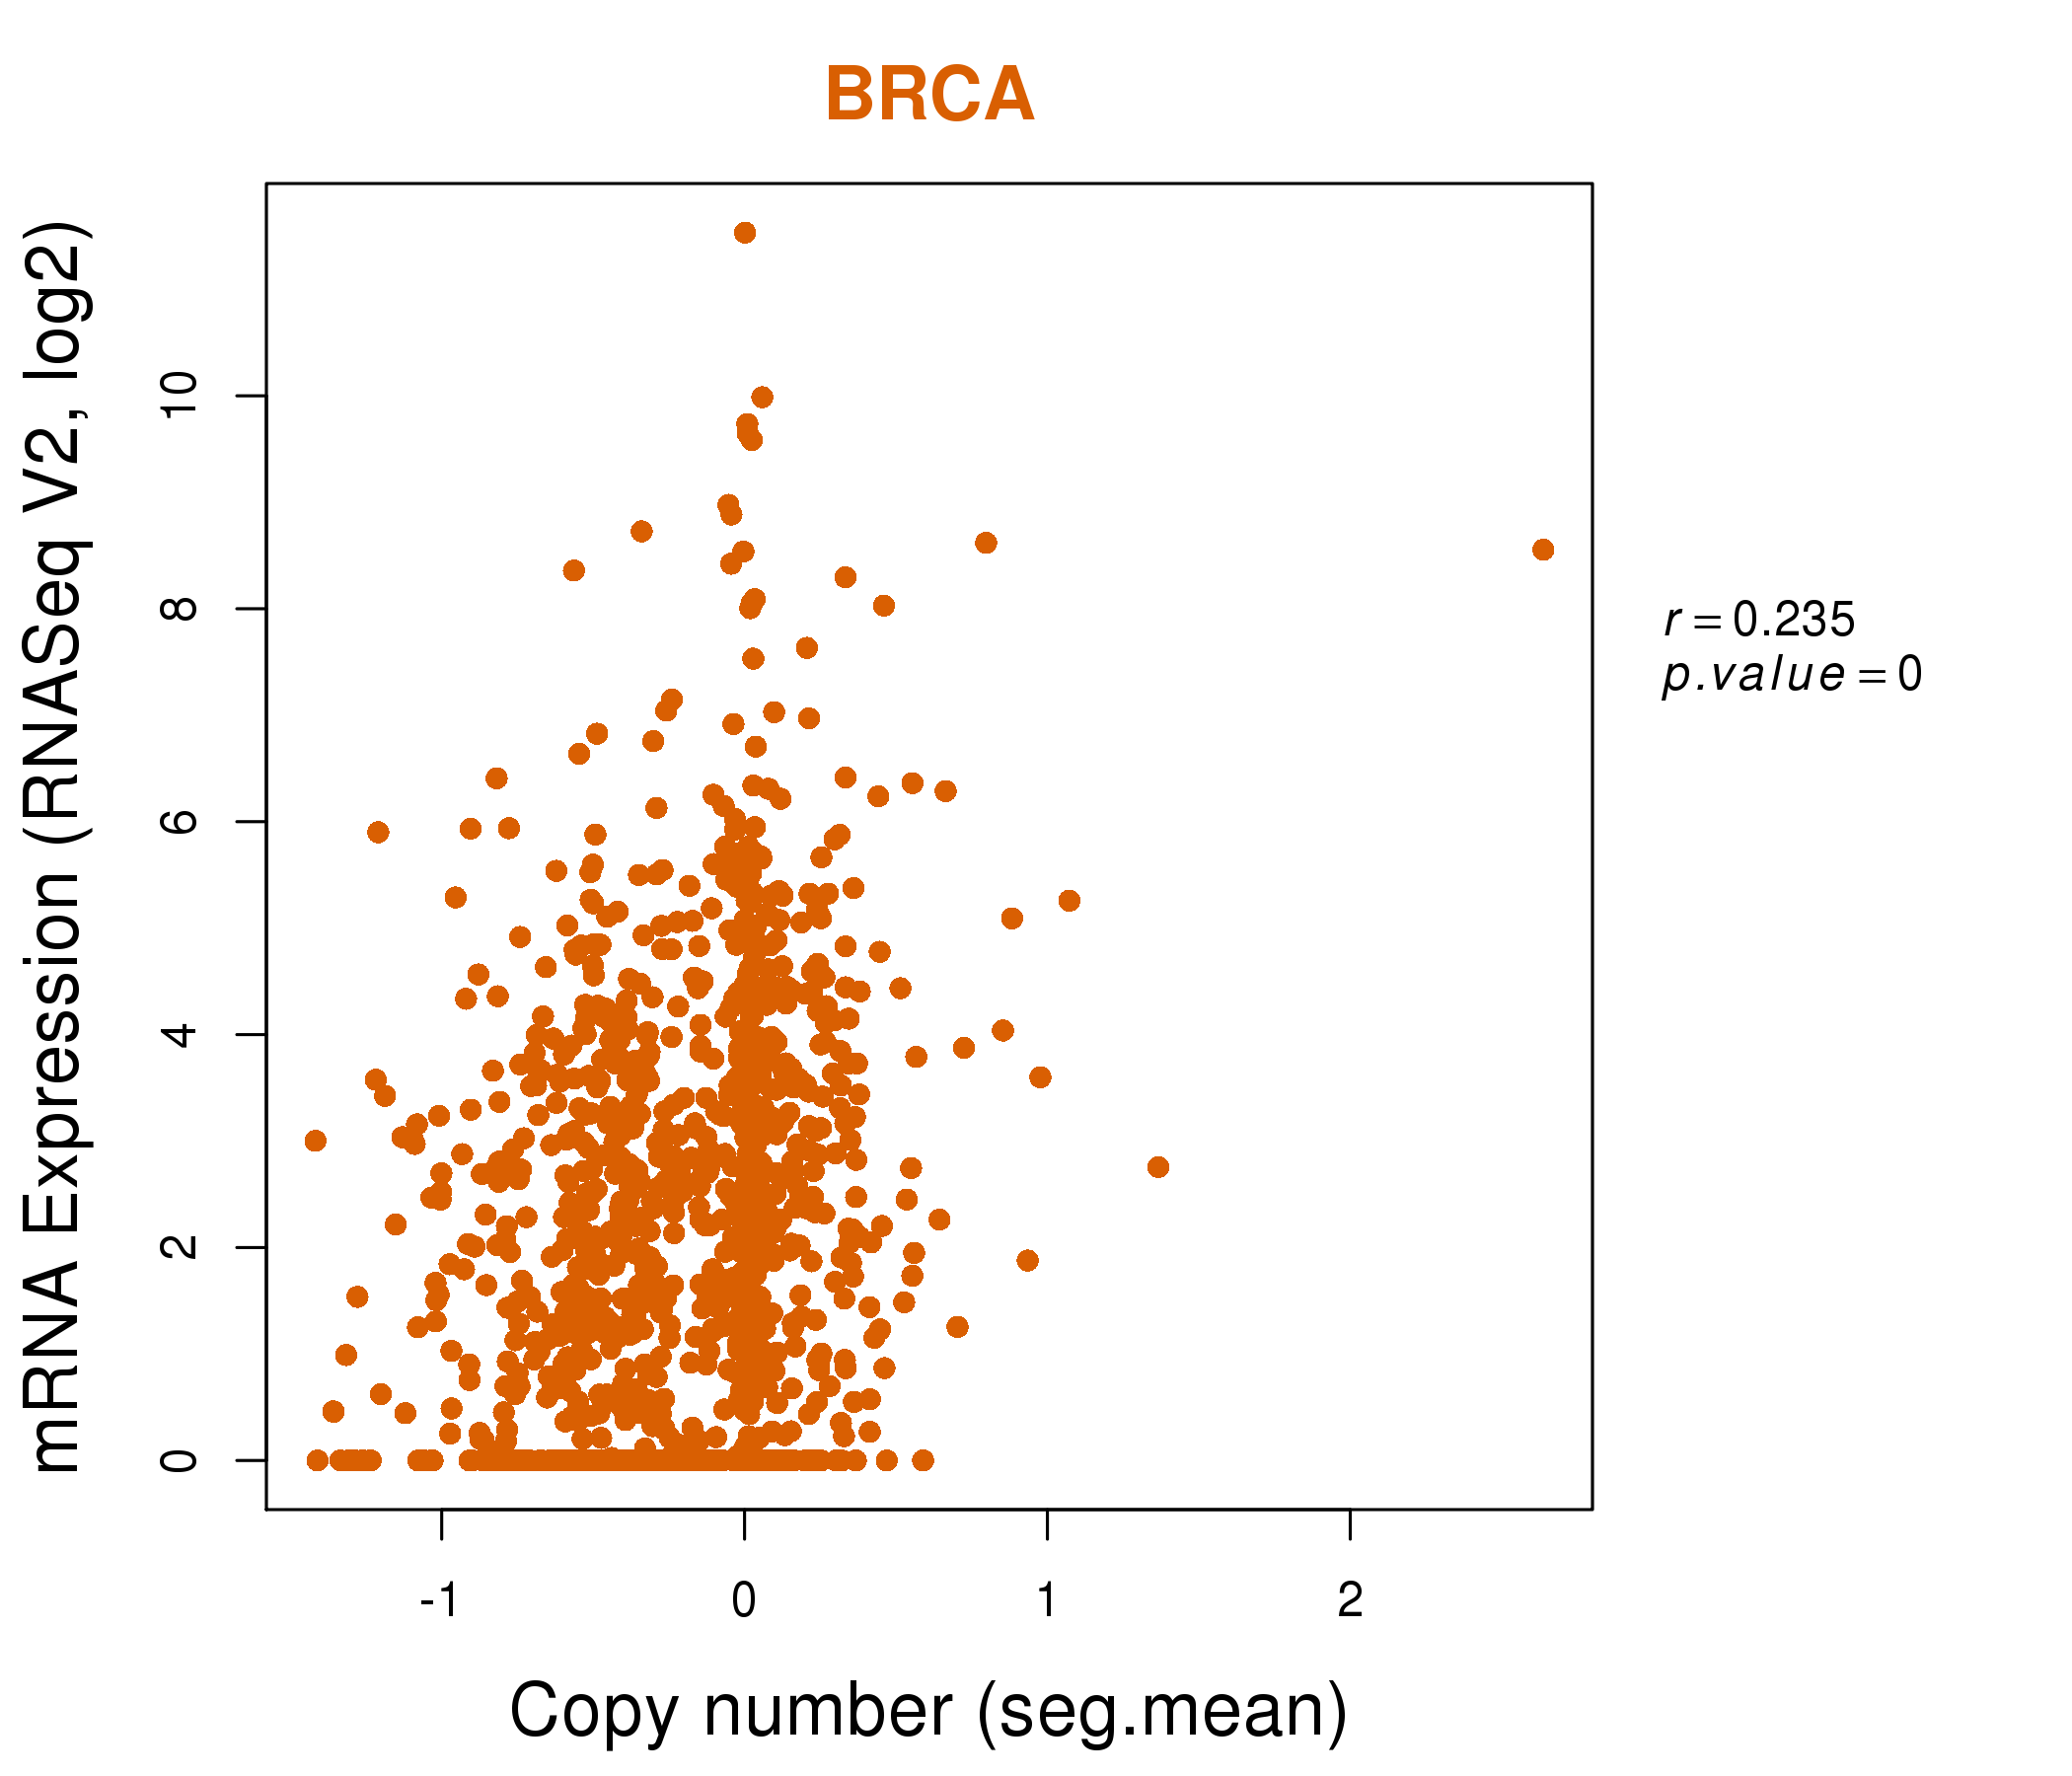
| * Copy number data were extracted from TCGA using R package TCGA-Assembler. The URLs of all public data files on TCGA DCC data server were gathered on Jan-05-2015. Function ProcessCNAData in TCGA-Assembler package was used to obtain gene-level copy number value which is calculated as the average copy number of the genomic region of a gene. |
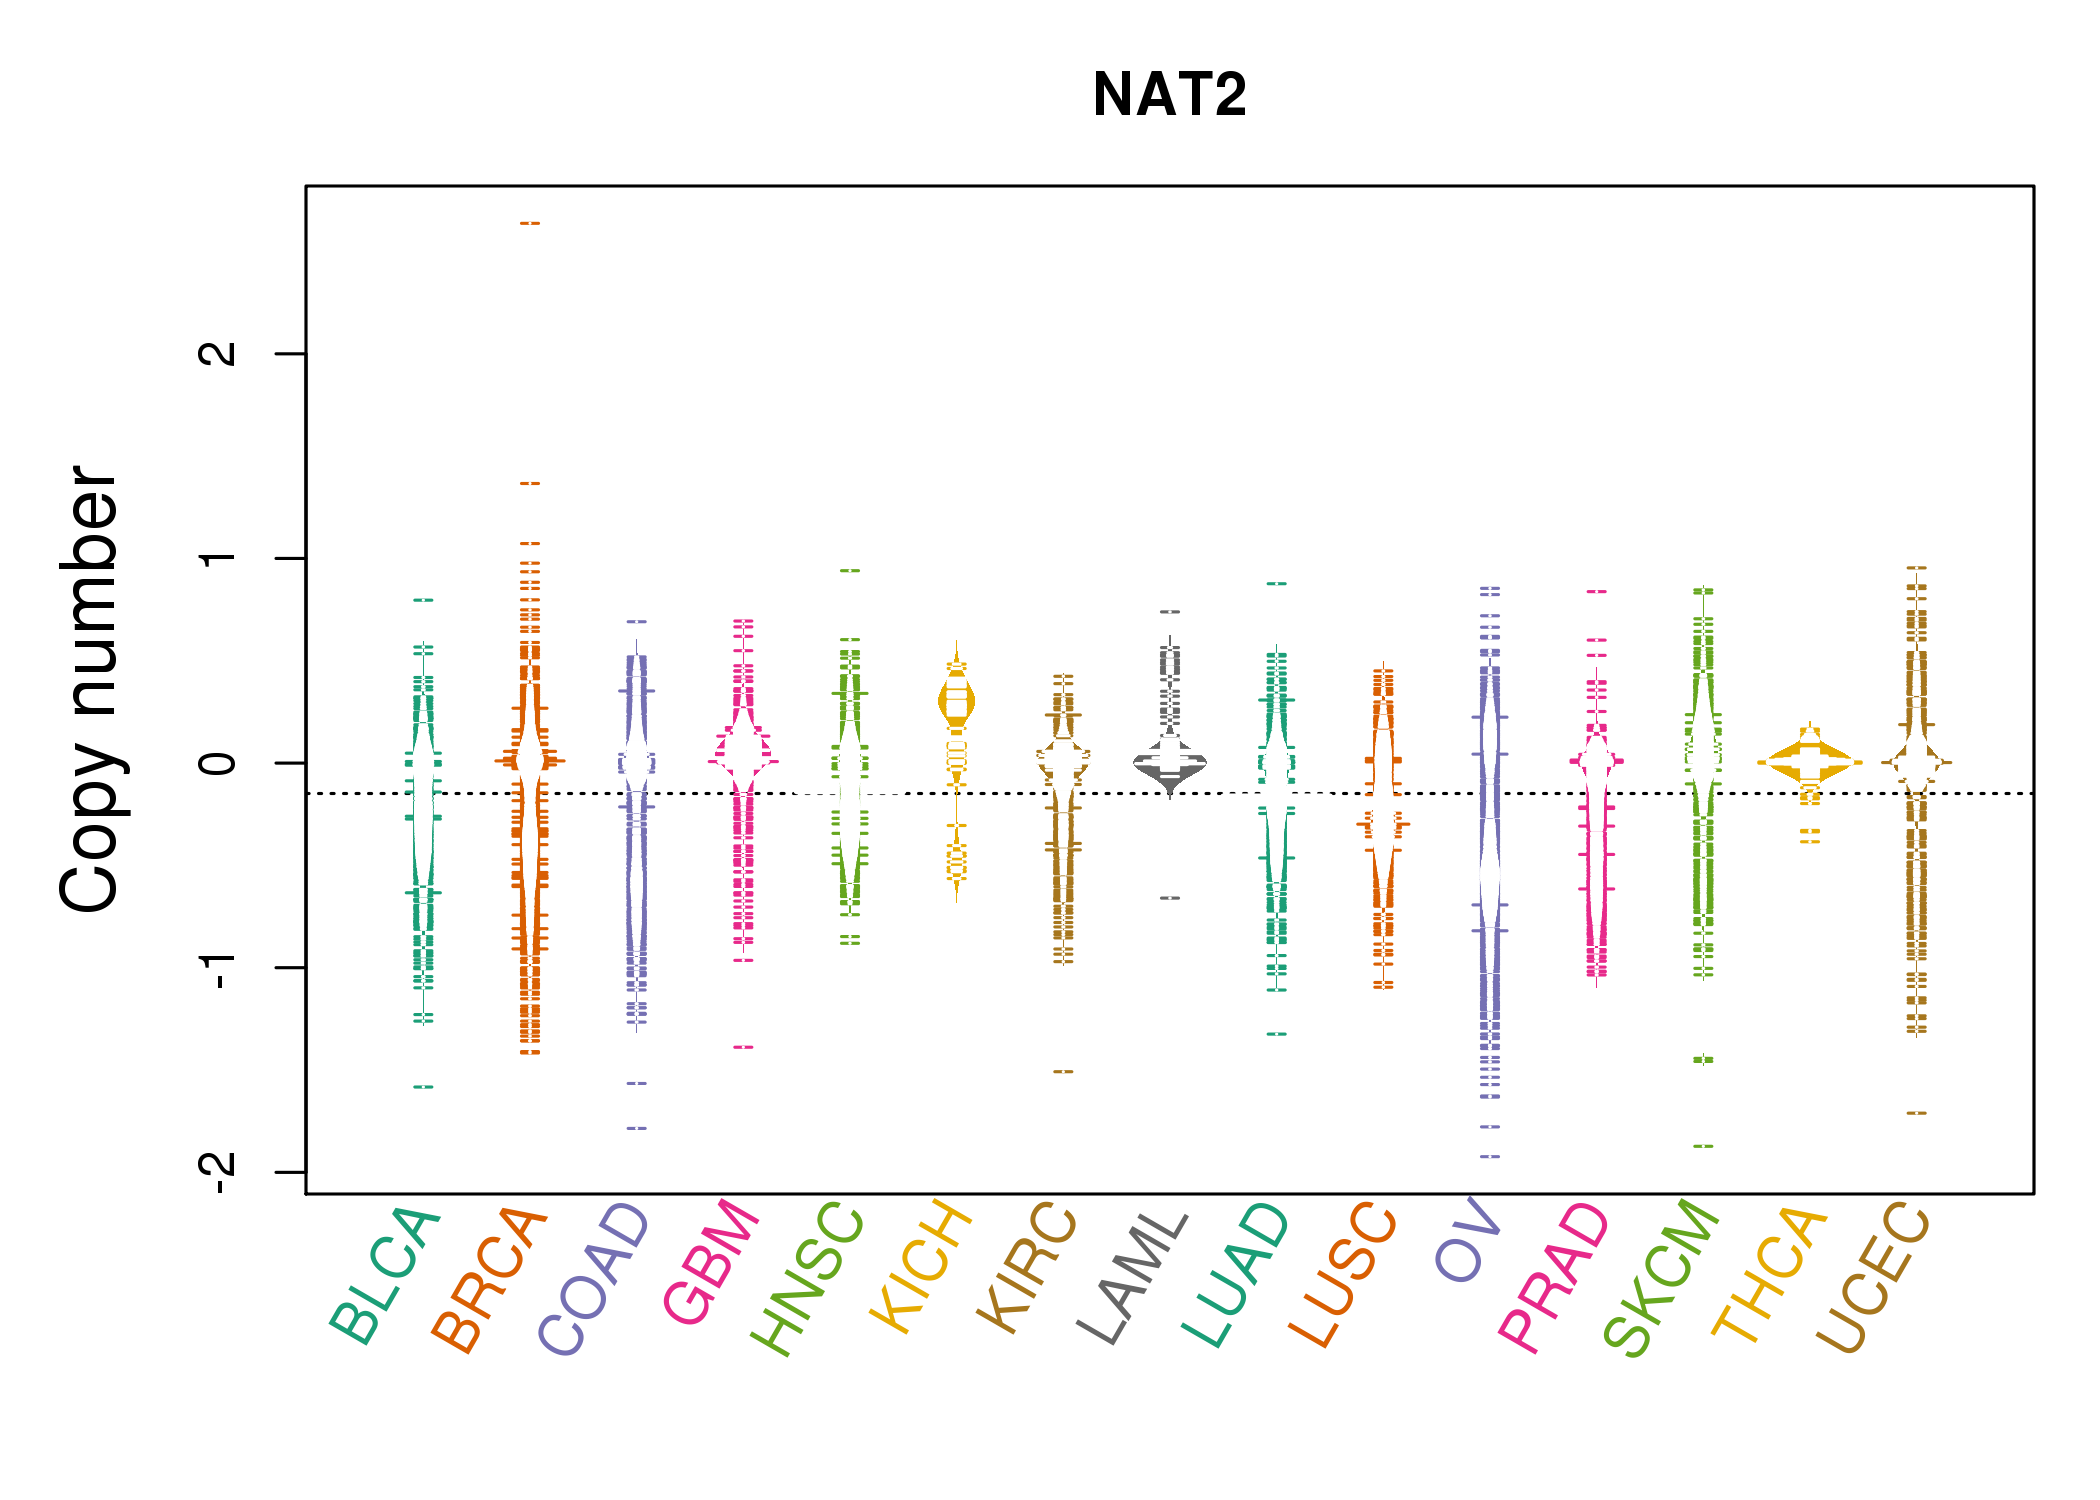 |
| cf) Tissue ID[Tissue type]: BLCA[Bladder Urothelial Carcinoma], BRCA[Breast invasive carcinoma], CESC[Cervical squamous cell carcinoma and endocervical adenocarcinoma], COAD[Colon adenocarcinoma], GBM[Glioblastoma multiforme], Glioma Low Grade, HNSC[Head and Neck squamous cell carcinoma], KICH[Kidney Chromophobe], KIRC[Kidney renal clear cell carcinoma], KIRP[Kidney renal papillary cell carcinoma], LAML[Acute Myeloid Leukemia], LUAD[Lung adenocarcinoma], LUSC[Lung squamous cell carcinoma], OV[Ovarian serous cystadenocarcinoma ], PAAD[Pancreatic adenocarcinoma], PRAD[Prostate adenocarcinoma], SKCM[Skin Cutaneous Melanoma], STAD[Stomach adenocarcinoma], THCA[Thyroid carcinoma], UCEC[Uterine Corpus Endometrial Carcinoma] |
| Top |
| Gene Expression for NAT2 |
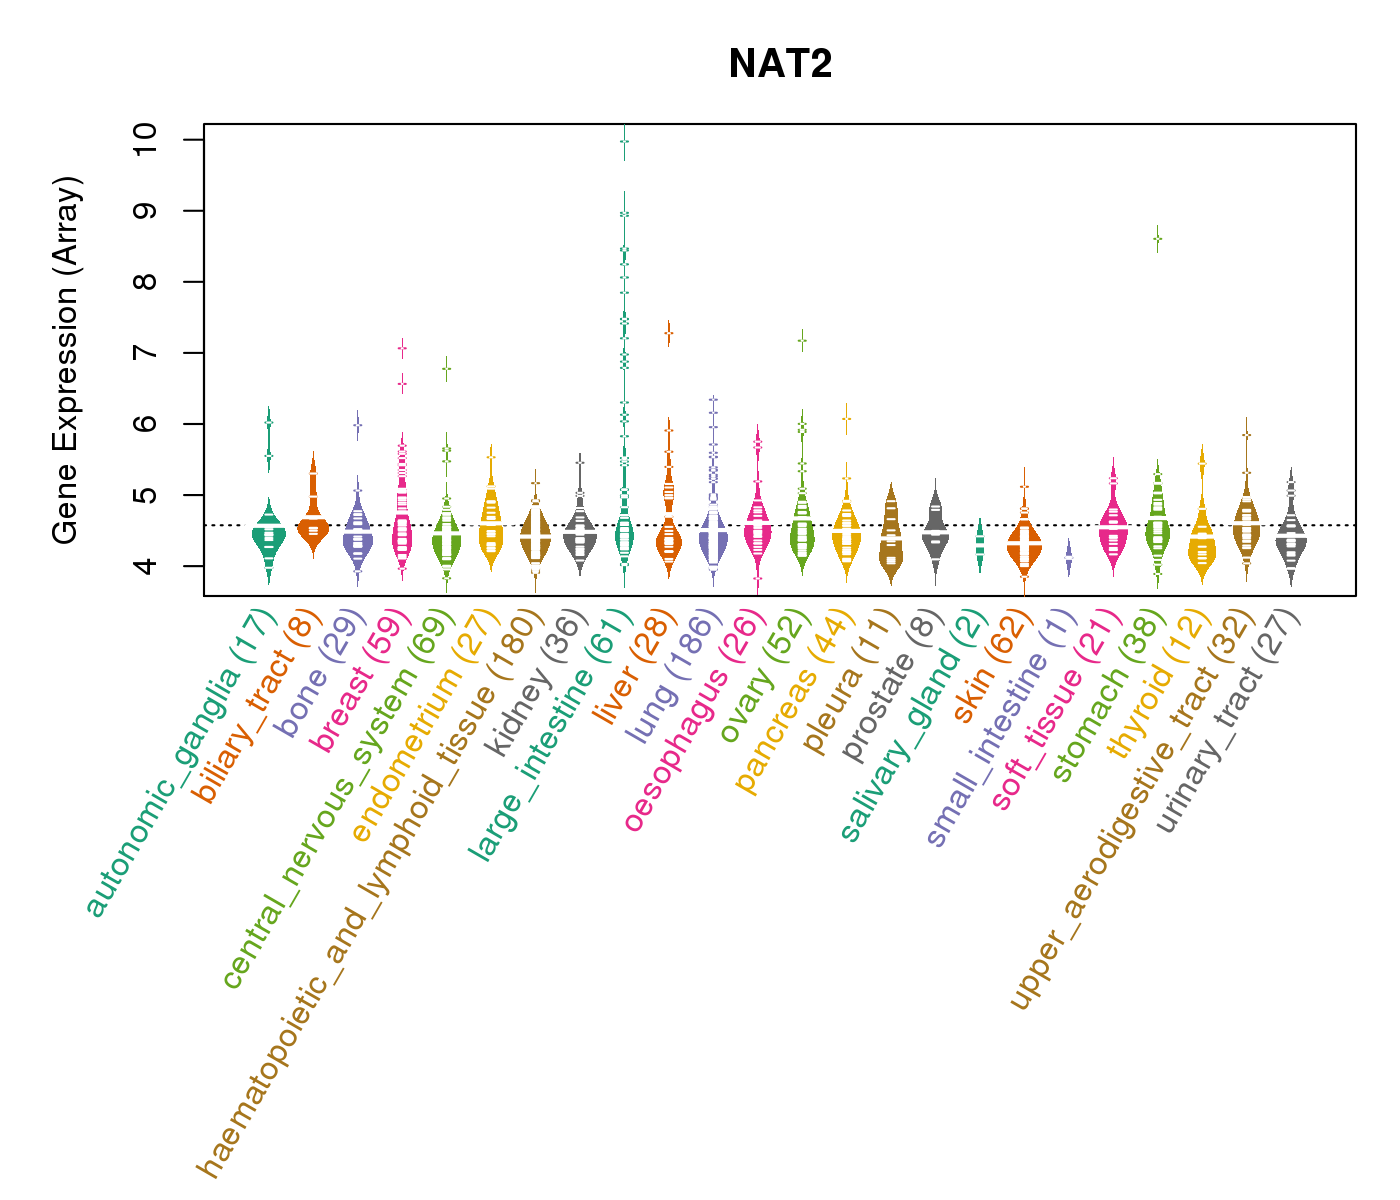
| * CCLE gene expression data were extracted from CCLE_Expression_Entrez_2012-10-18.res: Gene-centric RMA-normalized mRNA expression data. |
 |
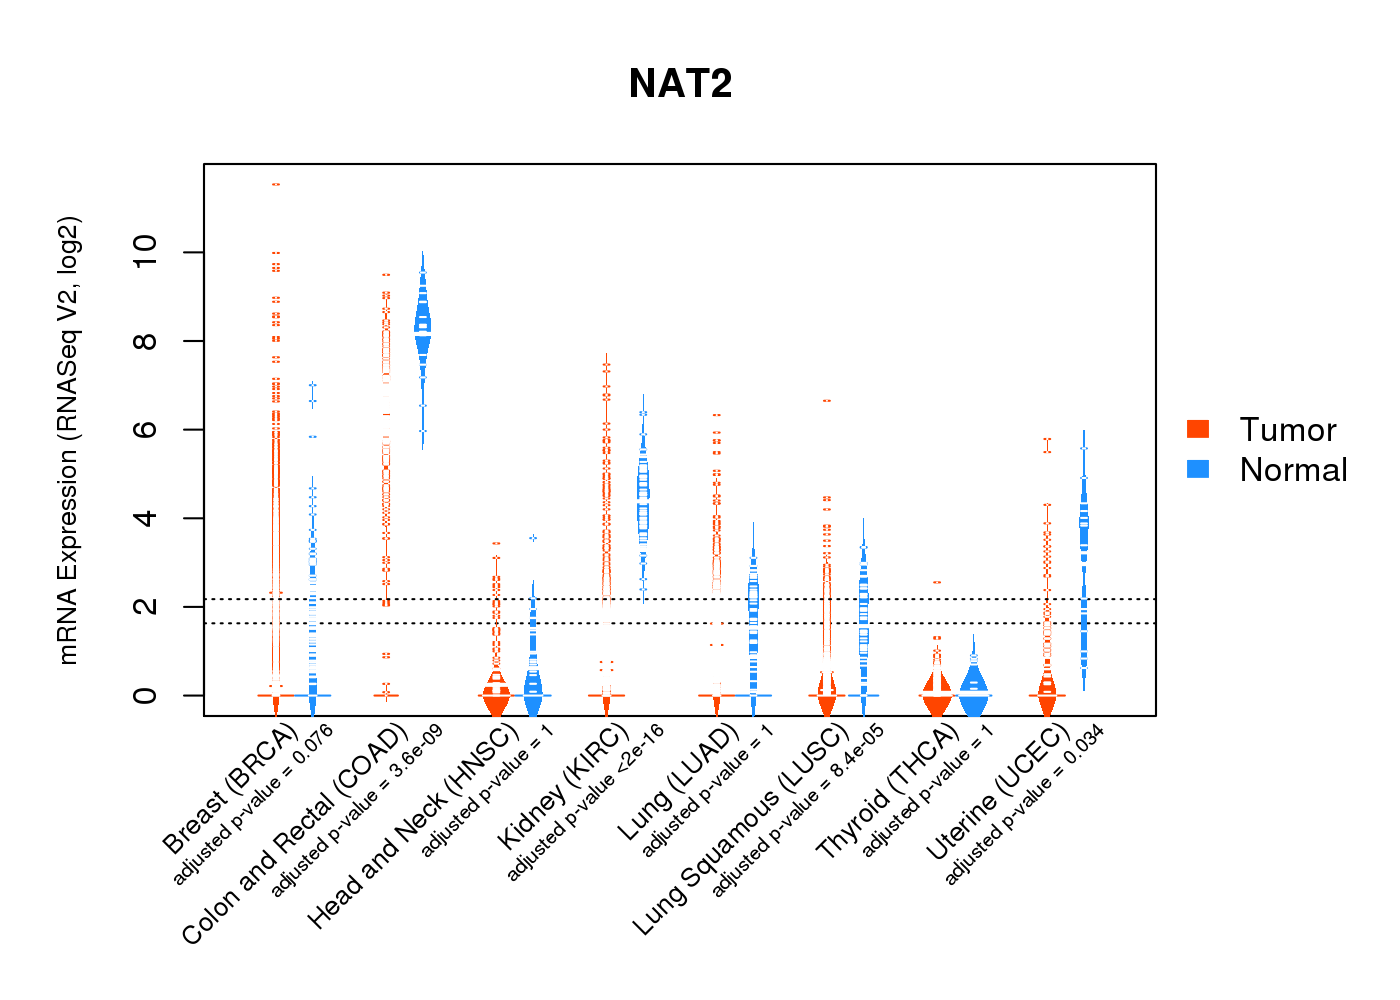
| * Normalized gene expression data of RNASeqV2 was extracted from TCGA using R package TCGA-Assembler. The URLs of all public data files on TCGA DCC data server were gathered at Jan-05-2015. Only eight cancer types have enough normal control samples for differential expression analysis. (t test, adjusted p<0.05 (using Benjamini-Hochberg FDR)) |
 |
| Top |
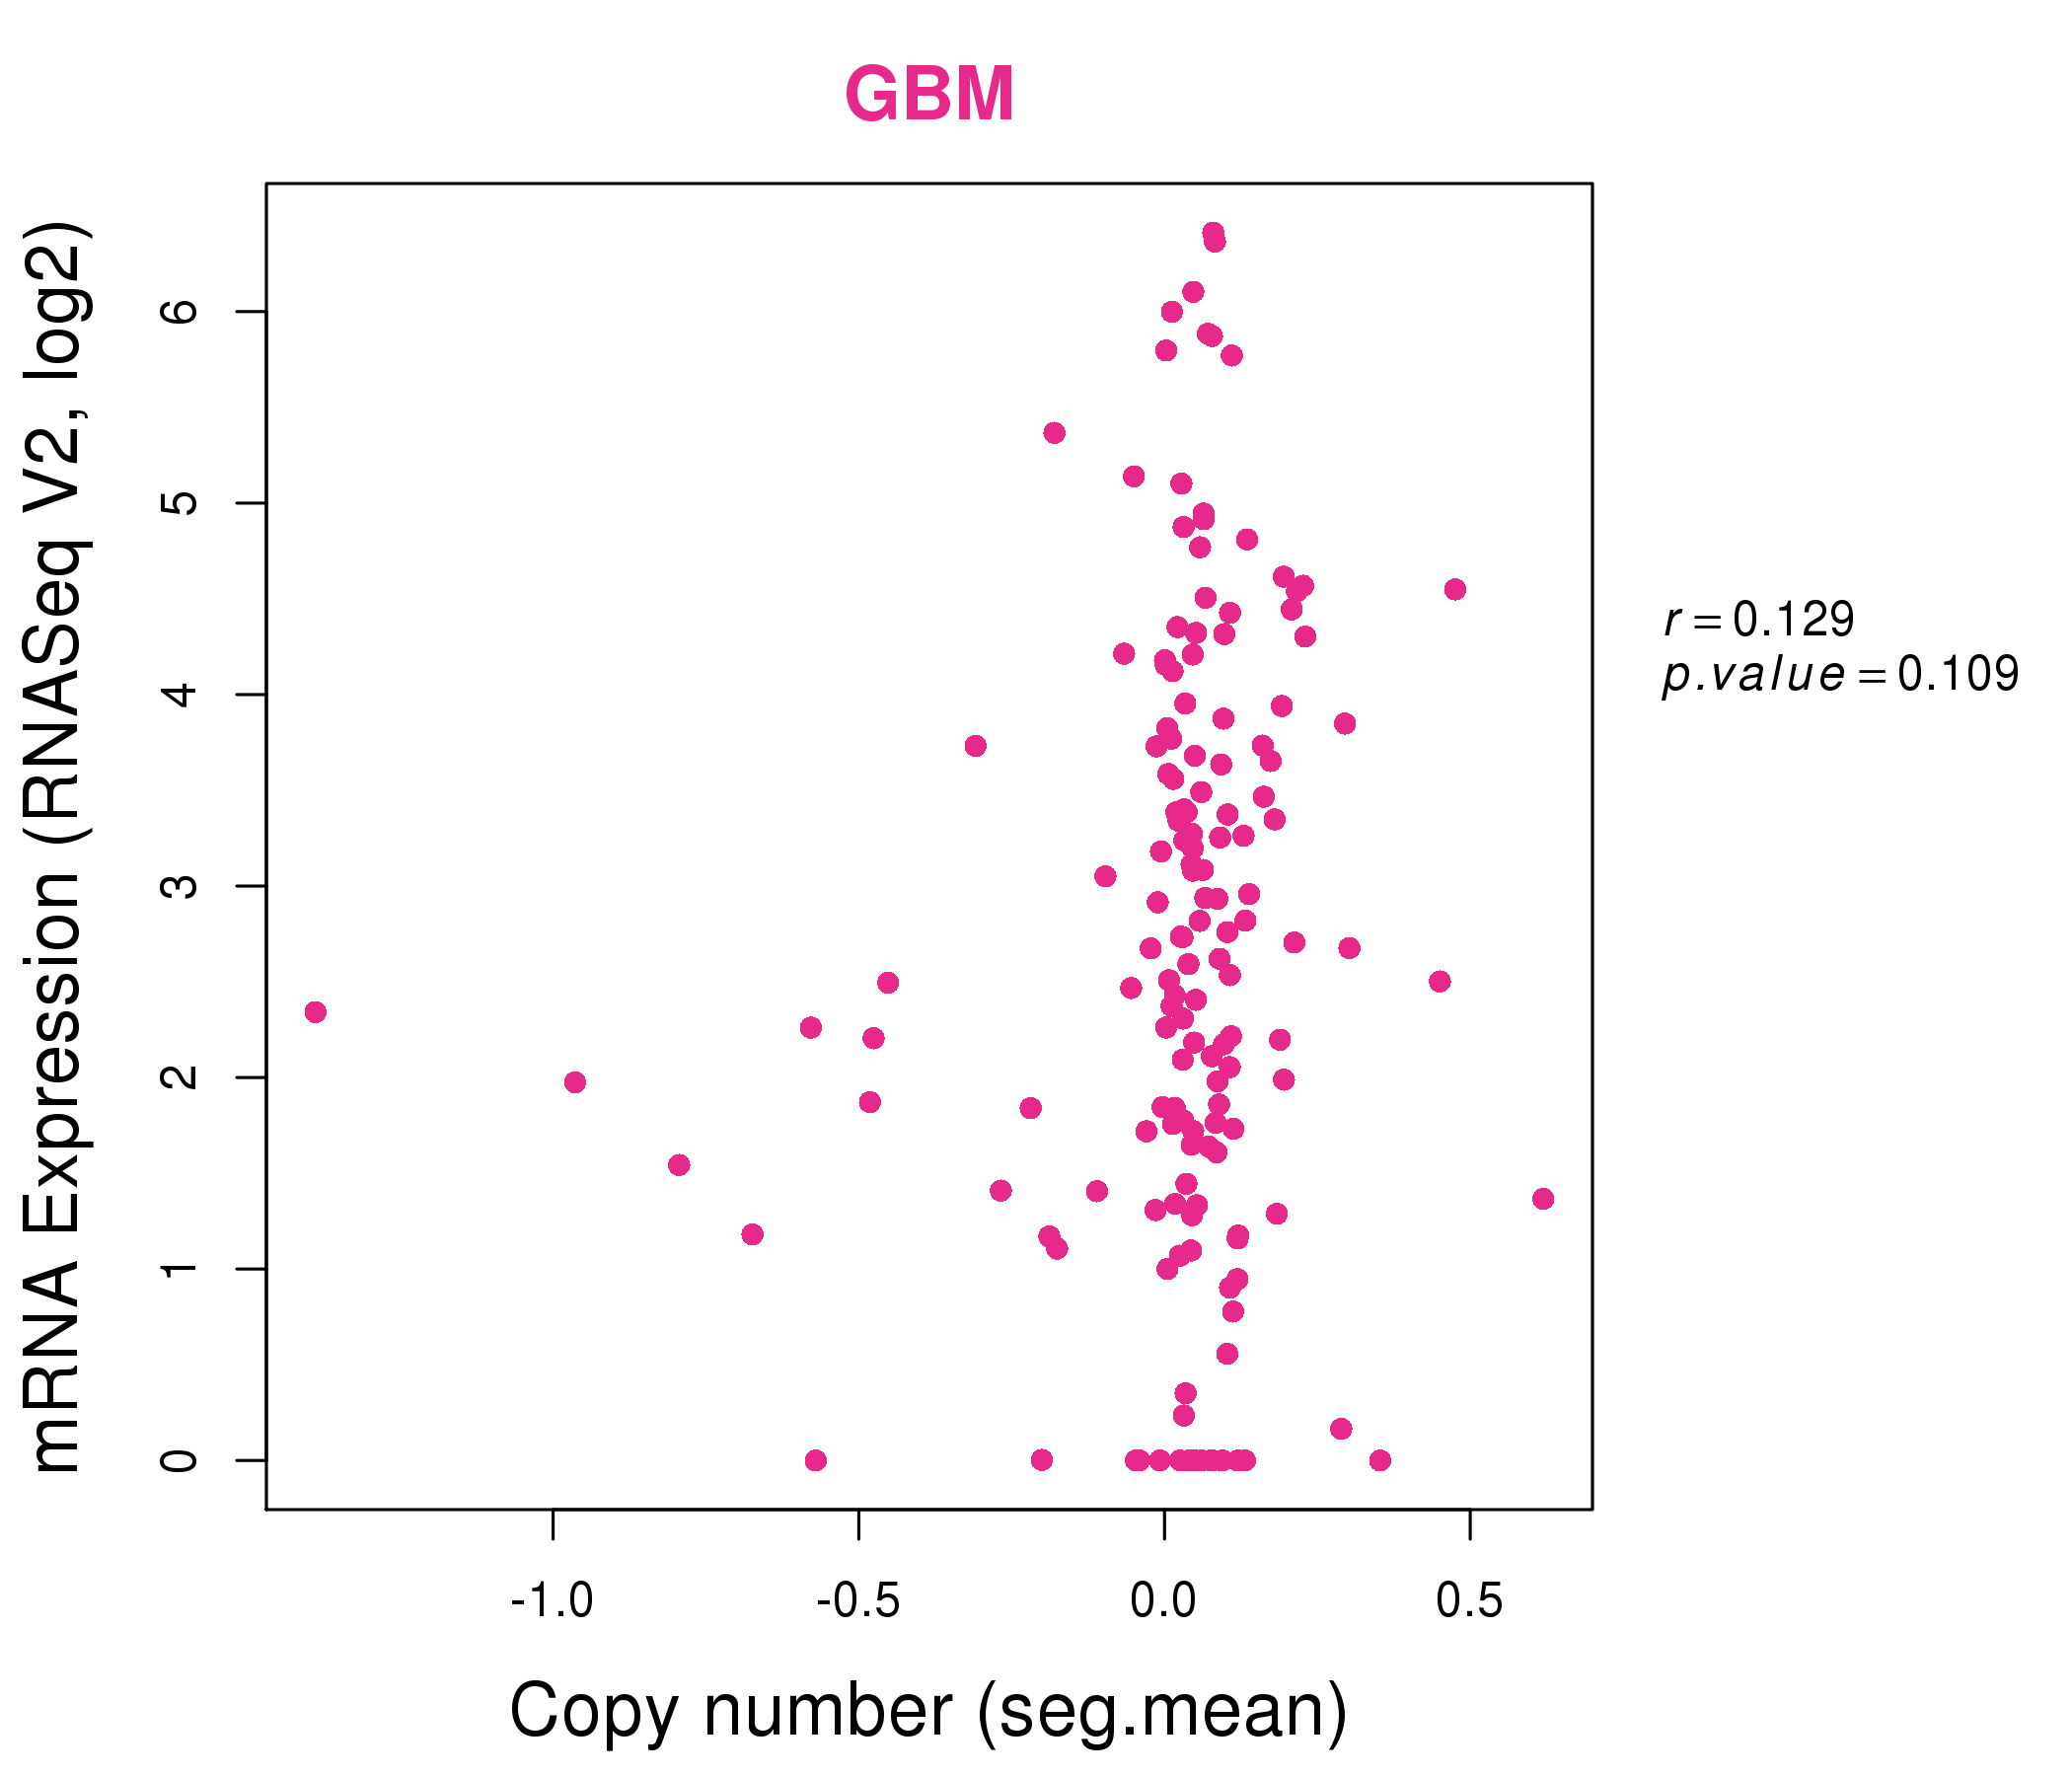
| * This plots show the correlation between CNV and gene expression. |
: Open all plots for all cancer types
 |
|
 |
|
| Top |
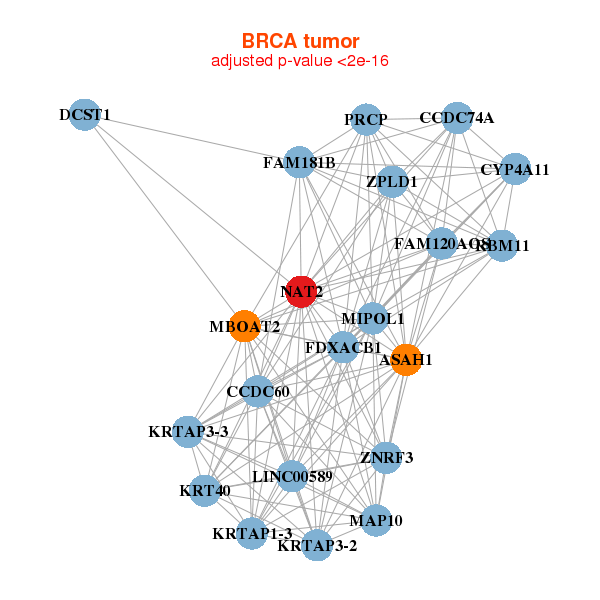
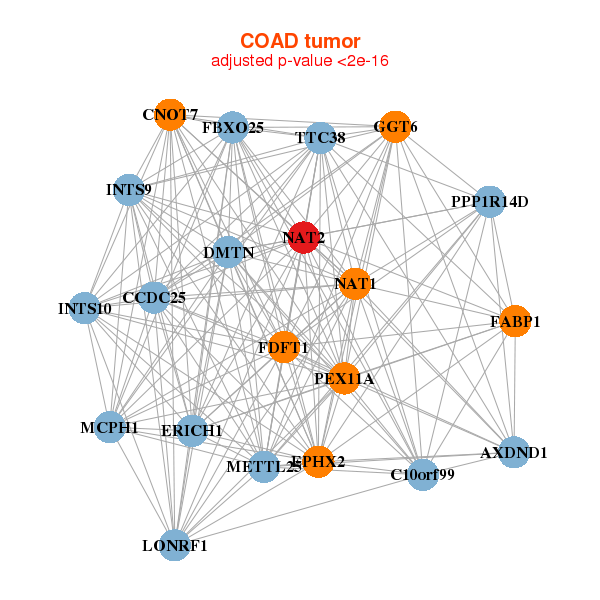
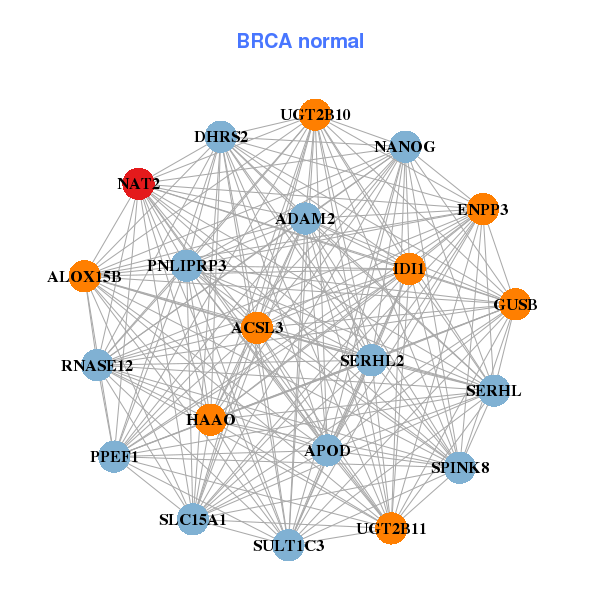
| Gene-Gene Network Information |
| * Co-Expression network figures were drawn using R package igraph. Only the top 20 genes with the highest correlations were shown. Red circle: input gene, orange circle: cell metabolism gene, sky circle: other gene |
: Open all plots for all cancer types
 |
| ||||
| ASAH1,LINC00589,CCDC60,CCDC74A,CYP4A11,DCST1,FAM120AOS, FAM181B,FDXACB1,MAP10,KRT40,KRTAP1-3,KRTAP3-2,KRTAP3-3, MBOAT2,MIPOL1,NAT2,PRCP,RBM11,ZNRF3,ZPLD1 | ACSL3,ADAM2,ALOX15B,APOD,DHRS2,ENPP3,GUSB, HAAO,IDI1,NANOG,NAT2,PNLIPRP3,PPEF1,RNASE12, SERHL2,SERHL,SLC15A1,SPINK8,SULT1C3,UGT2B10,UGT2B11 | ||||
 |
| ||||
| C10orf99,METTL25,AXDND1,CCDC25,CNOT7,DMTN,EPHX2, ERICH1,FABP1,FBXO25,FDFT1,GGT6,INTS10,INTS9, LONRF1,MCPH1,NAT1,NAT2,PEX11A,PPP1R14D,TTC38 | ABCD3,BPNT1,ABRACL,CRYL1,CTAGE5,ETFDH,FDX1, GNG12,MGST3,NAT2,NRAS,SLC51B,PAFAH2,SLC25A20, SLC35D2,SLC35F5,SNX14,SPPL2A,TGFA,TMEM139,VTA1 |
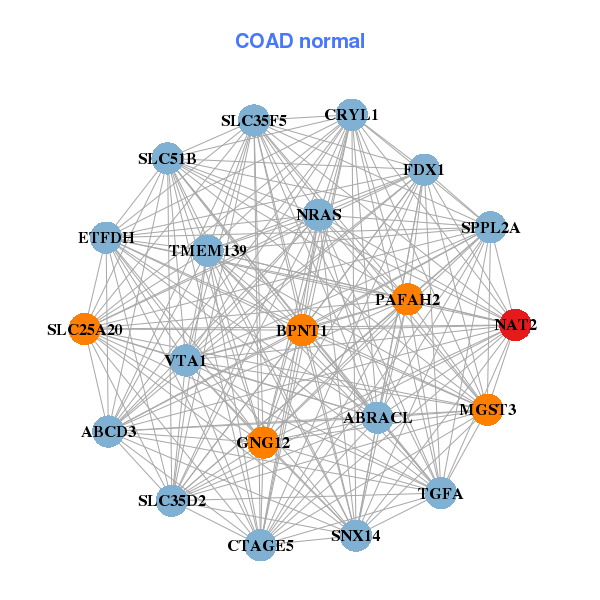
| * Co-Expression network figures were drawn using R package igraph. Only the top 20 genes with the highest correlations were shown. Red circle: input gene, orange circle: cell metabolism gene, sky circle: other gene |
: Open all plots for all cancer types
| Top |
: Open all interacting genes' information including KEGG pathway for all interacting genes from DAVID
| Top |
| Pharmacological Information for NAT2 |
| DB Category | DB Name | DB's ID and Url link |
| Chemistry | ChEMBL | CHEMBL2194; -. |
| Chemistry | ChEMBL | CHEMBL2194; -. |
| Organism-specific databases | PharmGKB | PA18; -. |
| Organism-specific databases | PharmGKB | PA18; -. |
| Organism-specific databases | CTD | 10; -. |
| Organism-specific databases | CTD | 10; -. |
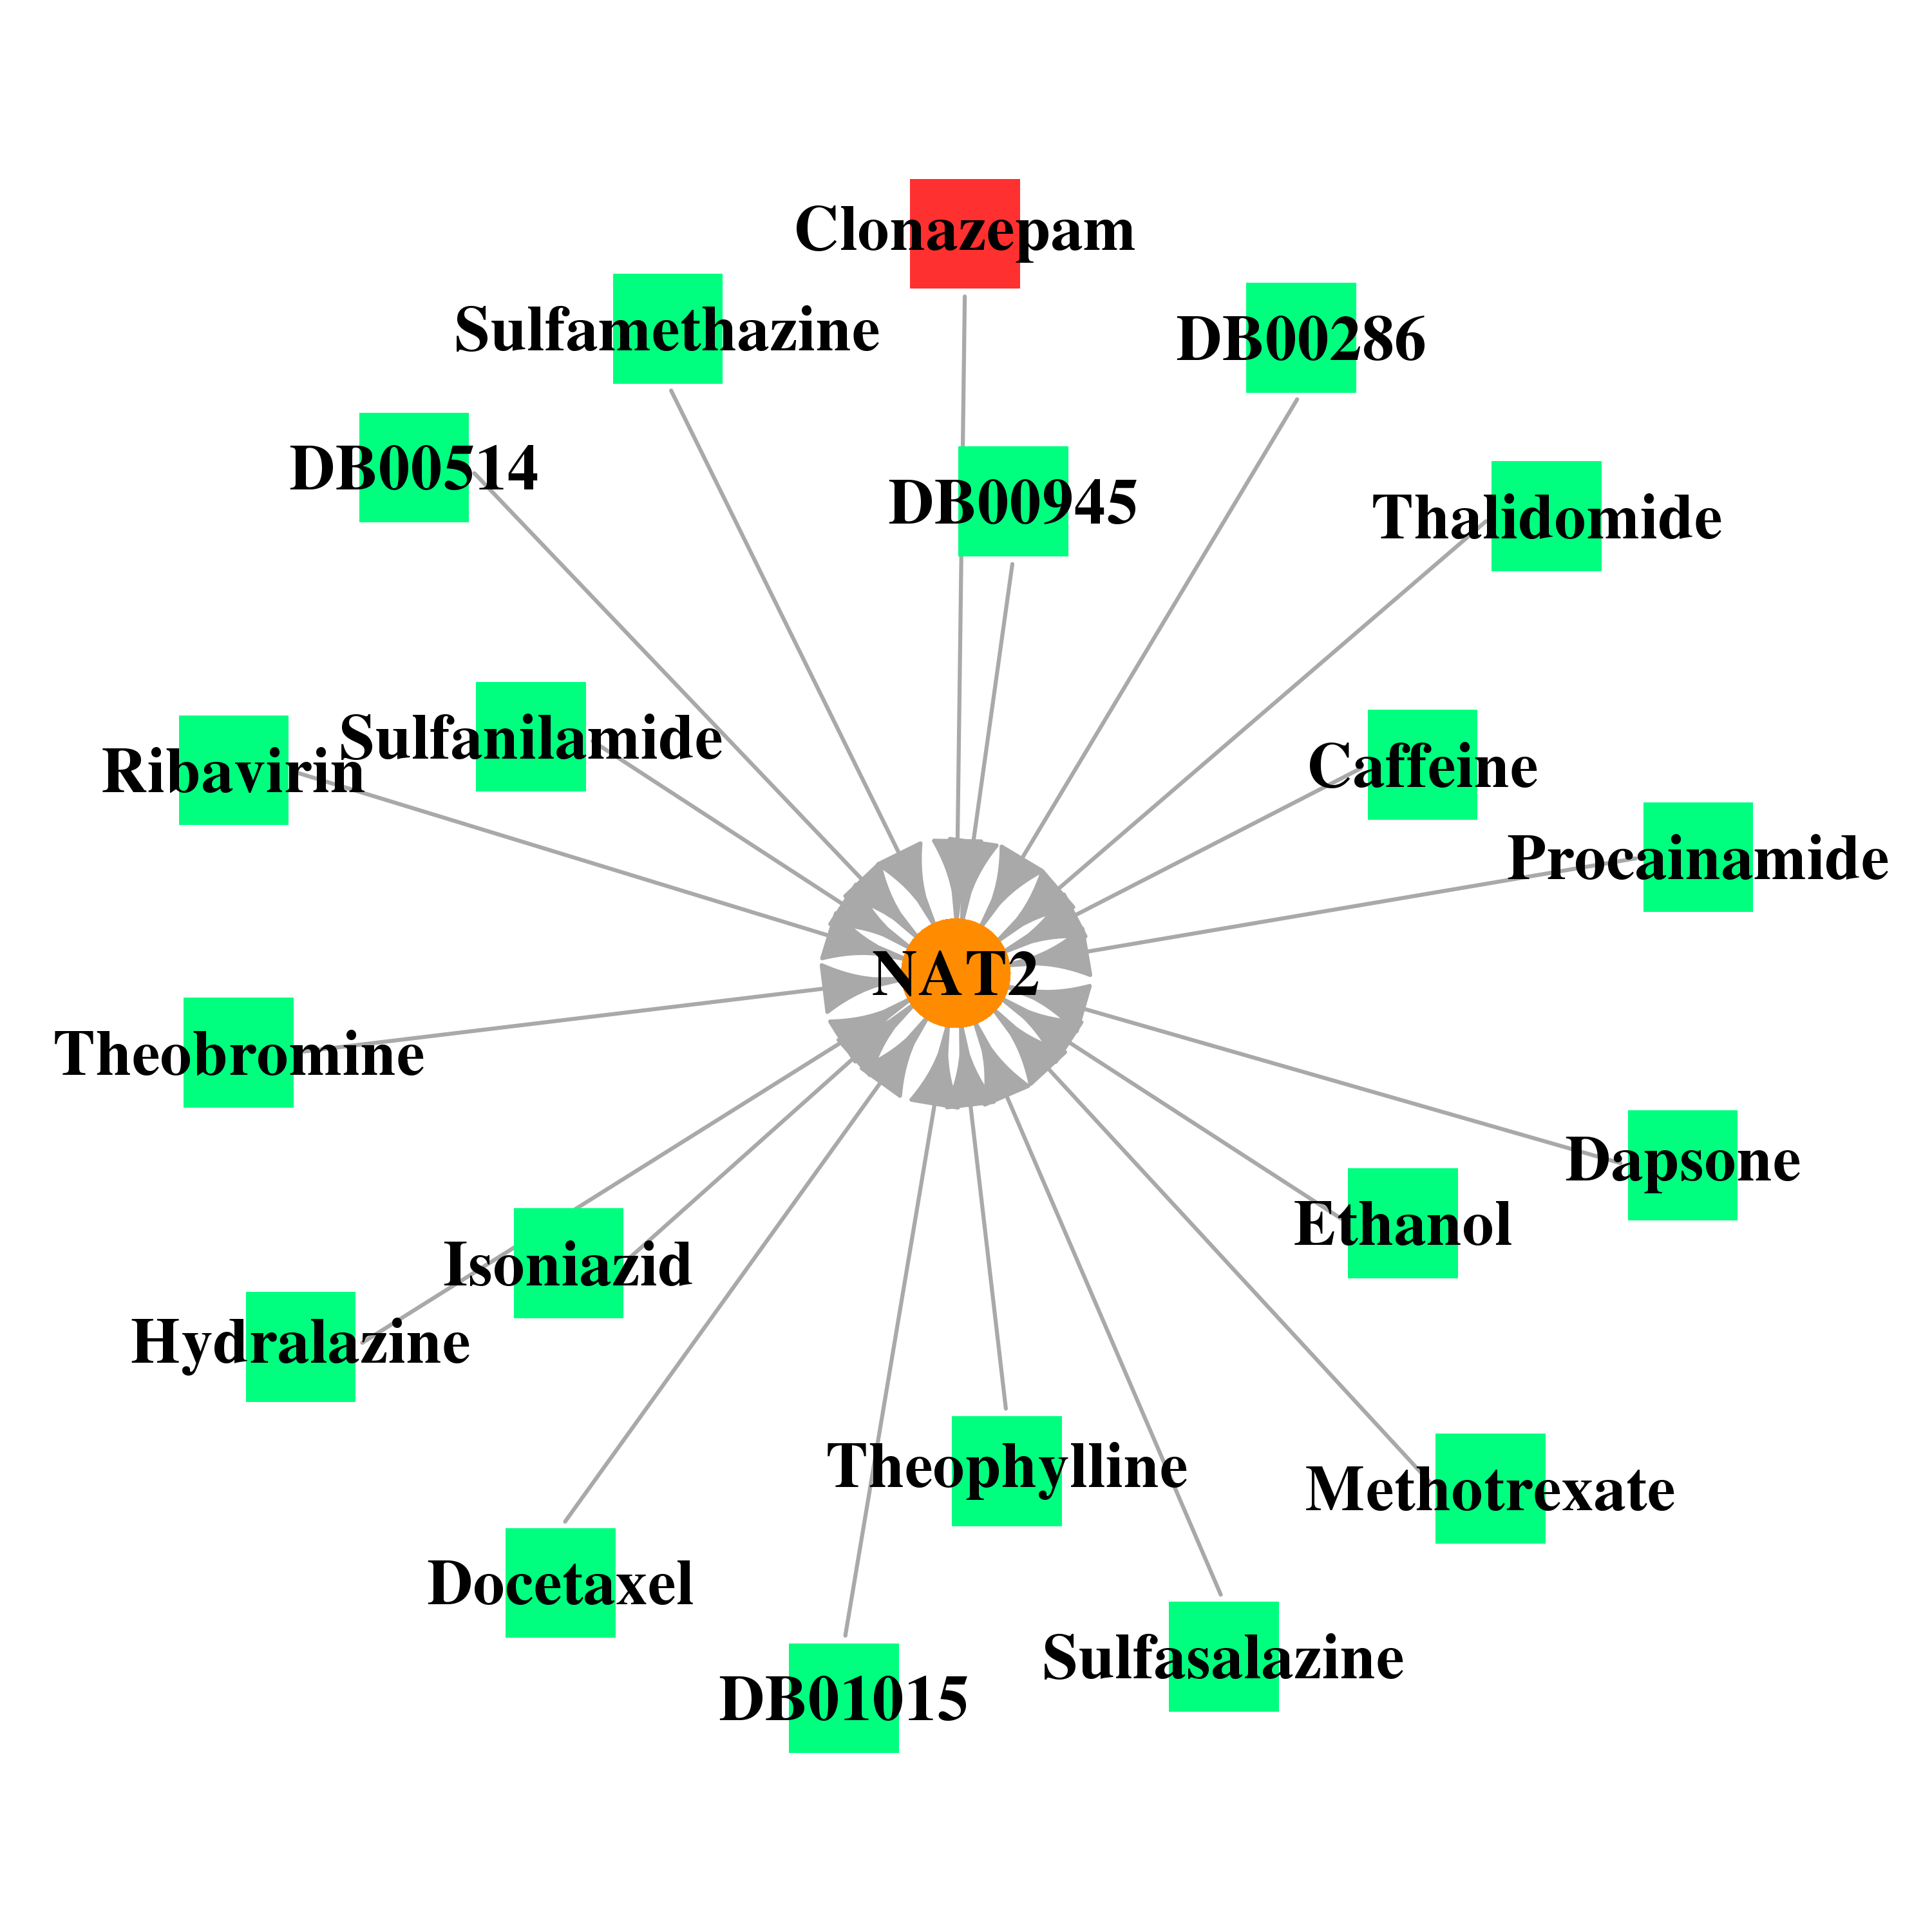
| * Gene Centered Interaction Network. |
 |
| * Drug Centered Interaction Network. |
| DrugBank ID | Target Name | Drug Groups | Generic Name | Drug Centered Network | Drug Structure |
| DB01248 | N-acetyltransferase 2 (arylamine N-acetyltransferase) | approved; investigational | Docetaxel | 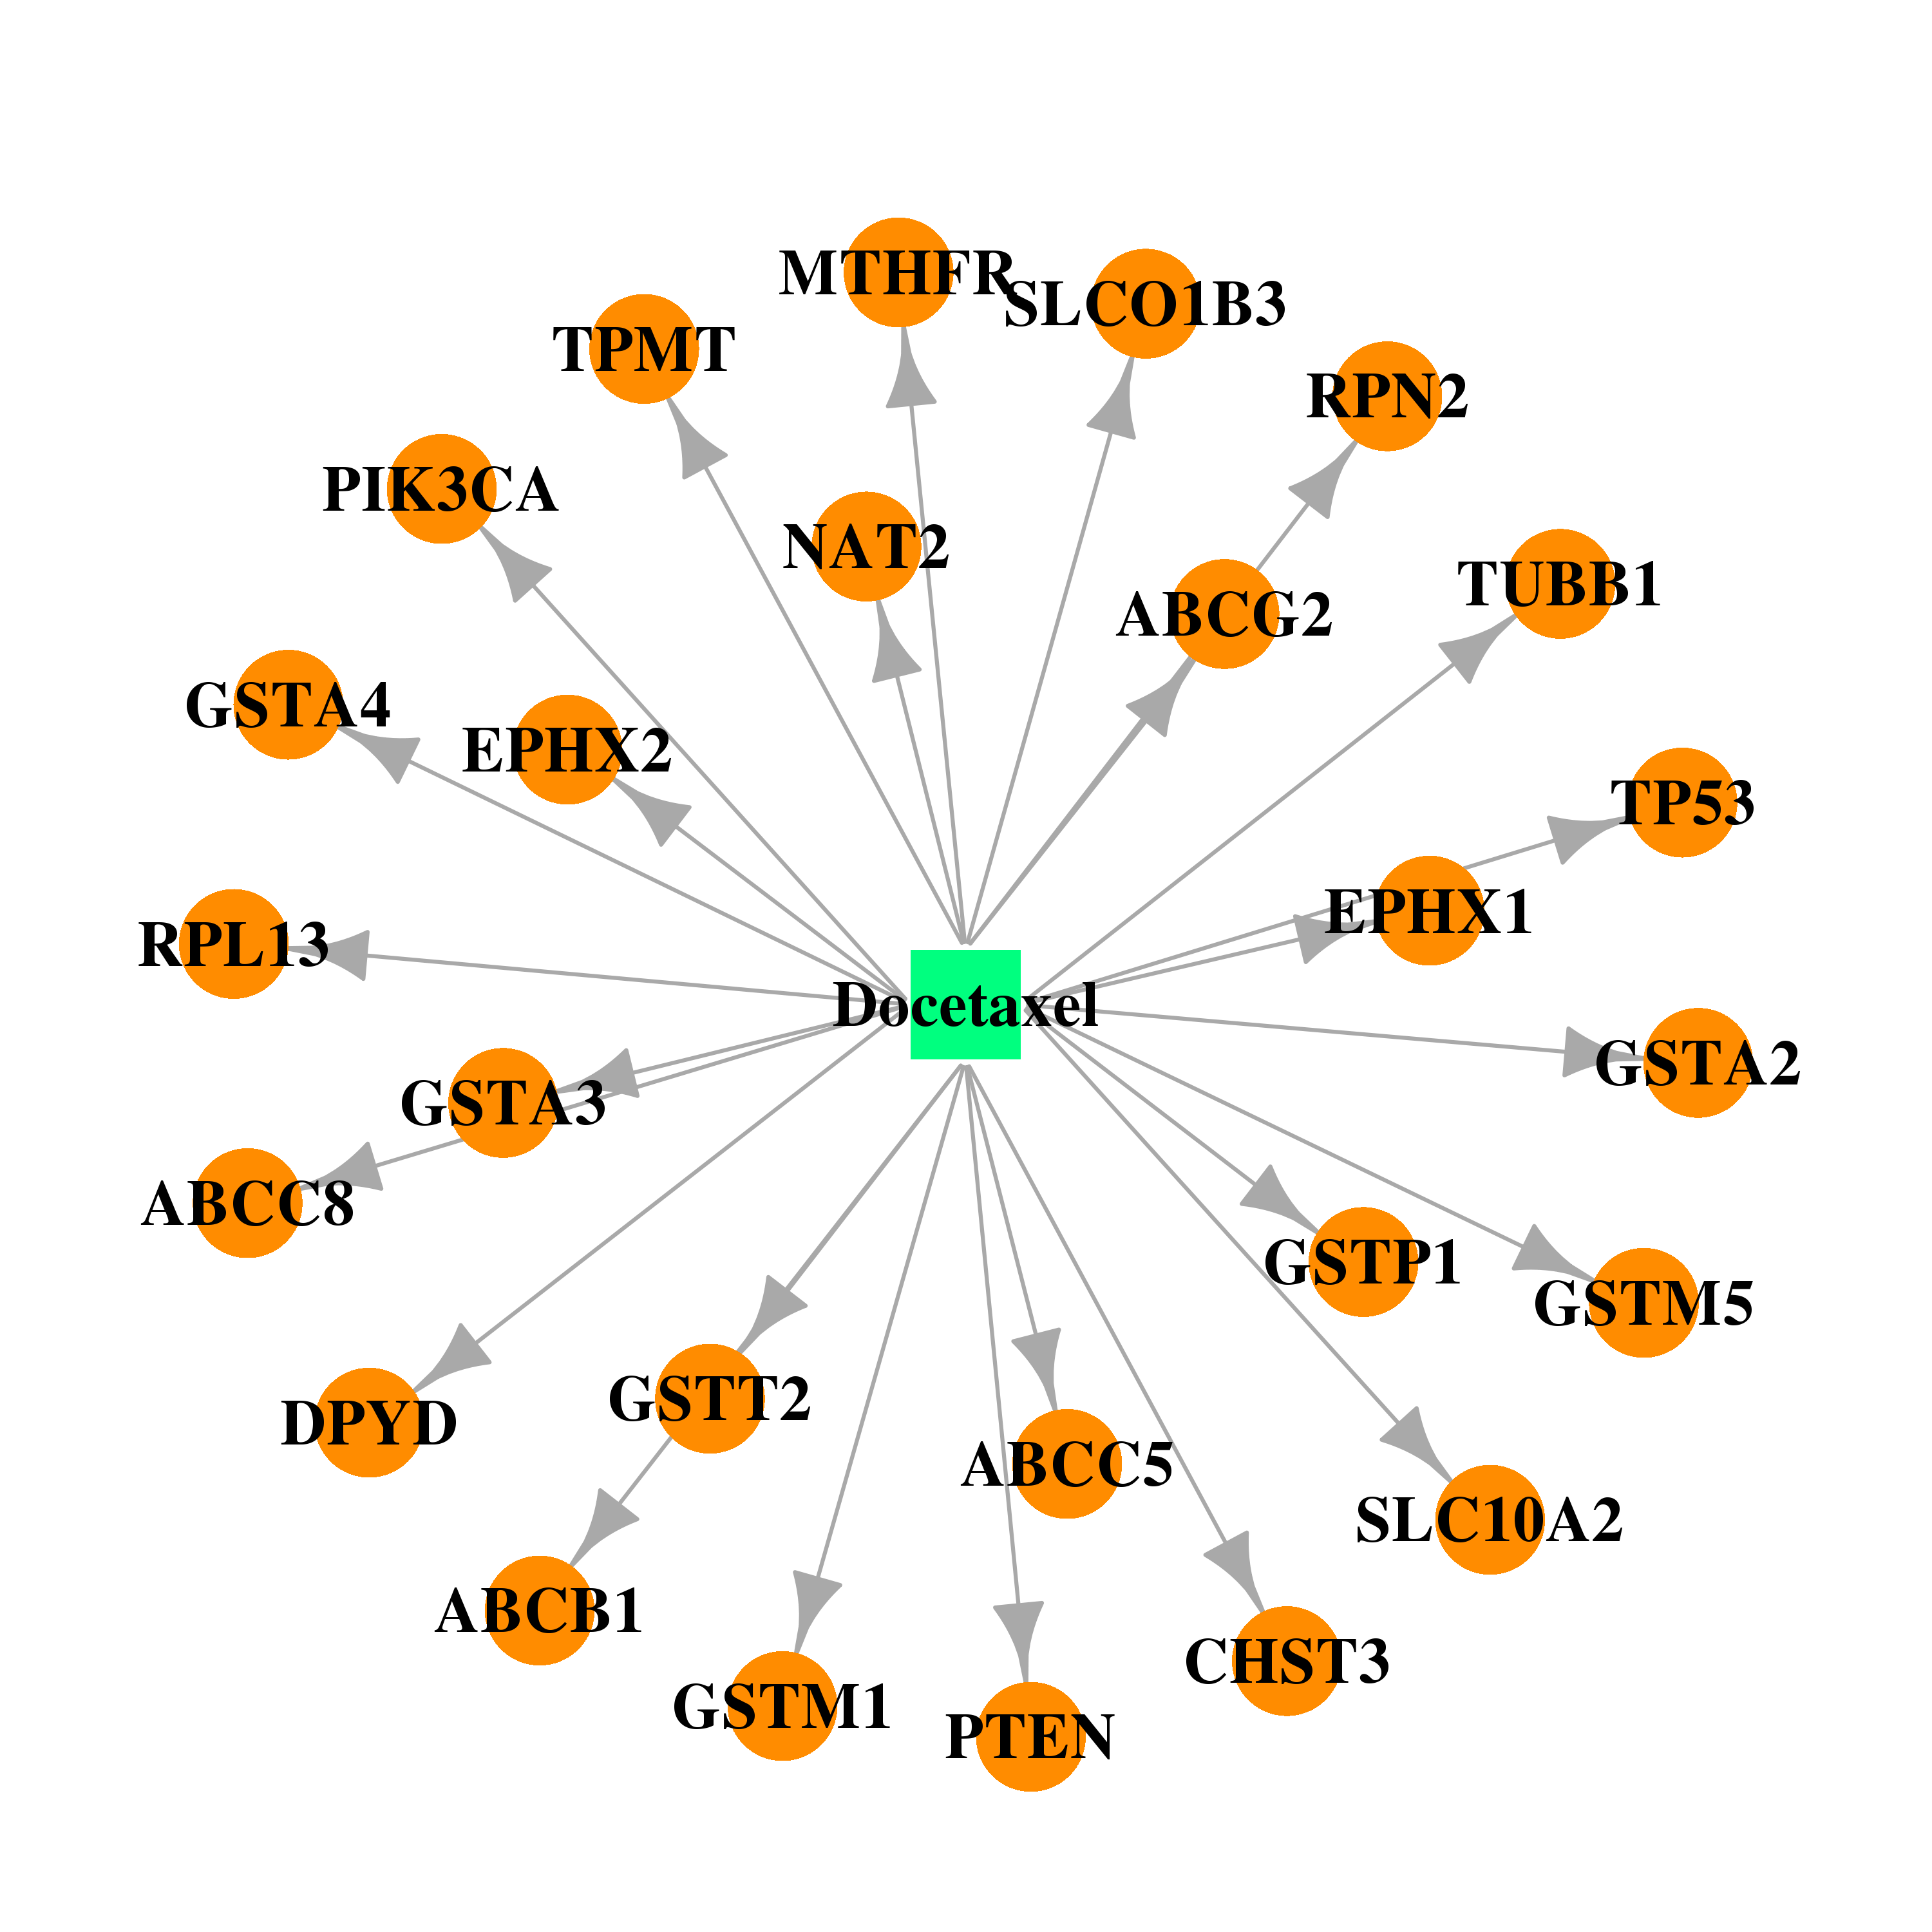 | 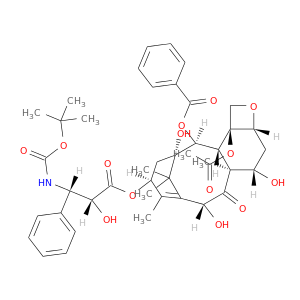 |
| DB01041 | N-acetyltransferase 2 (arylamine N-acetyltransferase) | approved; withdrawn; investigational | Thalidomide | 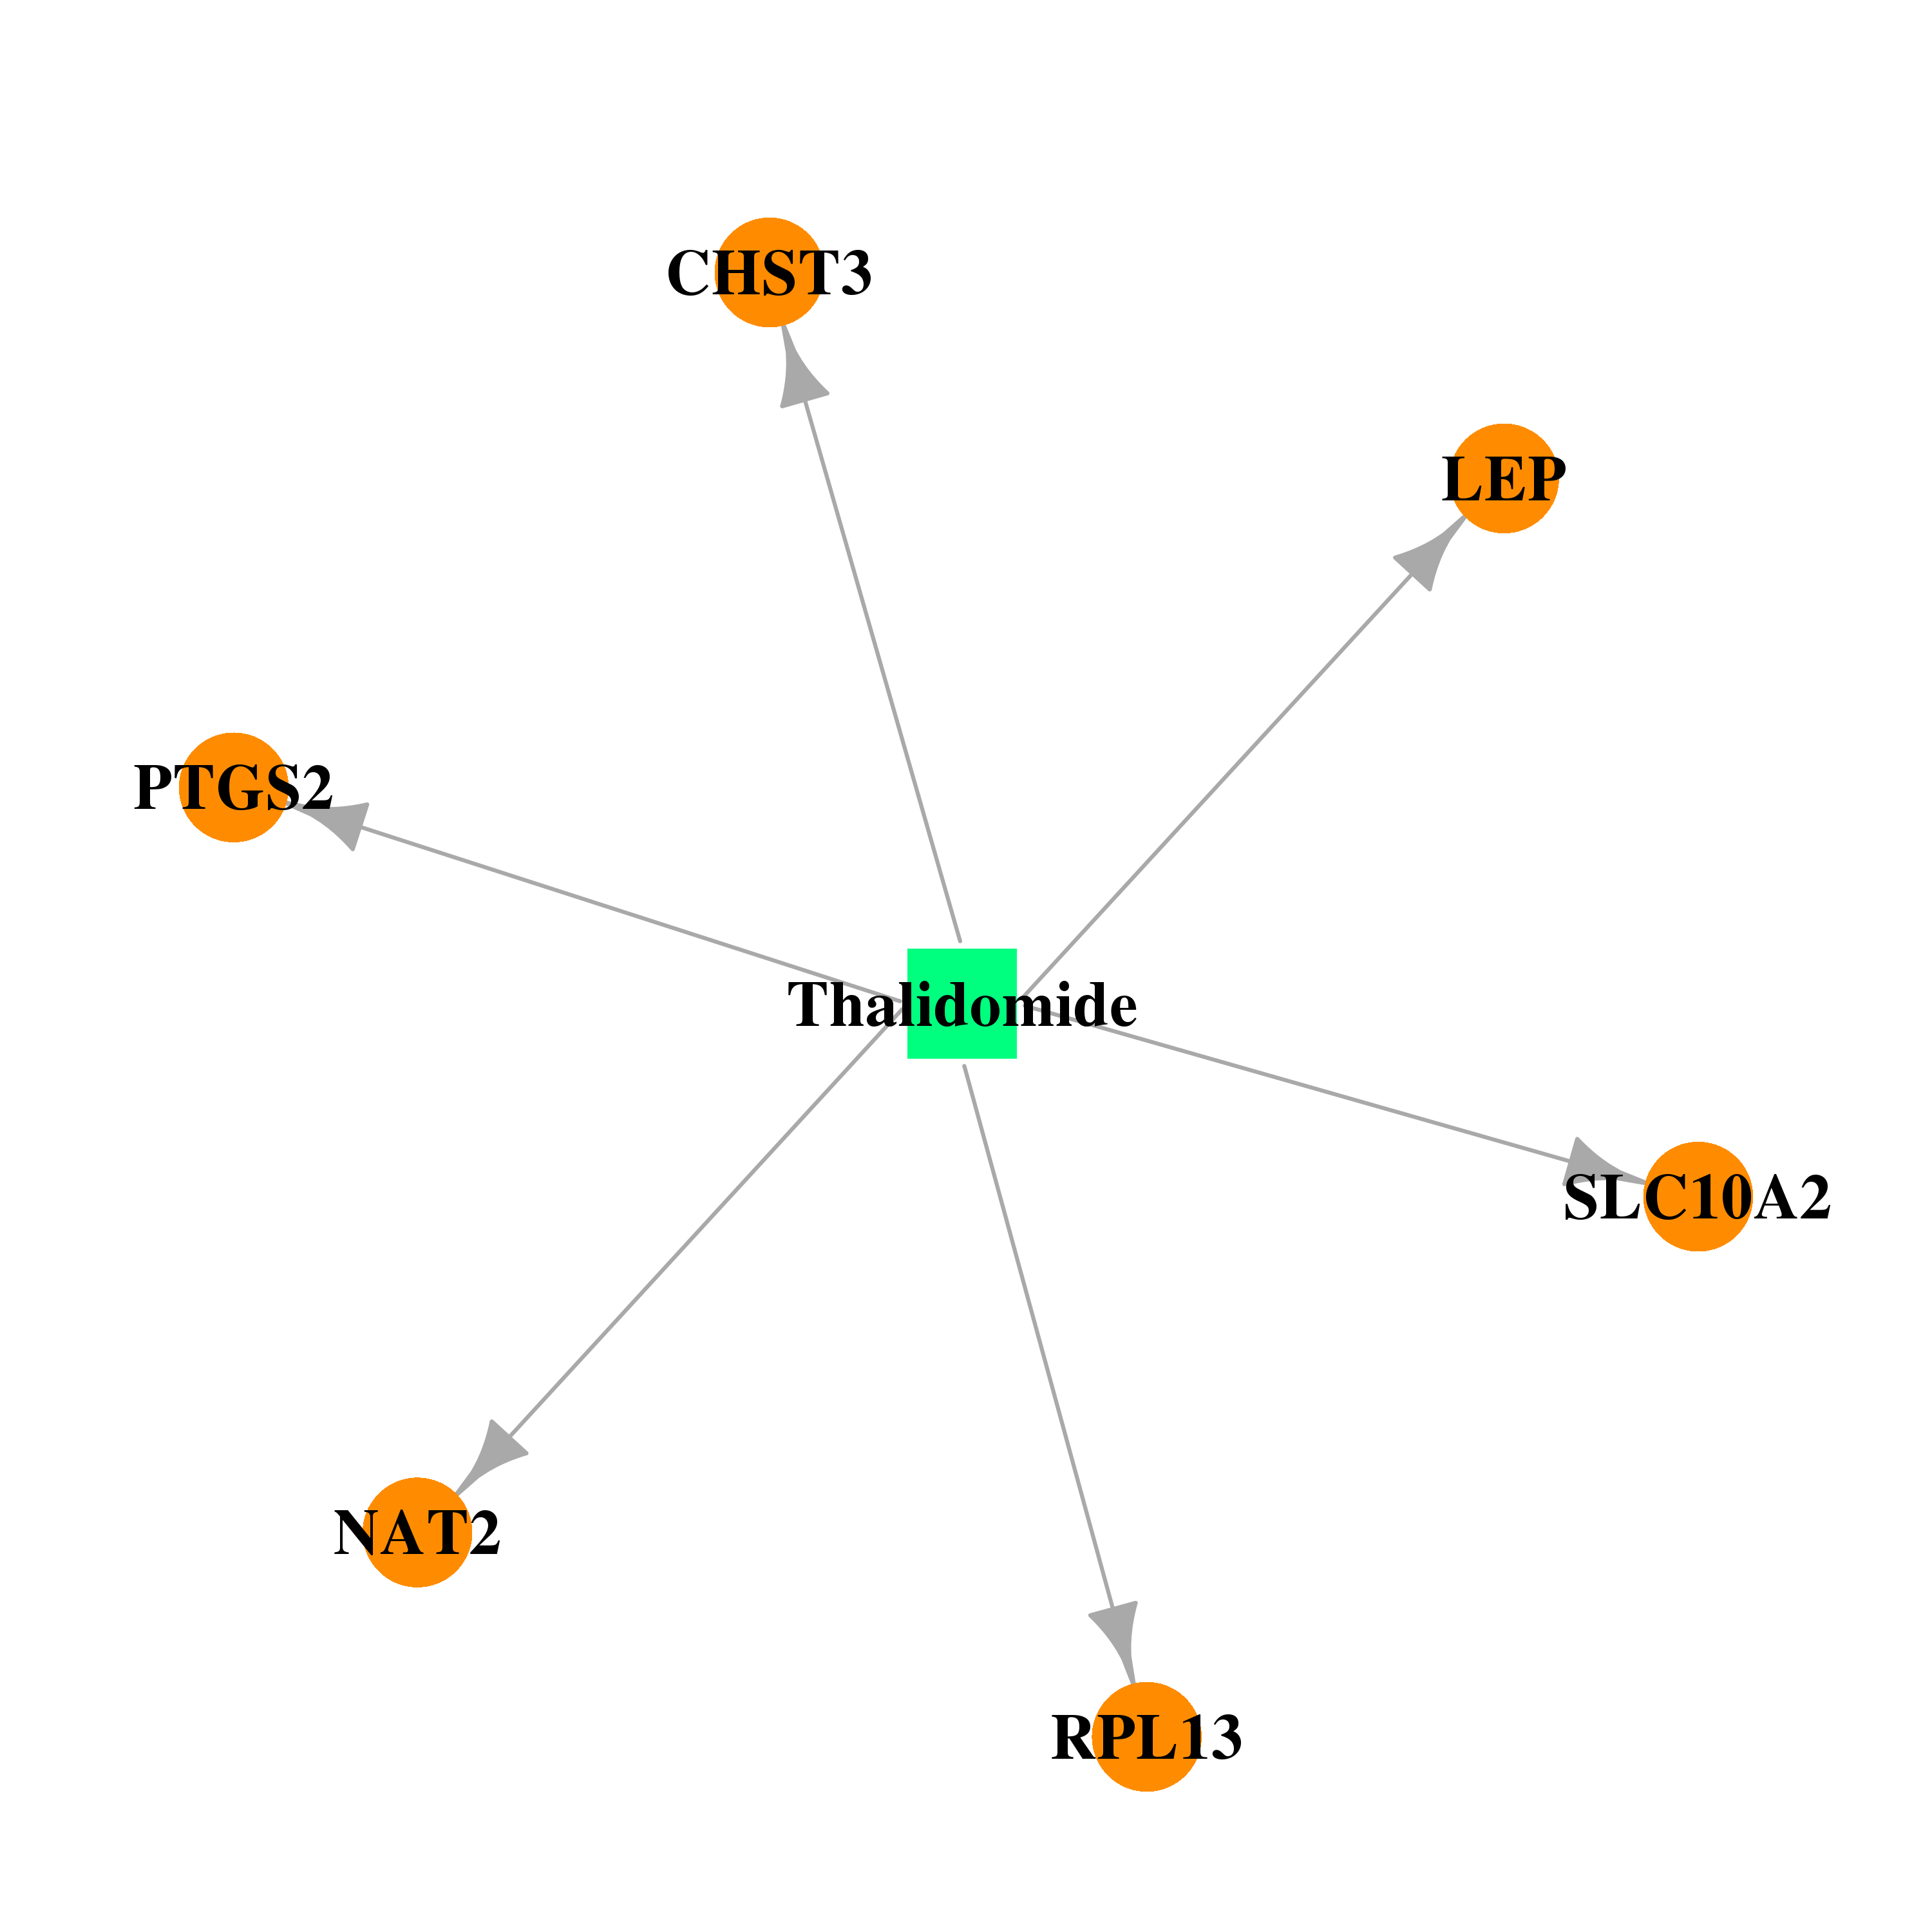 | 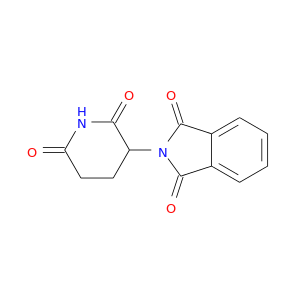 |
| DB00250 | N-acetyltransferase 2 (arylamine N-acetyltransferase) | approved; investigational | Dapsone | 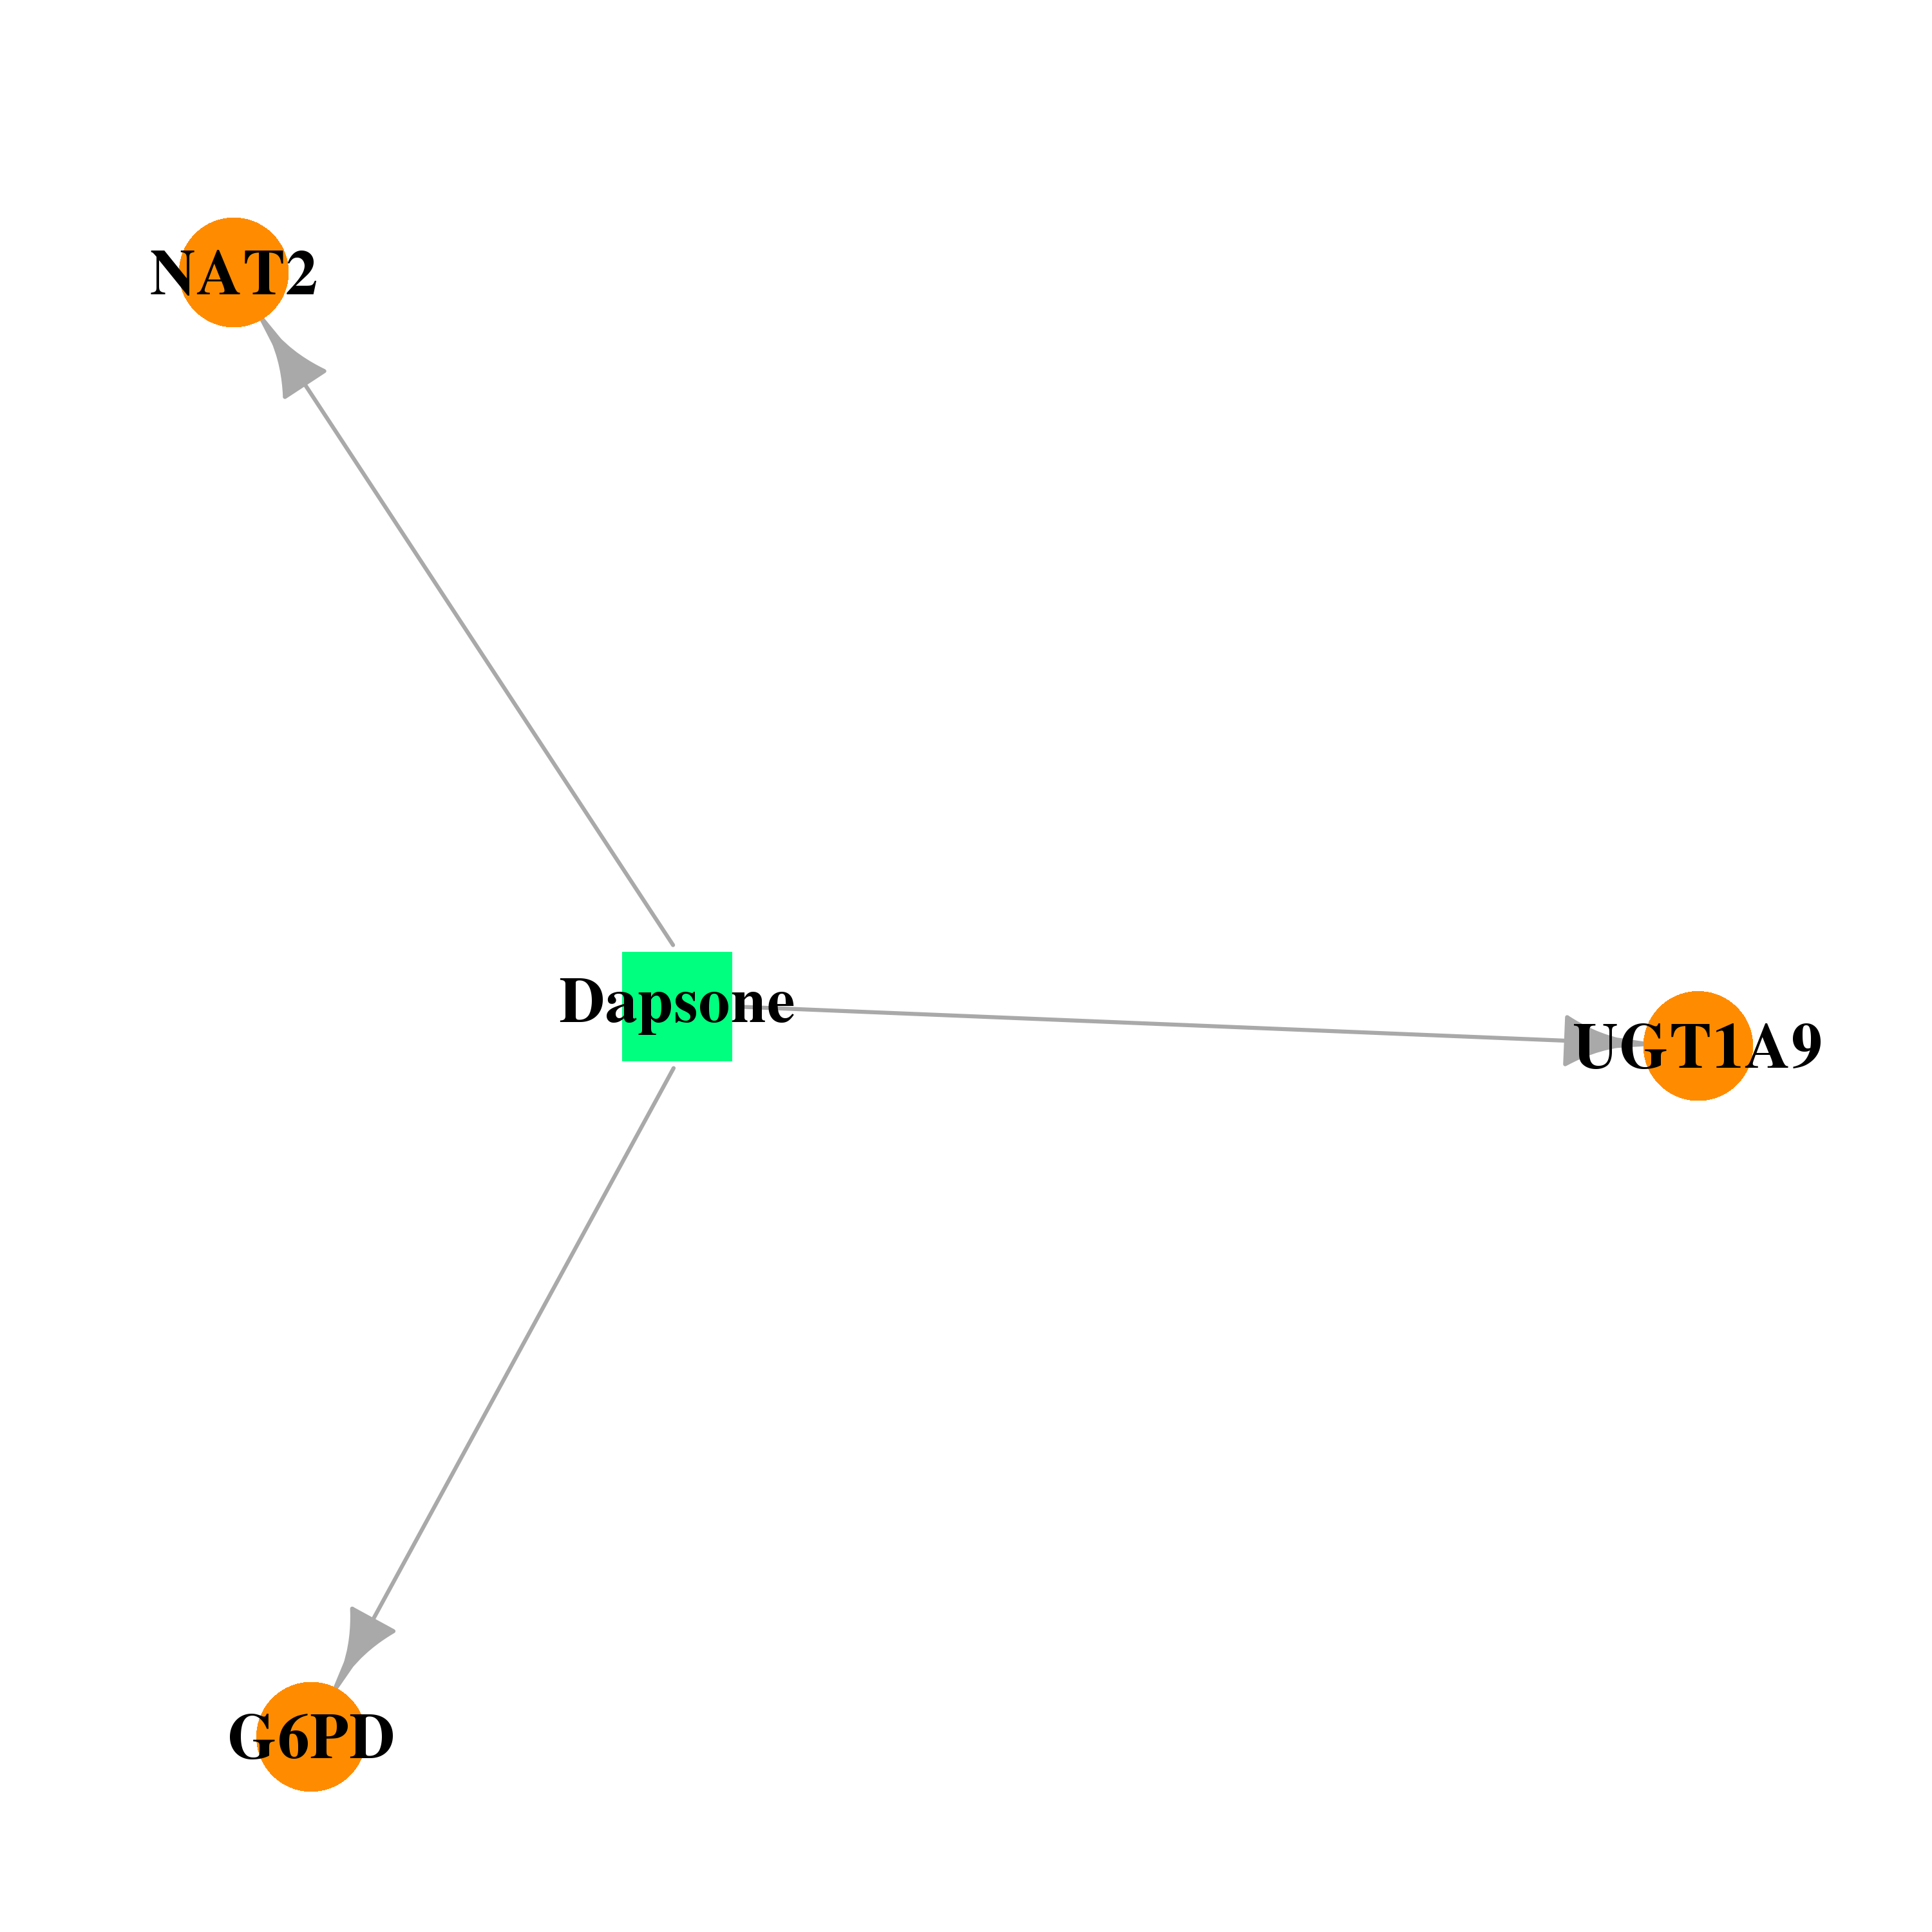 | 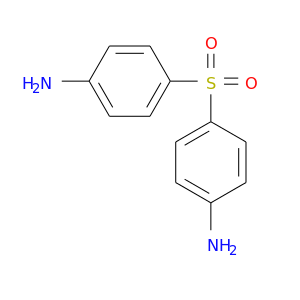 |
| DB01068 | N-acetyltransferase 2 (arylamine N-acetyltransferase) | illicit; approved | Clonazepam | 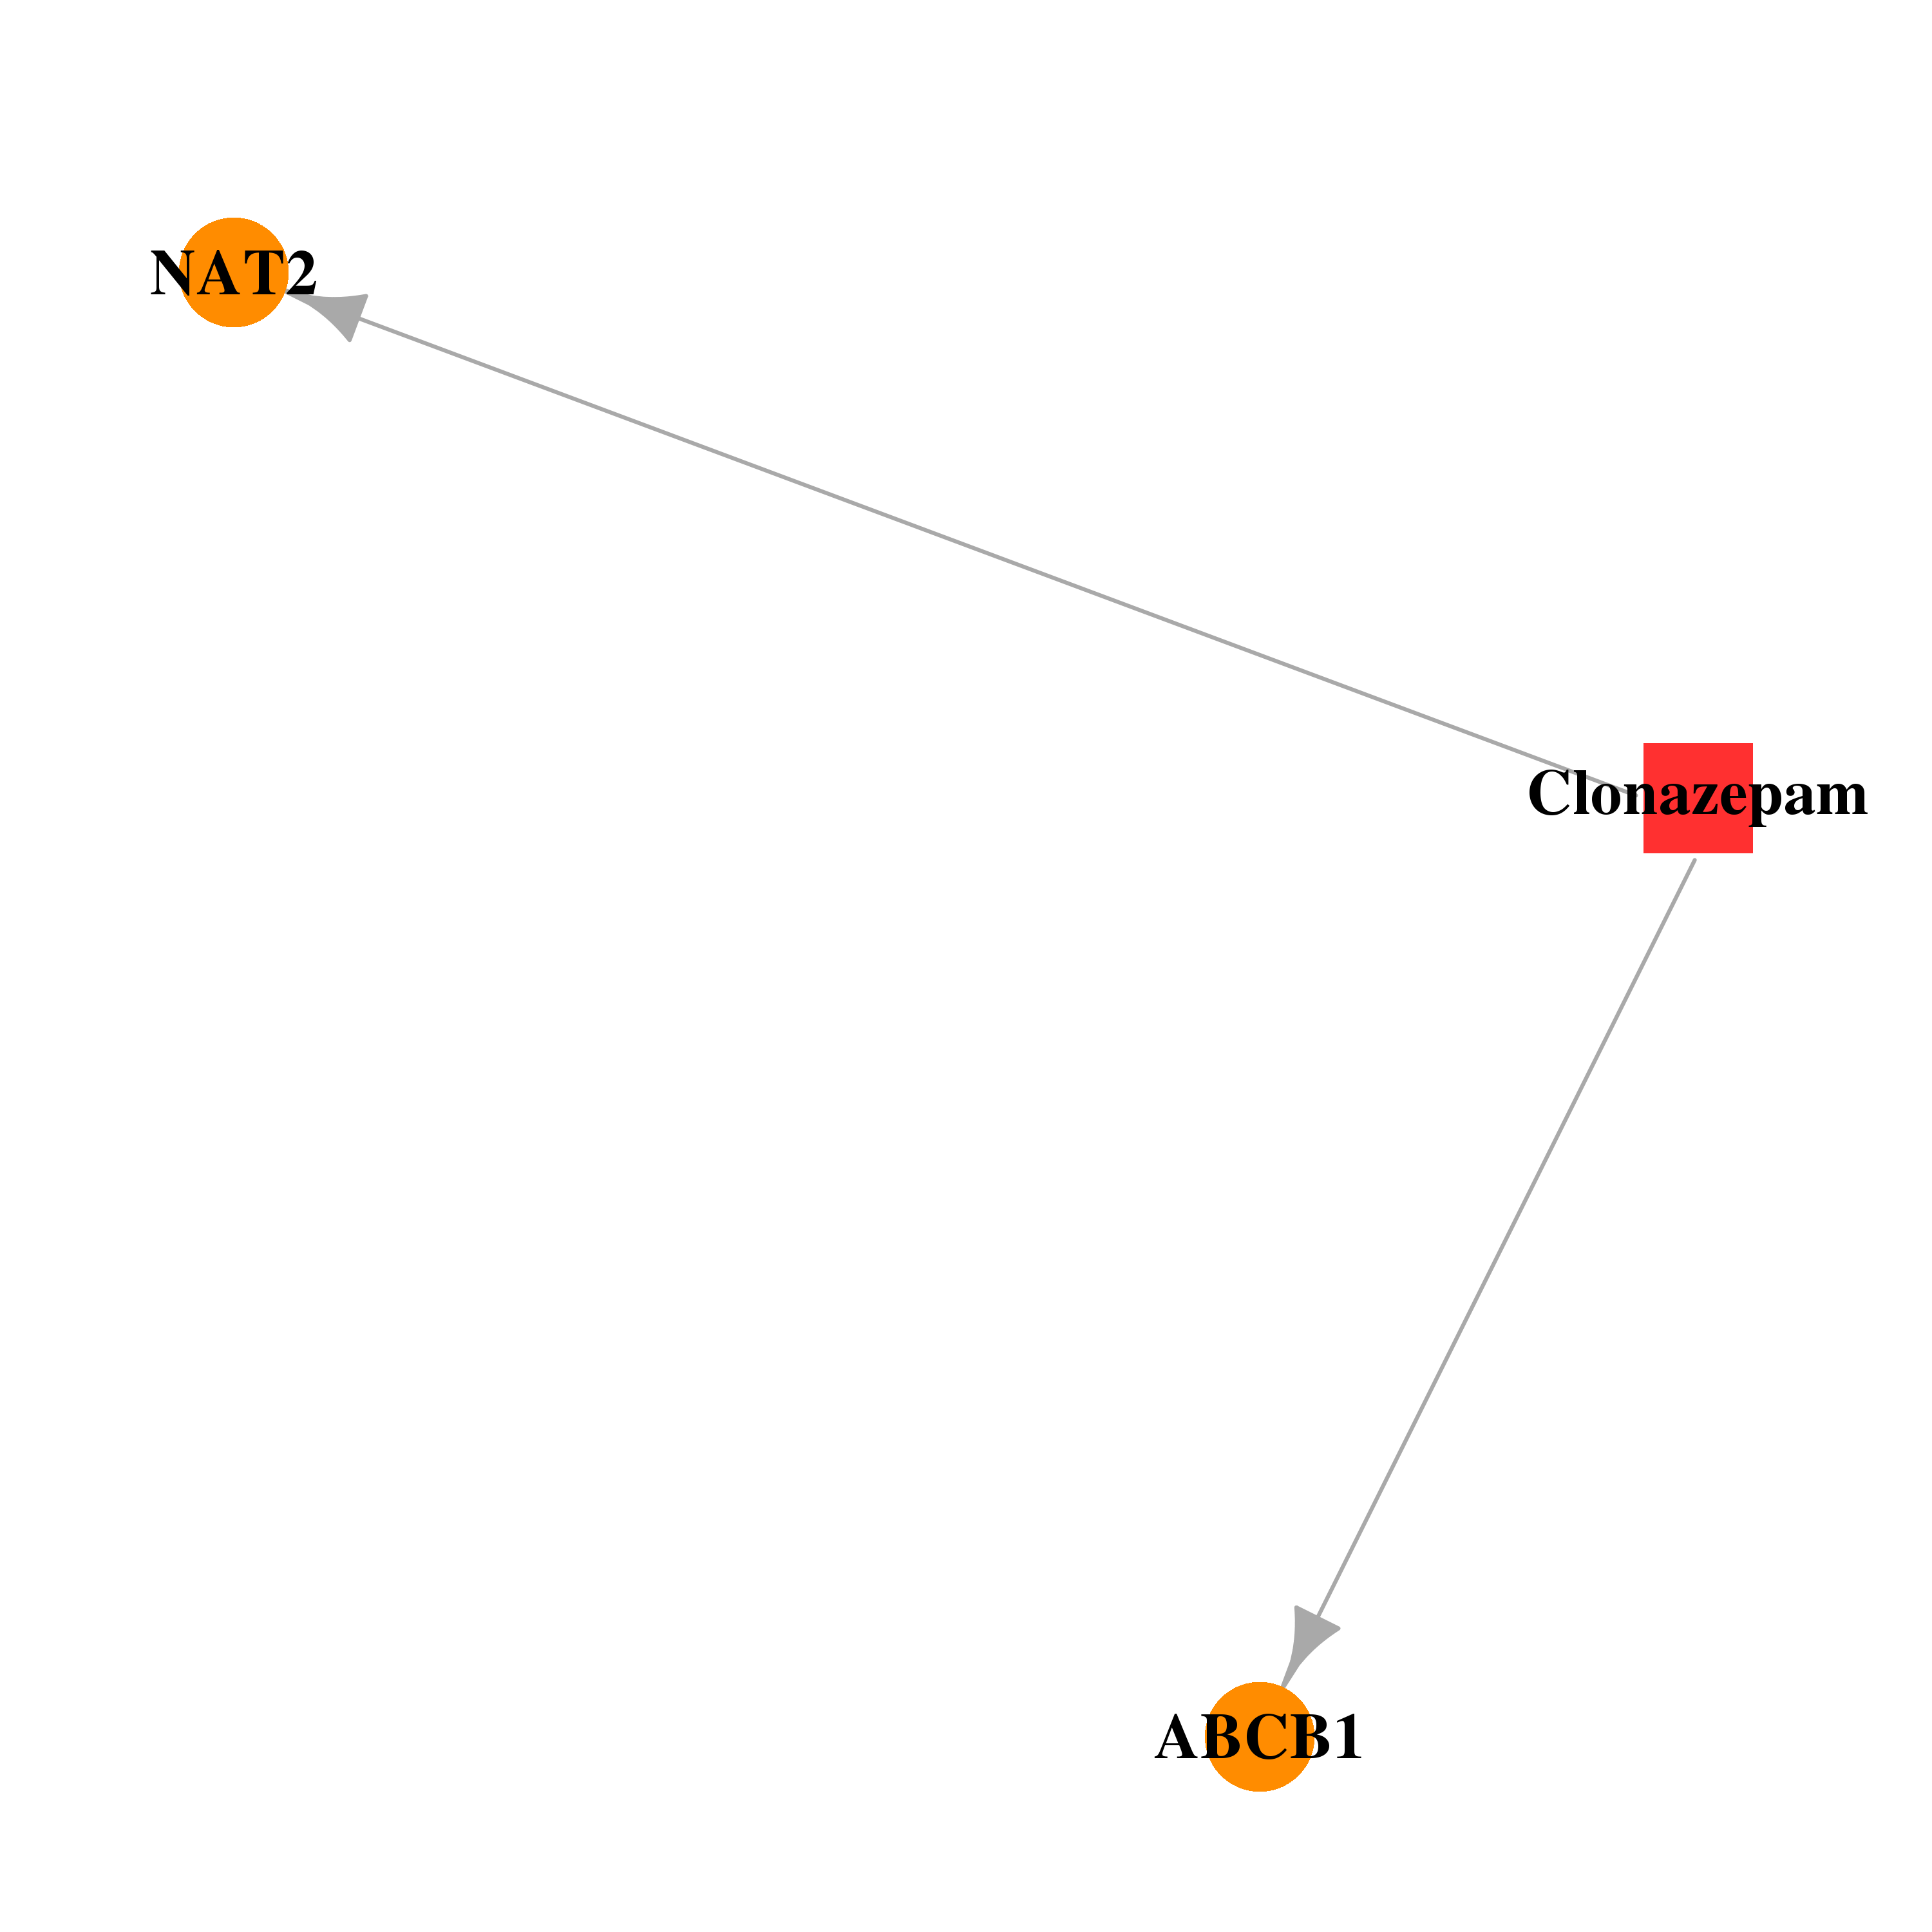 |  |
| DB00951 | N-acetyltransferase 2 (arylamine N-acetyltransferase) | approved | Isoniazid |  | 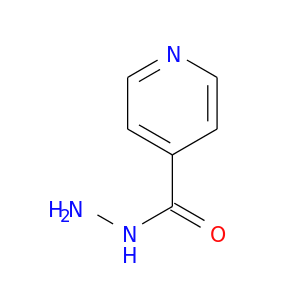 |
| DB00259 | N-acetyltransferase 2 (arylamine N-acetyltransferase) | approved | Sulfanilamide | 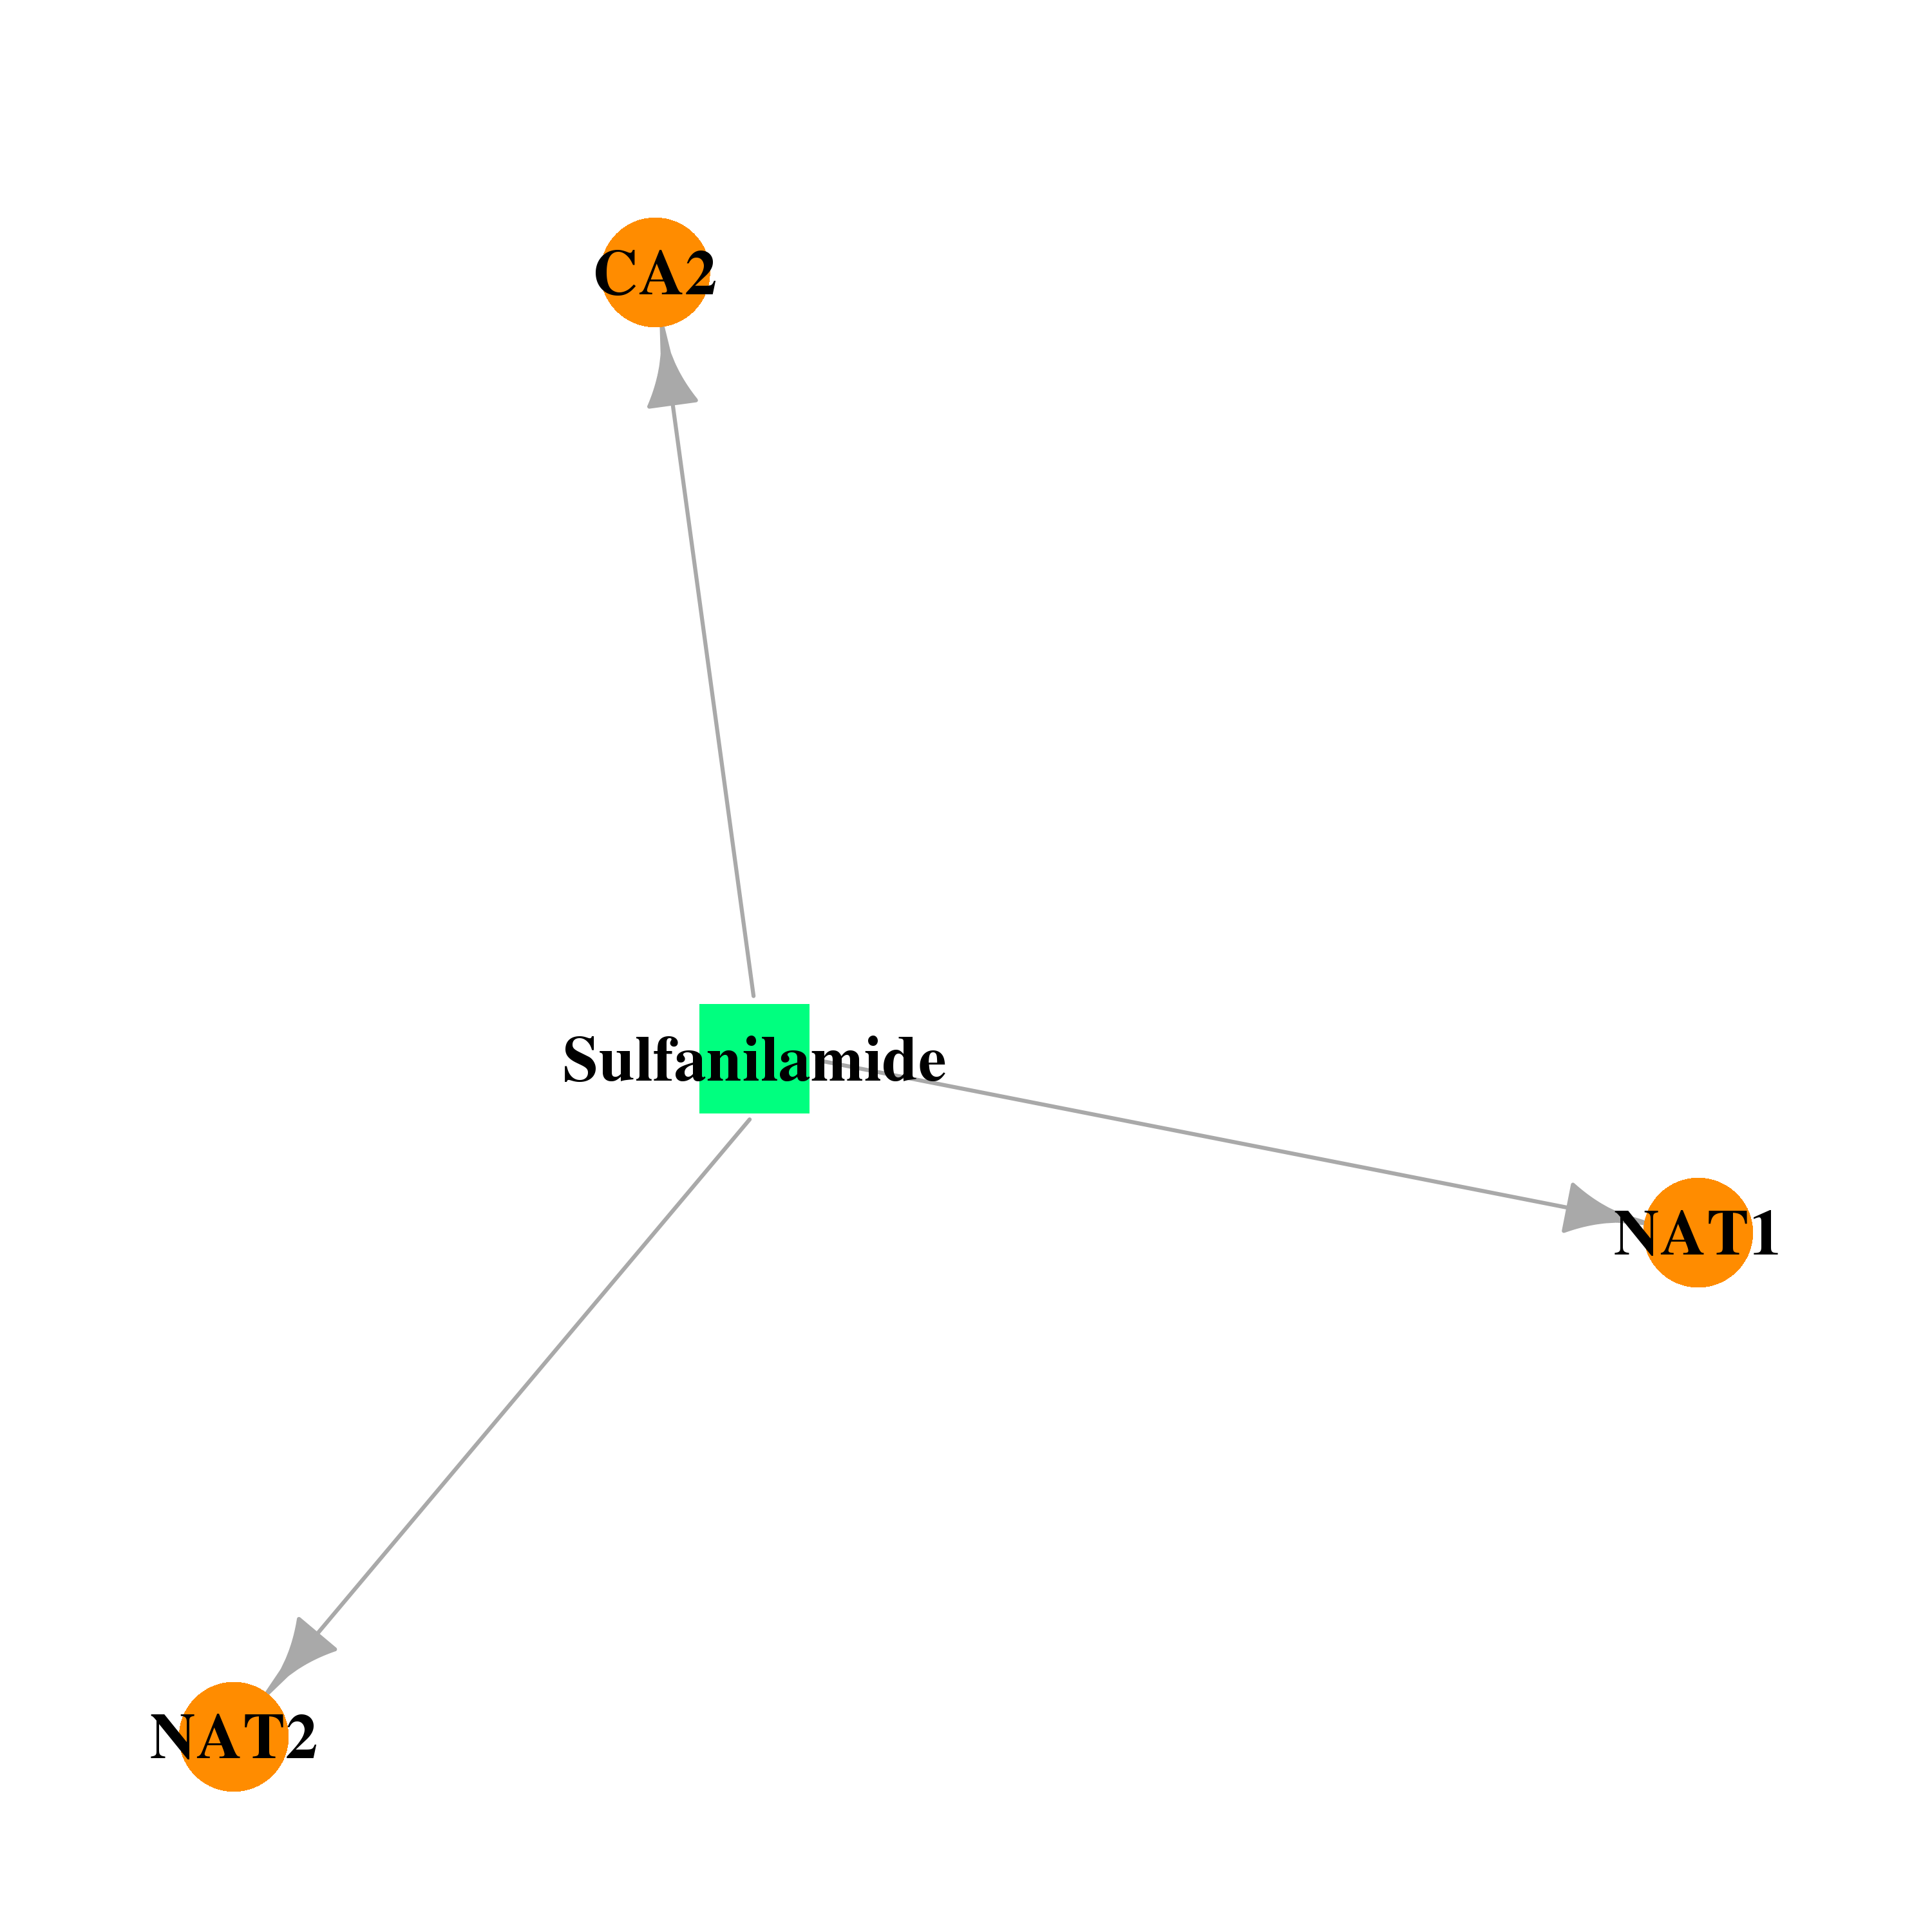 | 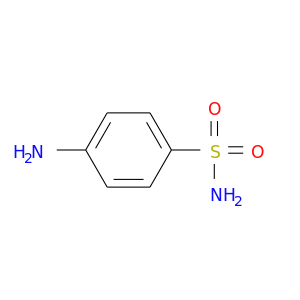 |
| DB00945 | N-acetyltransferase 2 (arylamine N-acetyltransferase) | approved | Acetylsalicylic acid | 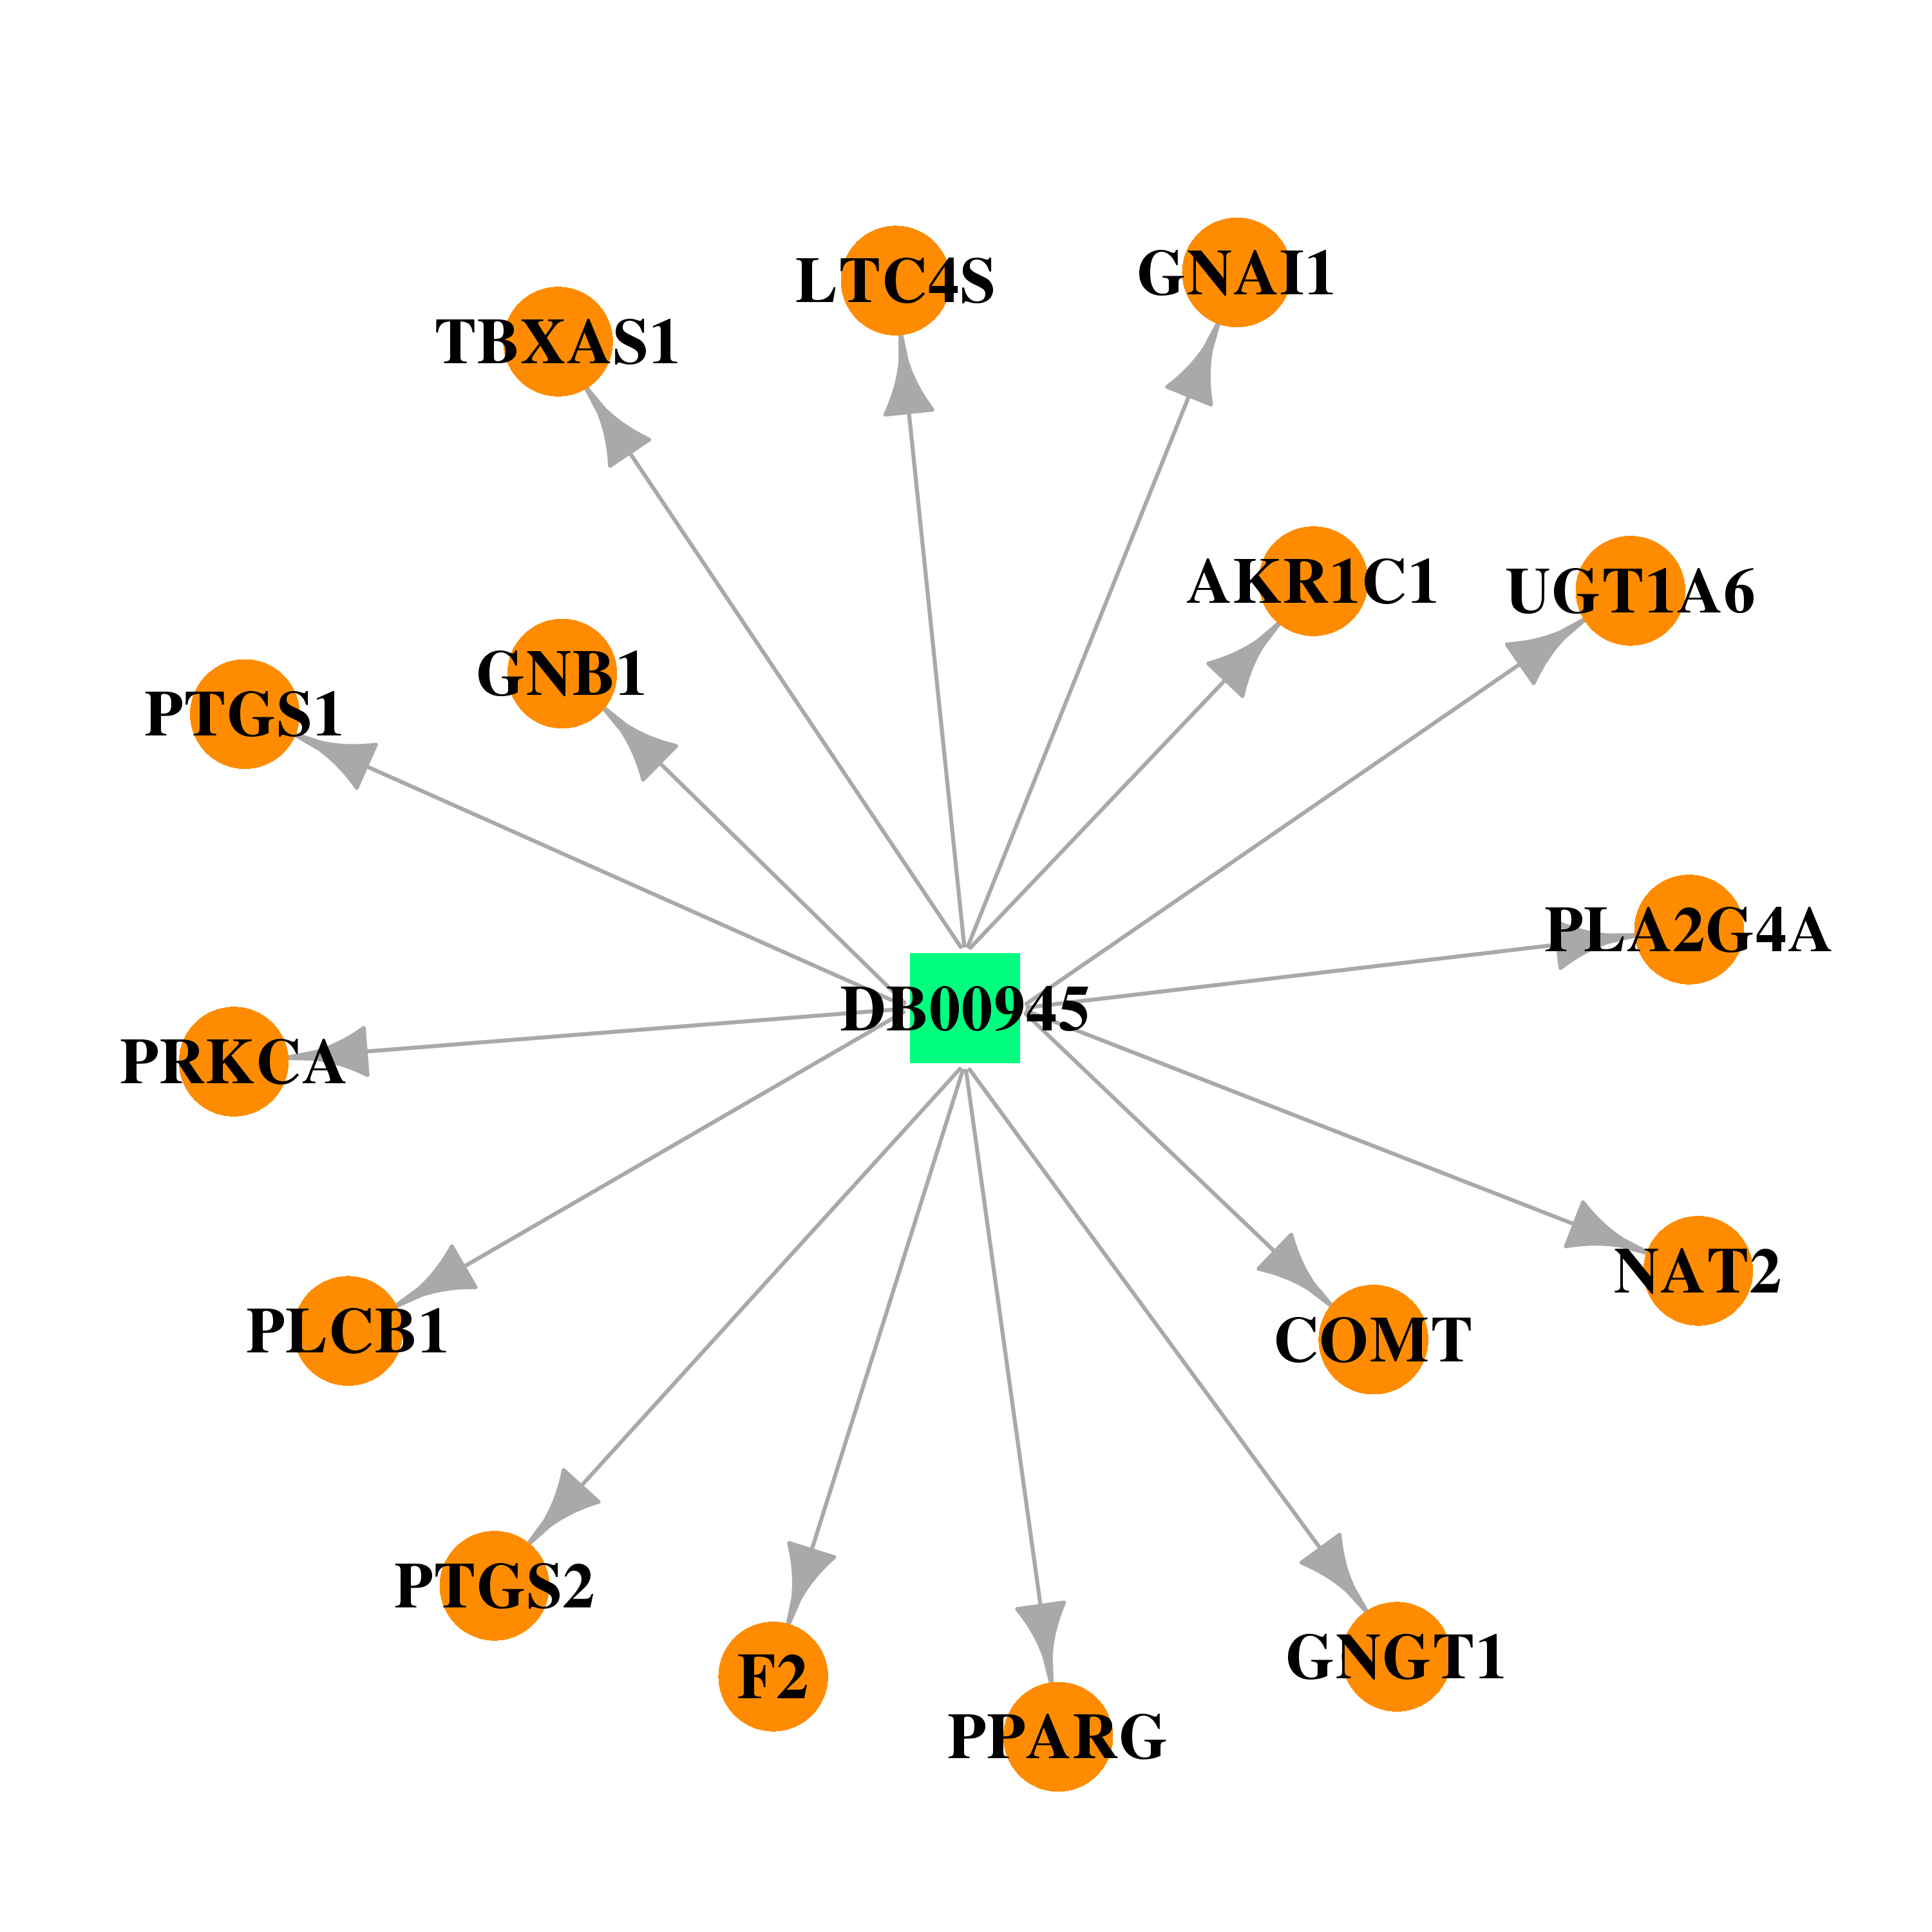 | 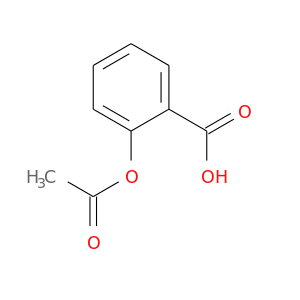 |
| DB00277 | N-acetyltransferase 2 (arylamine N-acetyltransferase) | approved | Theophylline | 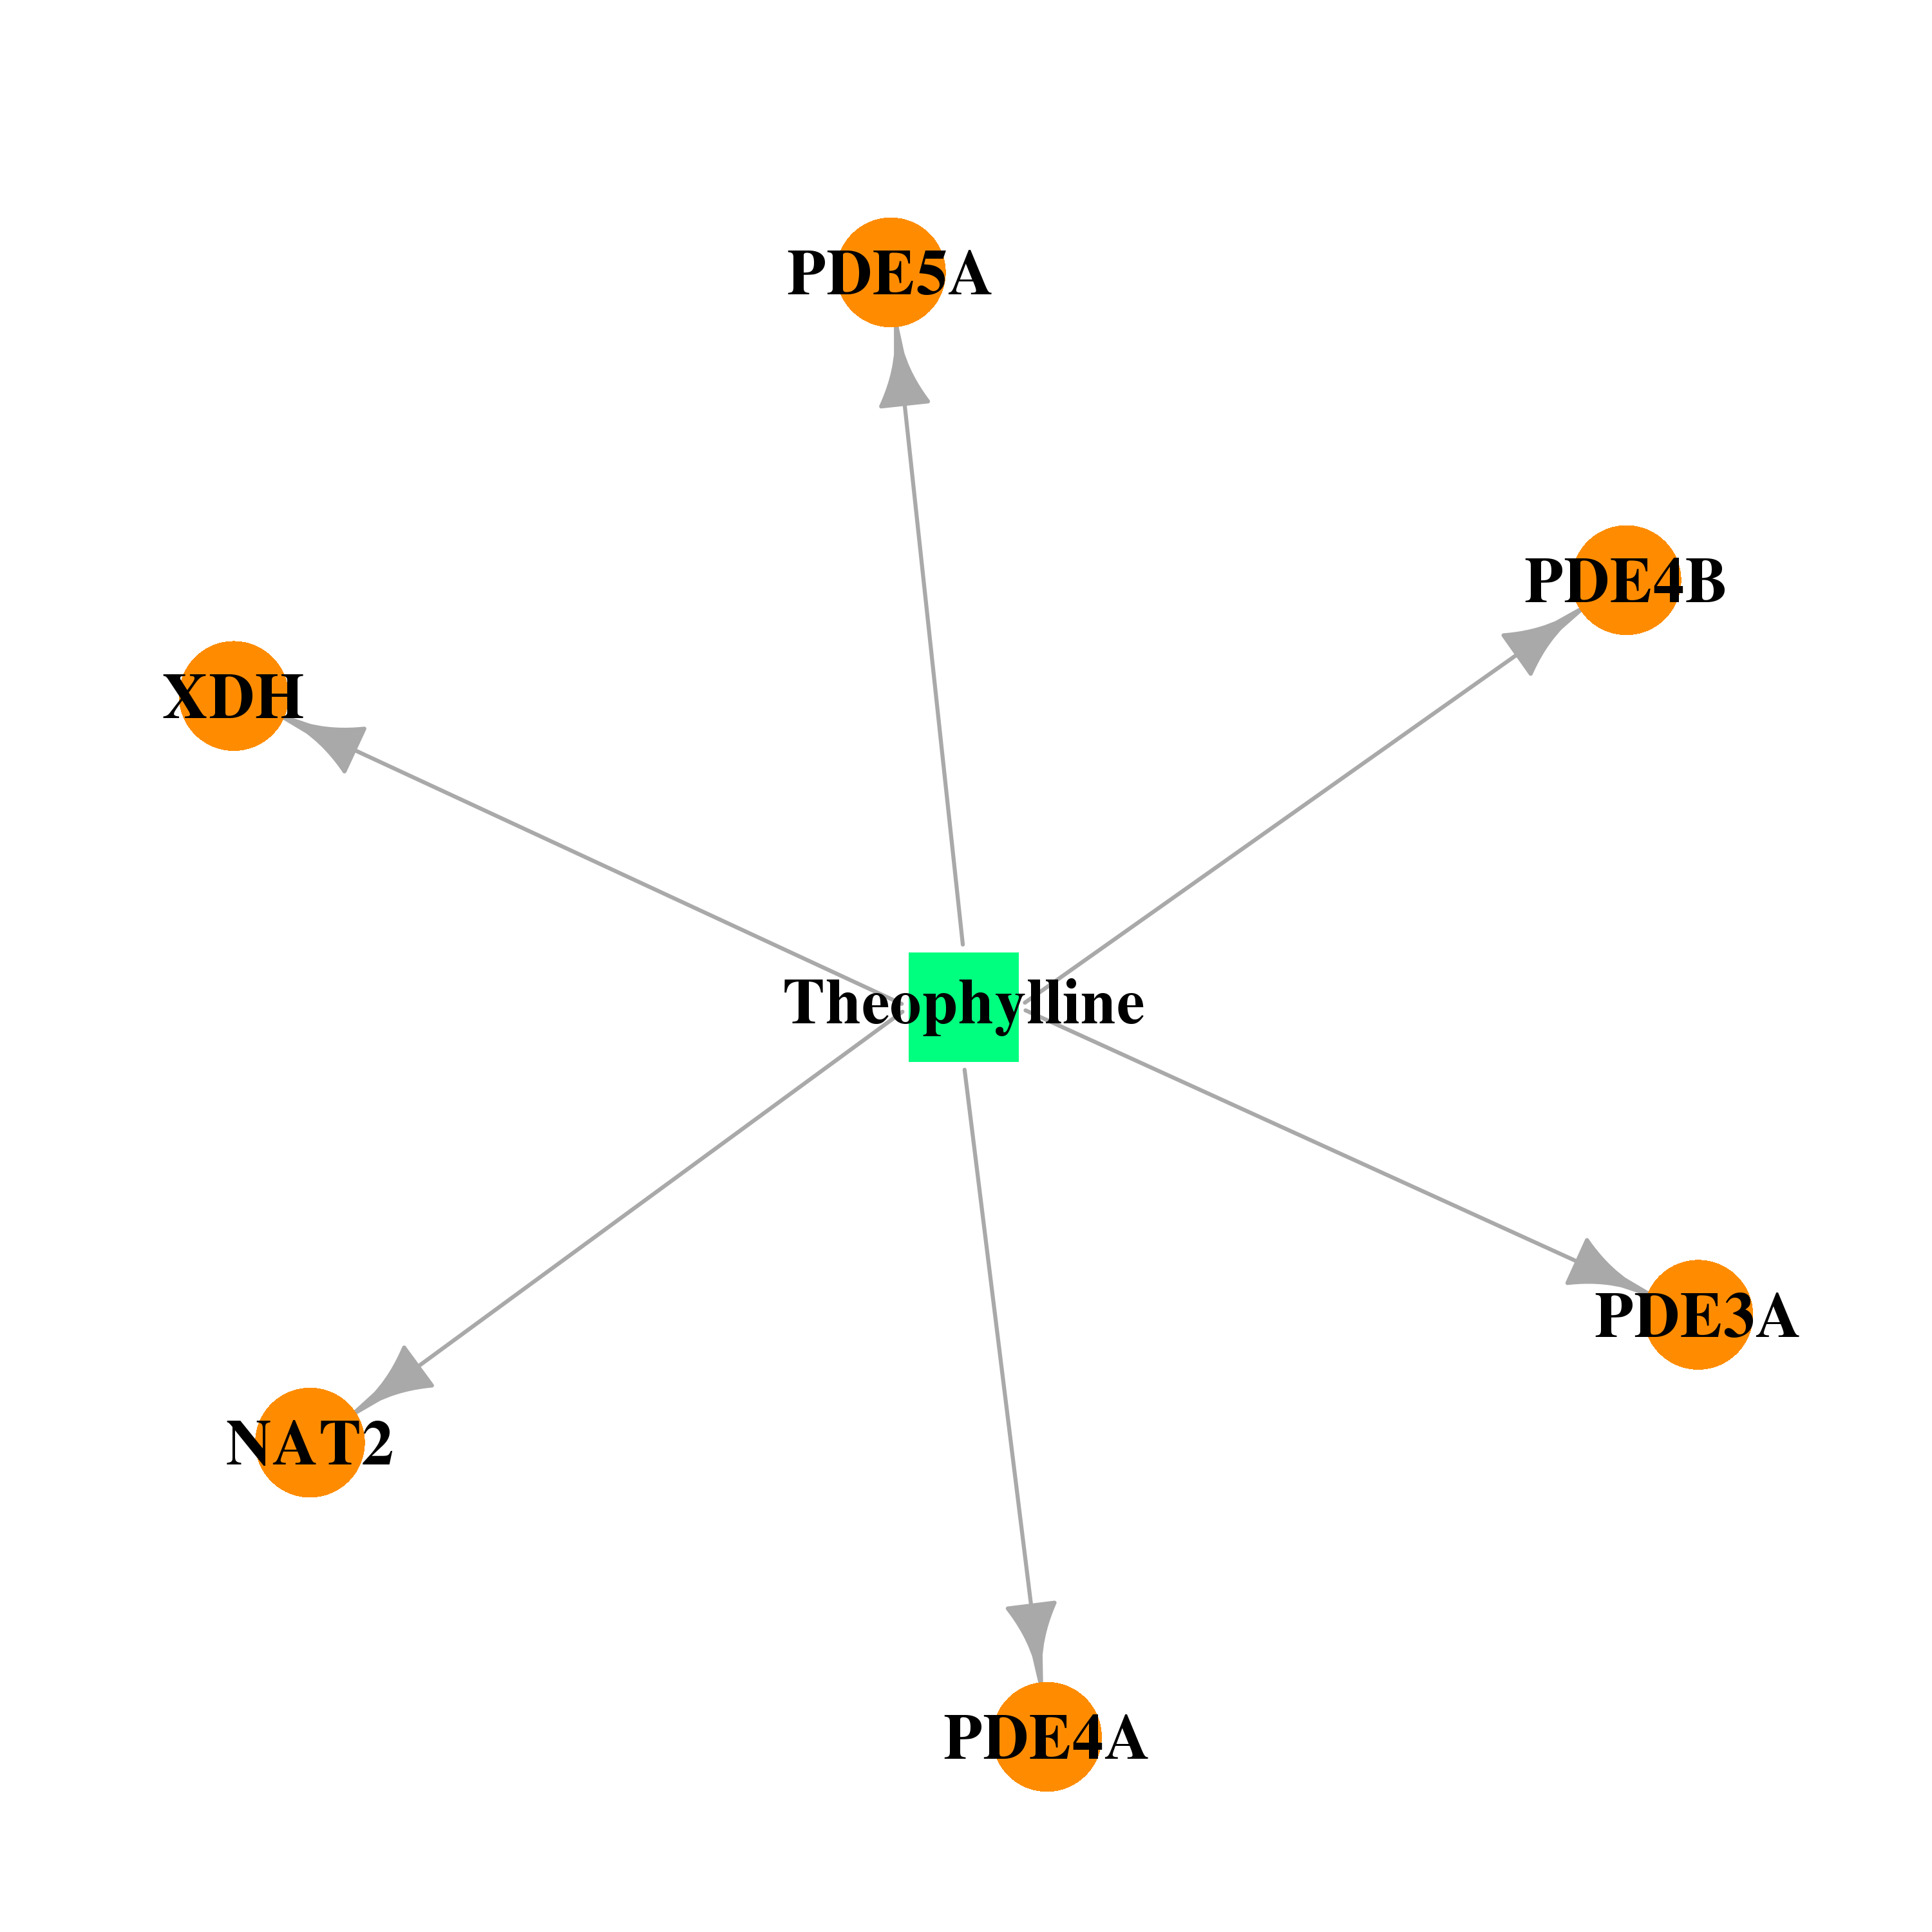 |  |
| DB00898 | N-acetyltransferase 2 (arylamine N-acetyltransferase) | approved | Ethanol | 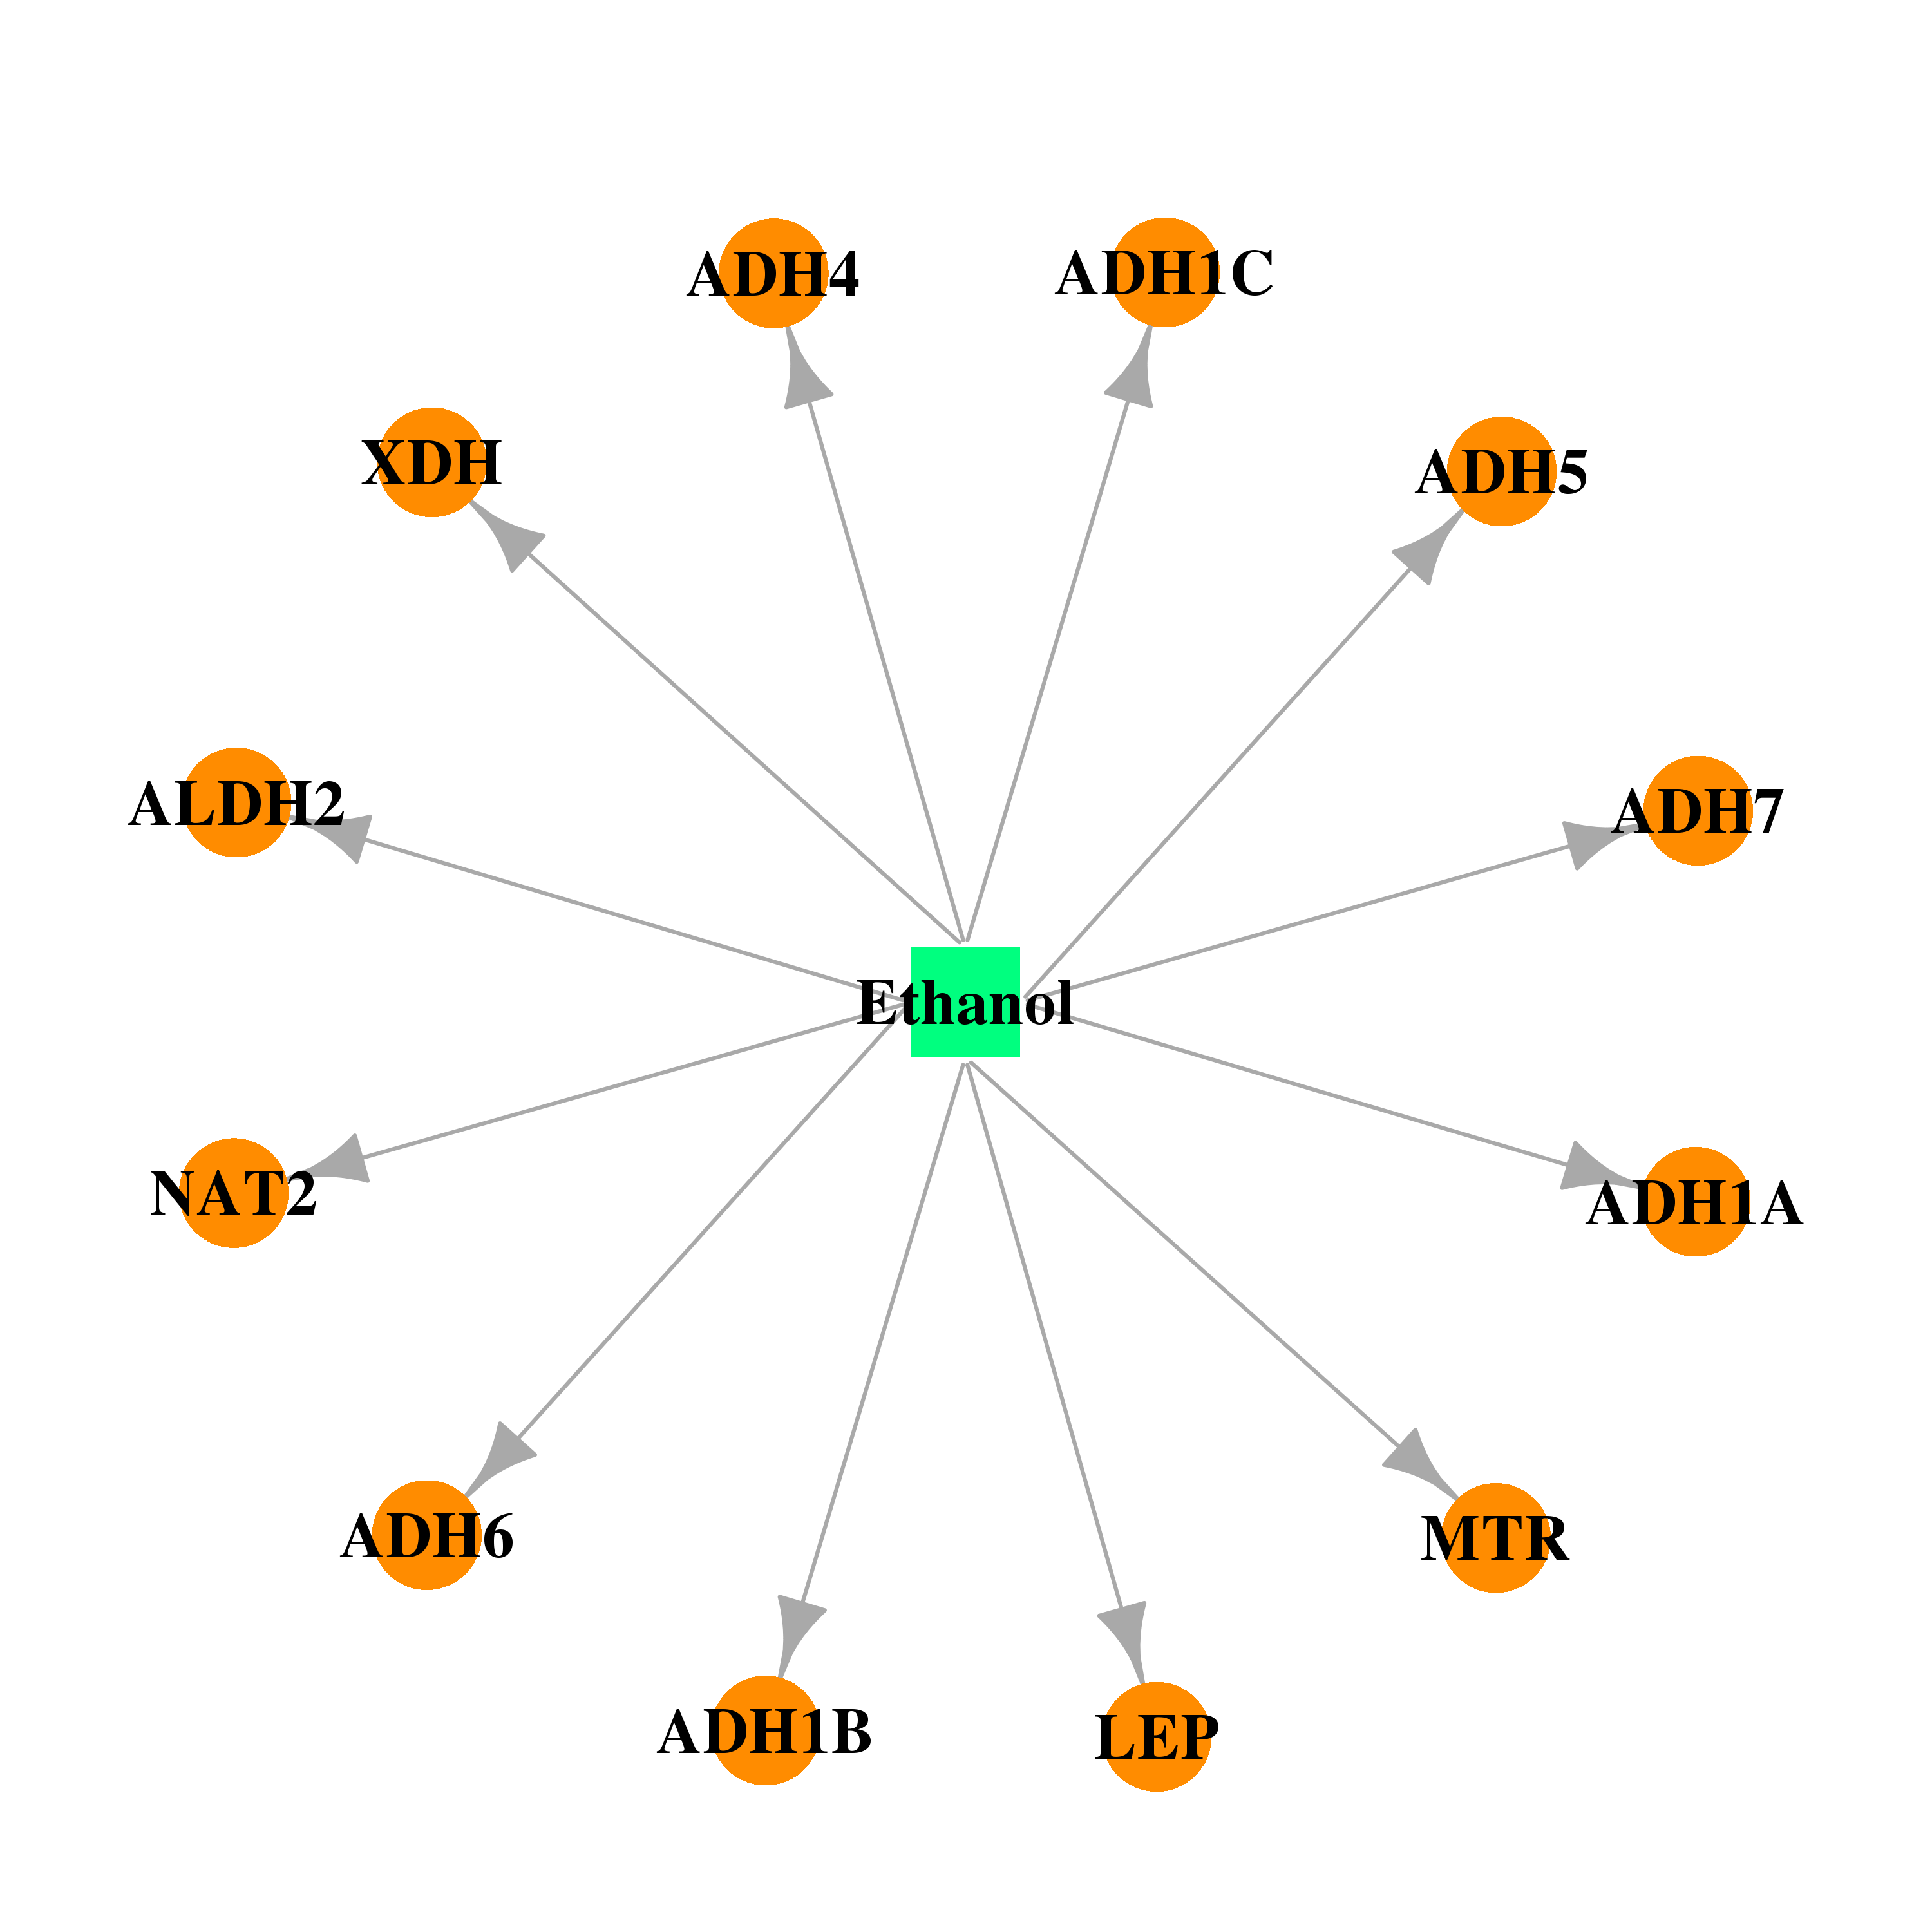 |  |
| DB01412 | N-acetyltransferase 2 (arylamine N-acetyltransferase) | approved | Theobromine | 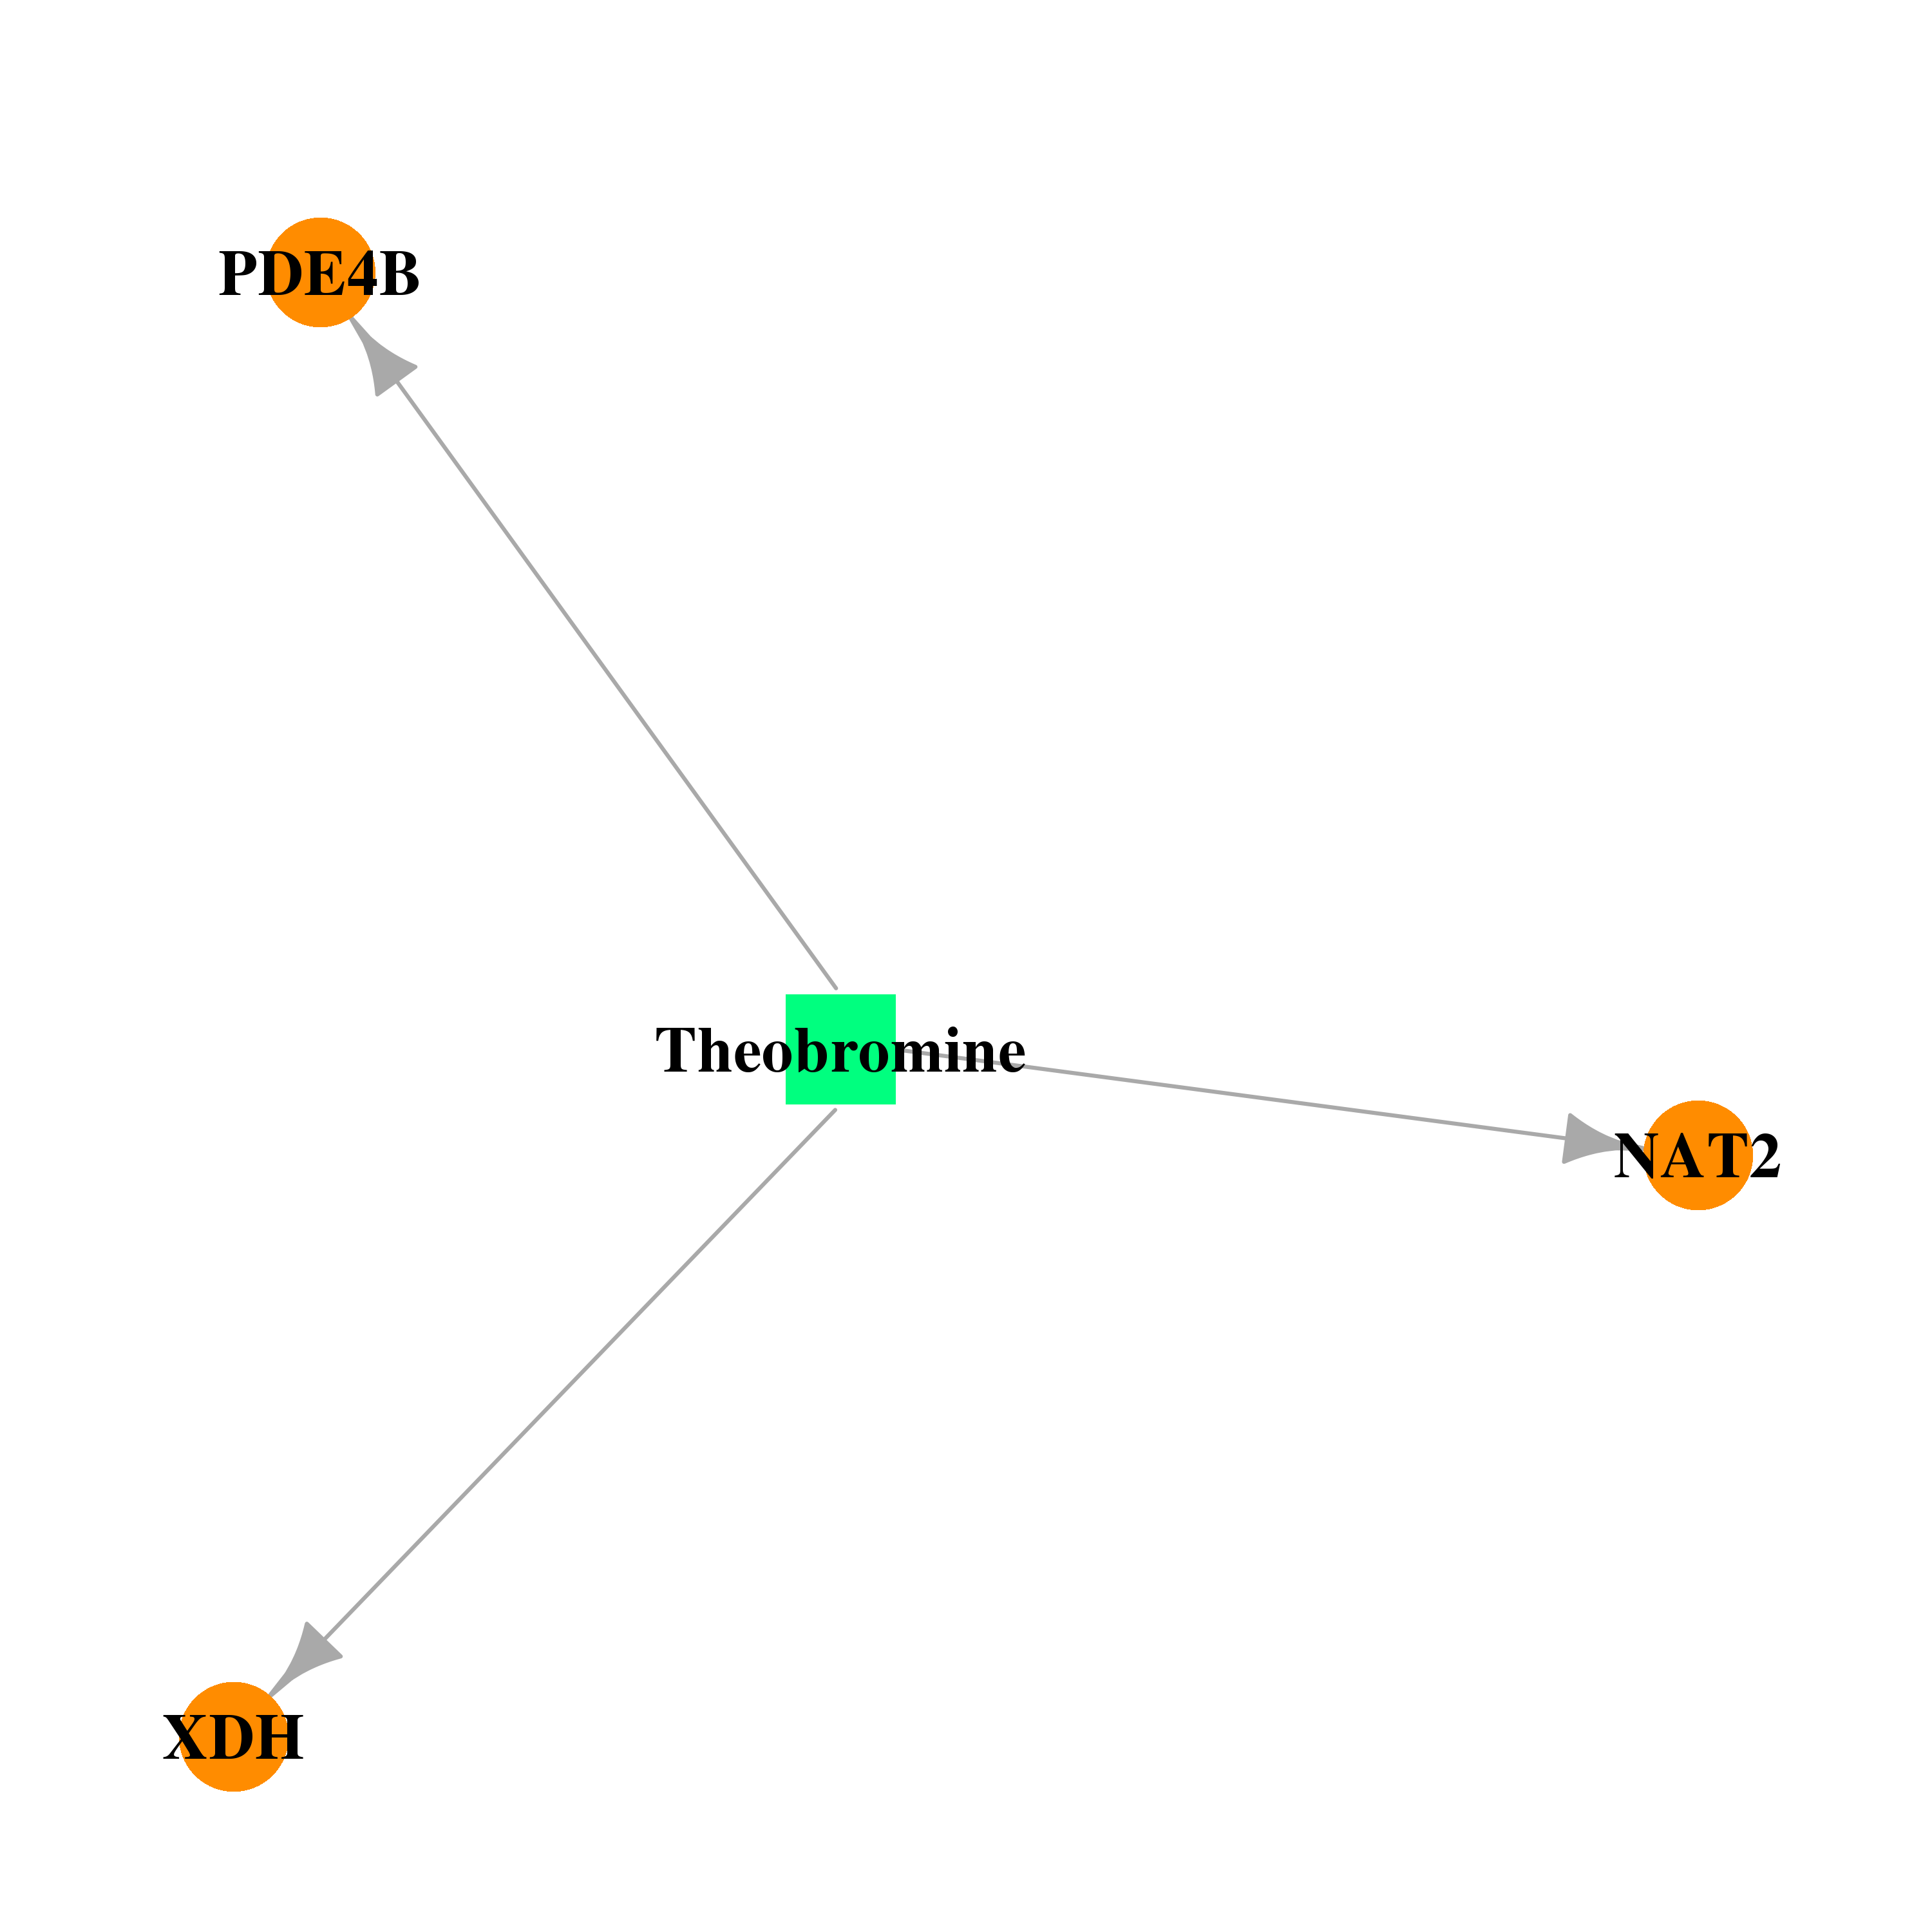 |  |
| DB00286 | N-acetyltransferase 2 (arylamine N-acetyltransferase) | approved | Conjugated Estrogens | 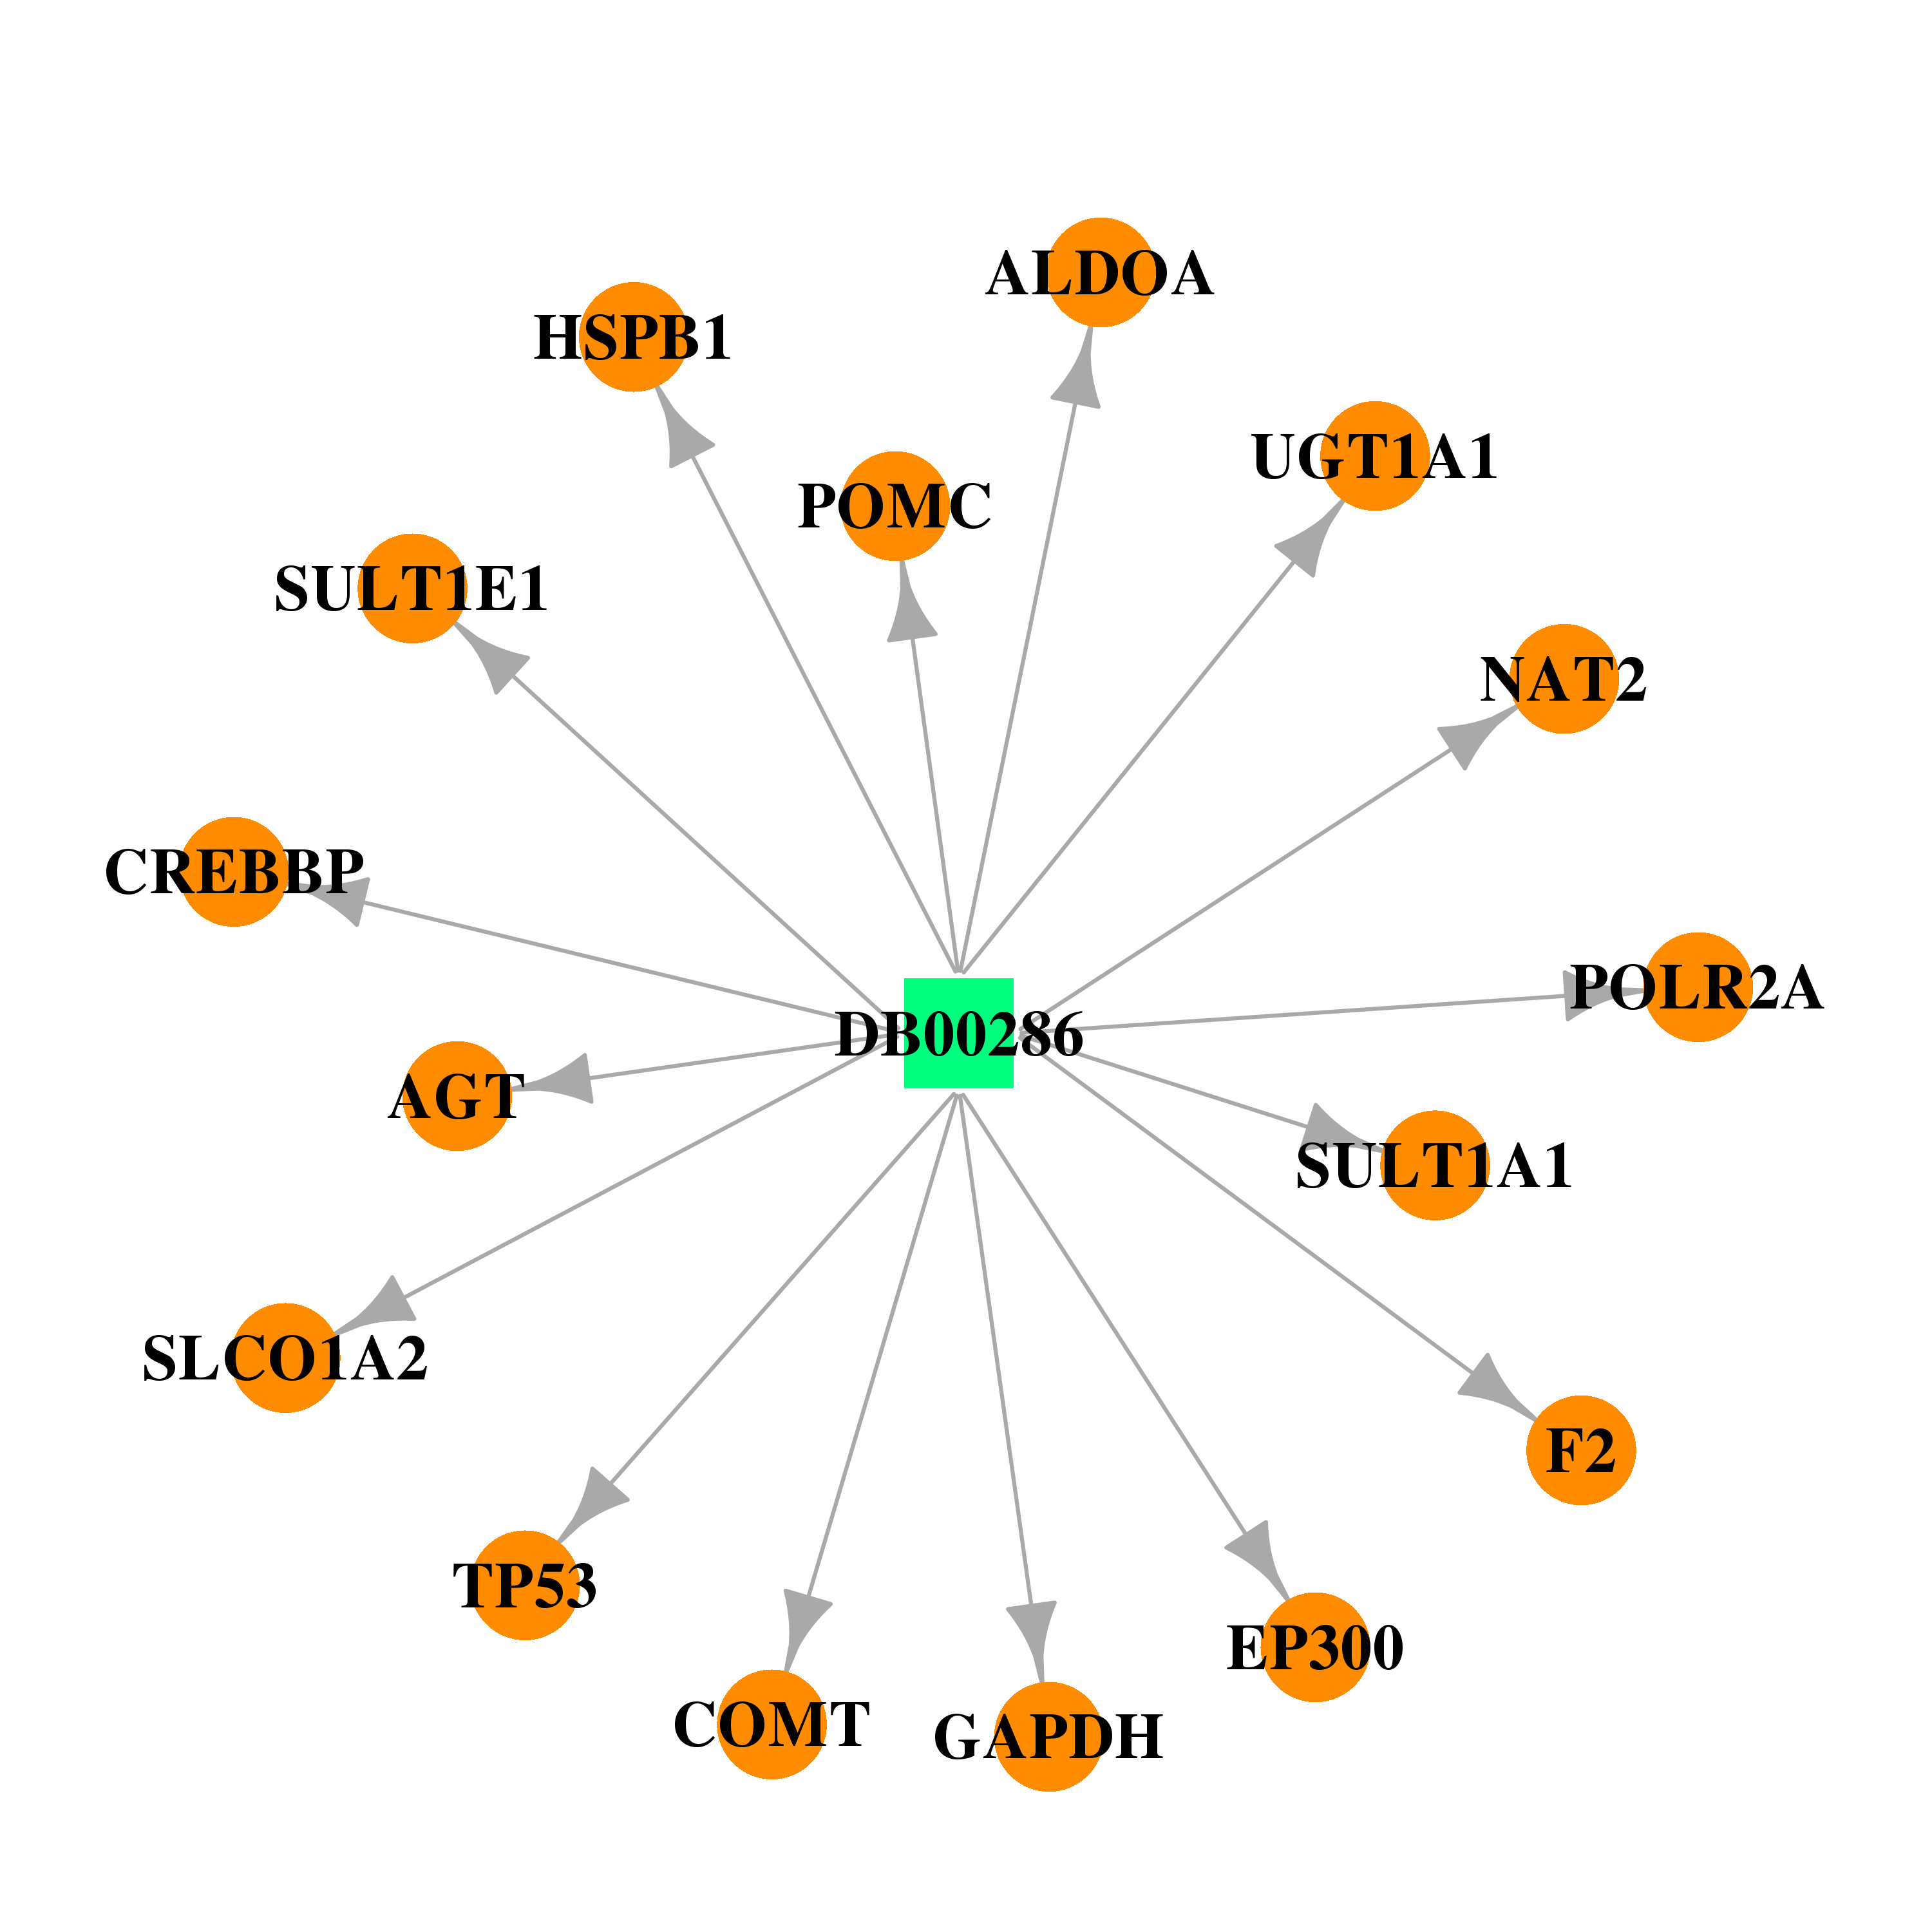 |  |
| DB00201 | N-acetyltransferase 2 (arylamine N-acetyltransferase) | approved | Caffeine | 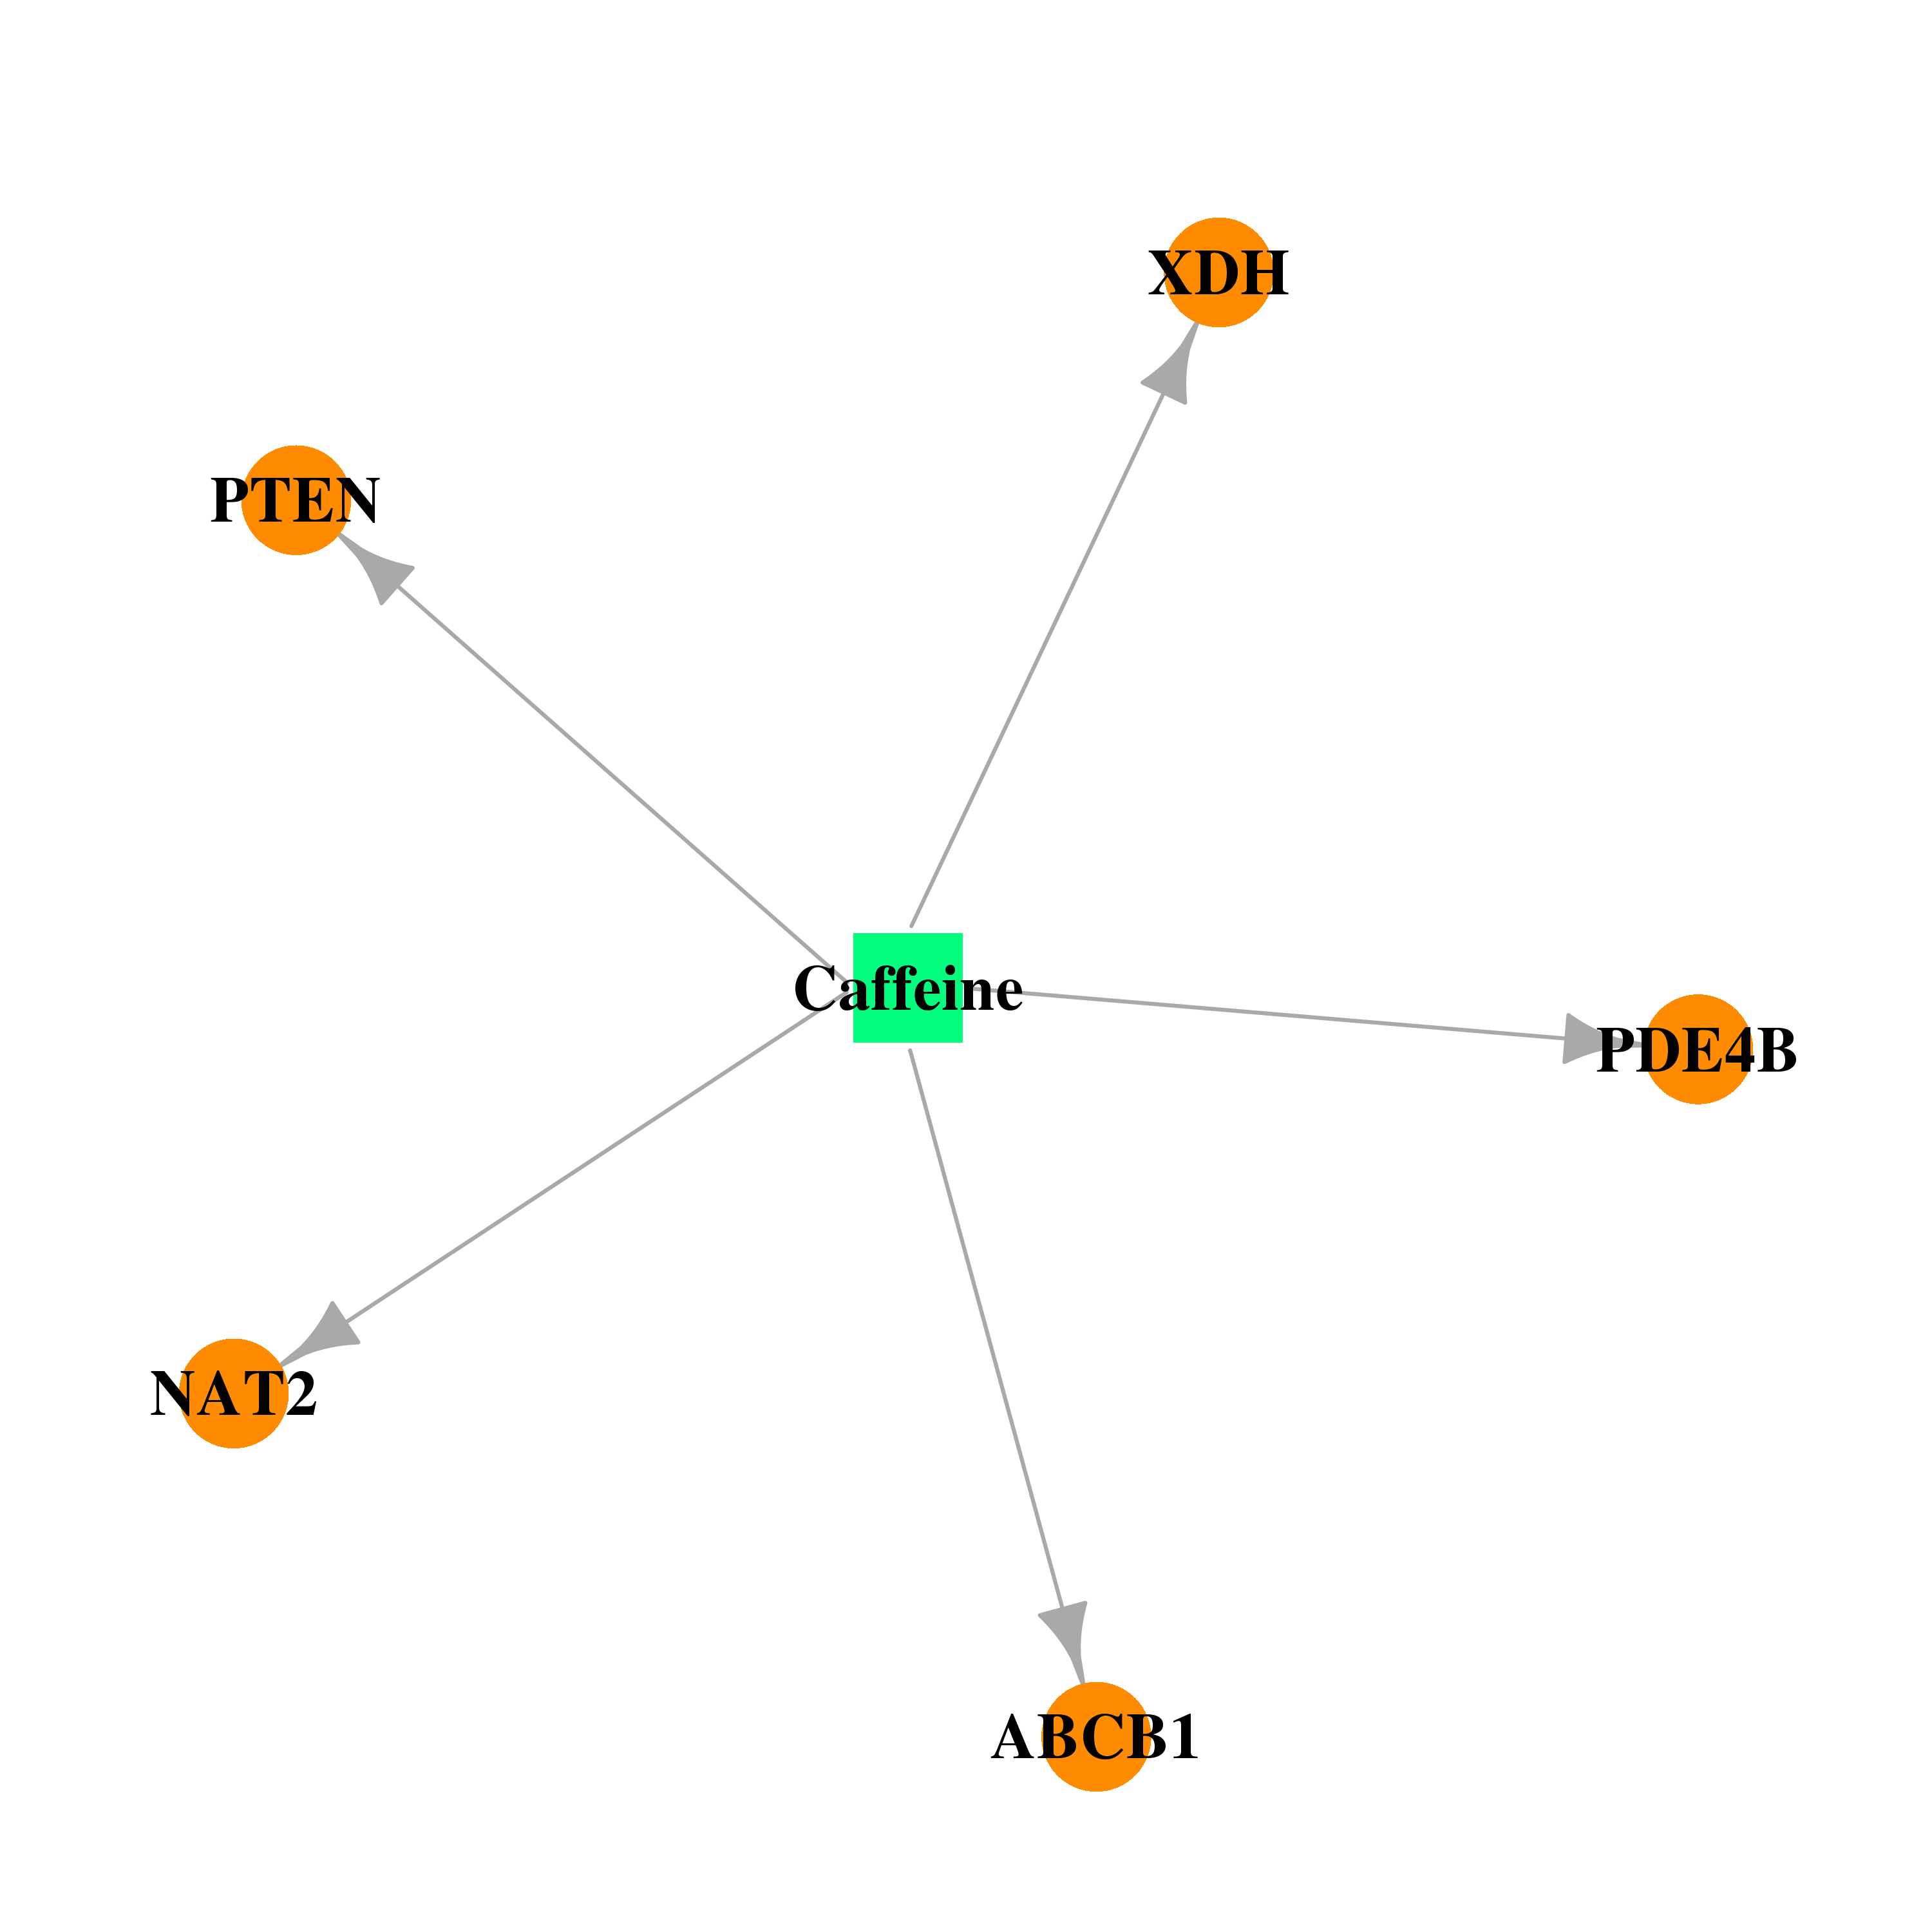 |  |
| DB00811 | N-acetyltransferase 2 (arylamine N-acetyltransferase) | approved | Ribavirin | 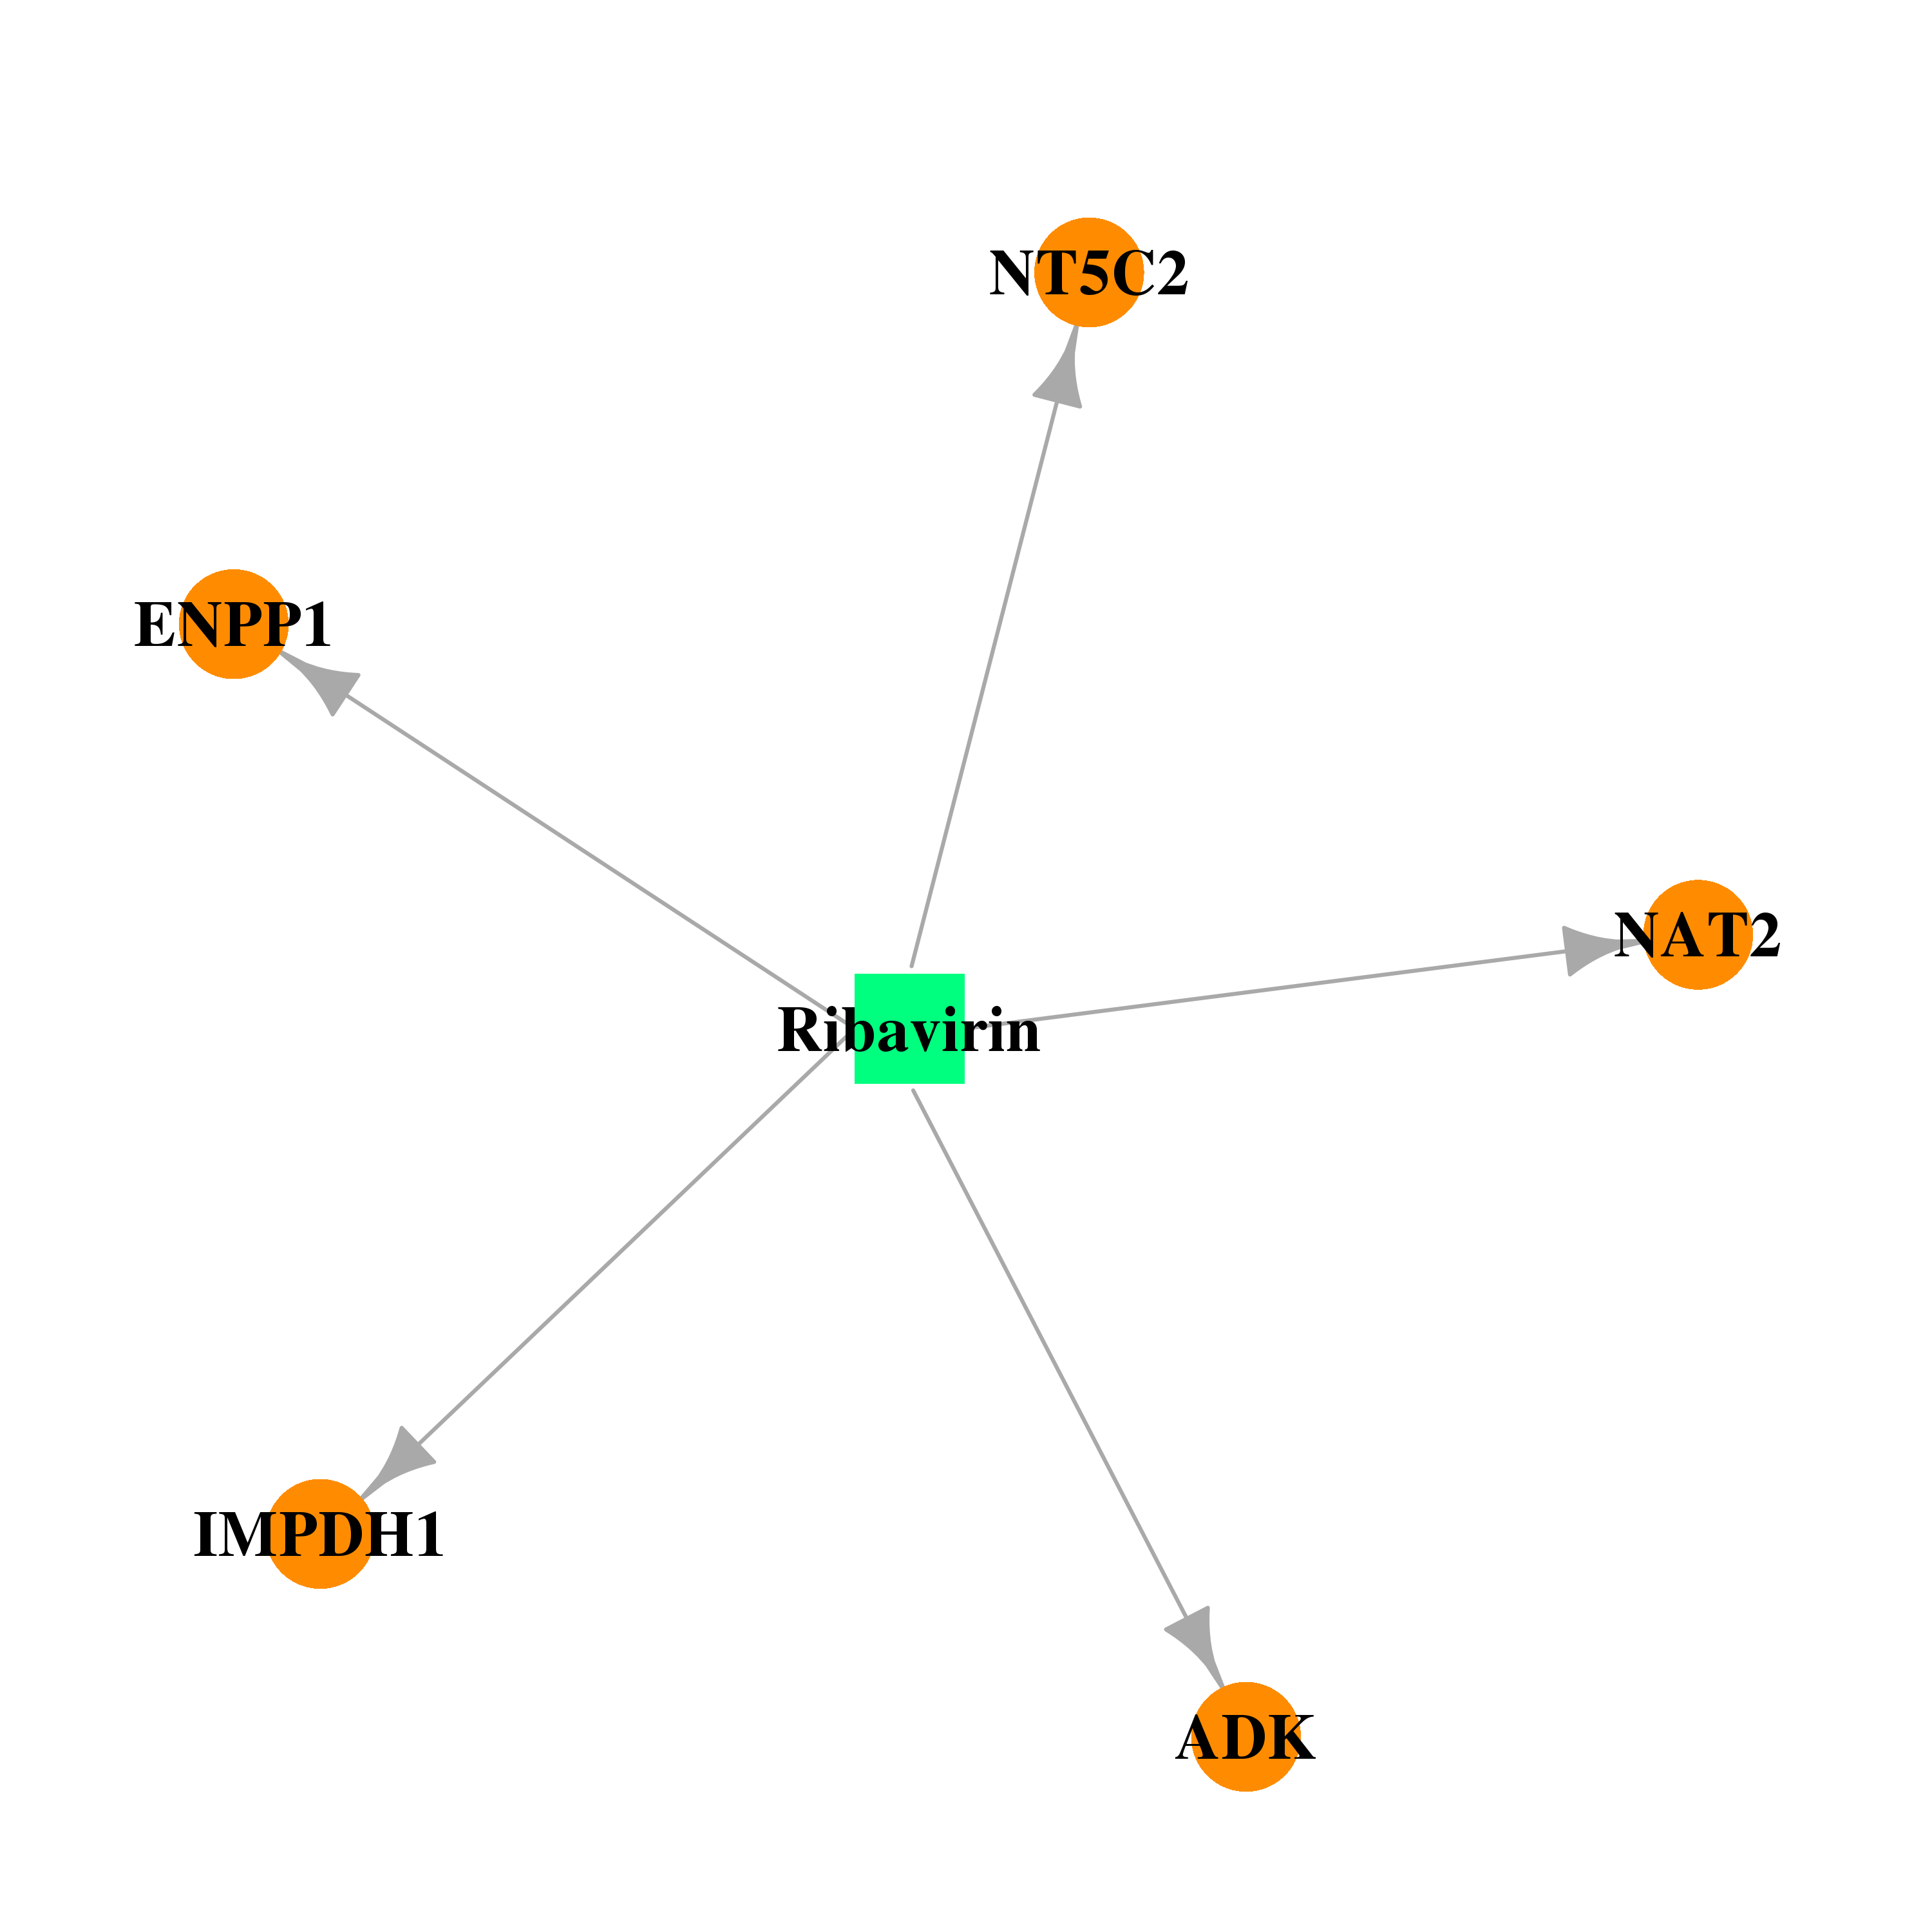 | 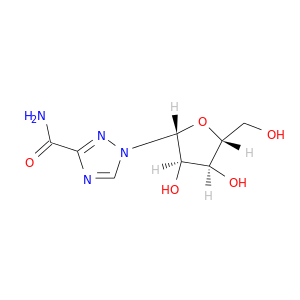 |
| DB00514 | N-acetyltransferase 2 (arylamine N-acetyltransferase) | approved | Dextromethorphan | 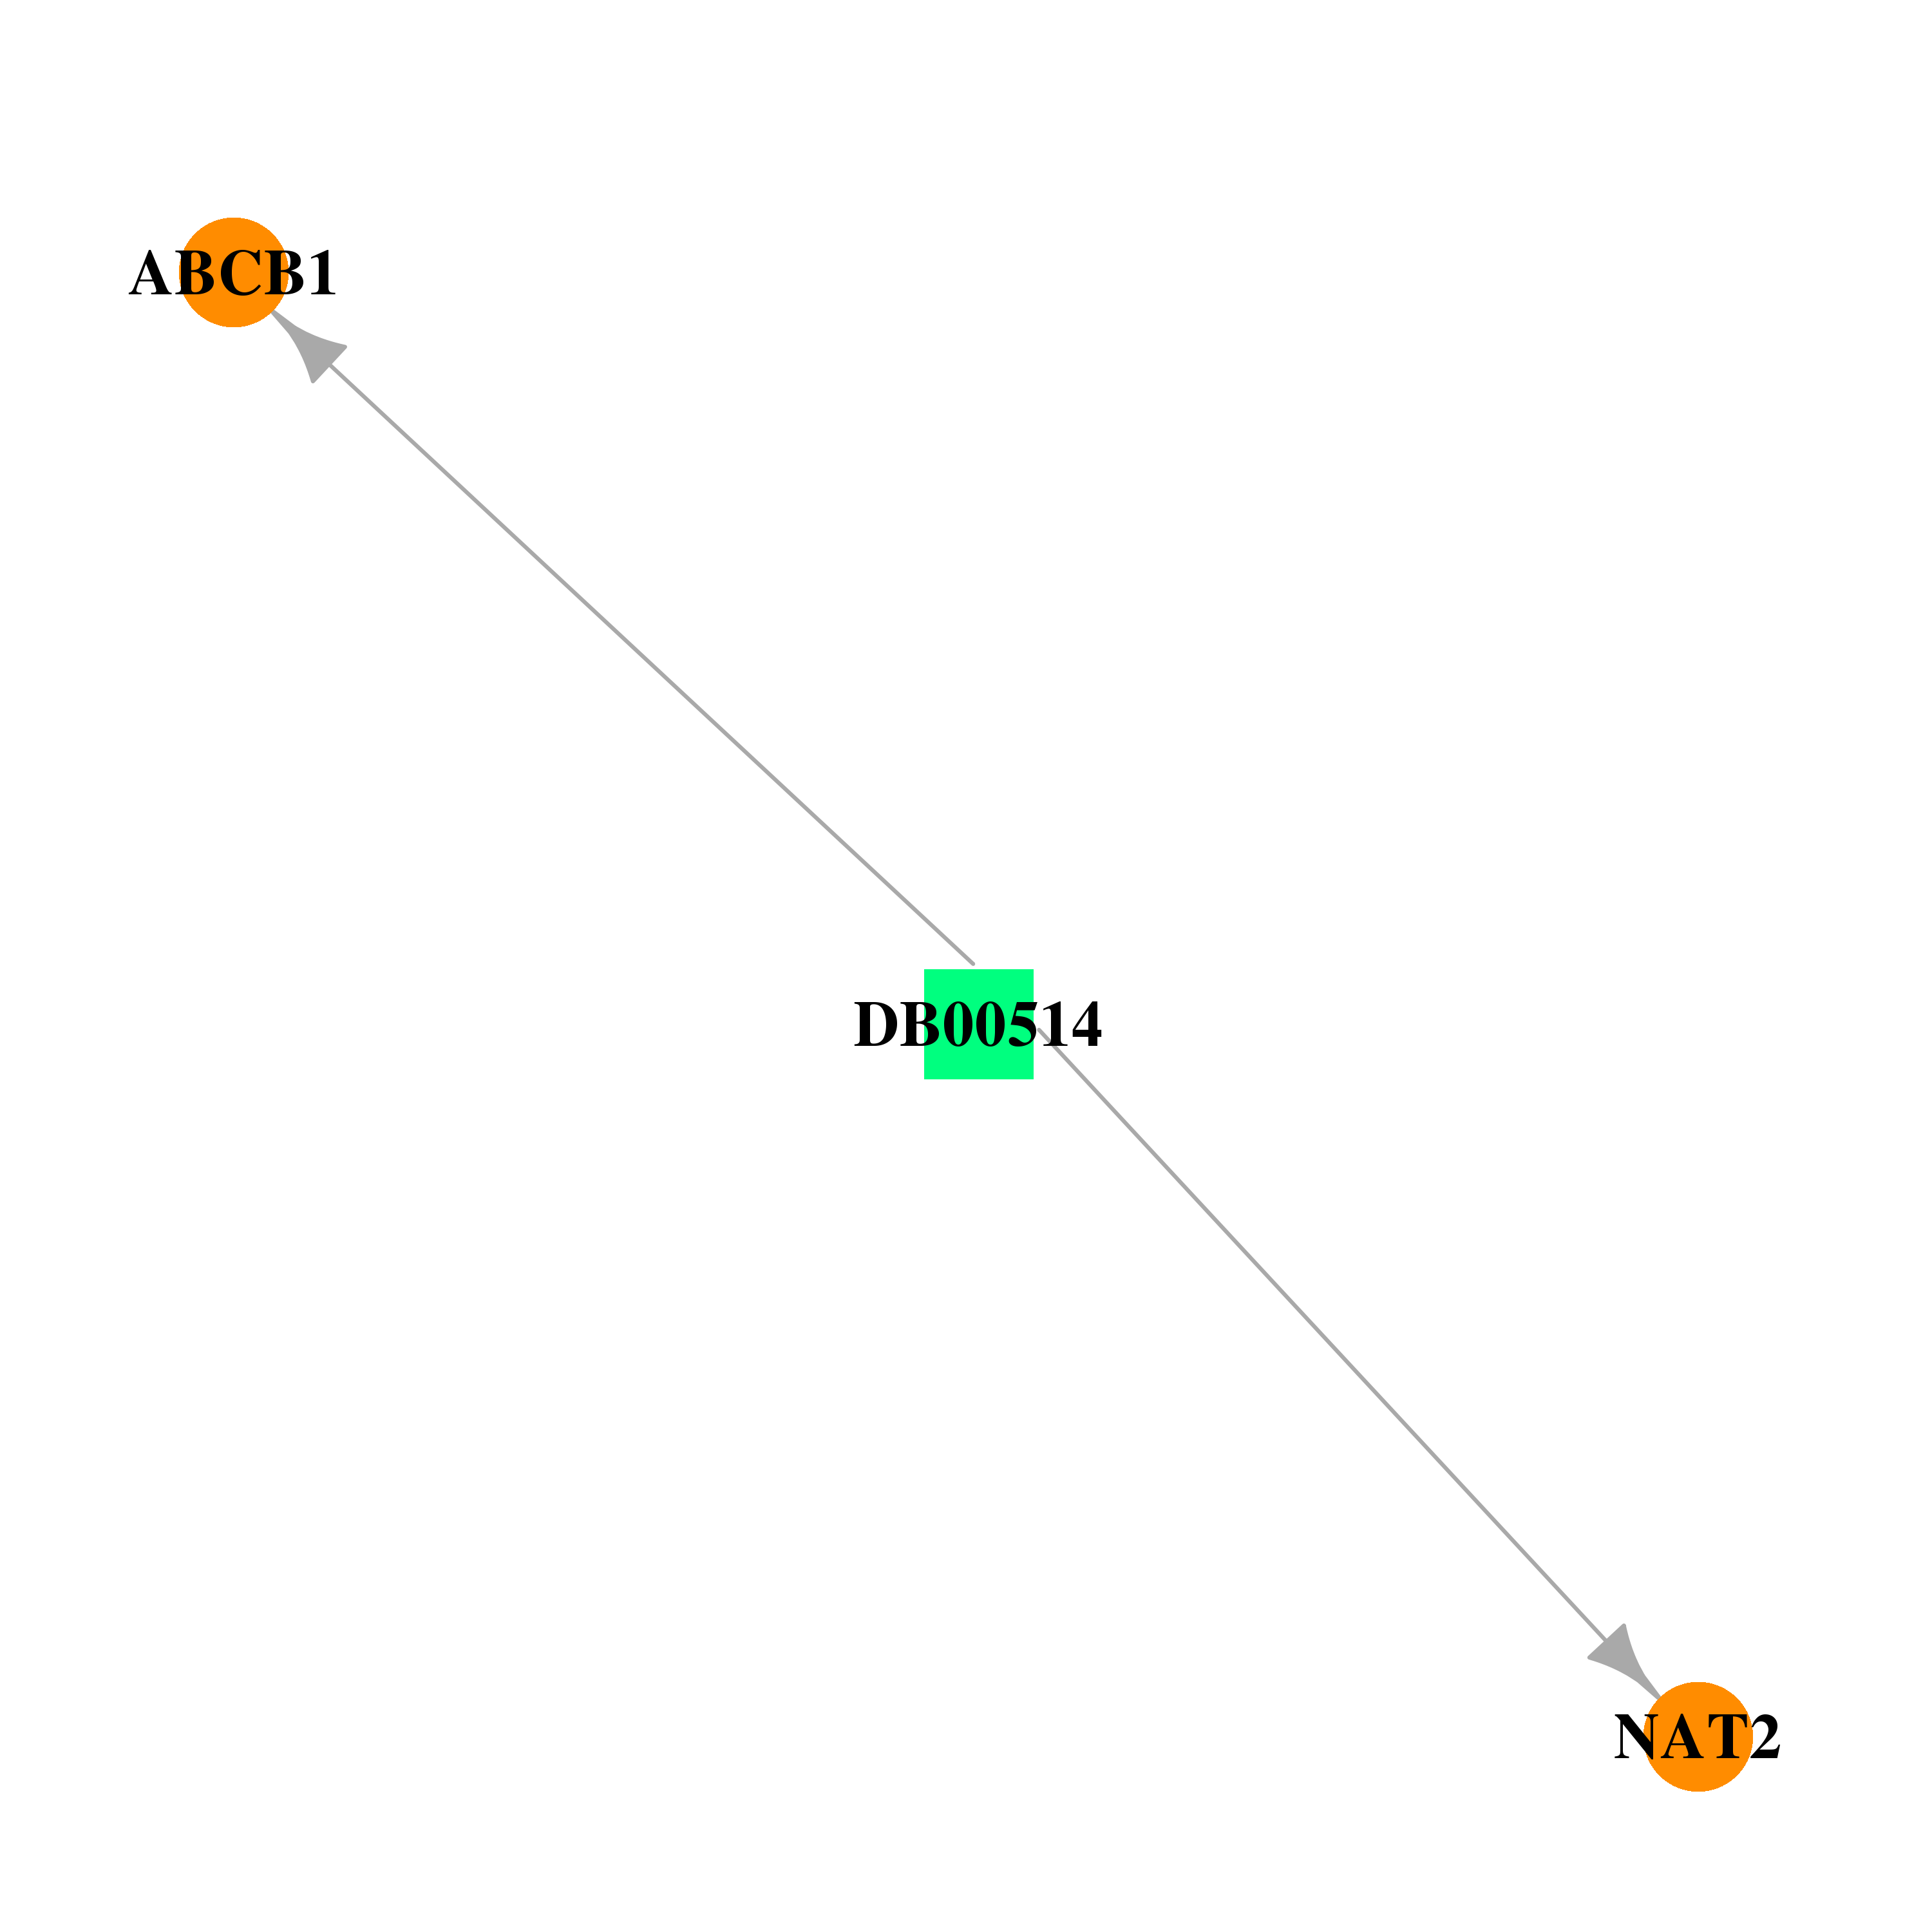 | 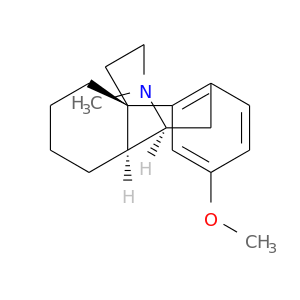 |
| DB01582 | N-acetyltransferase 2 (arylamine N-acetyltransferase) | approved | Sulfamethazine | 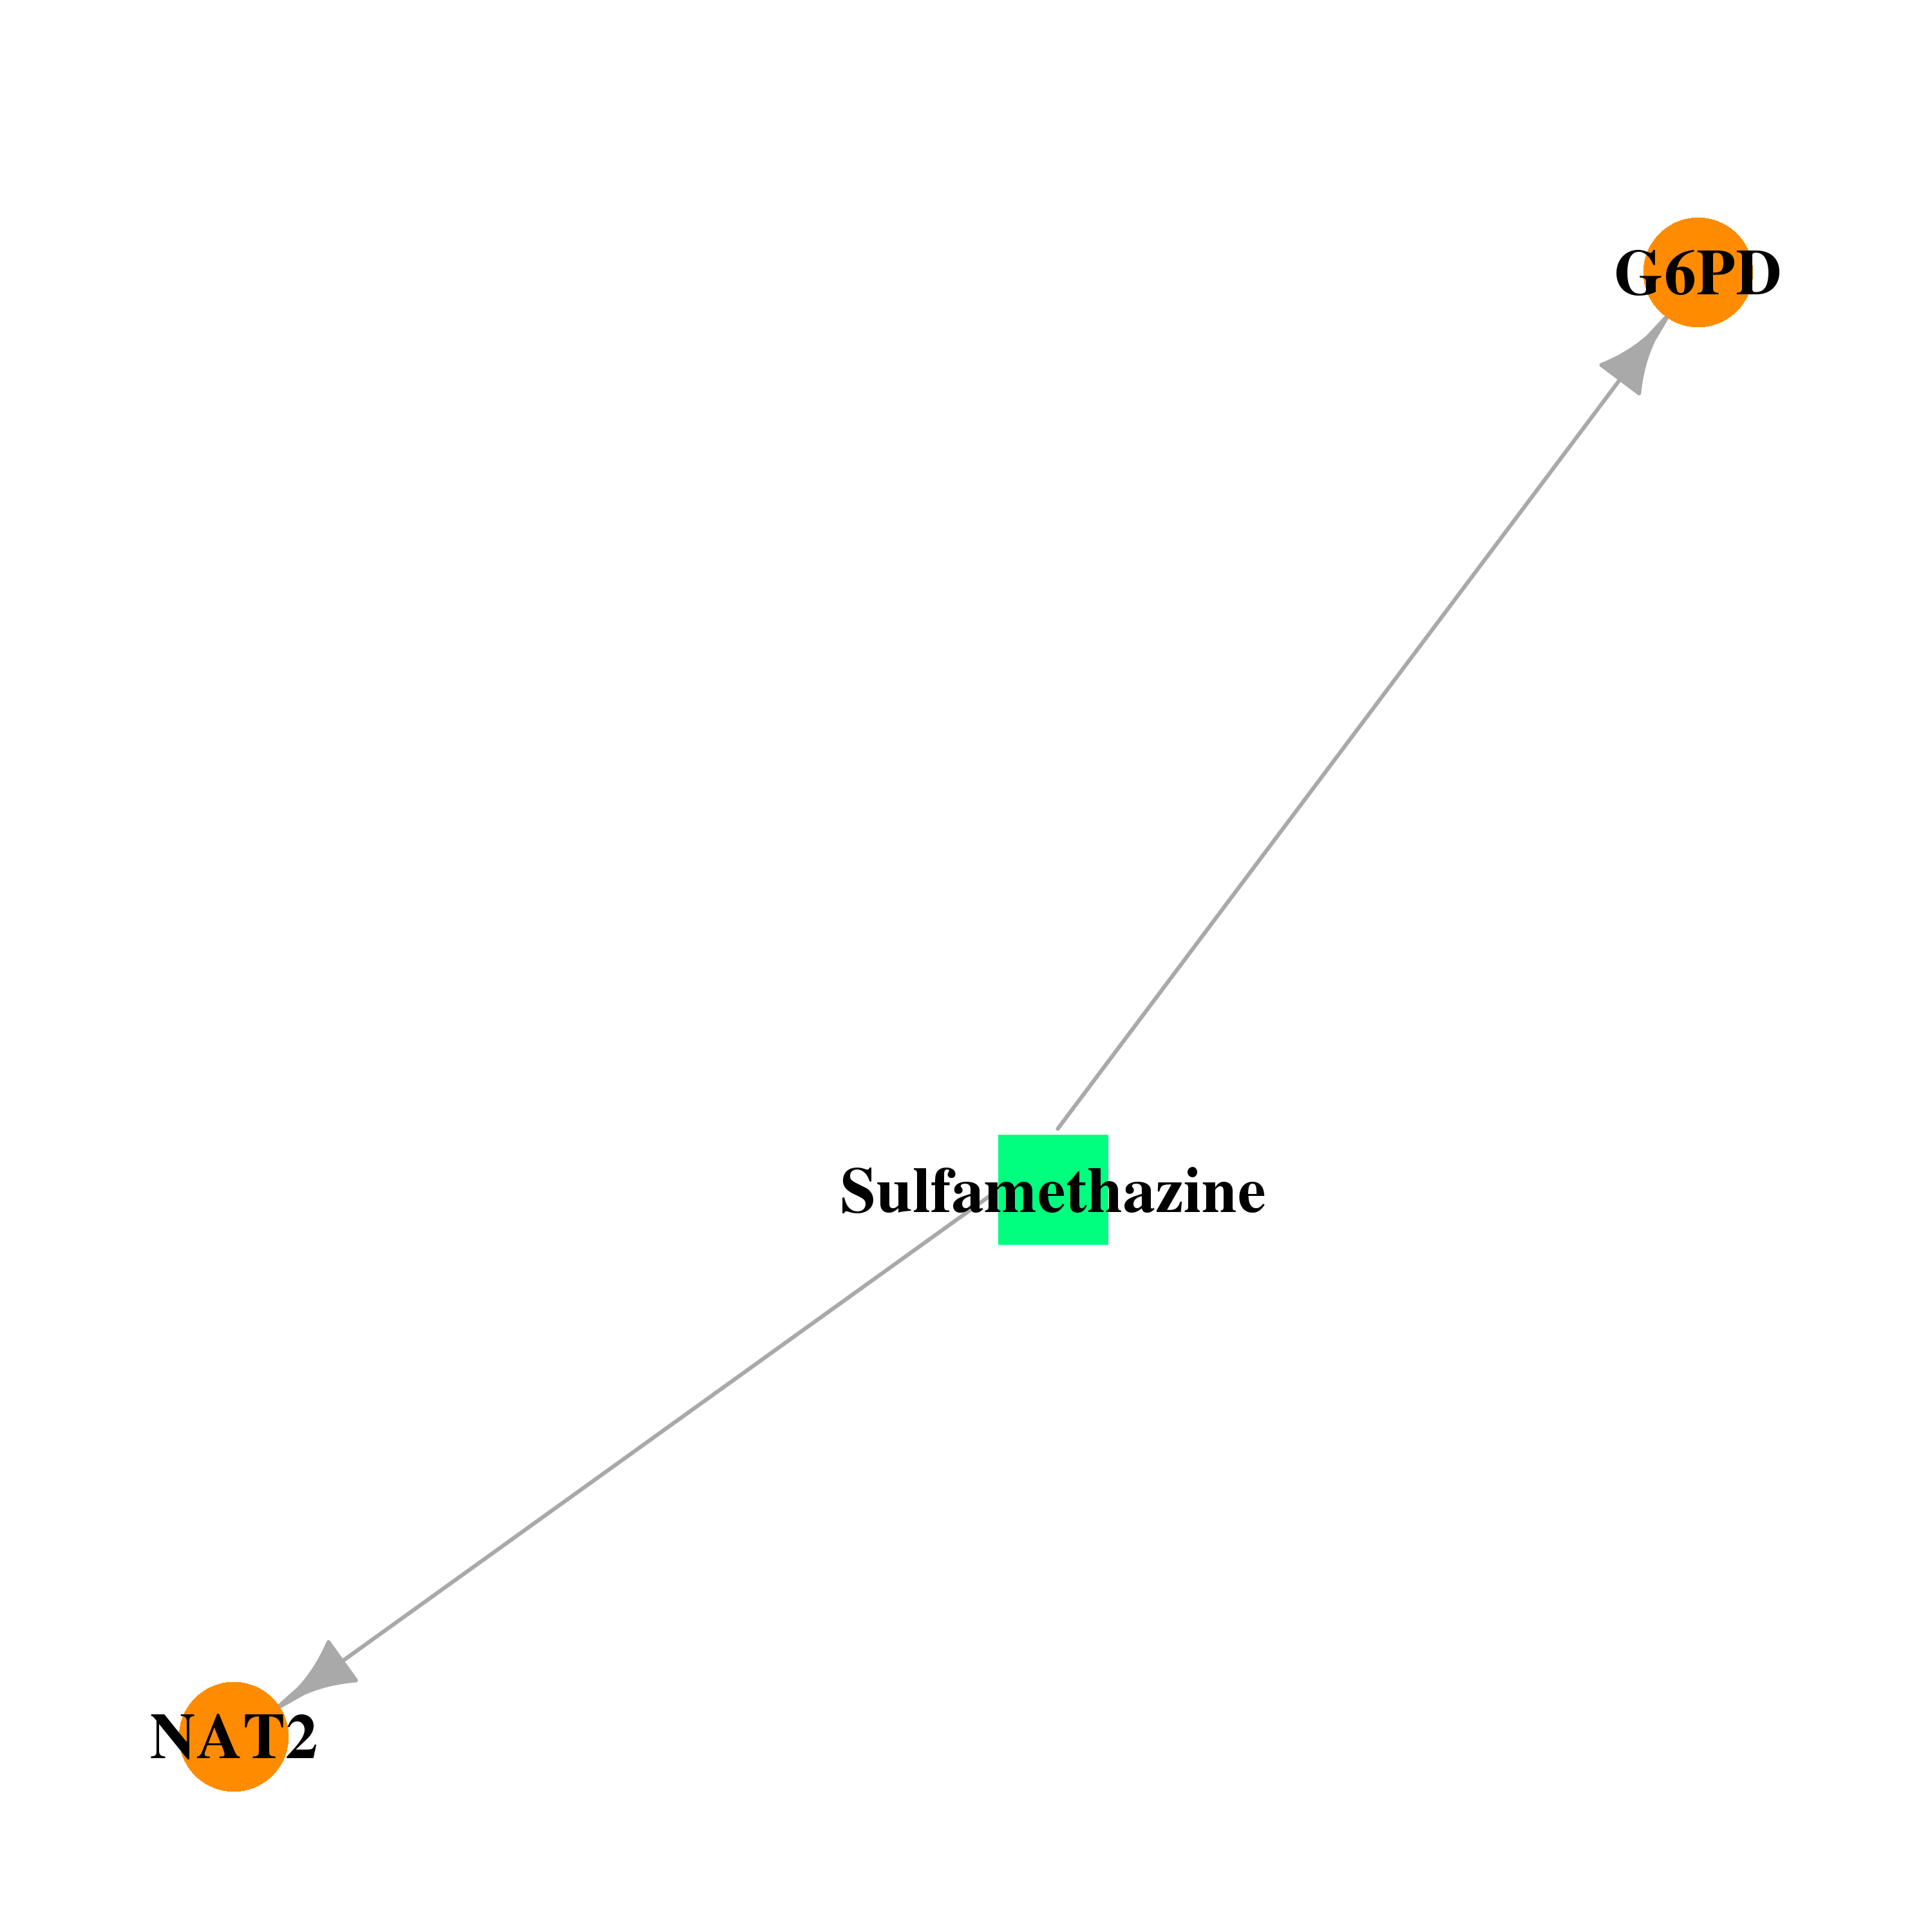 | 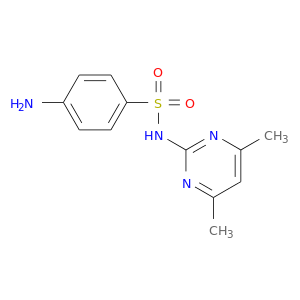 |
| DB00563 | N-acetyltransferase 2 (arylamine N-acetyltransferase) | approved | Methotrexate |  |  |
| DB00795 | N-acetyltransferase 2 (arylamine N-acetyltransferase) | approved | Sulfasalazine | 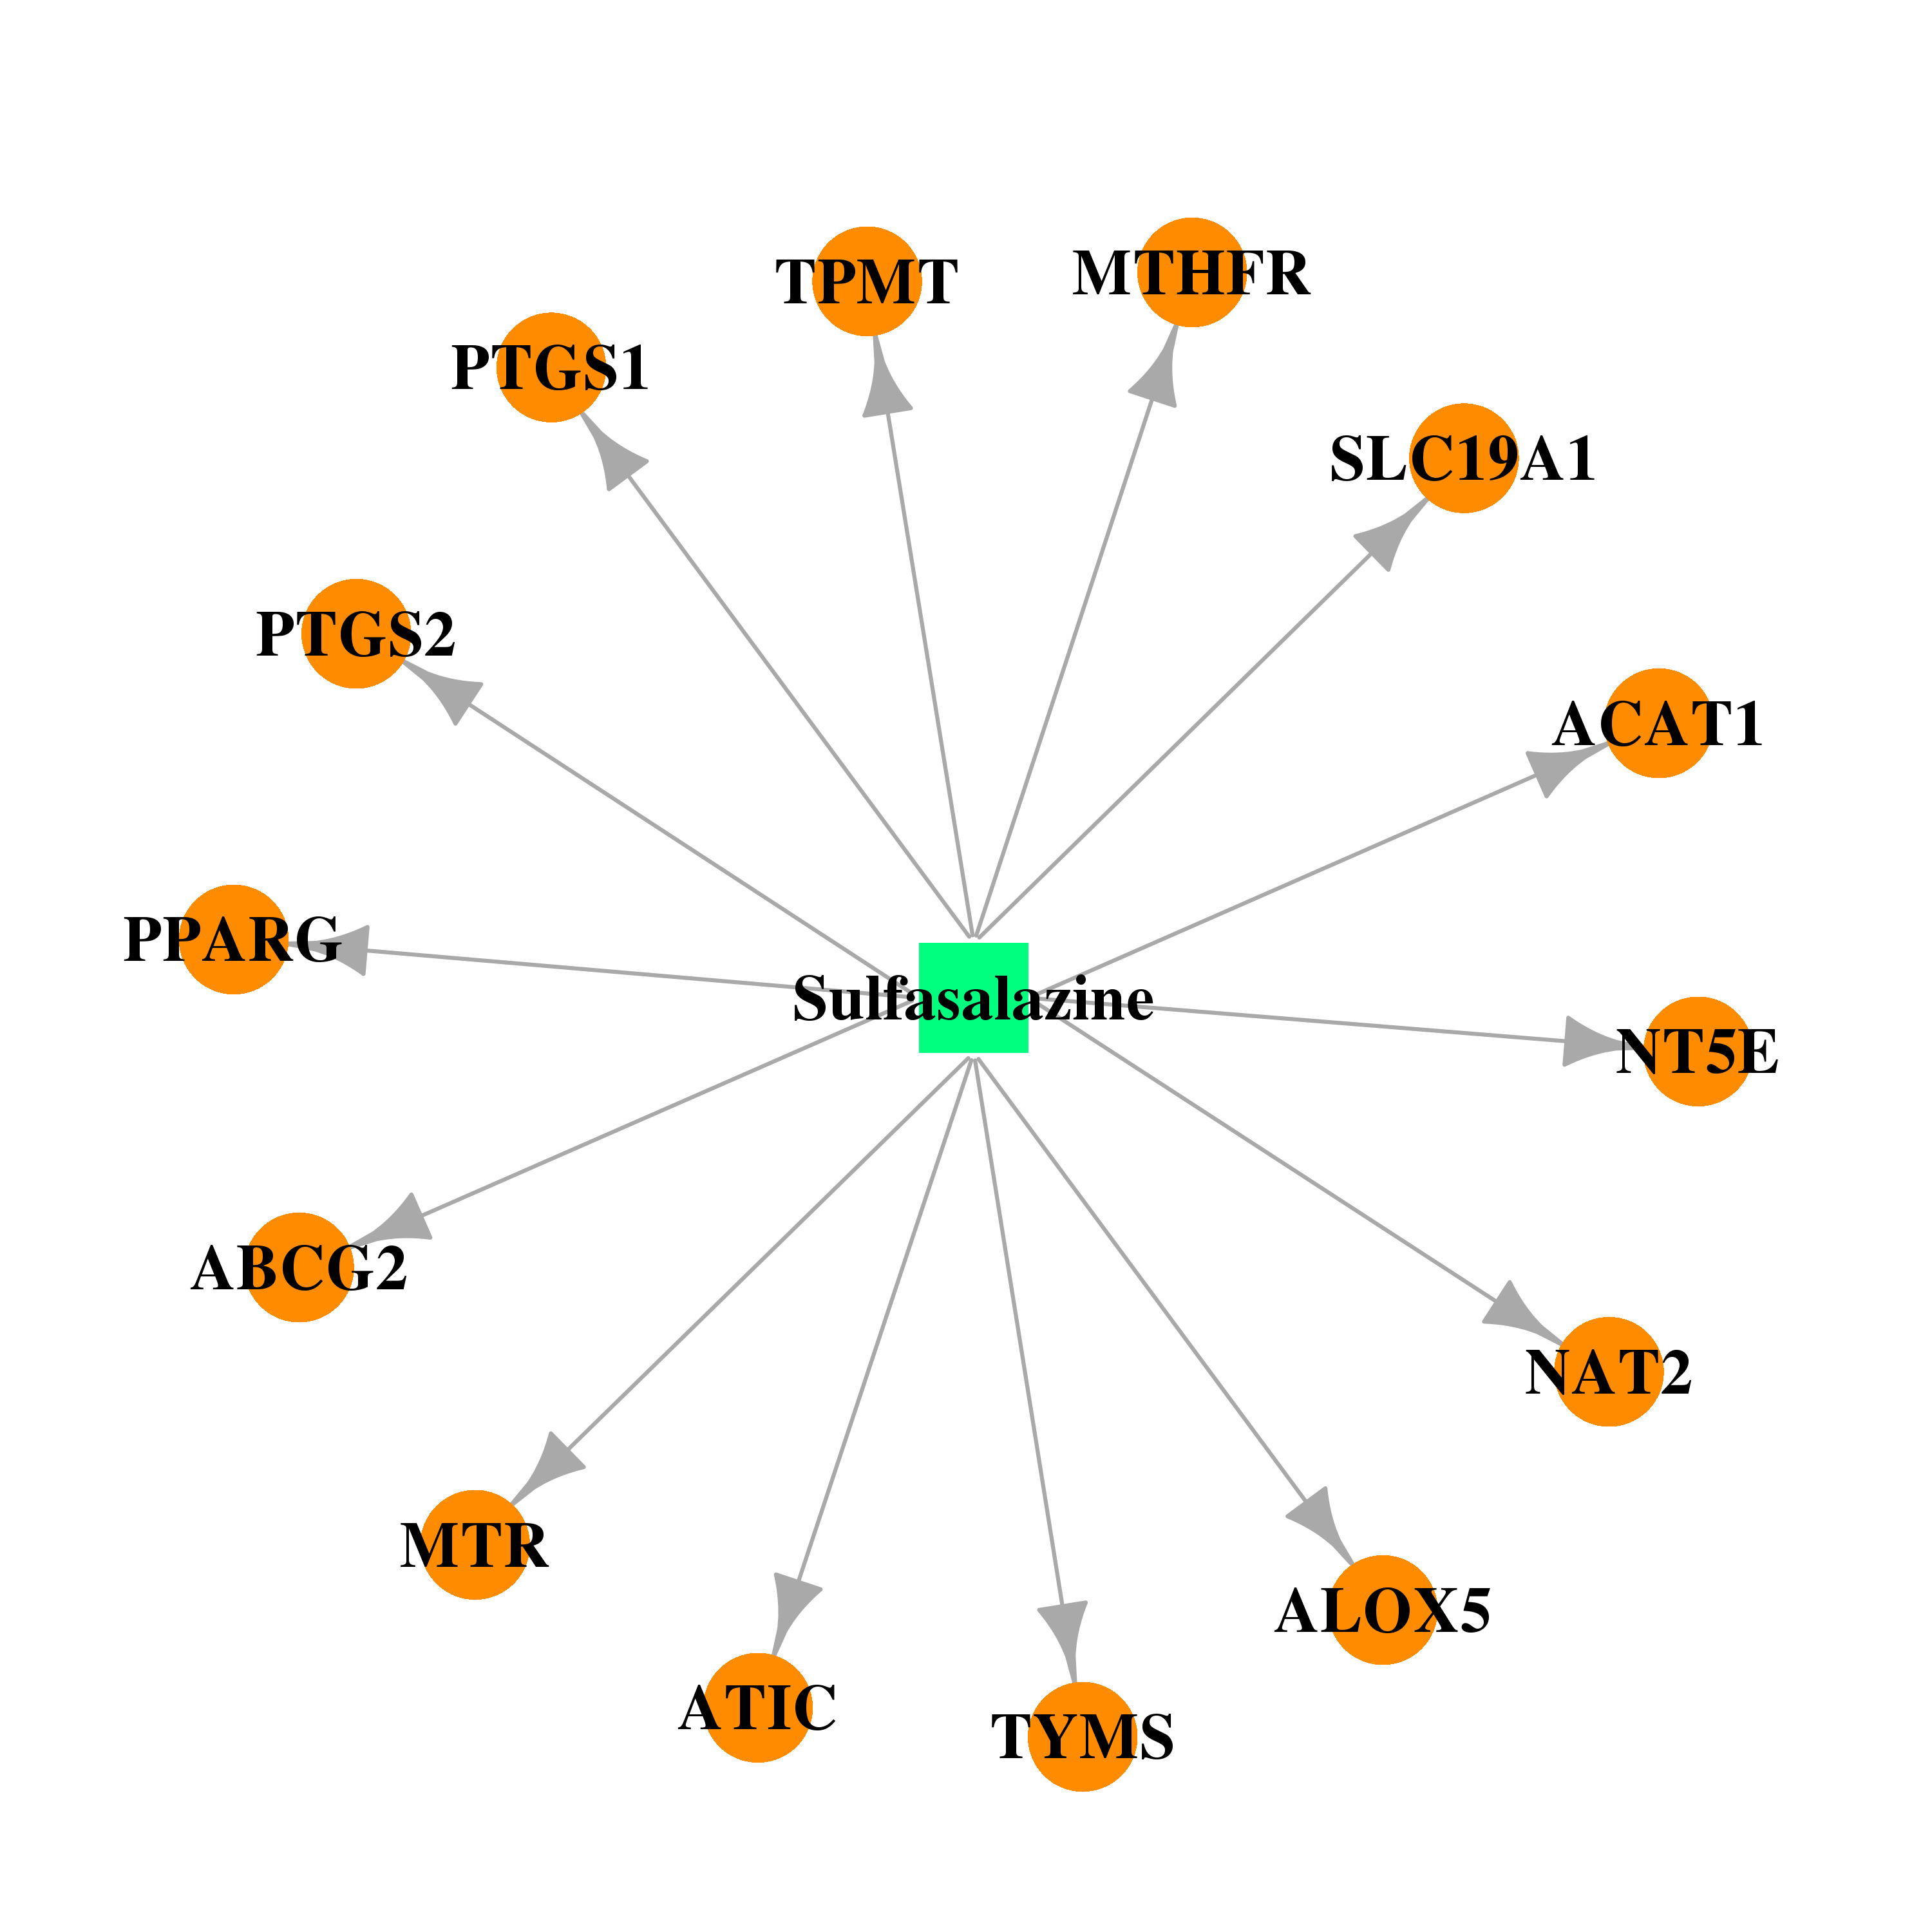 | 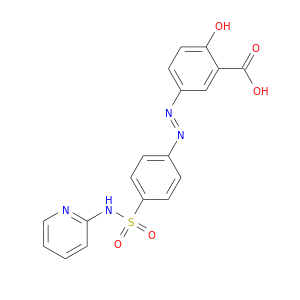 |
| DB01015 | N-acetyltransferase 2 (arylamine N-acetyltransferase) | approved | Sulfamethoxazole |  |  |
| DB01035 | N-acetyltransferase 2 (arylamine N-acetyltransferase) | approved | Procainamide | 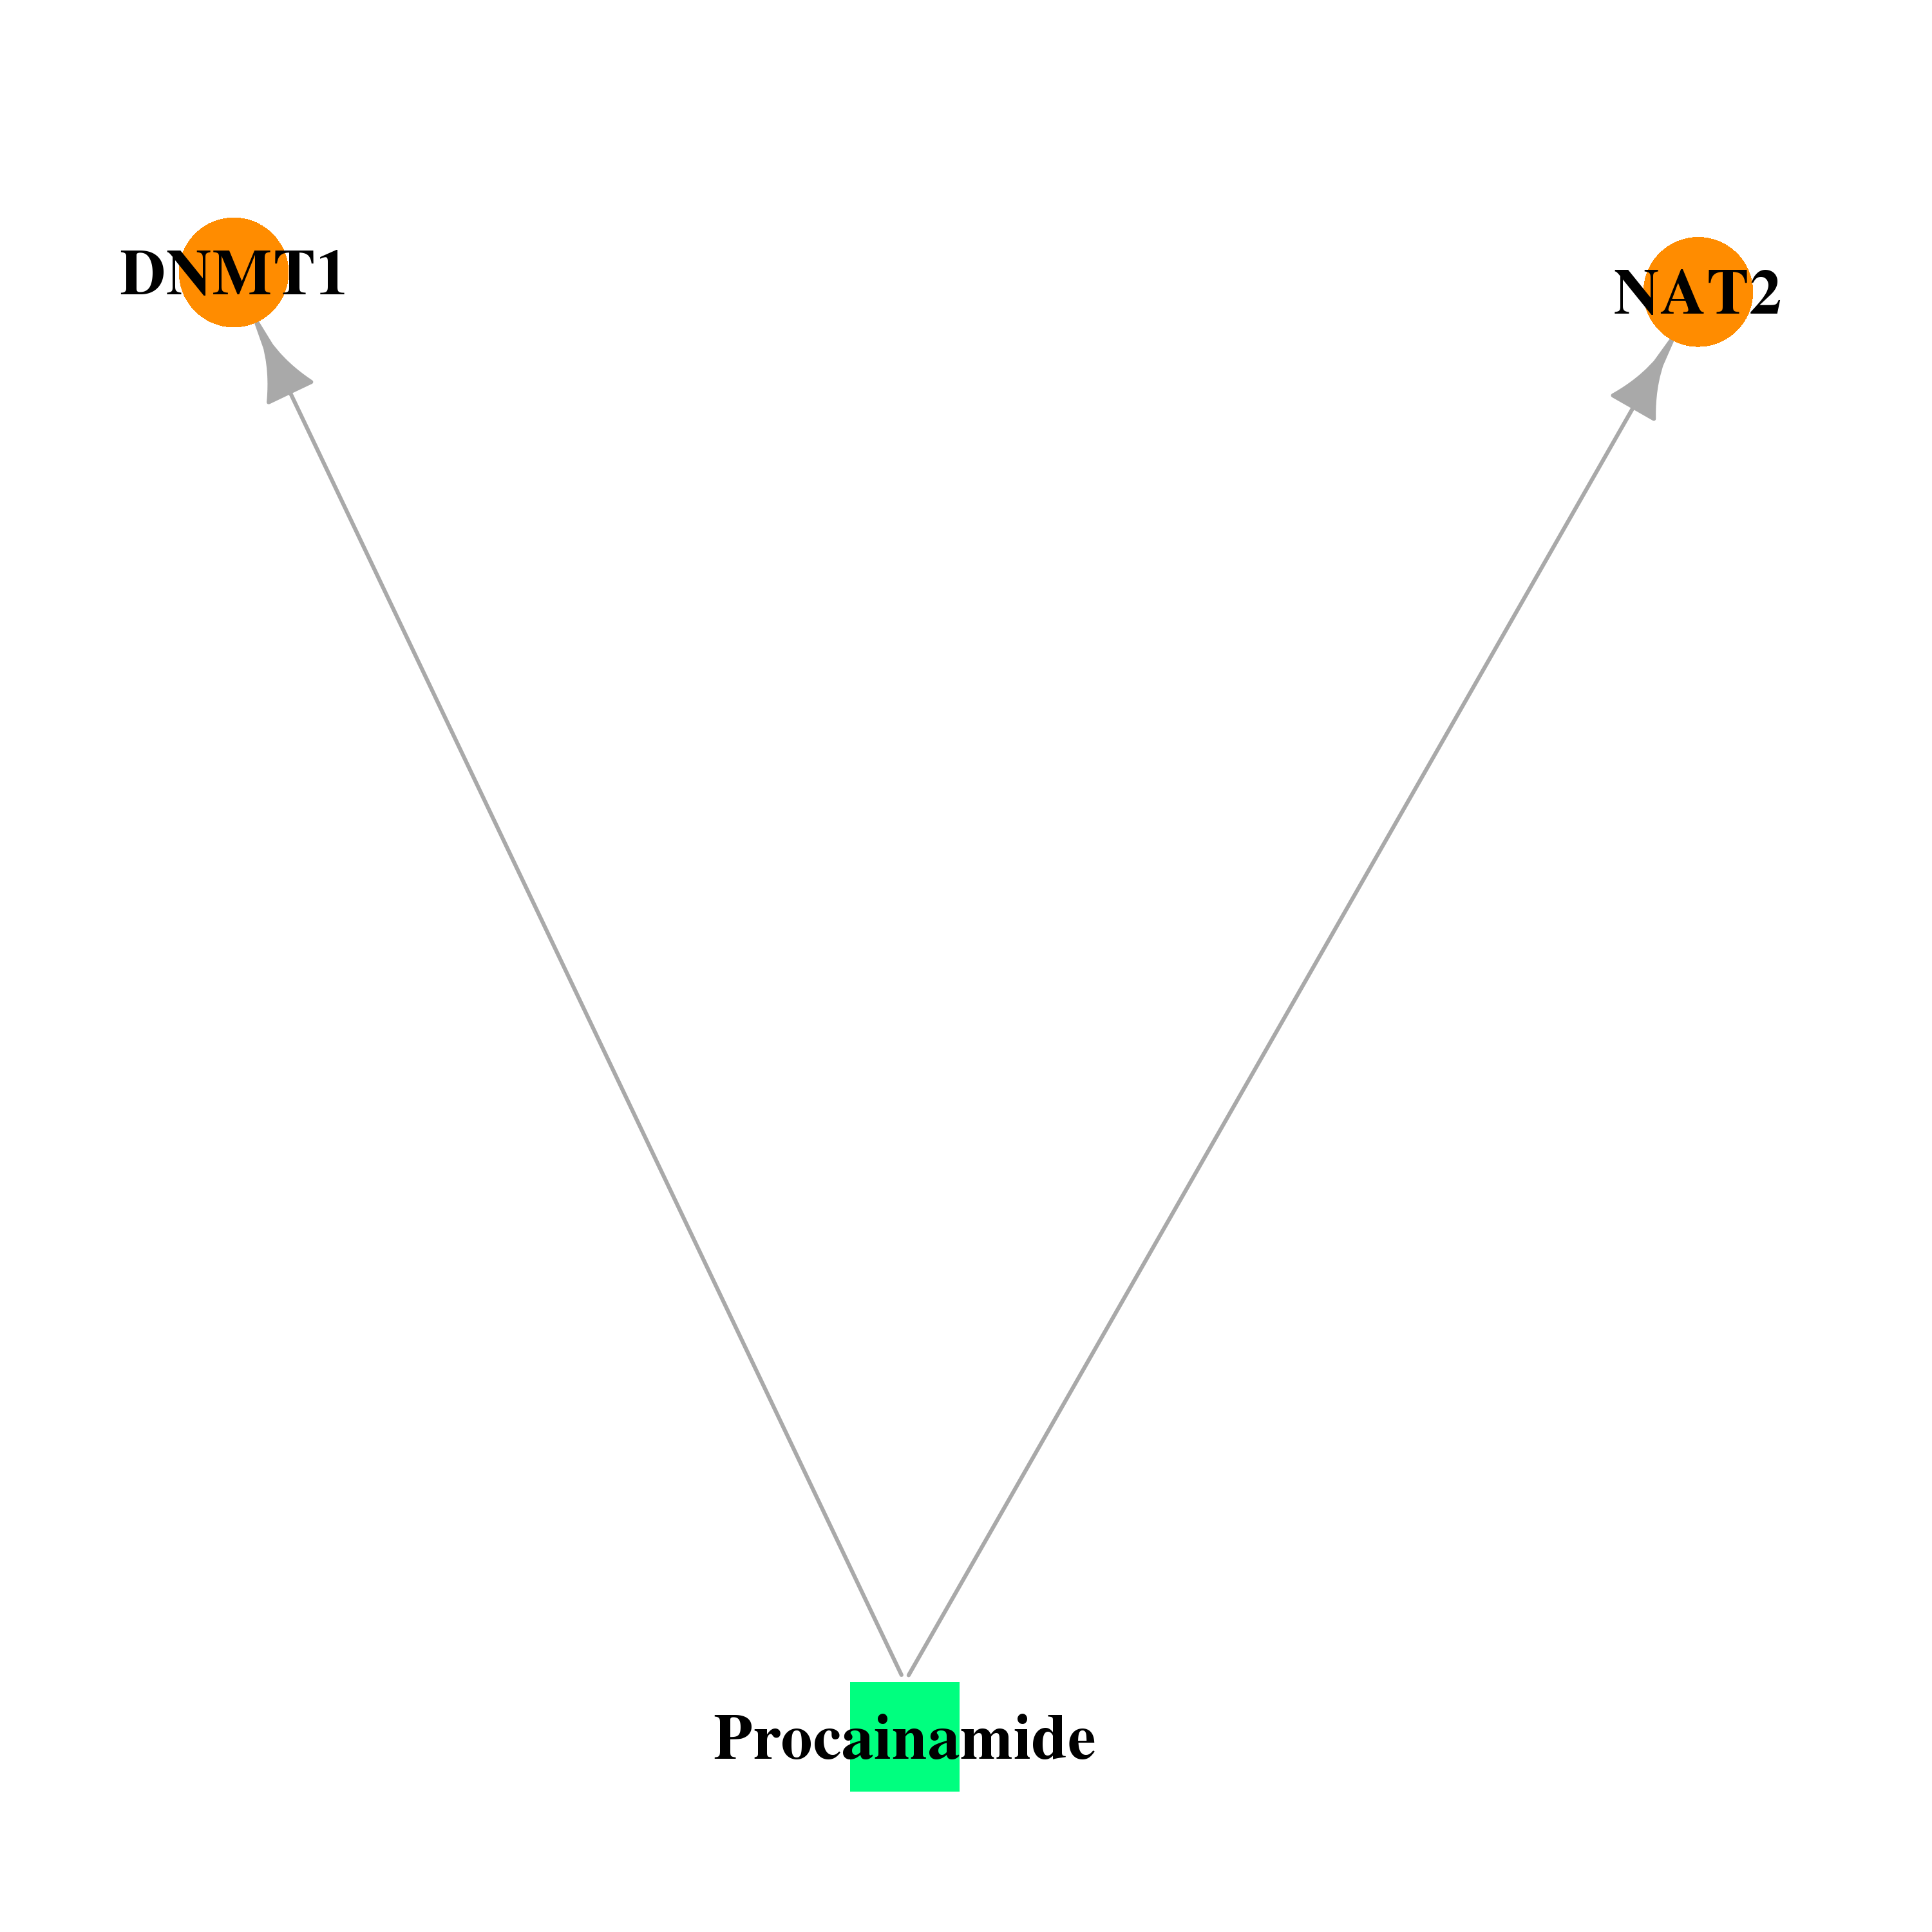 |  |
| DB01275 | N-acetyltransferase 2 (arylamine N-acetyltransferase) | approved | Hydralazine | 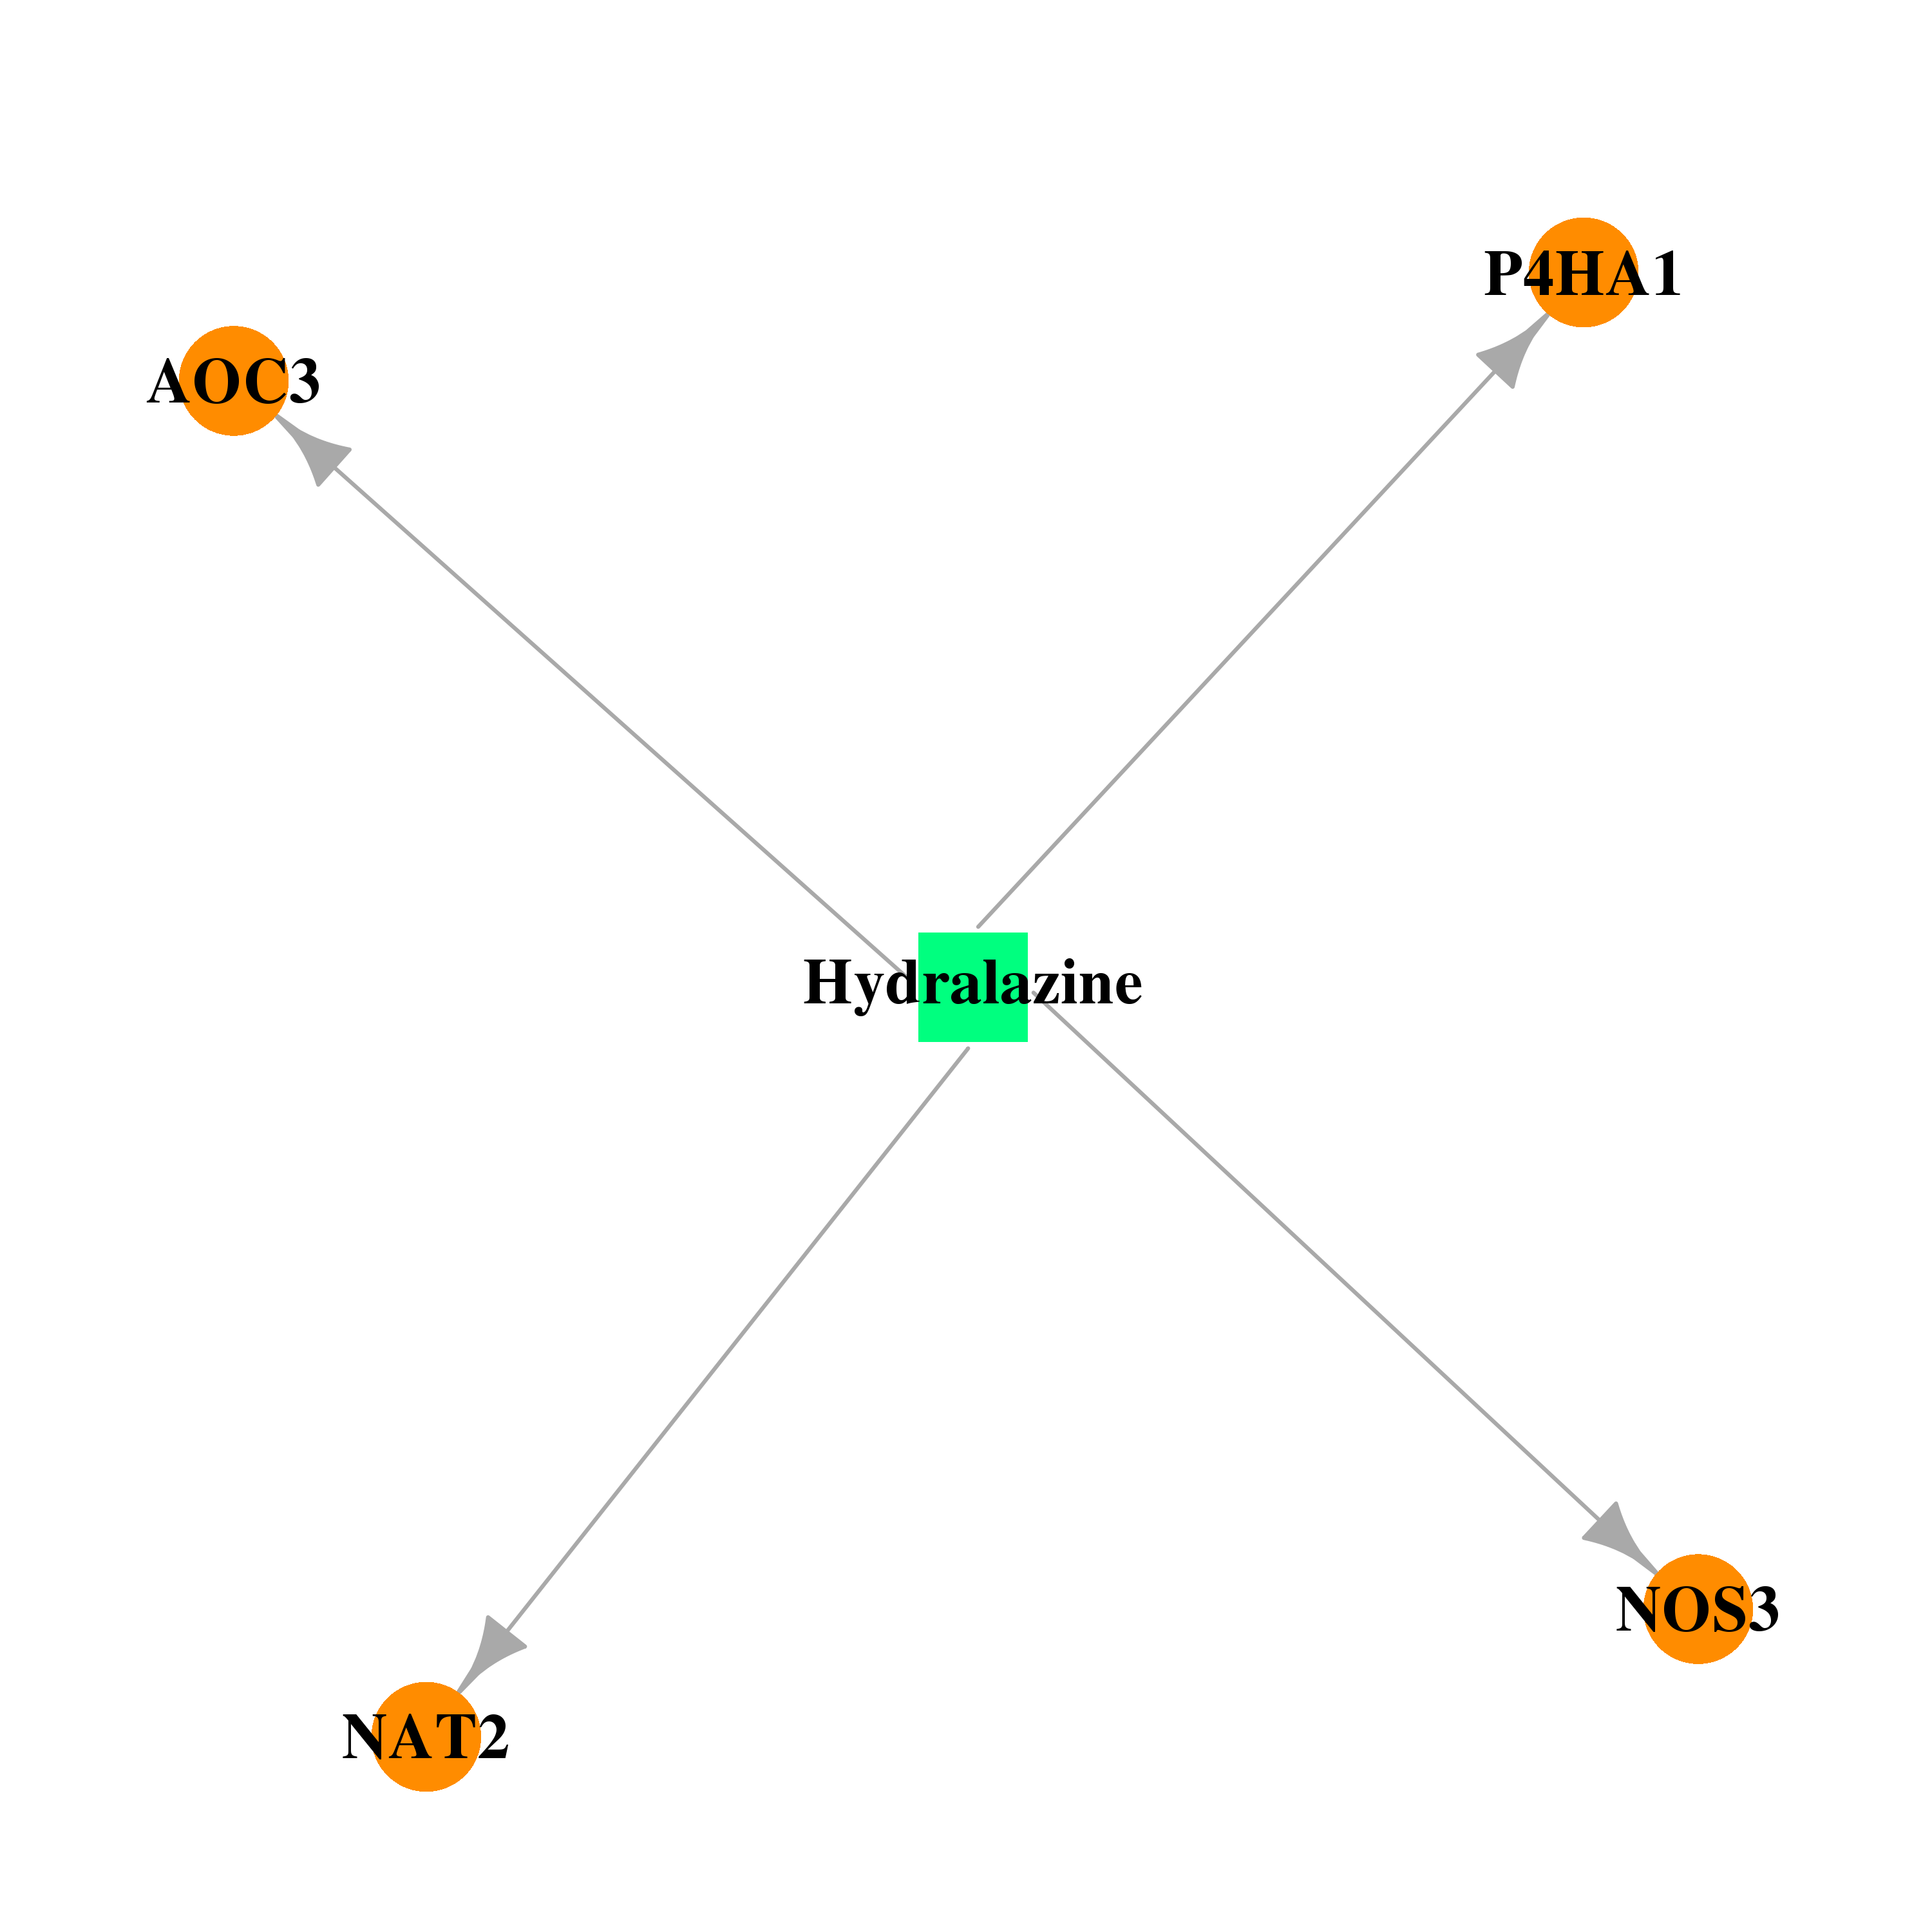 | 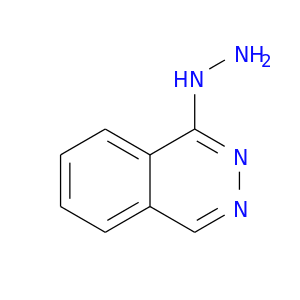 |
| Top |
| Cross referenced IDs for NAT2 |
| * We obtained these cross-references from Uniprot database. It covers 150 different DBs, 18 categories. http://www.uniprot.org/help/cross_references_section |
: Open all cross reference information
|
Copyright © 2016-Present - The Univsersity of Texas Health Science Center at Houston @ |