|
|||||||||||||||||||||||||||||||||||||||||||||||||||||||||||||||||||||||||||||||||||||||||||||||||||||||||||||||||||||||||||||||||||||||||||||||||||||||||||||||||||||||||||||||||||||||||||||||||||||||||||||||||||||||||||||||||||||||||||||||||||||||||||||||||||||||||||||||||||||||||||||||||||||||||||||||||||||||||||||||||||||||||||||||||||||||||||||||||||||||||||||||||||||||||||||||||||||||||||||||||||||||||||||||||||||||||||||||||||||||||
| |
| Phenotypic Information (metabolism pathway, cancer, disease, phenome) |
| |
| |
| Gene-Gene Network Information: Co-Expression Network, Interacting Genes & KEGG |
| |
|


| Gene Summary for ADA |
| Basic gene info. | Gene symbol | ADA |
| Gene name | adenosine deaminase | |
| Synonyms | - | |
| Cytomap | UCSC genome browser: 20q13.12 | |
| Genomic location | chr20 :43248162-43280376 | |
| Type of gene | protein-coding | |
| RefGenes | NM_000022.2, | |
| Ensembl id | ENSG00000196839 | |
| Description | adenosine aminohydrolase | |
| Modification date | 20141221 | |
| dbXrefs | MIM : 608958 | |
| HGNC : HGNC | ||
| Ensembl : ENSG00000196839 | ||
| HPRD : 00038 | ||
| Vega : OTTHUMG00000033081 | ||
| Protein | UniProt: go to UniProt's Cross Reference DB Table | |
| Expression | CleanEX: HS_ADA | |
| BioGPS: 100 | ||
| Gene Expression Atlas: ENSG00000196839 | ||
| The Human Protein Atlas: ENSG00000196839 | ||
| Pathway | NCI Pathway Interaction Database: ADA | |
| KEGG: ADA | ||
| REACTOME: ADA | ||
| ConsensusPathDB | ||
| Pathway Commons: ADA | ||
| Metabolism | MetaCyc: ADA | |
| HUMANCyc: ADA | ||
| Regulation | Ensembl's Regulation: ENSG00000196839 | |
| miRBase: chr20 :43,248,162-43,280,376 | ||
| TargetScan: NM_000022 | ||
| cisRED: ENSG00000196839 | ||
| Context | iHOP: ADA | |
| cancer metabolism search in PubMed: ADA | ||
| UCL Cancer Institute: ADA | ||
| Assigned class in ccmGDB | C | |
| Top |
| Phenotypic Information for ADA(metabolism pathway, cancer, disease, phenome) |
| Cancer | CGAP: ADA |
| Familial Cancer Database: ADA | |
| * This gene is included in those cancer gene databases. |
|
|
|
|
|
|
| |||||||||||||||||||||||||||||||||||||||||||||||||||||||||||||||||||||||||||||||||||||||||||||||||||||||||||||||||||||||||||||||||||||||||||||||||||||||||||||||||||||||||||||||||||||||||||||||||||||||||||||||||||||||||||||||||||||||||||||||||||||||||||||||||||||||||||||||||||||||||||||||||||||||||||||||||||||||||||||||||||||||||||||||||||||||||||||||||||||||||||||||||||||||||||||||||||||||||||||||||||||||||||||||||||||||||||||||||||
Oncogene 1 | Significant driver gene in | ||||||||||||||||||||||||||||||||||||||||||||||||||||||||||||||||||||||||||||||||||||||||||||||||||||||||||||||||||||||||||||||||||||||||||||||||||||||||||||||||||||||||||||||||||||||||||||||||||||||||||||||||||||||||||||||||||||||||||||||||||||||||||||||||||||||||||||||||||||||||||||||||||||||||||||||||||||||||||||||||||||||||||||||||||||||||||||||||||||||||||||||||||||||||||||||||||||||||||||||||||||||||||||||||||||||||||||||||||||||||
| cf) number; DB name 1 Oncogene; http://nar.oxfordjournals.org/content/35/suppl_1/D721.long, 2 Tumor Suppressor gene; https://bioinfo.uth.edu/TSGene/, 3 Cancer Gene Census; http://www.nature.com/nrc/journal/v4/n3/abs/nrc1299.html, 4 CancerGenes; http://nar.oxfordjournals.org/content/35/suppl_1/D721.long, 5 Network of Cancer Gene; http://ncg.kcl.ac.uk/index.php, 1Therapeutic Vulnerabilities in Cancer; http://cbio.mskcc.org/cancergenomics/statius/ |
| KEGG_PURINE_METABOLISM REACTOME_METABOLISM_OF_NUCLEOTIDES REACTOME_PURINE_METABOLISM | |
| OMIM | |
| Orphanet | |
| Disease | KEGG Disease: ADA |
| MedGen: ADA (Human Medical Genetics with Condition) | |
| ClinVar: ADA | |
| Phenotype | MGI: ADA (International Mouse Phenotyping Consortium) |
| PhenomicDB: ADA | |
| Mutations for ADA |
| * Under tables are showing count per each tissue to give us broad intuition about tissue specific mutation patterns.You can go to the detailed page for each mutation database's web site. |
| - Statistics for Tissue and Mutation type | Top |
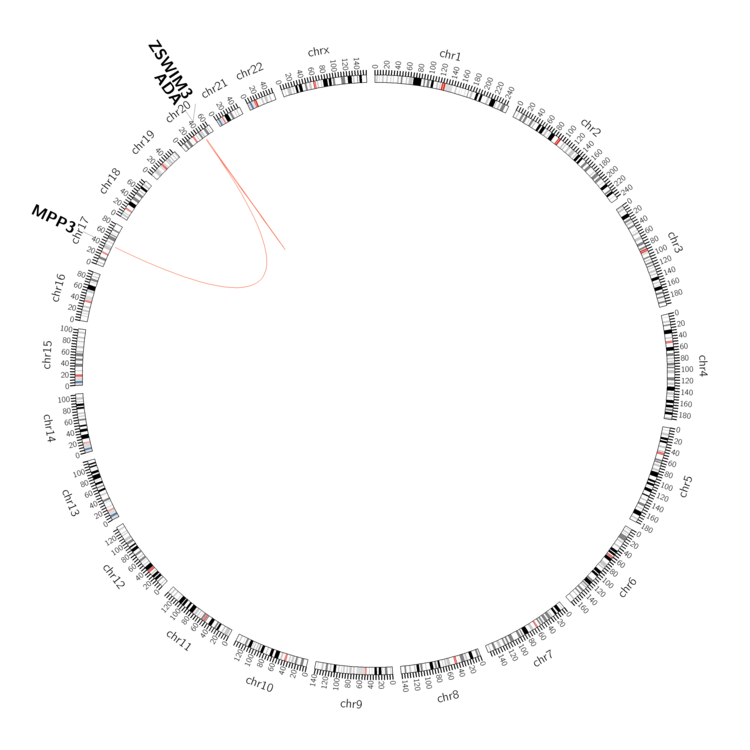 |
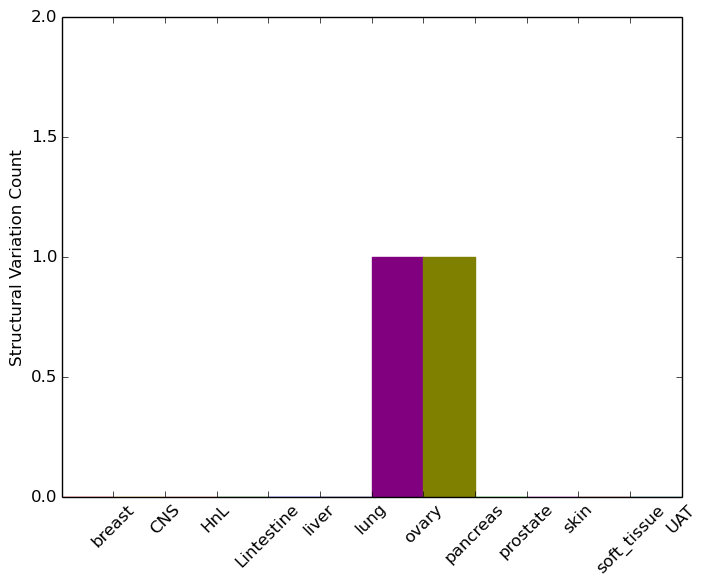
| - For Inter-chromosomal Variations |
| * Inter-chromosomal variantions includes 'interchromosomal amplicon to amplicon', 'interchromosomal amplicon to non-amplified dna', 'interchromosomal insertion', 'Interchromosomal unknown type'. |
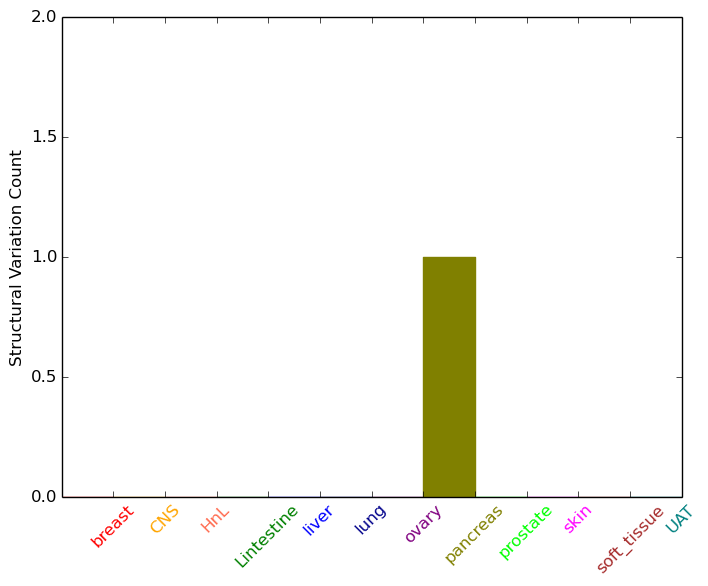 |
| - For Intra-chromosomal Variations |
| * Intra-chromosomal variantions includes 'intrachromosomal amplicon to amplicon', 'intrachromosomal amplicon to non-amplified dna', 'intrachromosomal deletion', 'intrachromosomal fold-back inversion', 'intrachromosomal inversion', 'intrachromosomal tandem duplication', 'Intrachromosomal unknown type', 'intrachromosomal with inverted orientation', 'intrachromosomal with non-inverted orientation'. |
 |
| Sample | Symbol_a | Chr_a | Start_a | End_a | Symbol_b | Chr_b | Start_b | End_b |
| ovary | ADA | chr20 | 43254899 | 43254919 | ADA | chr20 | 43255058 | 43255078 |
| pancreas | ADA | chr20 | 43273246 | 43273266 | ZSWIM3 | chr20 | 44488405 | 44488425 |
| cf) Tissue number; Tissue name (1;Breast, 2;Central_nervous_system, 3;Haematopoietic_and_lymphoid_tissue, 4;Large_intestine, 5;Liver, 6;Lung, 7;Ovary, 8;Pancreas, 9;Prostate, 10;Skin, 11;Soft_tissue, 12;Upper_aerodigestive_tract) |
| * From mRNA Sanger sequences, Chitars2.0 arranged chimeric transcripts. This table shows ADA related fusion information. |
| ID | Head Gene | Tail Gene | Accession | Gene_a | qStart_a | qEnd_a | Chromosome_a | tStart_a | tEnd_a | Gene_a | qStart_a | qEnd_a | Chromosome_a | tStart_a | tEnd_a |
| AW085123 | KIAA0430 | 172 | 201 | 16 | 15705035 | 15705064 | ADA | 182 | 204 | 20 | 43266946 | 43266968 | |
| Top |
| Mutation type/ Tissue ID | brca | cns | cerv | endome | haematopo | kidn | Lintest | liver | lung | ns | ovary | pancre | prost | skin | stoma | thyro | urina | |||
| Total # sample | 1 | 2 | 2 | |||||||||||||||||
| GAIN (# sample) | 1 | 2 | 2 | |||||||||||||||||
| LOSS (# sample) |
| cf) Tissue ID; Tissue type (1; Breast, 2; Central_nervous_system, 3; Cervix, 4; Endometrium, 5; Haematopoietic_and_lymphoid_tissue, 6; Kidney, 7; Large_intestine, 8; Liver, 9; Lung, 10; NS, 11; Ovary, 12; Pancreas, 13; Prostate, 14; Skin, 15; Stomach, 16; Thyroid, 17; Urinary_tract) |
| Top |
|
 |
| Top |
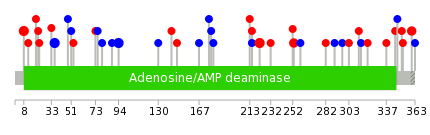
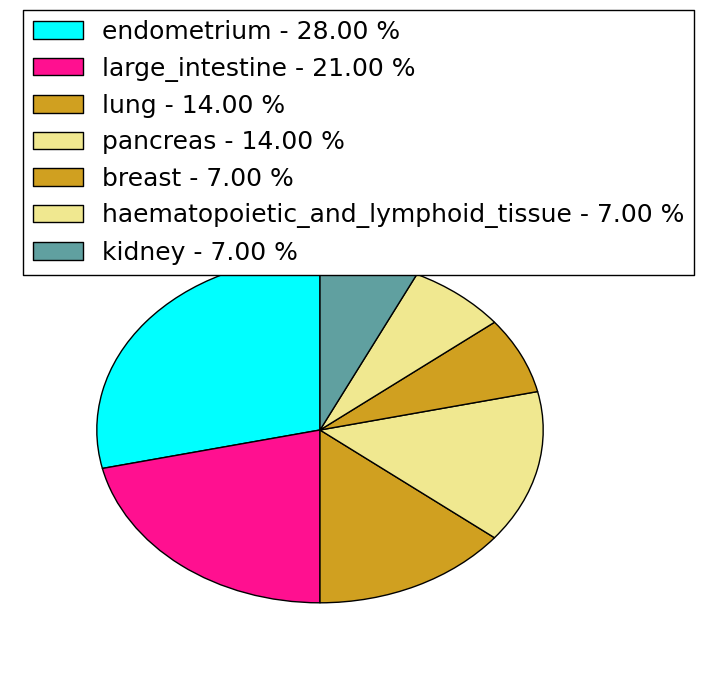
| Stat. for Non-Synonymous SNVs (# total SNVs=21) | (# total SNVs=14) |
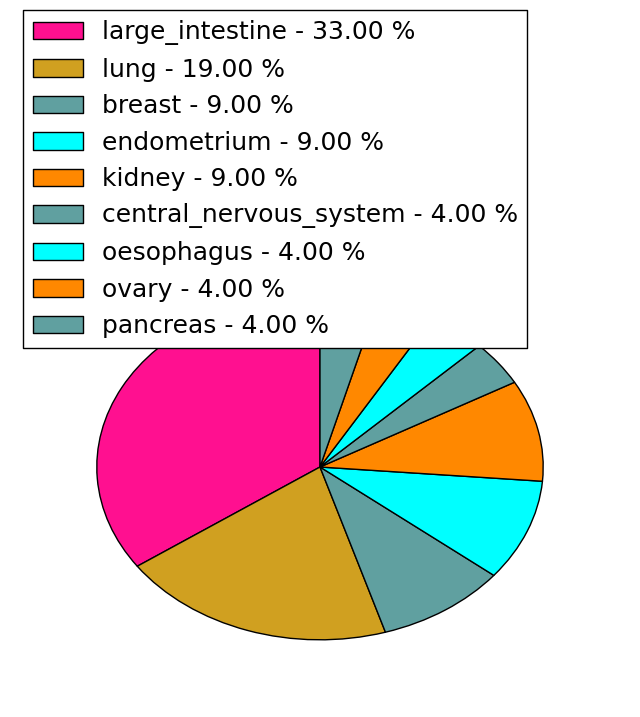 |  |
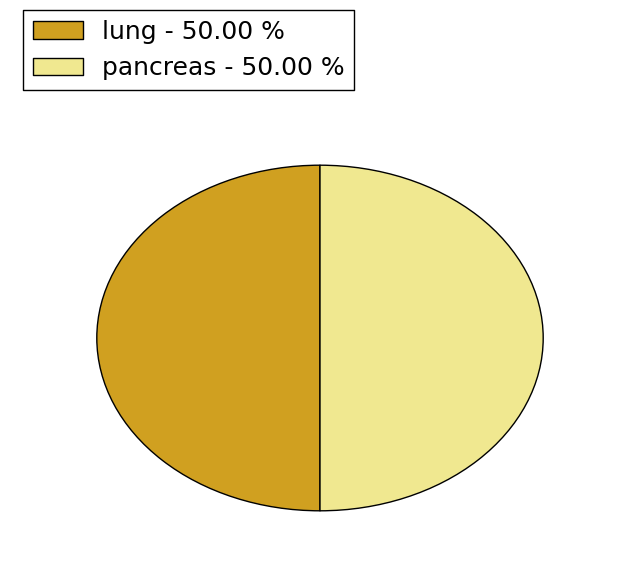
(# total SNVs=2) | (# total SNVs=0) |
 |
| Top |
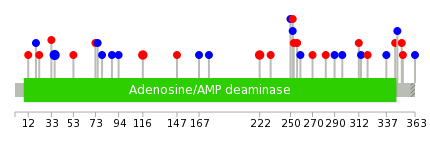
| * When you move the cursor on each content, you can see more deailed mutation information on the Tooltip. Those are primary_site,primary_histology,mutation(aa),pubmedID. |
| GRCh37 position | Mutation(aa) | Unique sampleID count |
| chr20:43251662-43251662 | p.E222K | 3 |
| chr20:43257798-43257798 | p.I36I | 3 |
| chr20:43280227-43280227 | p.D8N | 3 |
| chr20:43248488-43248488 | p.G360E | 2 |
| chr20:43264866-43264866 | p.? | 2 |
| chr20:43251728-43251728 | p.? | 2 |
| chr20:43255177-43255177 | p.G94G | 2 |
| chr20:43251493-43251493 | p.R253W | 2 |
| chr20:43254263-43254263 | p.R142Q | 1 |
| chr20:43249764-43249764 | p.Y290Y | 1 |
| Top |
|
 |
| Point Mutation/ Tissue ID | 1 | 2 | 3 | 4 | 5 | 6 | 7 | 8 | 9 | 10 | 11 | 12 | 13 | 14 | 15 | 16 | 17 | 18 | 19 | 20 |
| # sample | 1 | 3 | 6 | 2 | 1 | 1 | 4 | 1 | 1 | 3 | 7 | 5 | ||||||||
| # mutation | 1 | 3 | 7 | 2 | 1 | 1 | 4 | 1 | 1 | 3 | 7 | 5 | ||||||||
| nonsynonymous SNV | 2 | 5 | 1 | 1 | 2 | 1 | 1 | 1 | 4 | 1 | ||||||||||
| synonymous SNV | 1 | 1 | 3 | 1 | 1 | 2 | 2 | 3 | 4 |
| cf) Tissue ID; Tissue type (1; BLCA[Bladder Urothelial Carcinoma], 2; BRCA[Breast invasive carcinoma], 3; CESC[Cervical squamous cell carcinoma and endocervical adenocarcinoma], 4; COAD[Colon adenocarcinoma], 5; GBM[Glioblastoma multiforme], 6; Glioma Low Grade, 7; HNSC[Head and Neck squamous cell carcinoma], 8; KICH[Kidney Chromophobe], 9; KIRC[Kidney renal clear cell carcinoma], 10; KIRP[Kidney renal papillary cell carcinoma], 11; LAML[Acute Myeloid Leukemia], 12; LUAD[Lung adenocarcinoma], 13; LUSC[Lung squamous cell carcinoma], 14; OV[Ovarian serous cystadenocarcinoma ], 15; PAAD[Pancreatic adenocarcinoma], 16; PRAD[Prostate adenocarcinoma], 17; SKCM[Skin Cutaneous Melanoma], 18:STAD[Stomach adenocarcinoma], 19:THCA[Thyroid carcinoma], 20:UCEC[Uterine Corpus Endometrial Carcinoma]) |
| Top |
| * We represented just top 10 SNVs. When you move the cursor on each content, you can see more deailed mutation information on the Tooltip. Those are primary_site, primary_histology, mutation(aa), pubmedID. |
| Genomic Position | Mutation(aa) | Unique sampleID count |
| chr20:43257798 | p.I36I | 3 |
| chr20:43255112 | p.L252M | 2 |
| chr20:43251496 | p.E222K | 2 |
| chr20:43251662 | p.P116H | 2 |
| chr20:43249743 | p.R282W | 1 |
| chr20:43252921 | p.C75C | 1 |
| chr20:43257807 | p.G270V | 1 |
| chr20:43249764 | p.A73T | 1 |
| chr20:43252948 | p.F259F | 1 |
| chr20:43248478 | p.D53Y | 1 |
| * Copy number data were extracted from TCGA using R package TCGA-Assembler. The URLs of all public data files on TCGA DCC data server were gathered on Jan-05-2015. Function ProcessCNAData in TCGA-Assembler package was used to obtain gene-level copy number value which is calculated as the average copy number of the genomic region of a gene. |
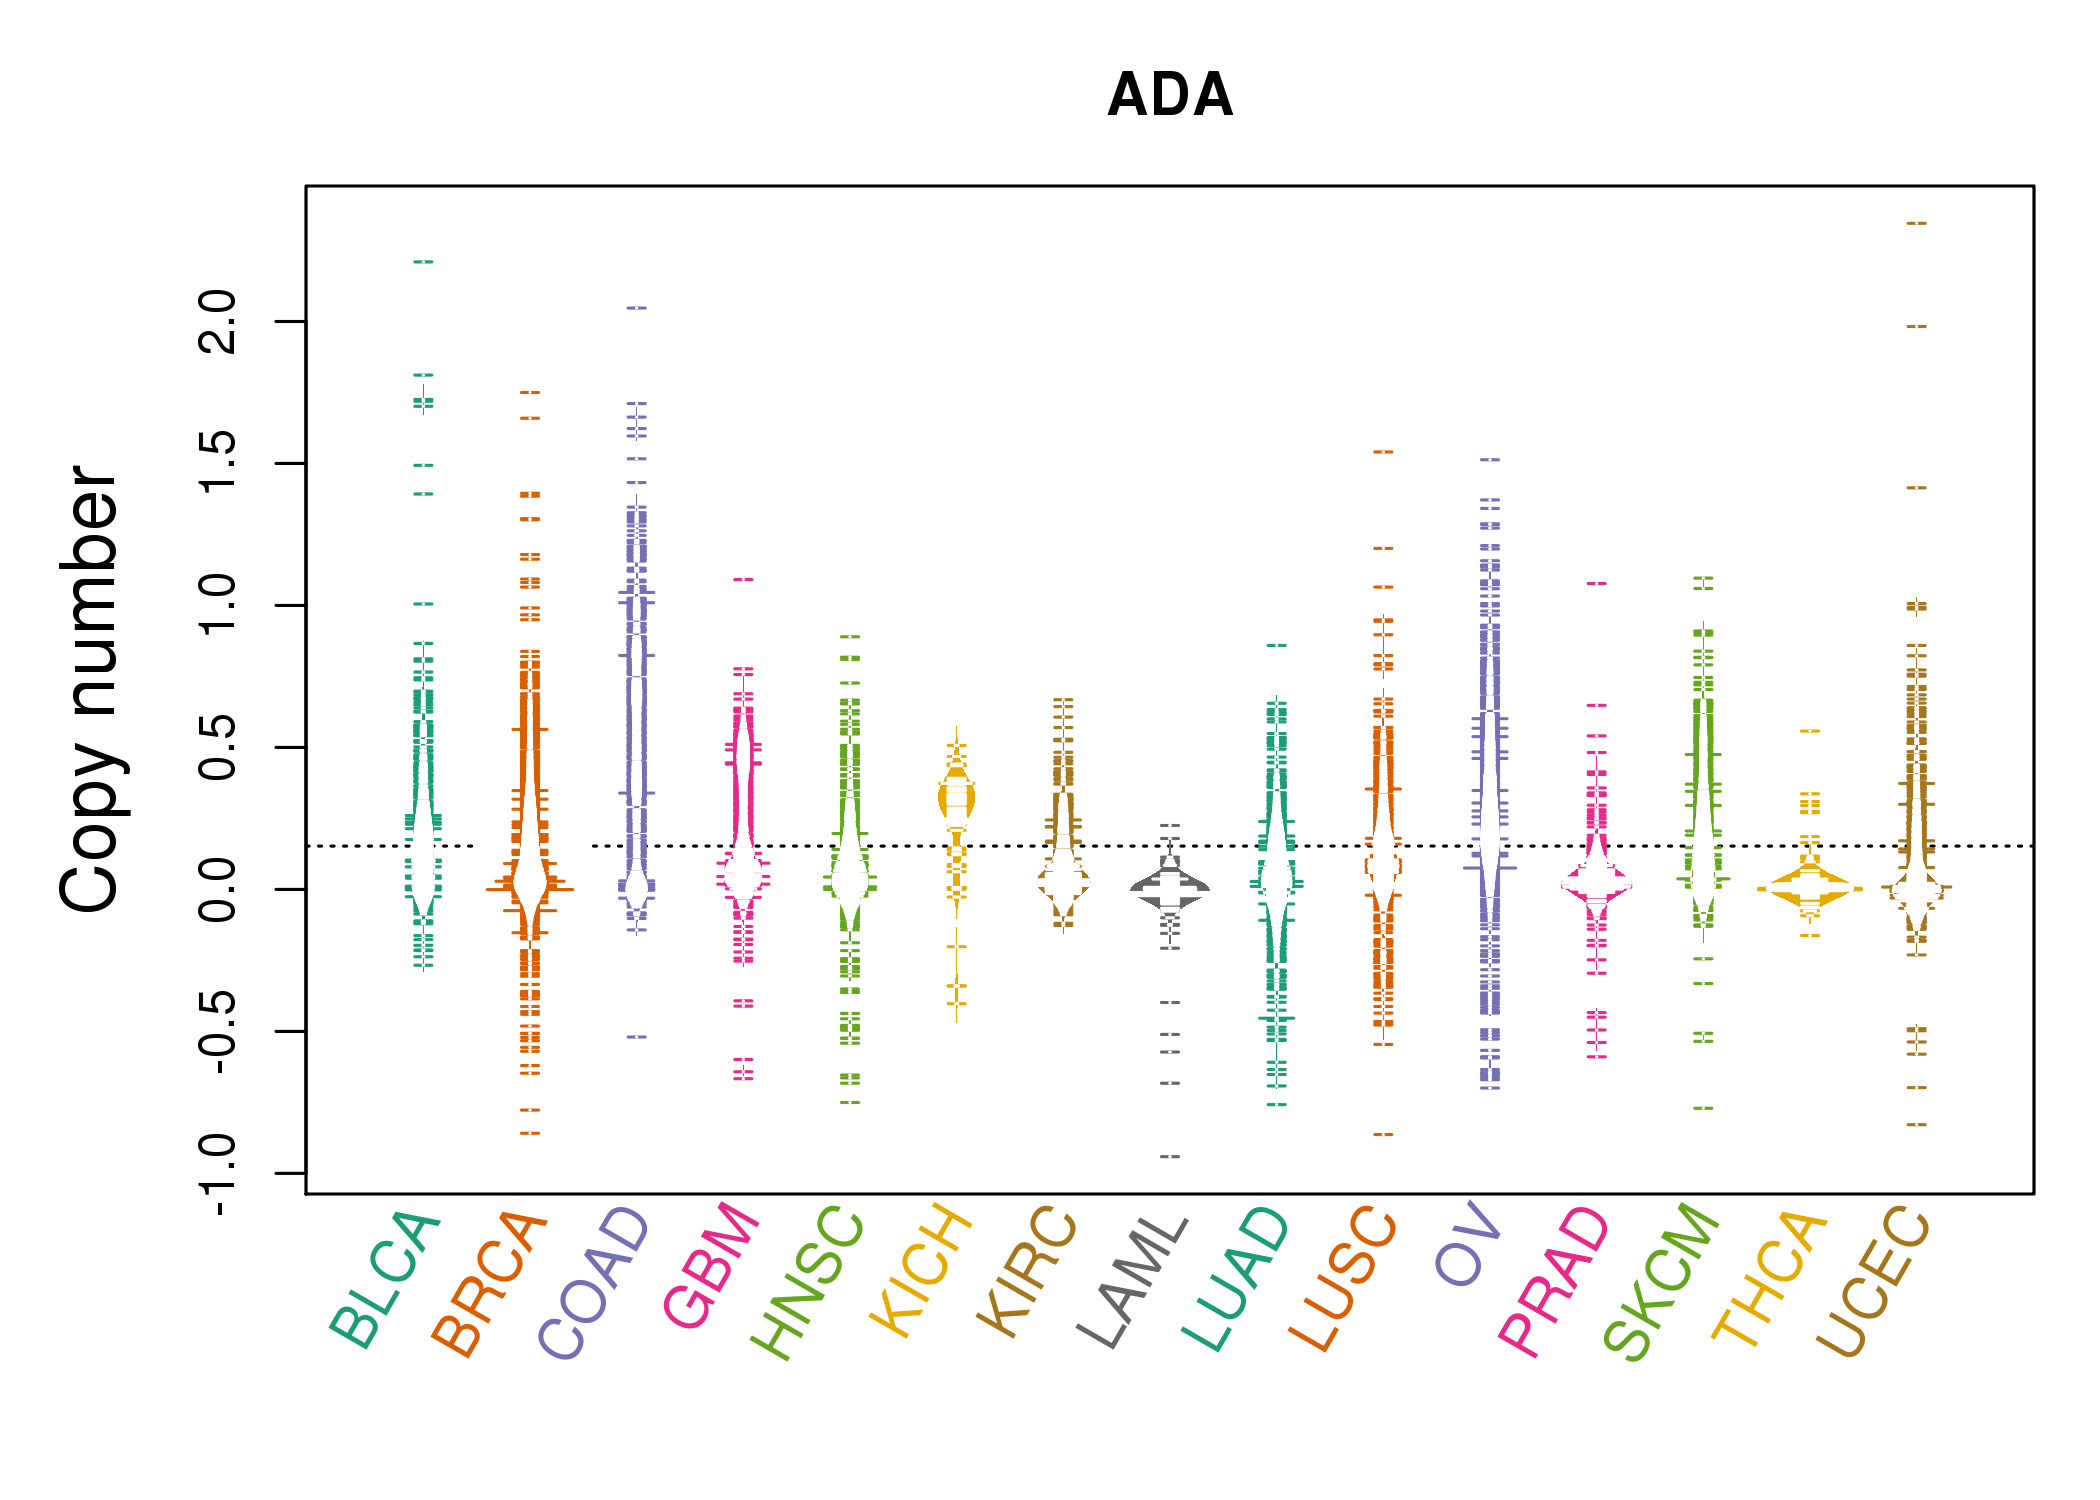 |
| cf) Tissue ID[Tissue type]: BLCA[Bladder Urothelial Carcinoma], BRCA[Breast invasive carcinoma], CESC[Cervical squamous cell carcinoma and endocervical adenocarcinoma], COAD[Colon adenocarcinoma], GBM[Glioblastoma multiforme], Glioma Low Grade, HNSC[Head and Neck squamous cell carcinoma], KICH[Kidney Chromophobe], KIRC[Kidney renal clear cell carcinoma], KIRP[Kidney renal papillary cell carcinoma], LAML[Acute Myeloid Leukemia], LUAD[Lung adenocarcinoma], LUSC[Lung squamous cell carcinoma], OV[Ovarian serous cystadenocarcinoma ], PAAD[Pancreatic adenocarcinoma], PRAD[Prostate adenocarcinoma], SKCM[Skin Cutaneous Melanoma], STAD[Stomach adenocarcinoma], THCA[Thyroid carcinoma], UCEC[Uterine Corpus Endometrial Carcinoma] |
| Top |
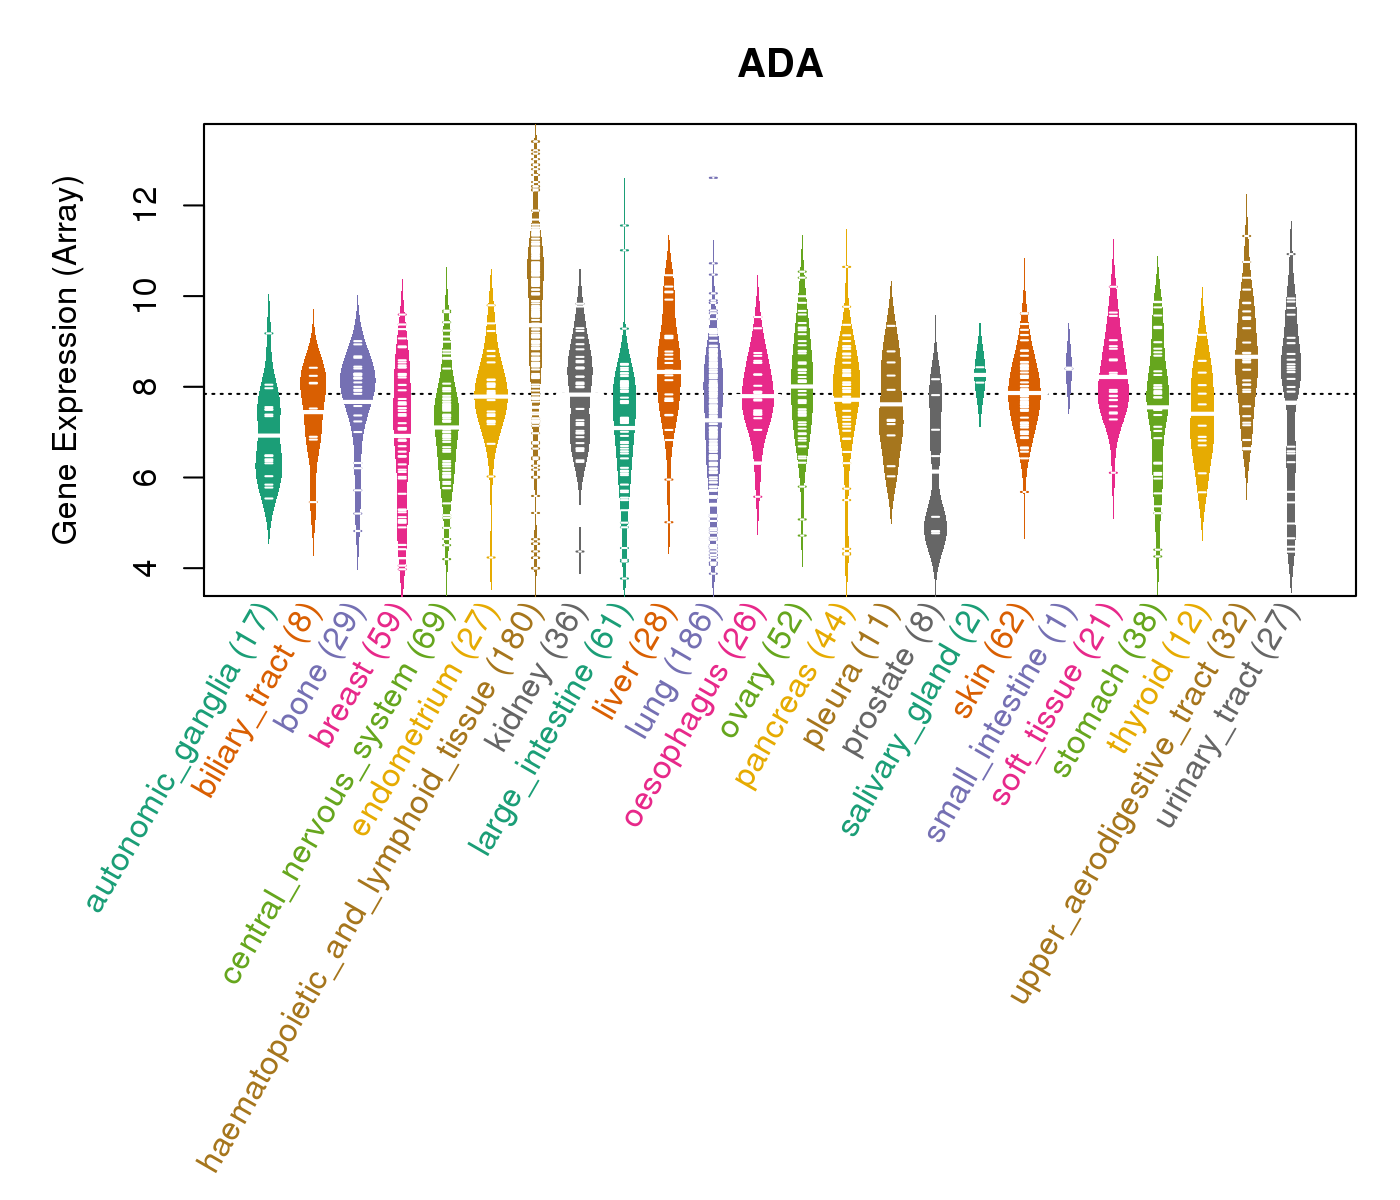
| Gene Expression for ADA |
| * CCLE gene expression data were extracted from CCLE_Expression_Entrez_2012-10-18.res: Gene-centric RMA-normalized mRNA expression data. |
 |
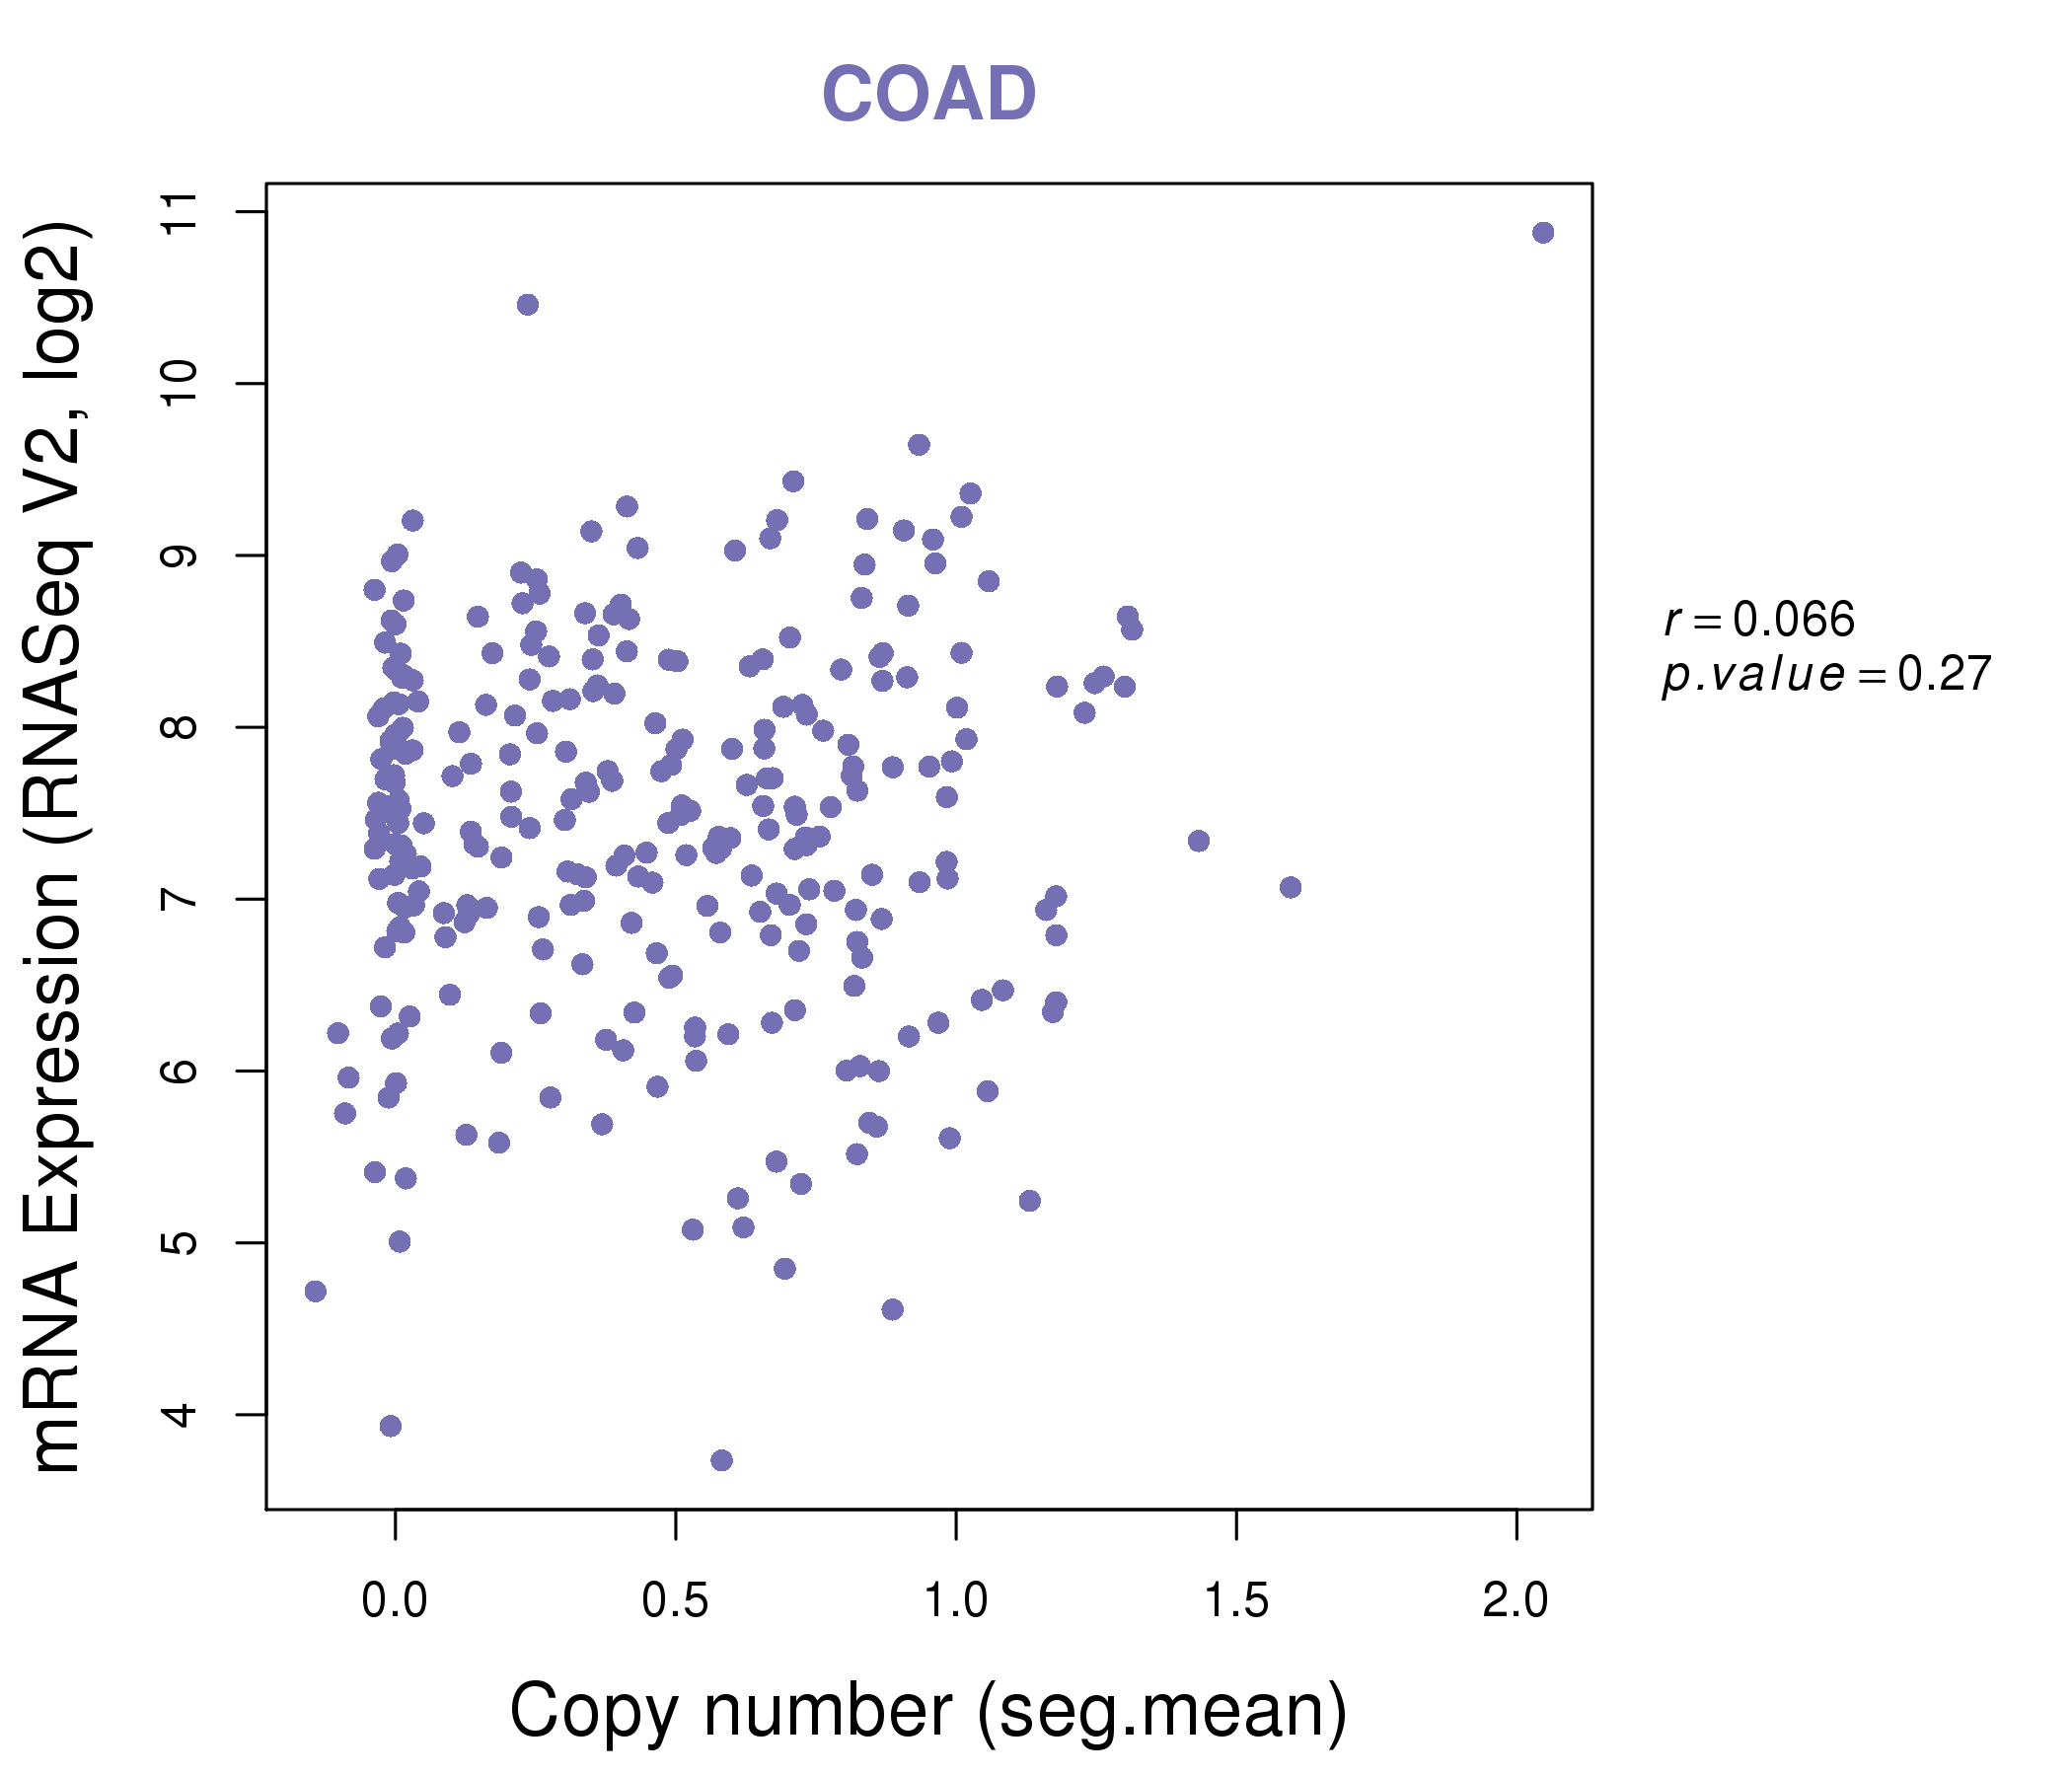
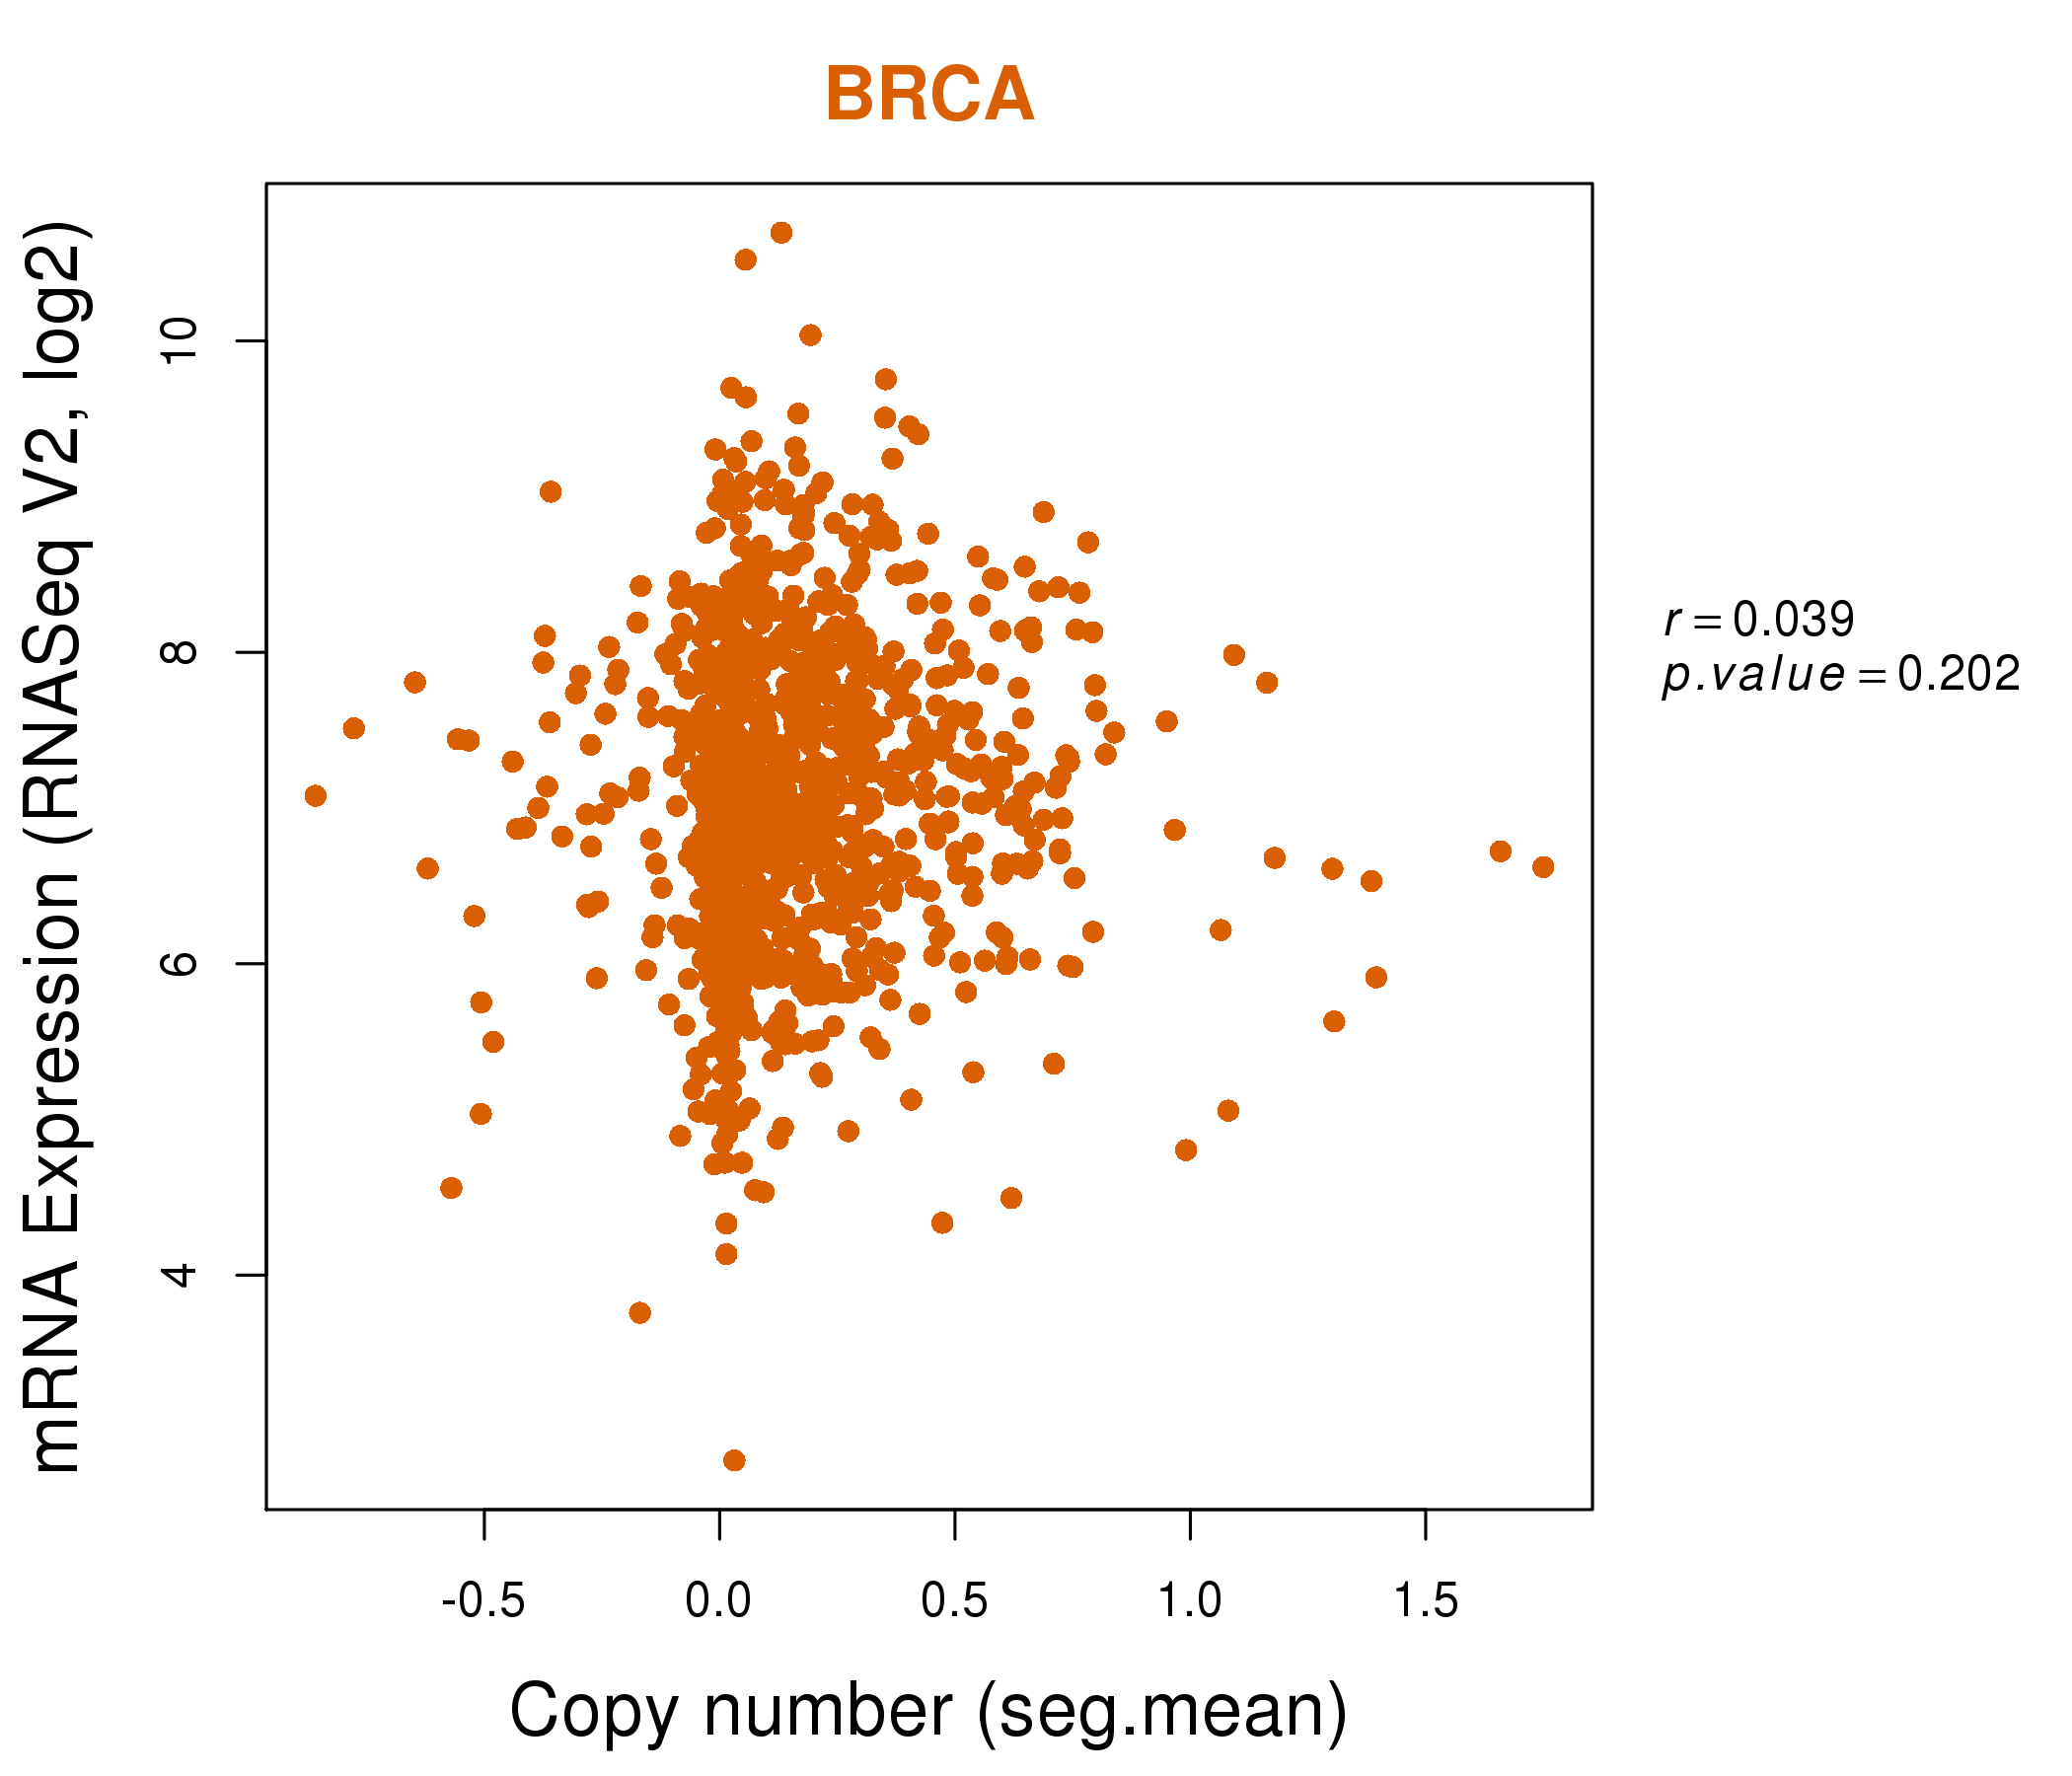
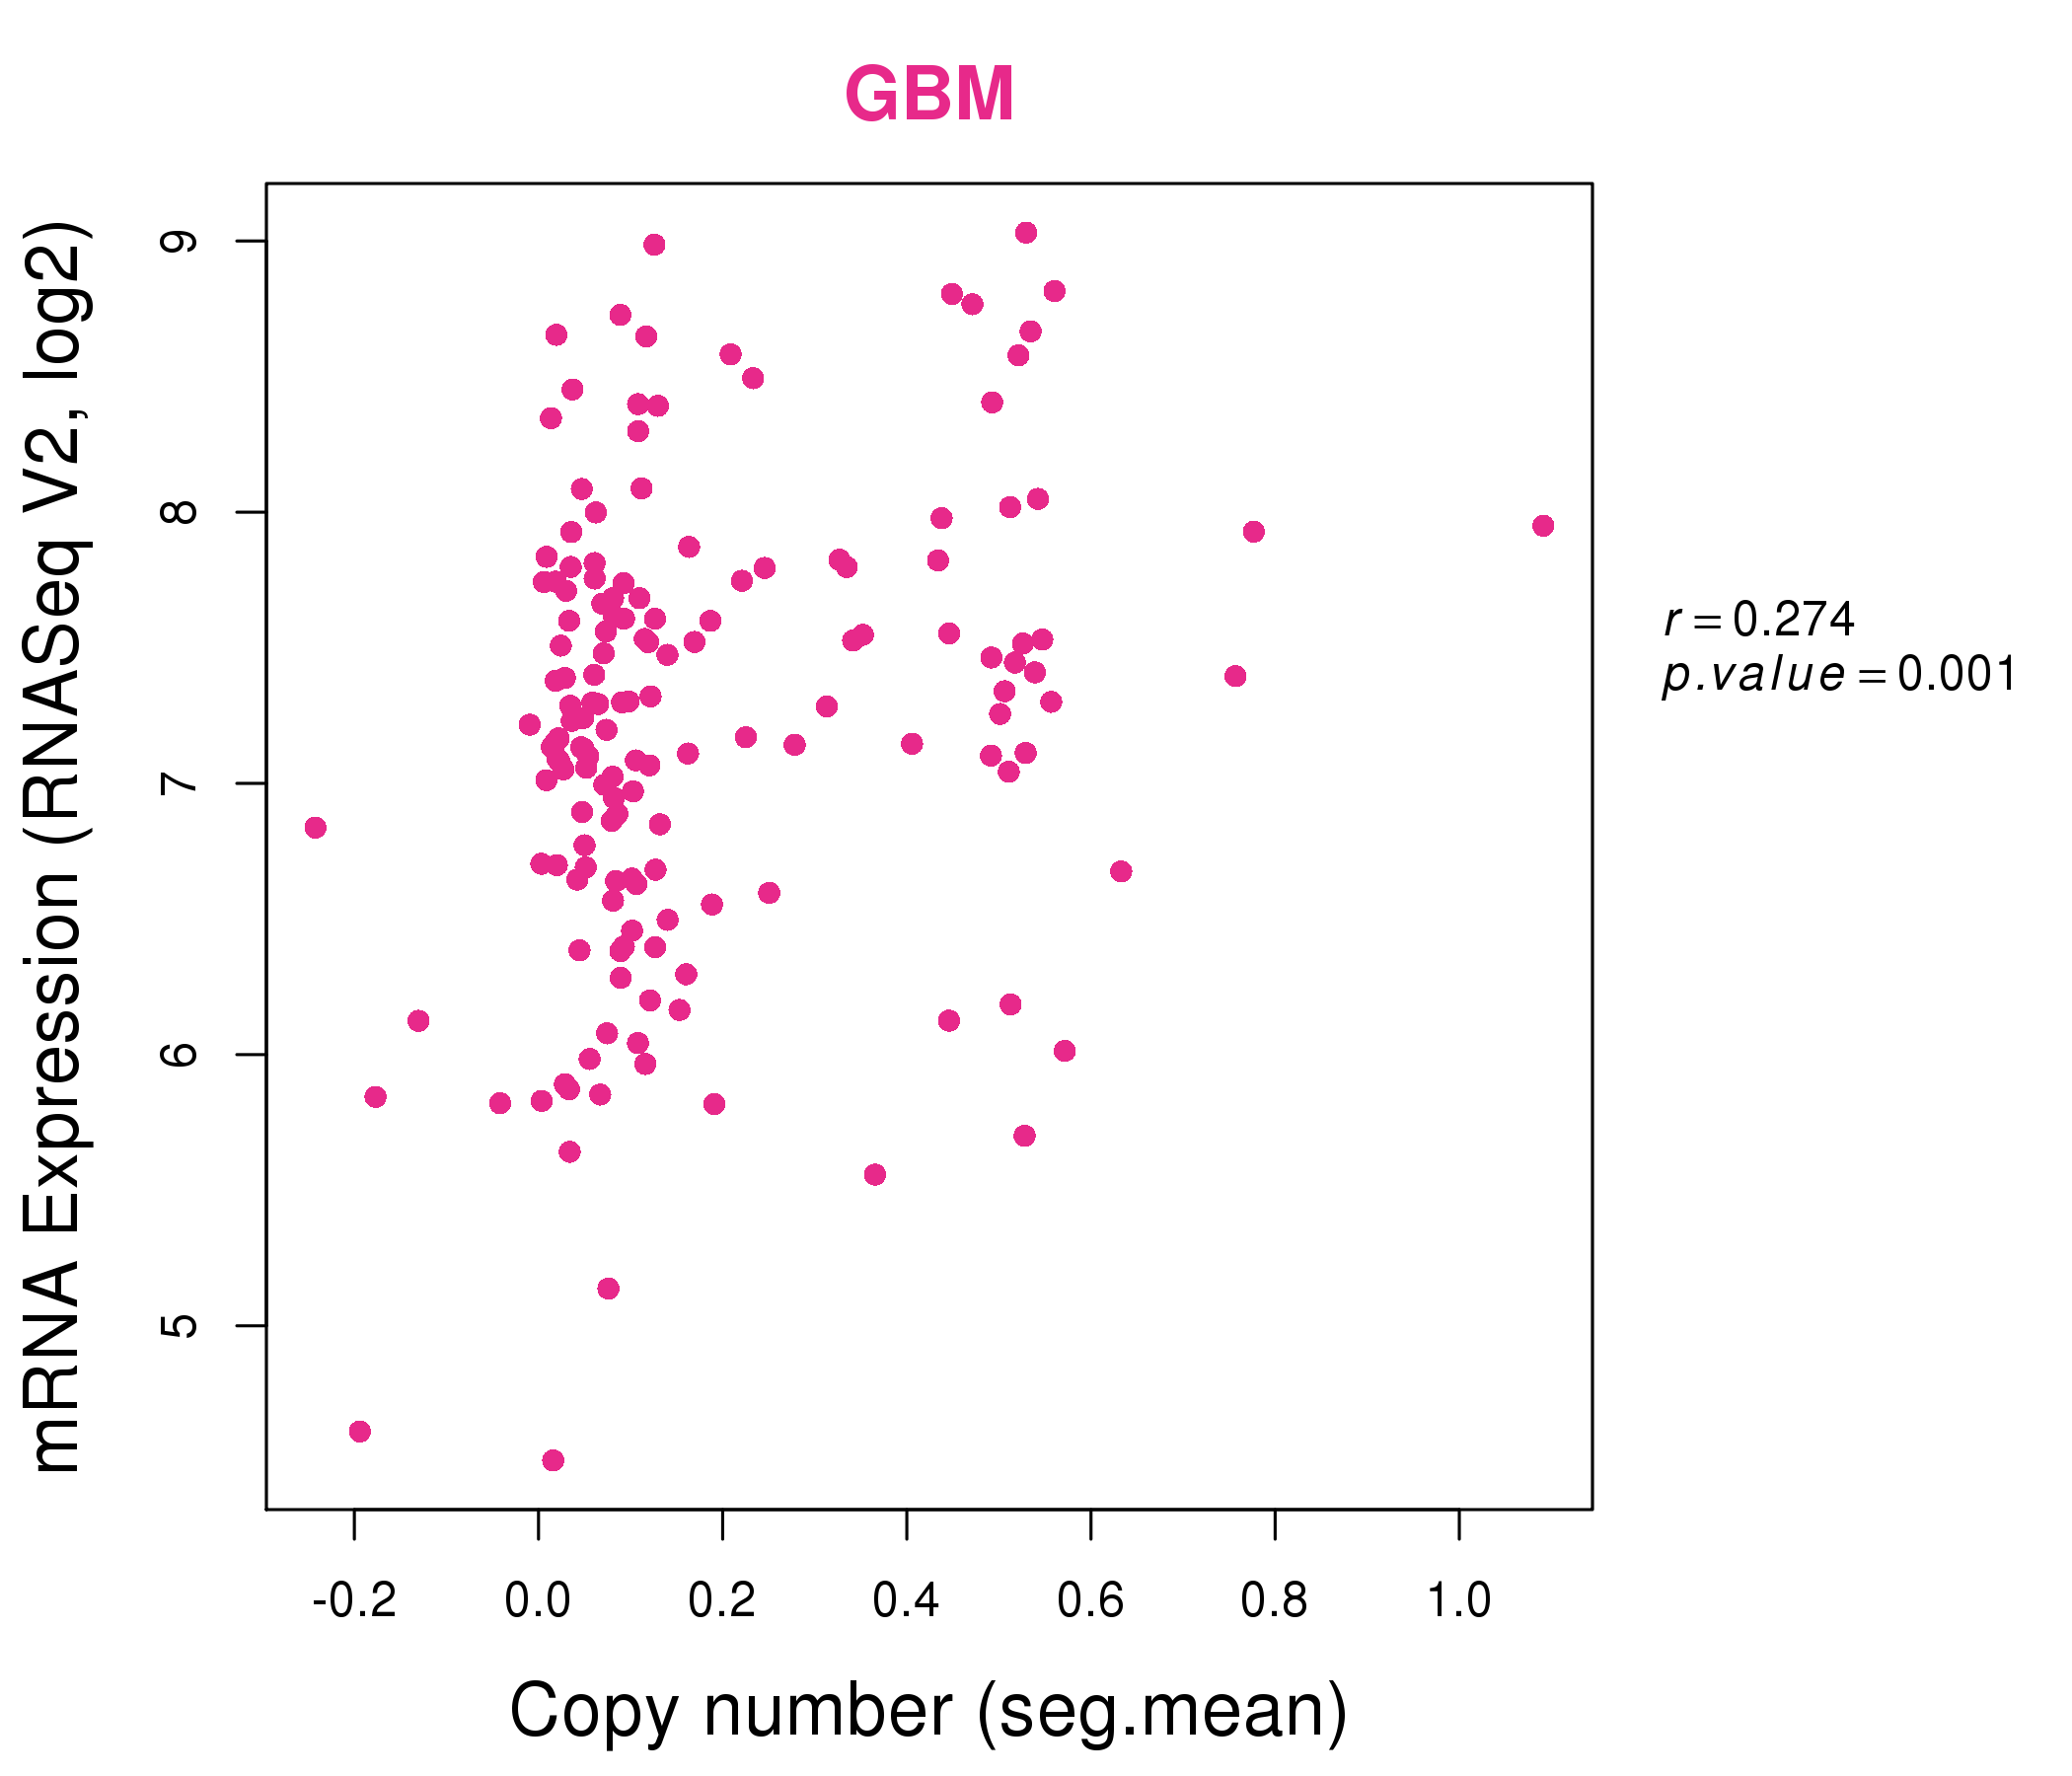
| * Normalized gene expression data of RNASeqV2 was extracted from TCGA using R package TCGA-Assembler. The URLs of all public data files on TCGA DCC data server were gathered at Jan-05-2015. Only eight cancer types have enough normal control samples for differential expression analysis. (t test, adjusted p<0.05 (using Benjamini-Hochberg FDR)) |
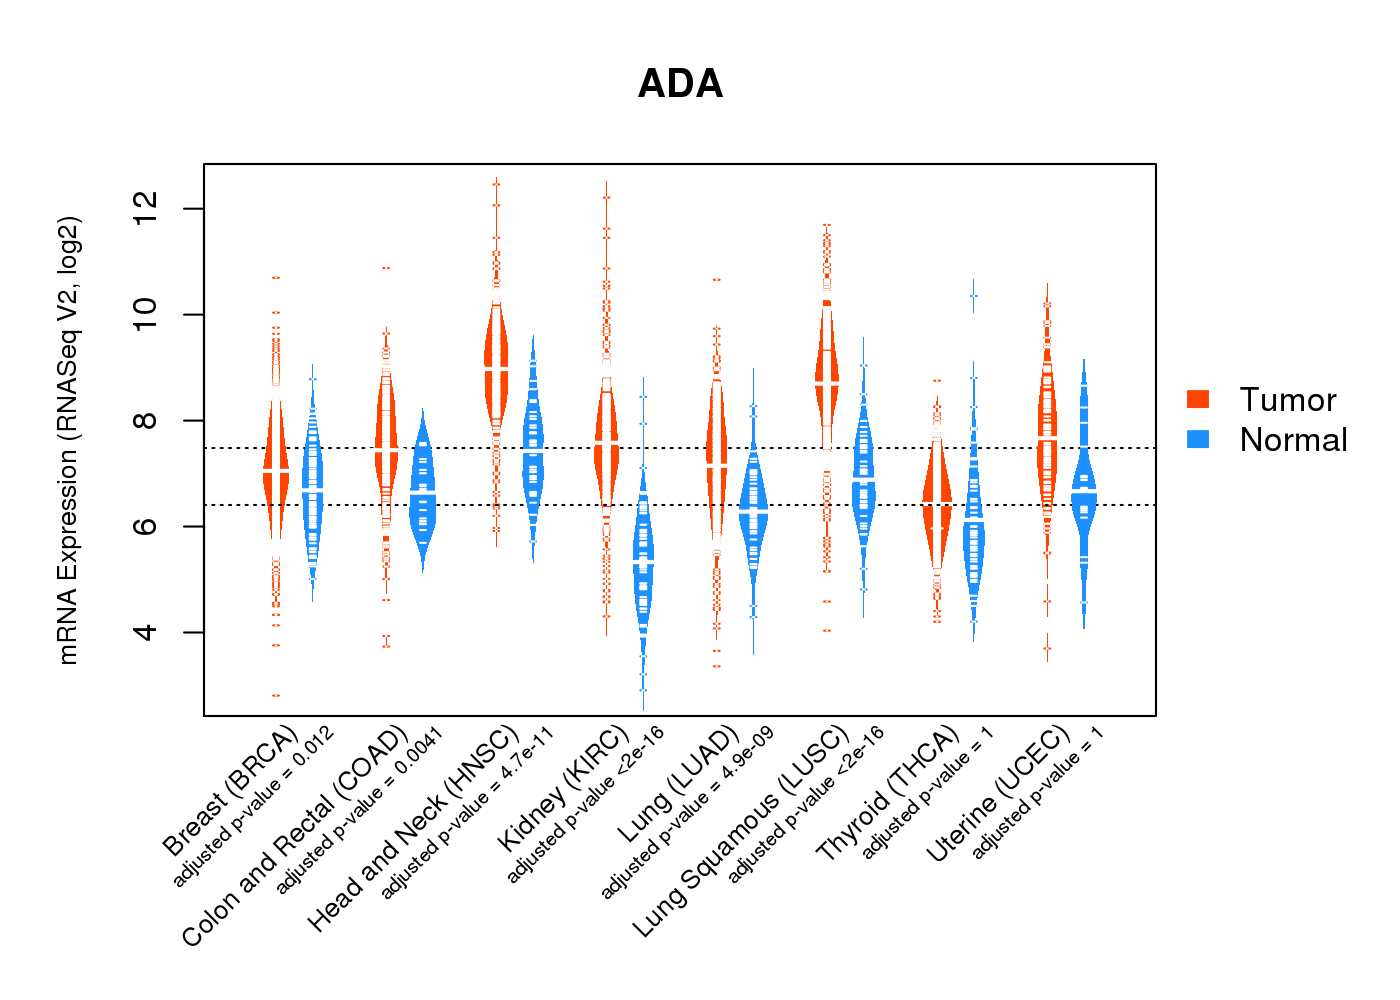 |
| Top |
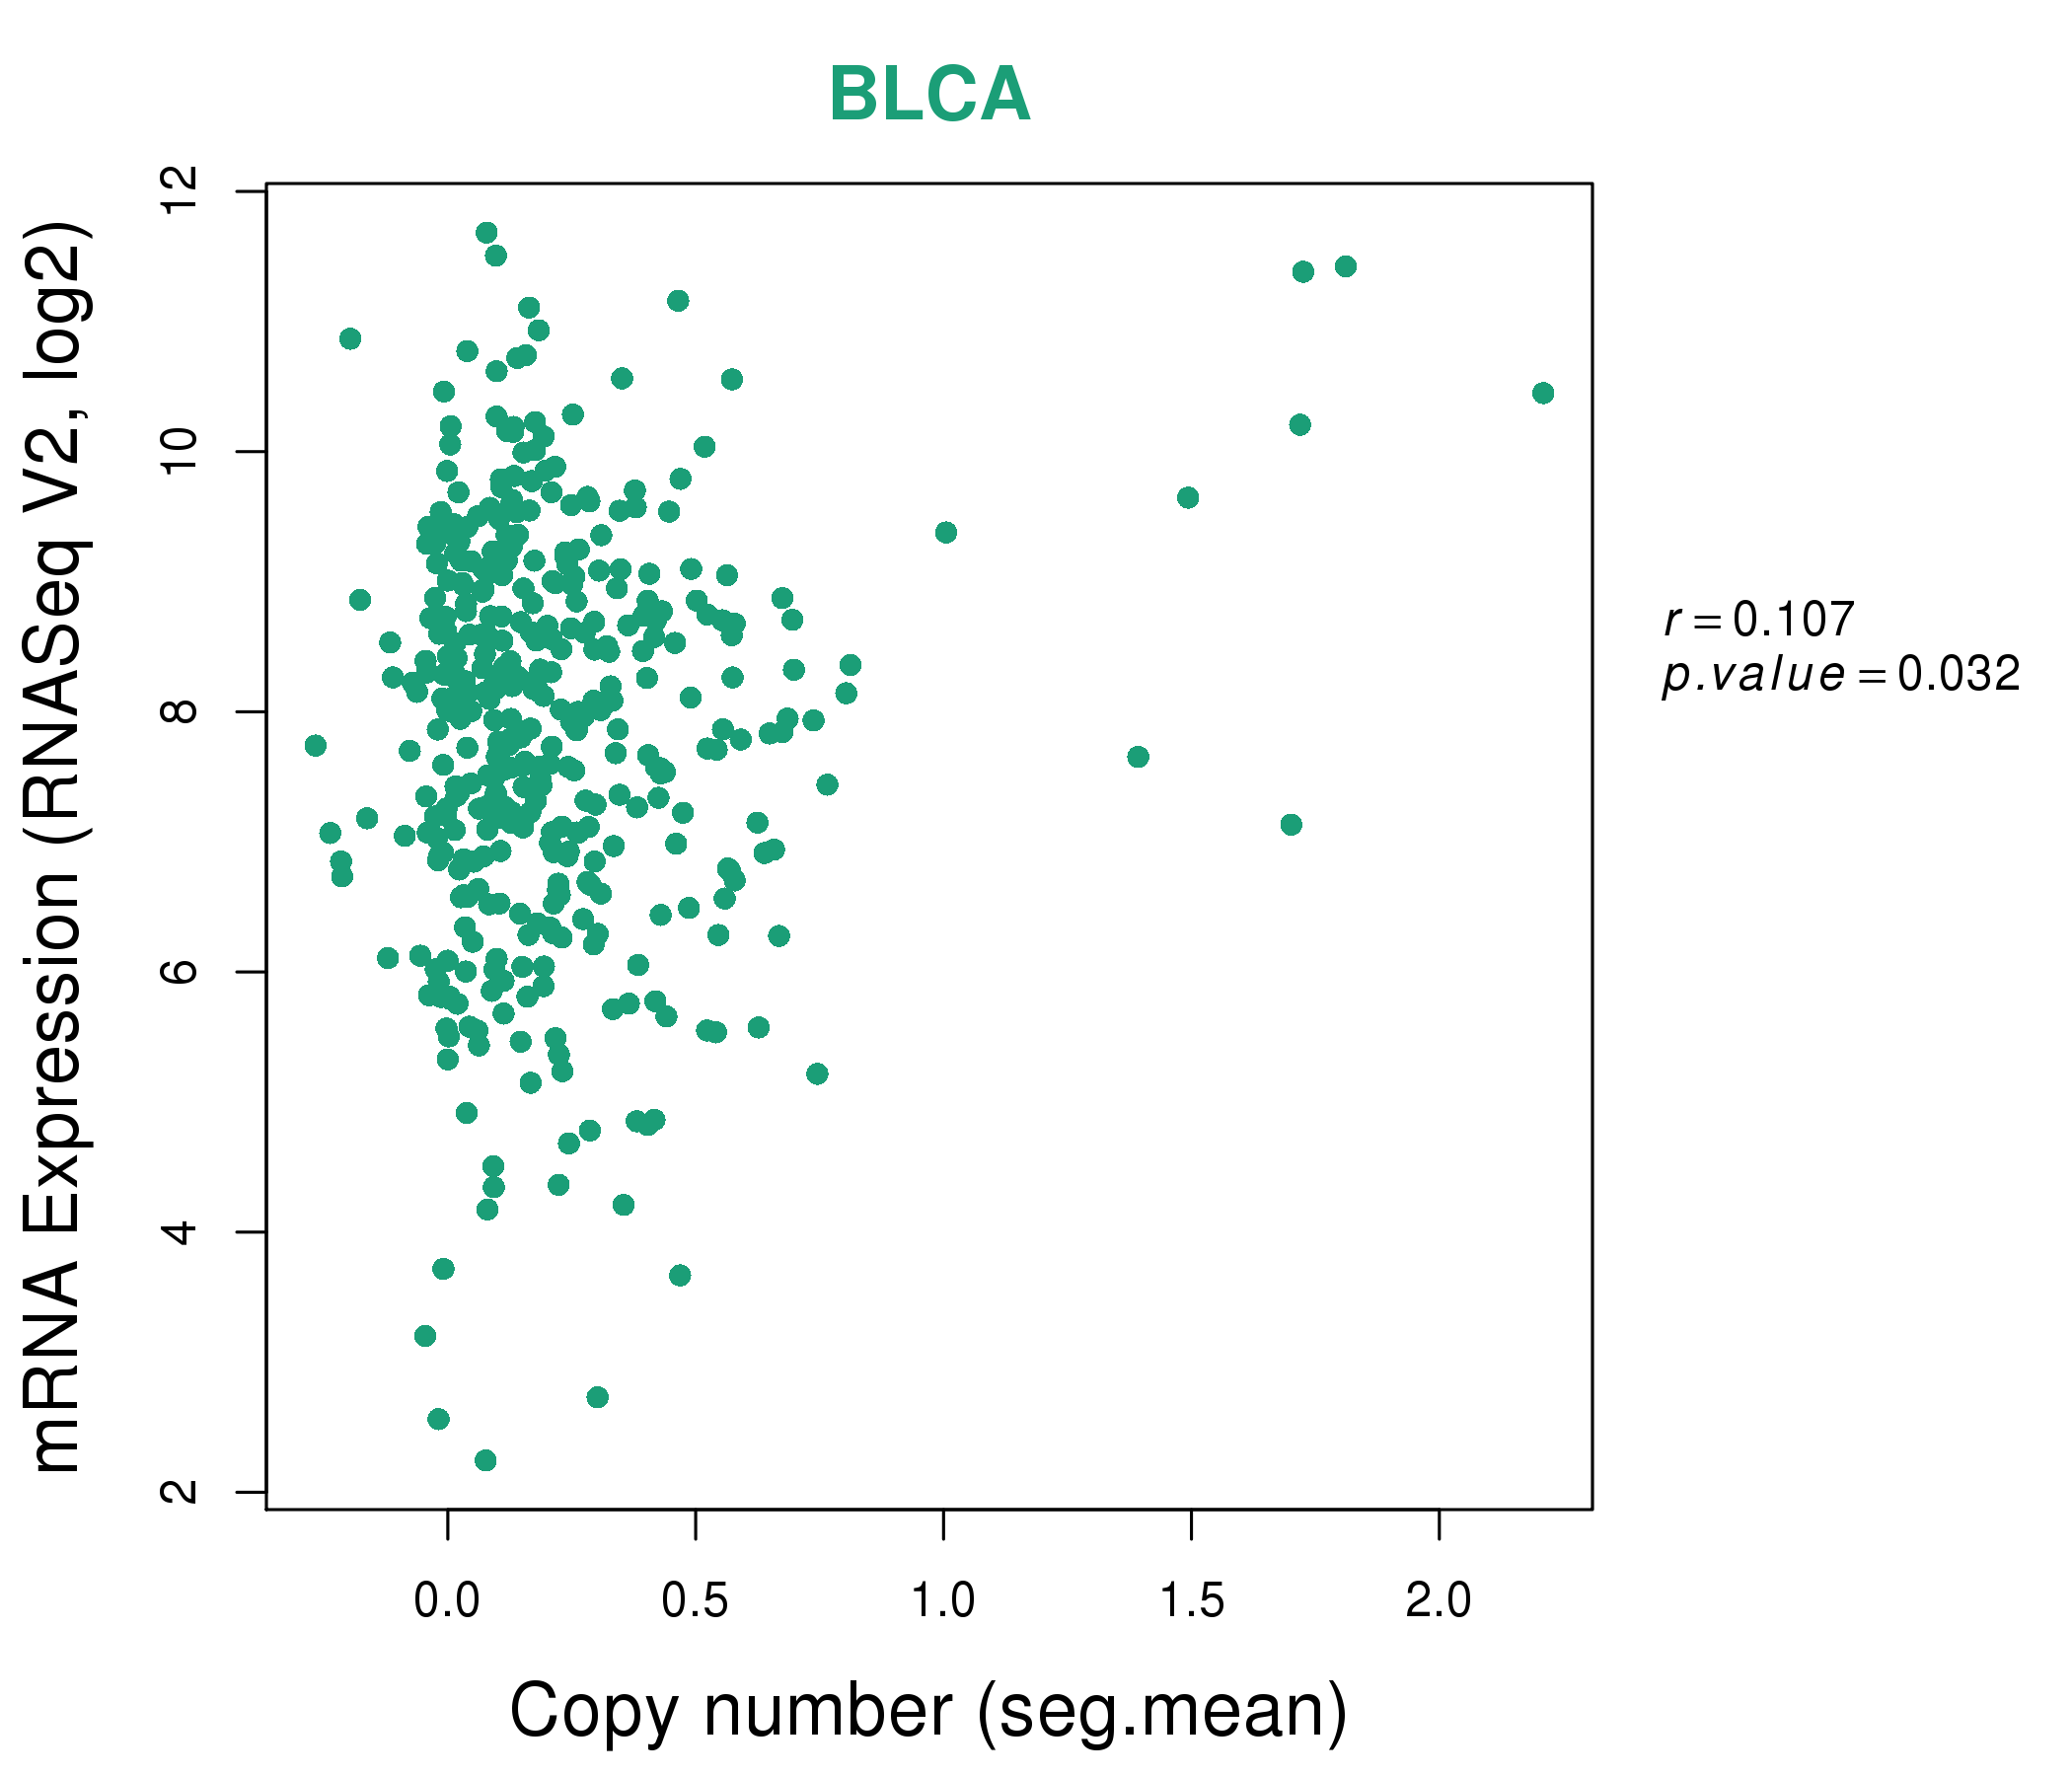
| * This plots show the correlation between CNV and gene expression. |
: Open all plots for all cancer types
 |
|
 |
|
| Top |
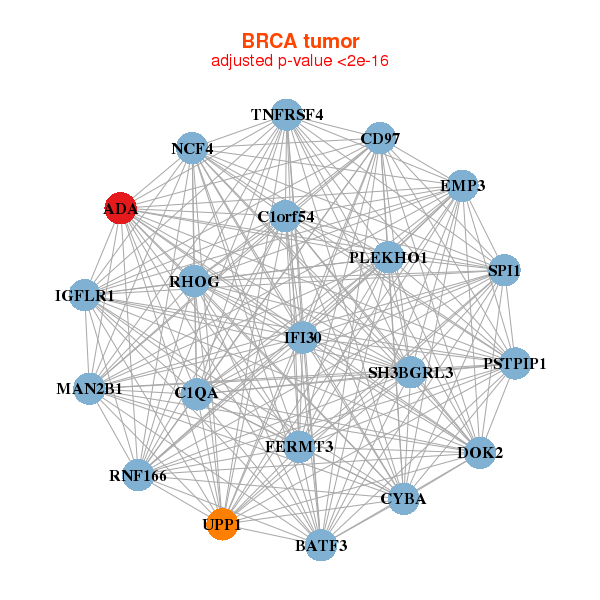
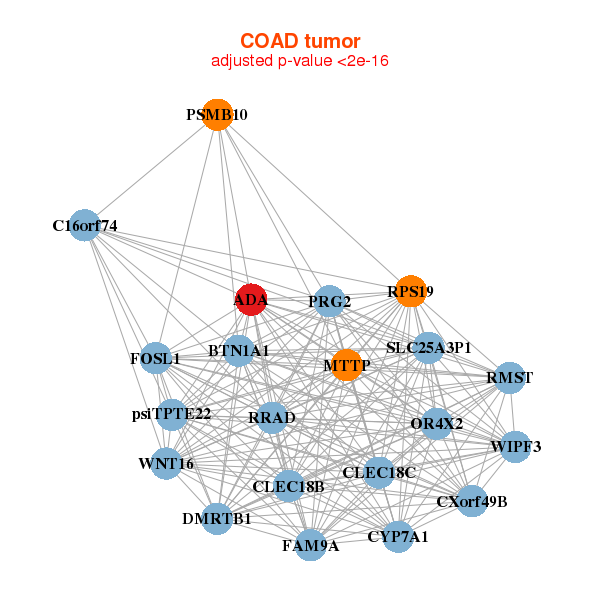
| Gene-Gene Network Information |
| * Co-Expression network figures were drawn using R package igraph. Only the top 20 genes with the highest correlations were shown. Red circle: input gene, orange circle: cell metabolism gene, sky circle: other gene |
: Open all plots for all cancer types
 |
| ||||
| ADAL,CASC4,PRIMPOL,CSNK1G3,DCTN4,IQCH,LCMT2, MFAP1,FAN1,MYO5C,BLOC1S6,PPIP5K1,RFX7,RTF1, SPG11,TP53BP1,TUBGCP4,UBE3A,UBR1,VPS39,ZSCAN29 | ACAT1,ADAL,ATPAF1,DLD,ETFDH,MTFR1L,HADHB, KLHL31,NDUFS1,NNT,NRD1,PARK2,PDHX,PHYH, PPP3CB,RRAGD,SOX6,SUCLA2,UBR3,ZAK,ZYG11B | ||||
 |
| ||||
| ADAL,AQR,DPH6,VWA9,COPS2,EIF2AK4,EIF3J, LCMT2,LRRC57,FAN1,NDNL2,PARP16,PDCD7,PEX12, RTF1,TRPM7,TUBGCP5,UBE3A,USP8,ZNF770,ZSCAN29 | ABCA11P,ADAL,AIMP1,ATF1,BRIX1,C1orf109,C5orf28, TRMT13,FAM133B,GNL3,IMMP1L,ITGB3BP,GPALPP1,KRR1, NHP2L1,PIBF1,PRMT3,SNRNP27,TASP1,TMEM182,TRMT12 |
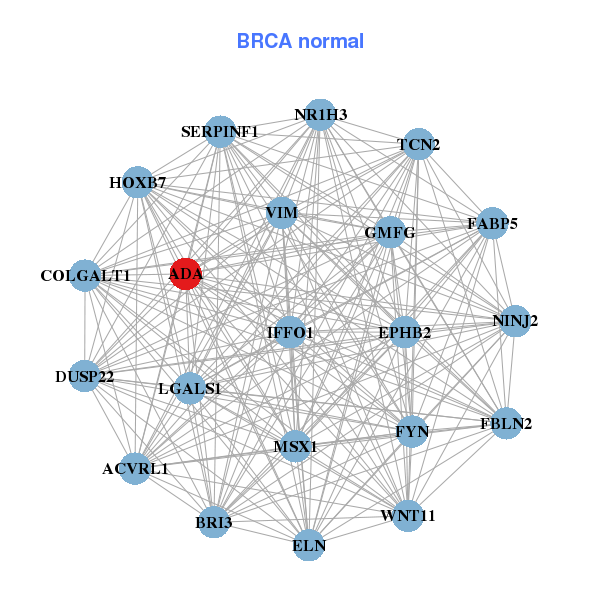
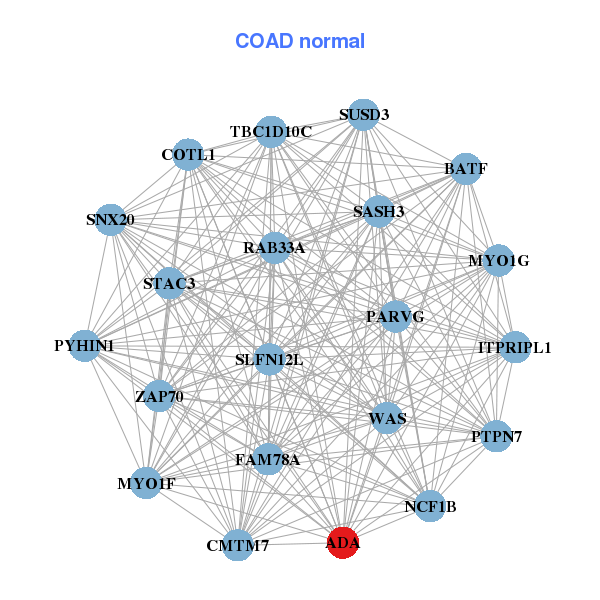
| * Co-Expression network figures were drawn using R package igraph. Only the top 20 genes with the highest correlations were shown. Red circle: input gene, orange circle: cell metabolism gene, sky circle: other gene |
: Open all plots for all cancer types
| Top |
: Open all interacting genes' information including KEGG pathway for all interacting genes from DAVID
| Top |
| Pharmacological Information for ADA |
| DB Category | DB Name | DB's ID and Url link |
| * Gene Centered Interaction Network. |
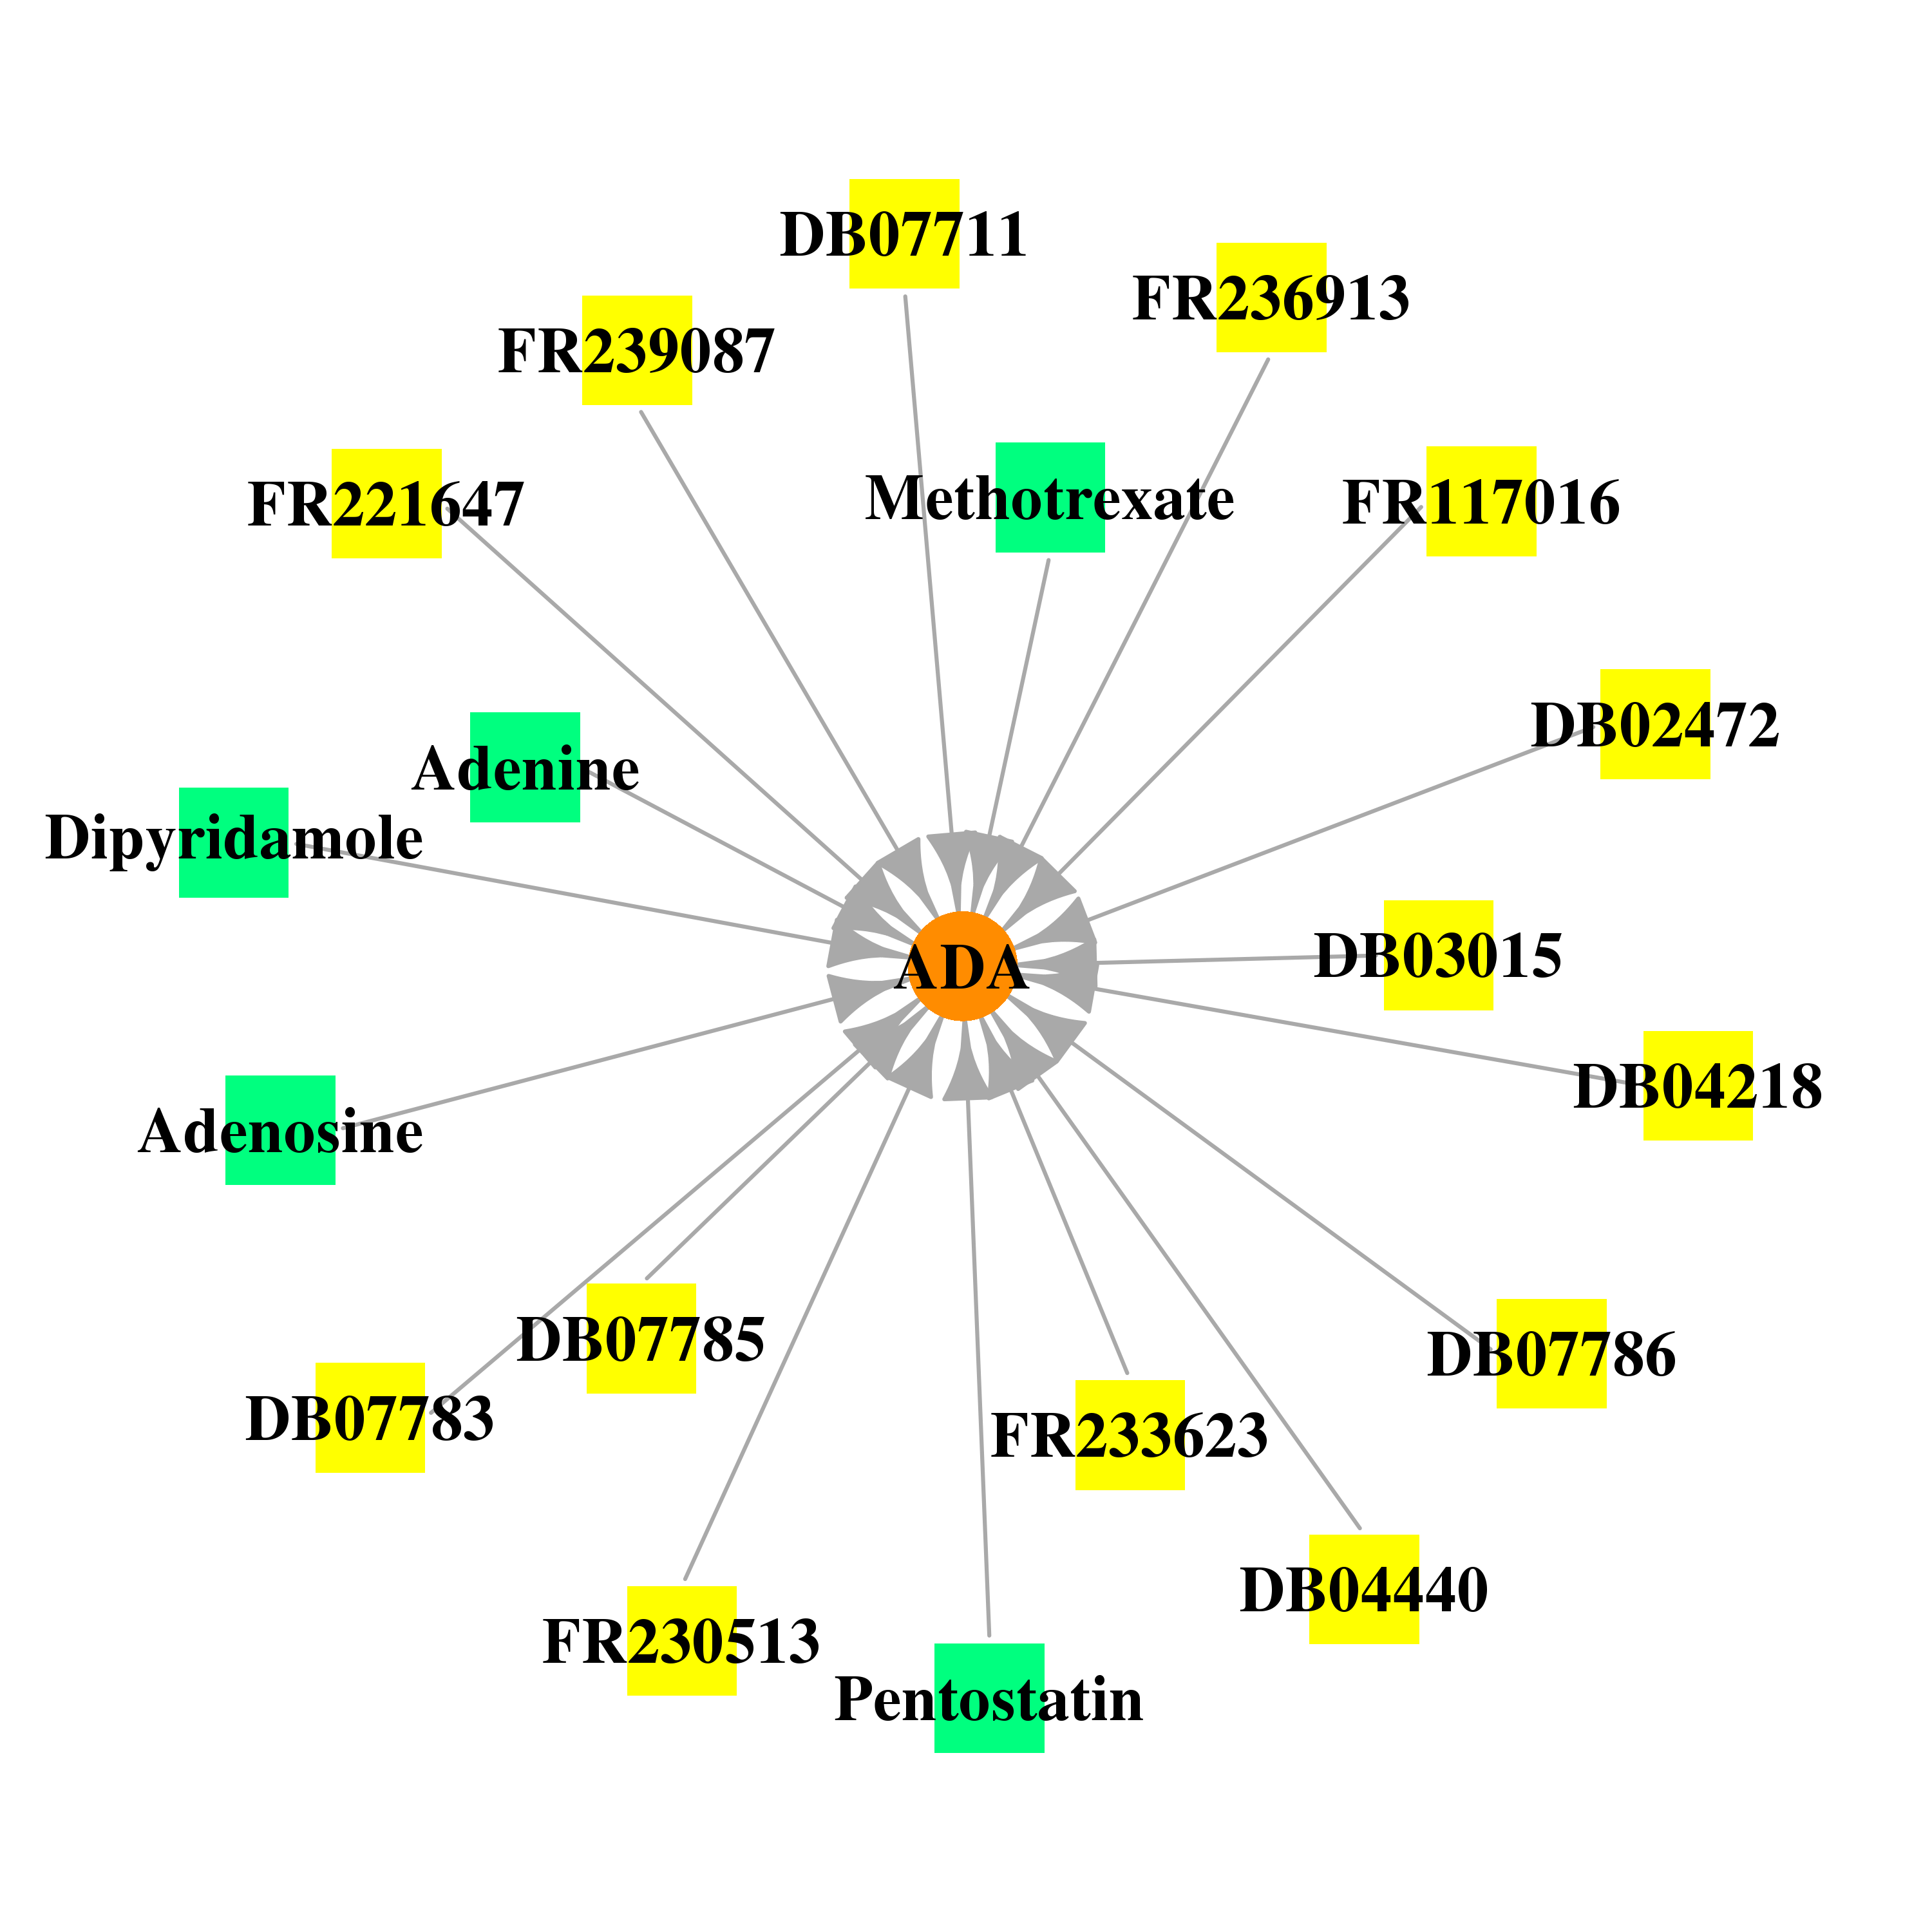 |
| * Drug Centered Interaction Network. |
| DrugBank ID | Target Name | Drug Groups | Generic Name | Drug Centered Network | Drug Structure |
| DB00552 | adenosine deaminase | approved; investigational | Pentostatin | 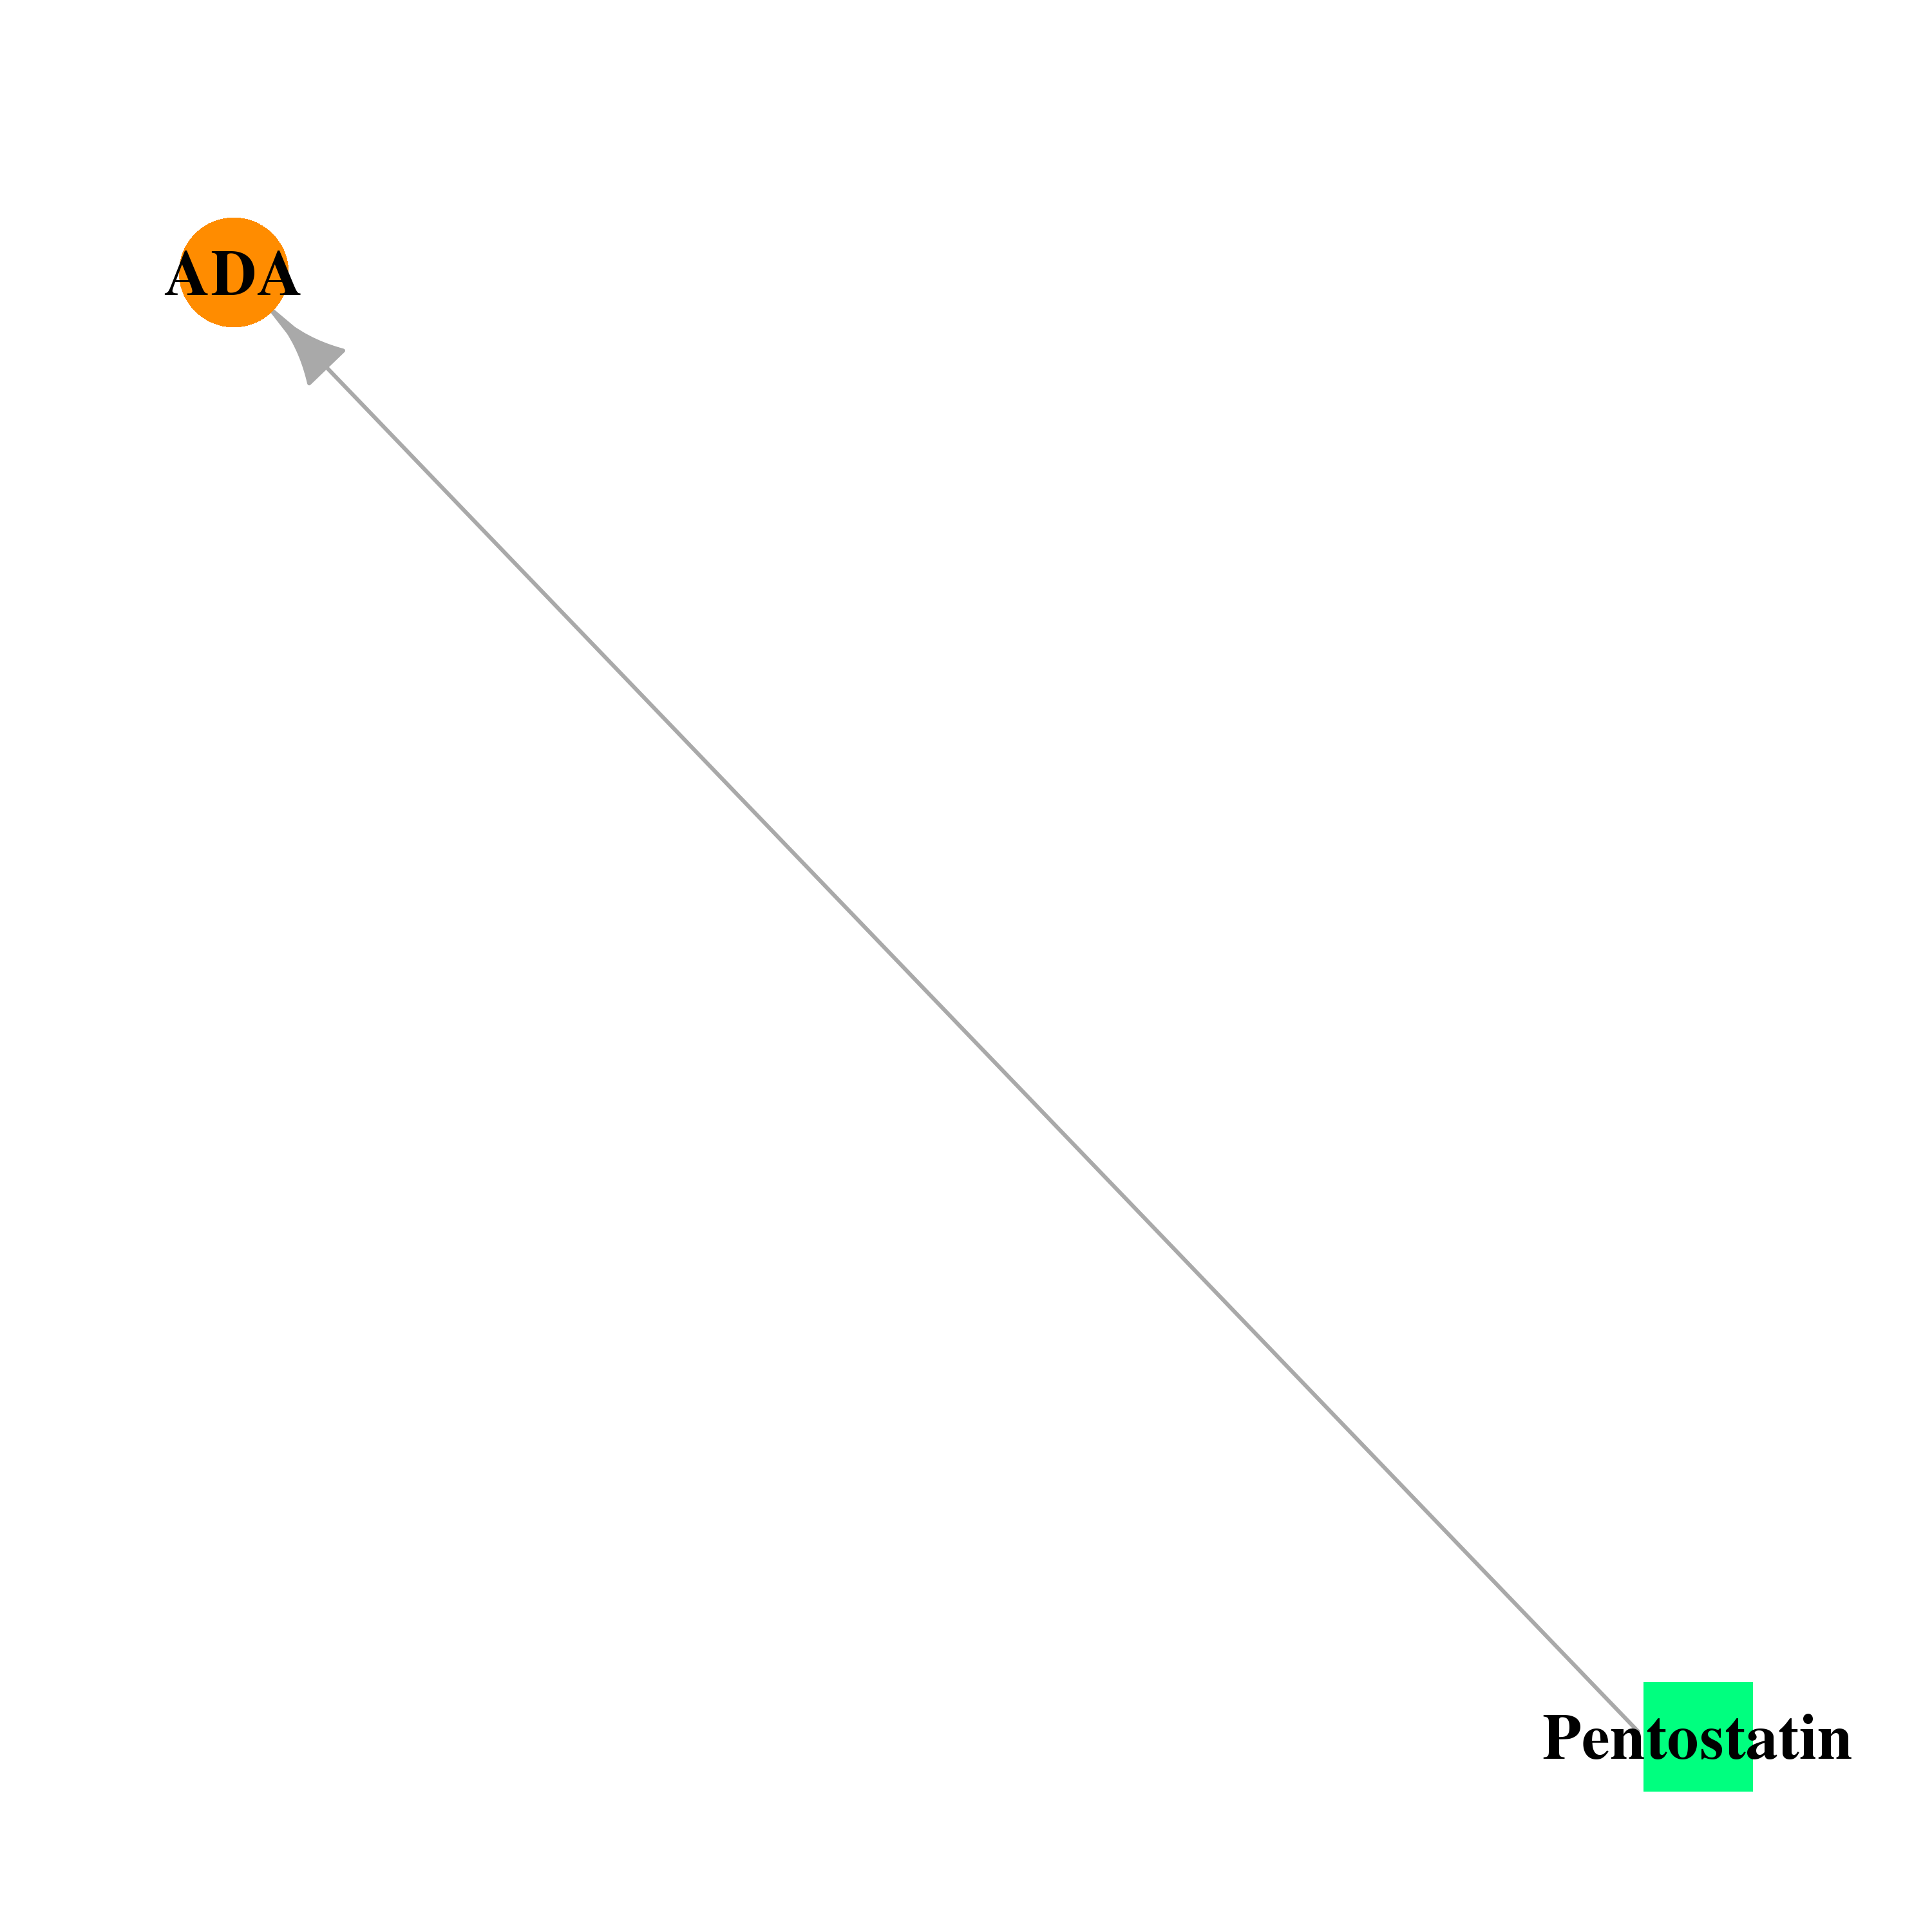 | 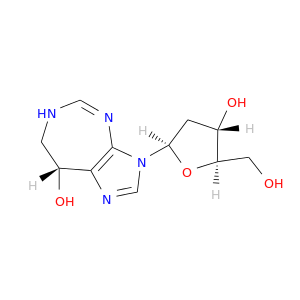 |
| DB00975 | adenosine deaminase | approved | Dipyridamole | 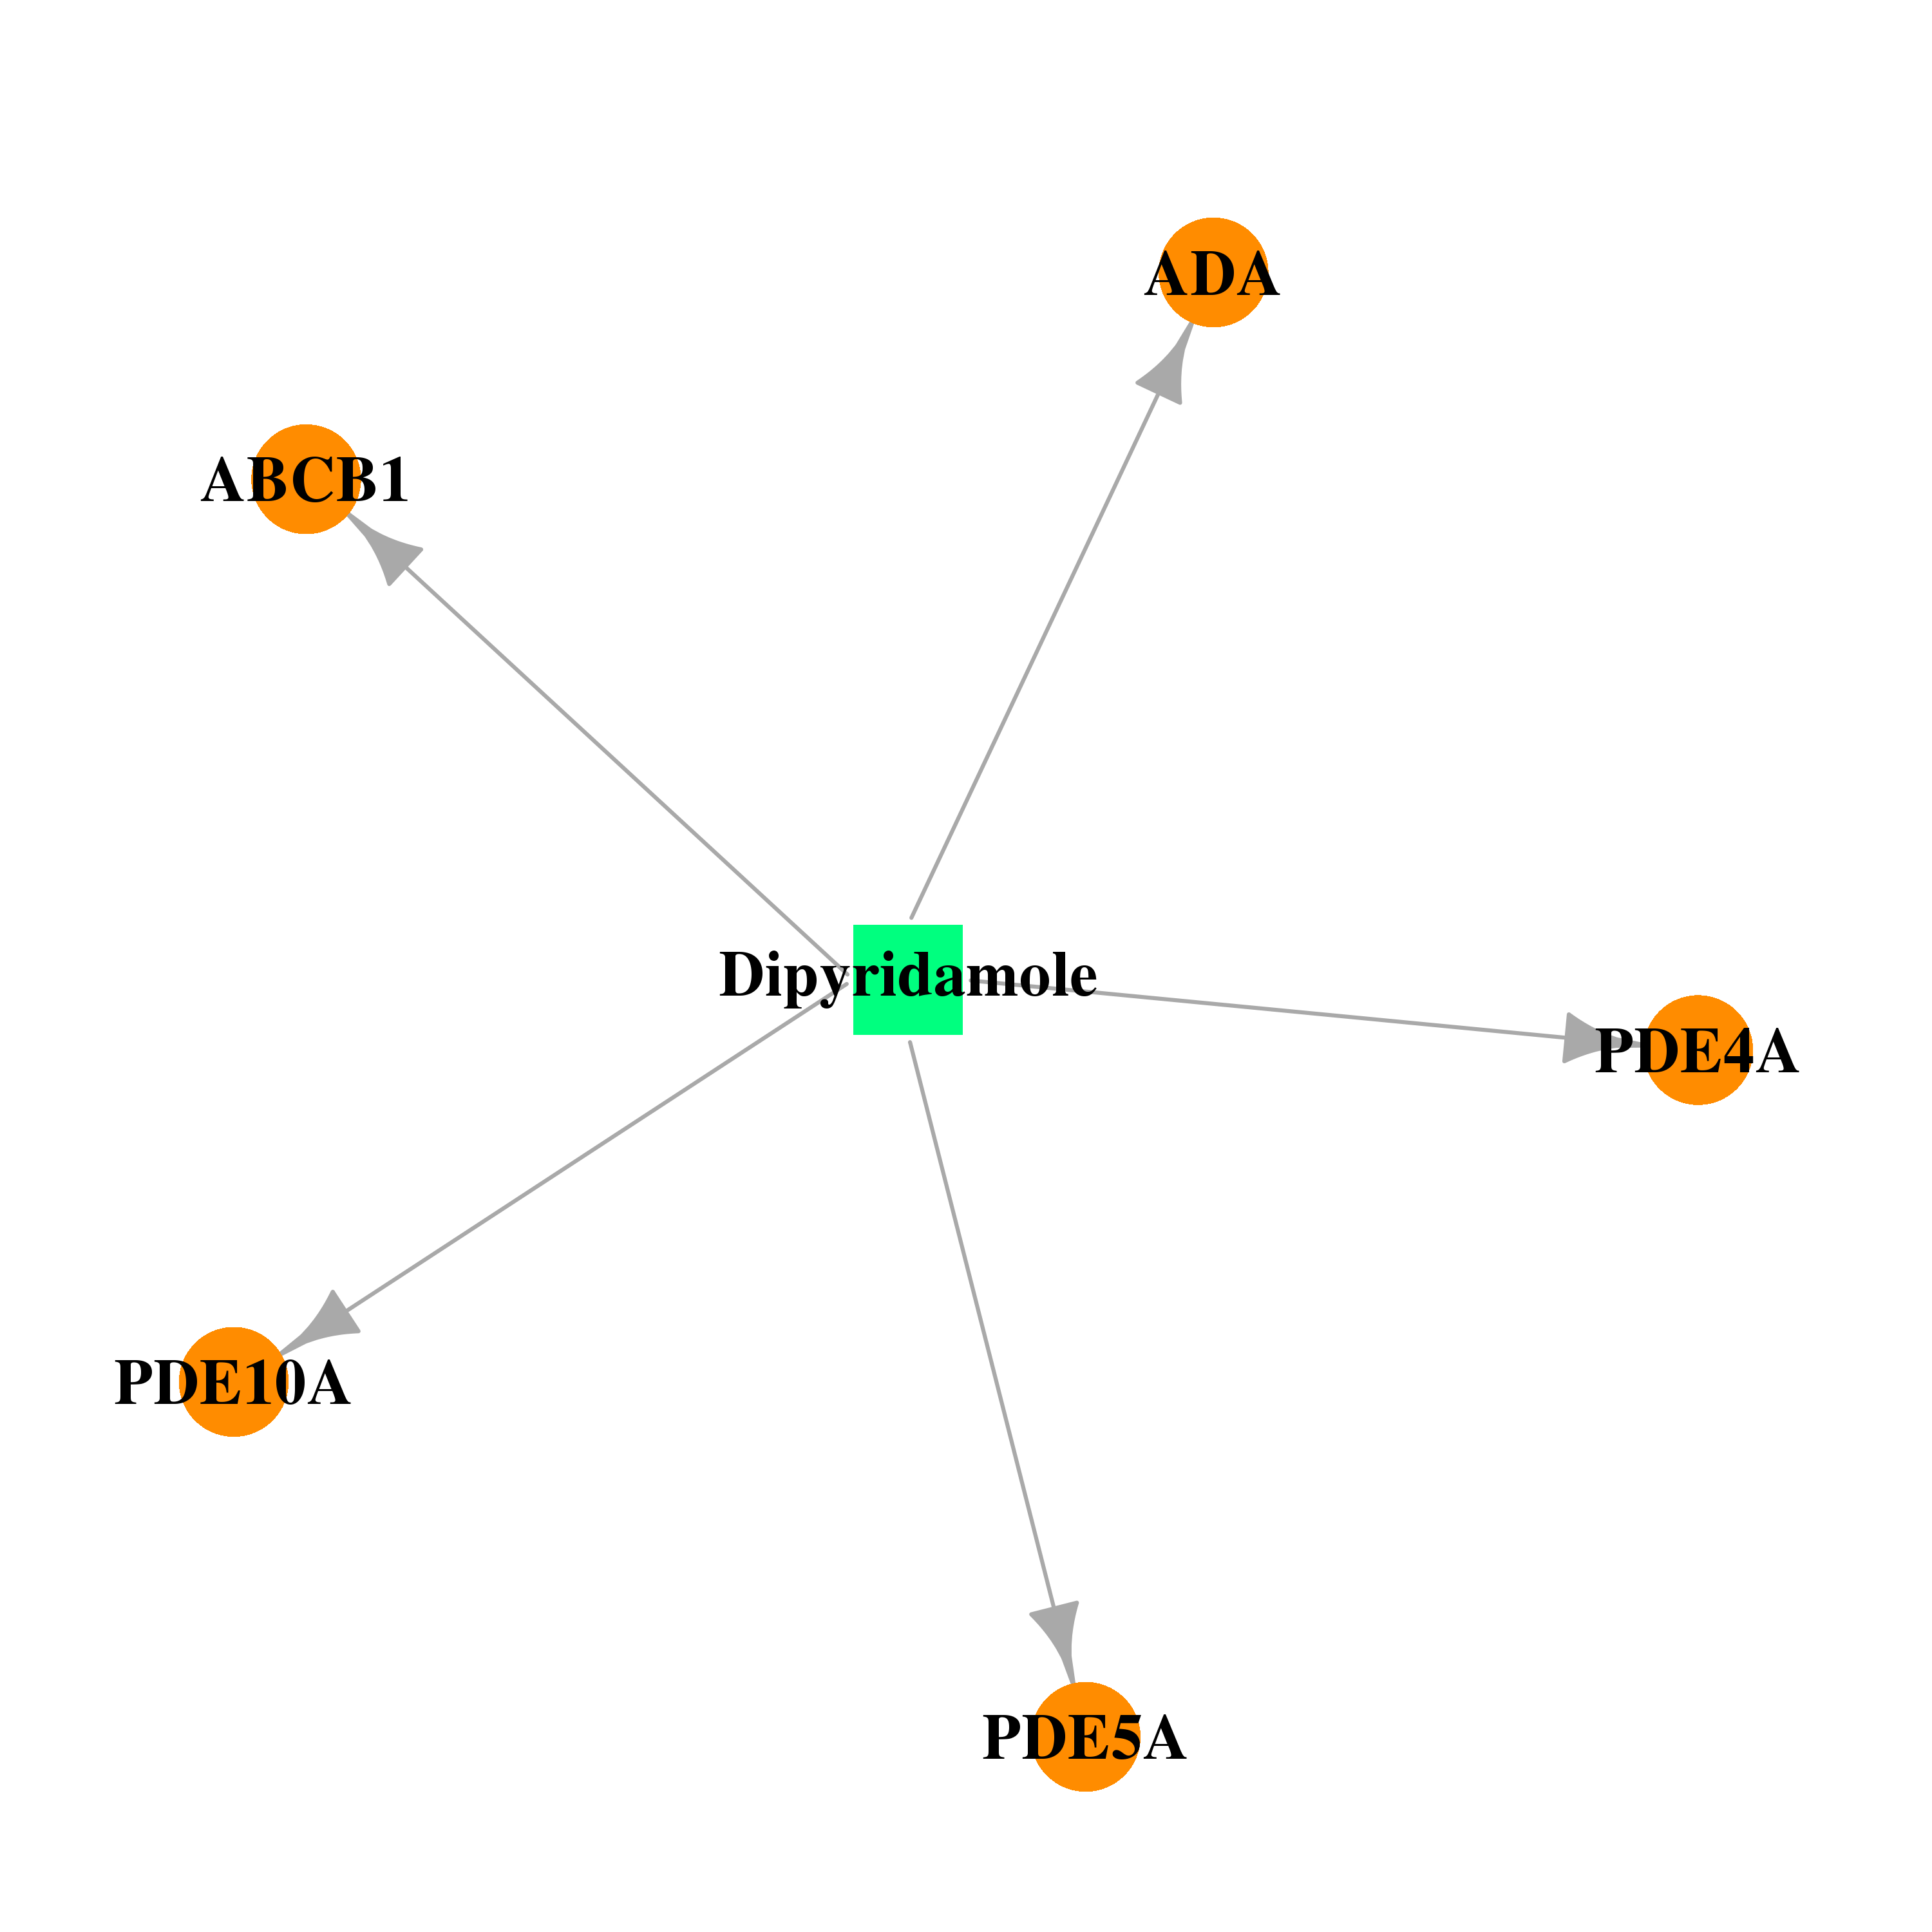 | 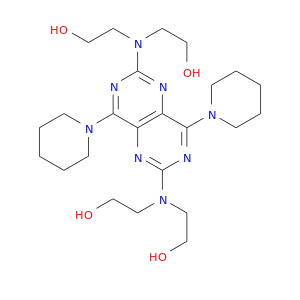 |
| DB02096 | adenosine deaminase | experimental | FR221647 |  | 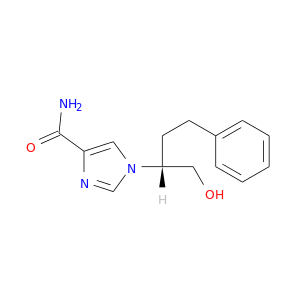 |
| DB02472 | adenosine deaminase | experimental | 6-Hydroxy-7,8-Dihydro Purine Nucleoside |  | 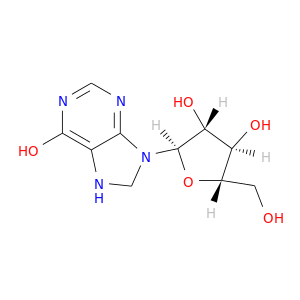 |
| DB02616 | adenosine deaminase | experimental | FR117016 |  | 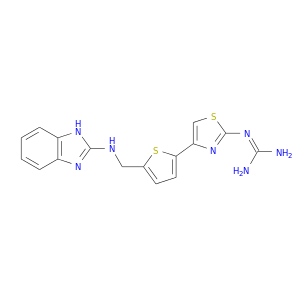 |
| DB02830 | adenosine deaminase | experimental | FR236913 |  | 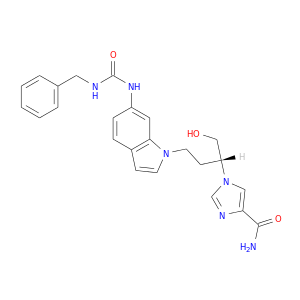 |
| DB03015 | adenosine deaminase | experimental | 6-Hydroxy-1,6-Dihydro Purine Nucleoside |  |  |
| DB03220 | adenosine deaminase | experimental | FR233623 |  |  |
| DB03370 | adenosine deaminase | experimental | FR239087 |  |  |
| DB03572 | adenosine deaminase | experimental | FR230513 |  |  |
| DB04218 | adenosine deaminase | experimental | 1-Deaza-Adenosine |  | 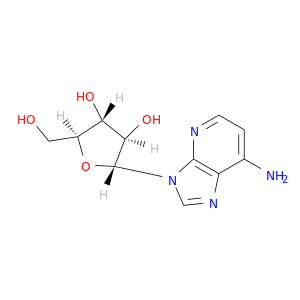 |
| DB04440 | adenosine deaminase | experimental | Purine Riboside | 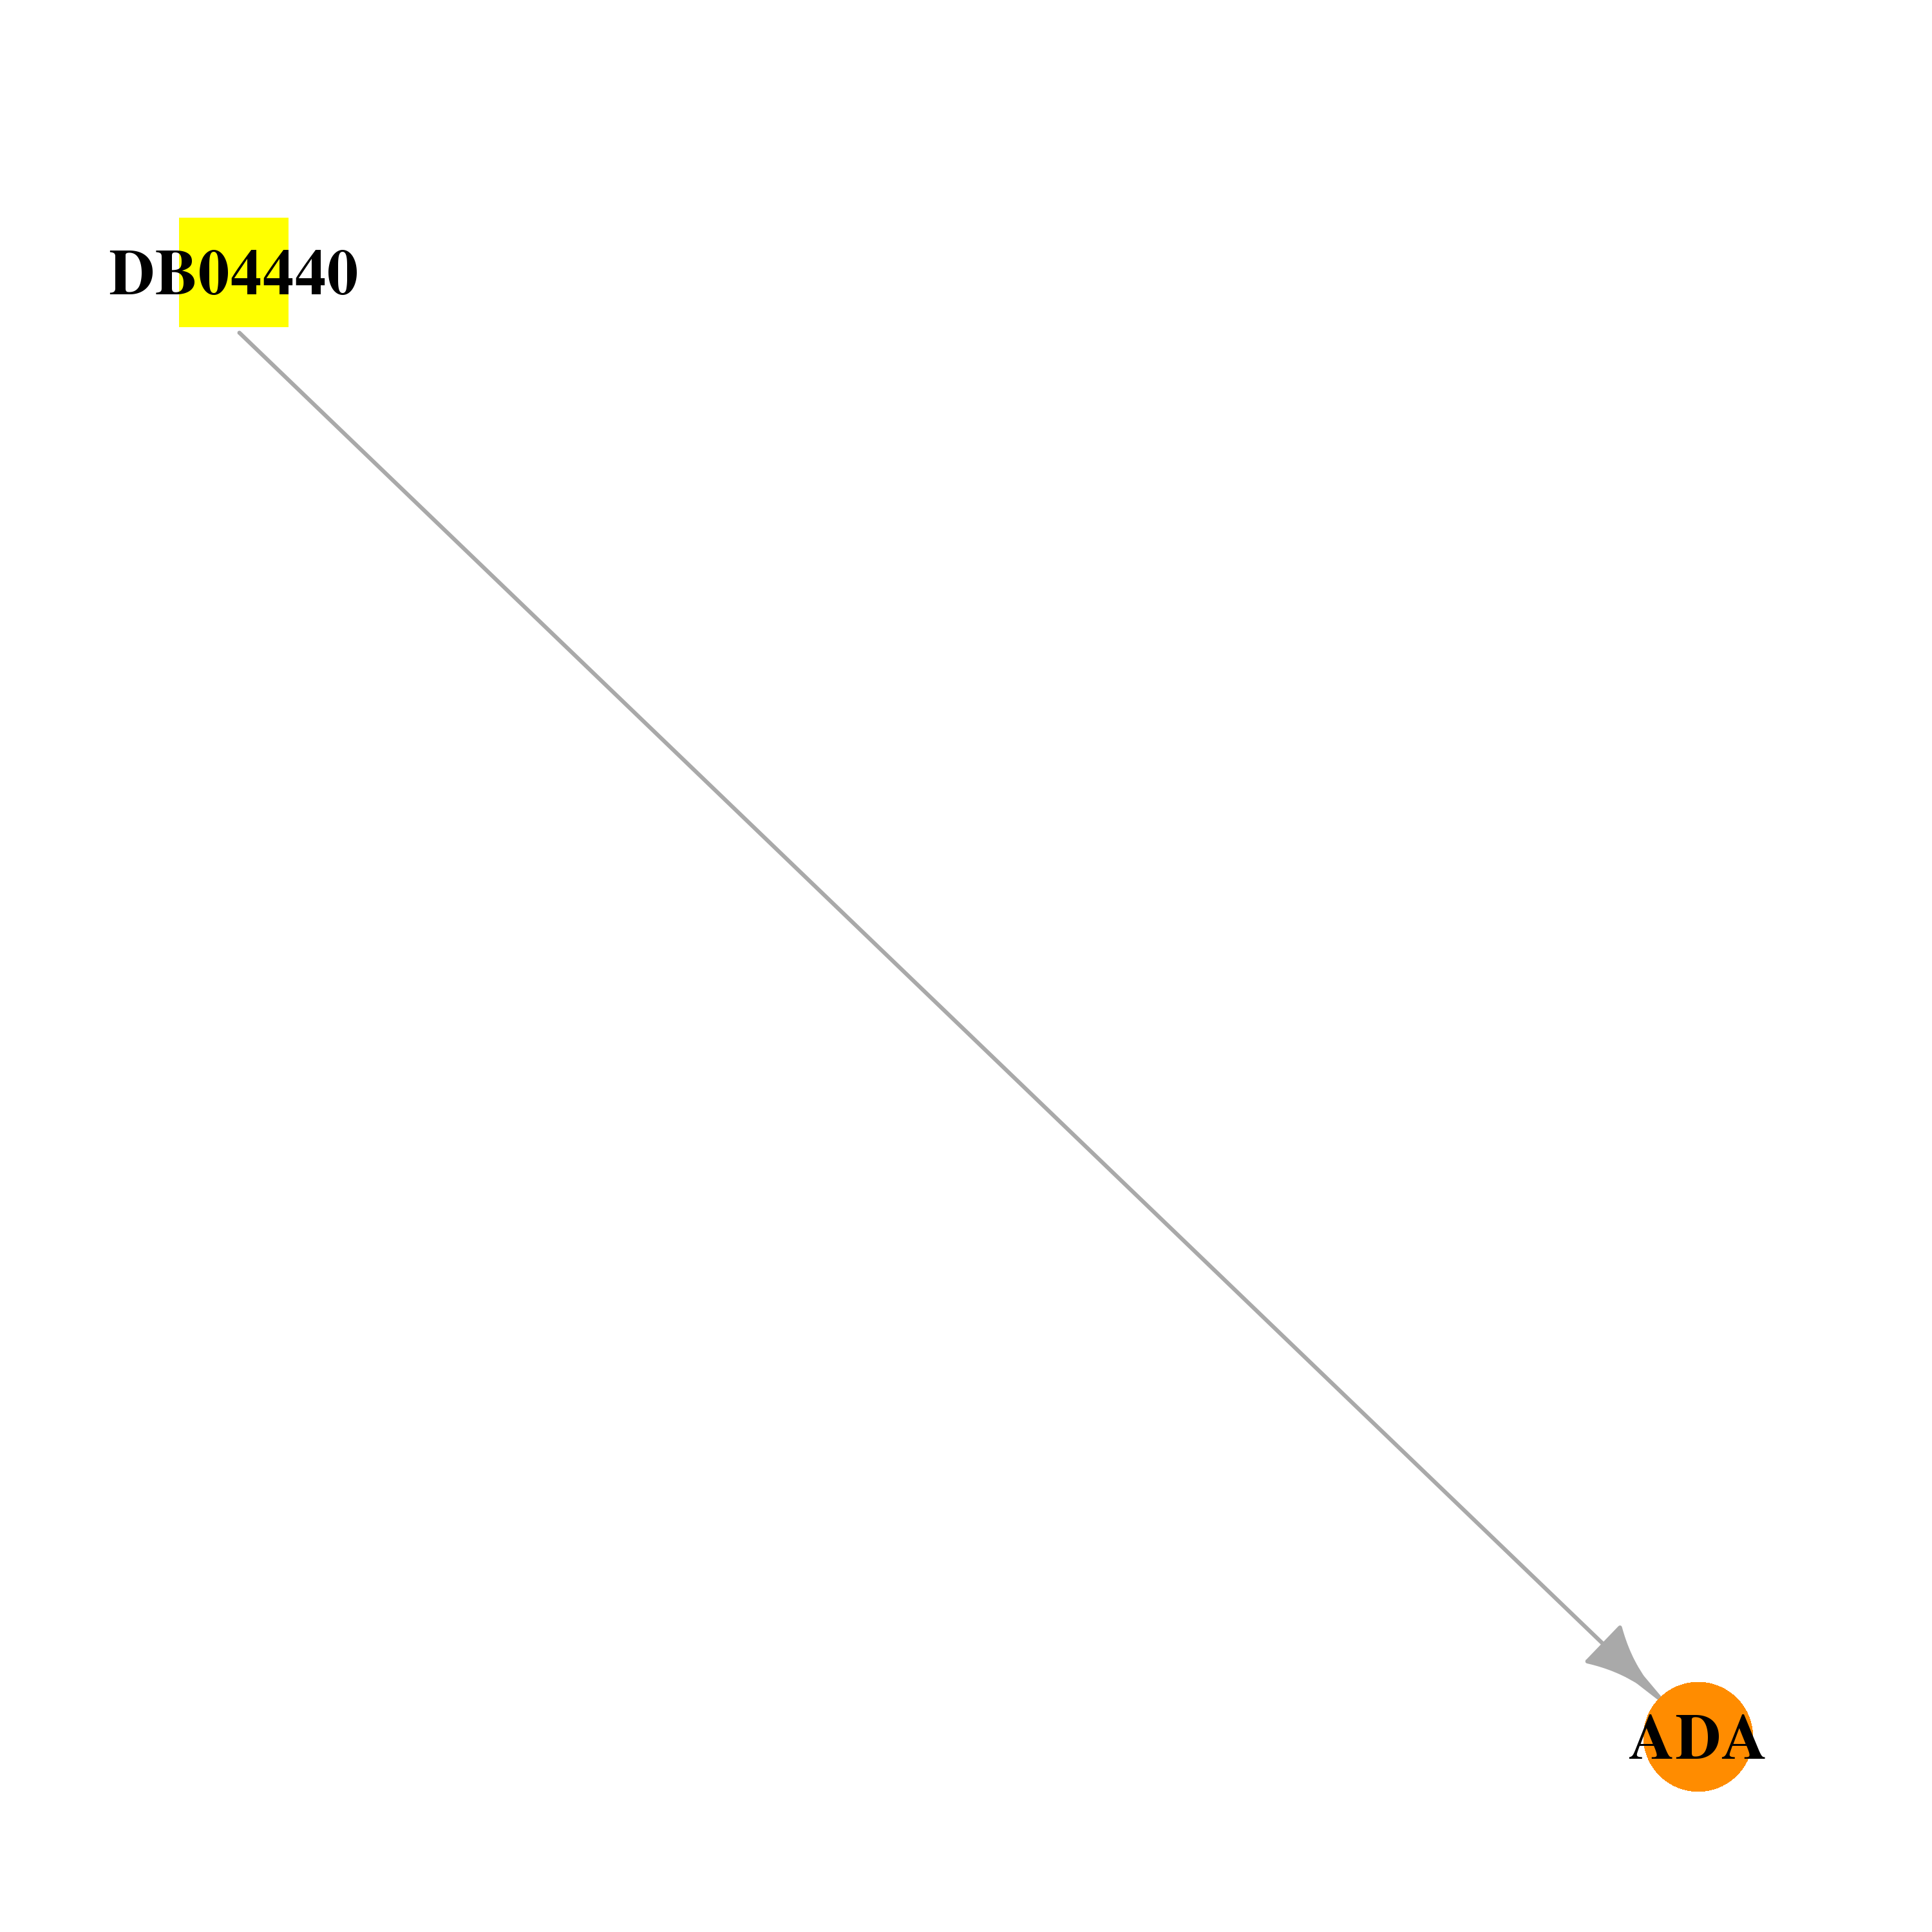 | 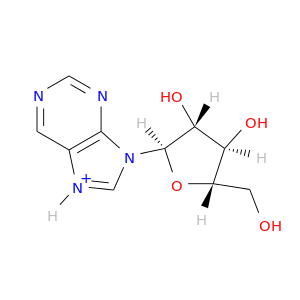 |
| DB07711 | adenosine deaminase | experimental | (2S,3R)-3-(6-amino-9H-purin-9-yl)nonan-2-ol | 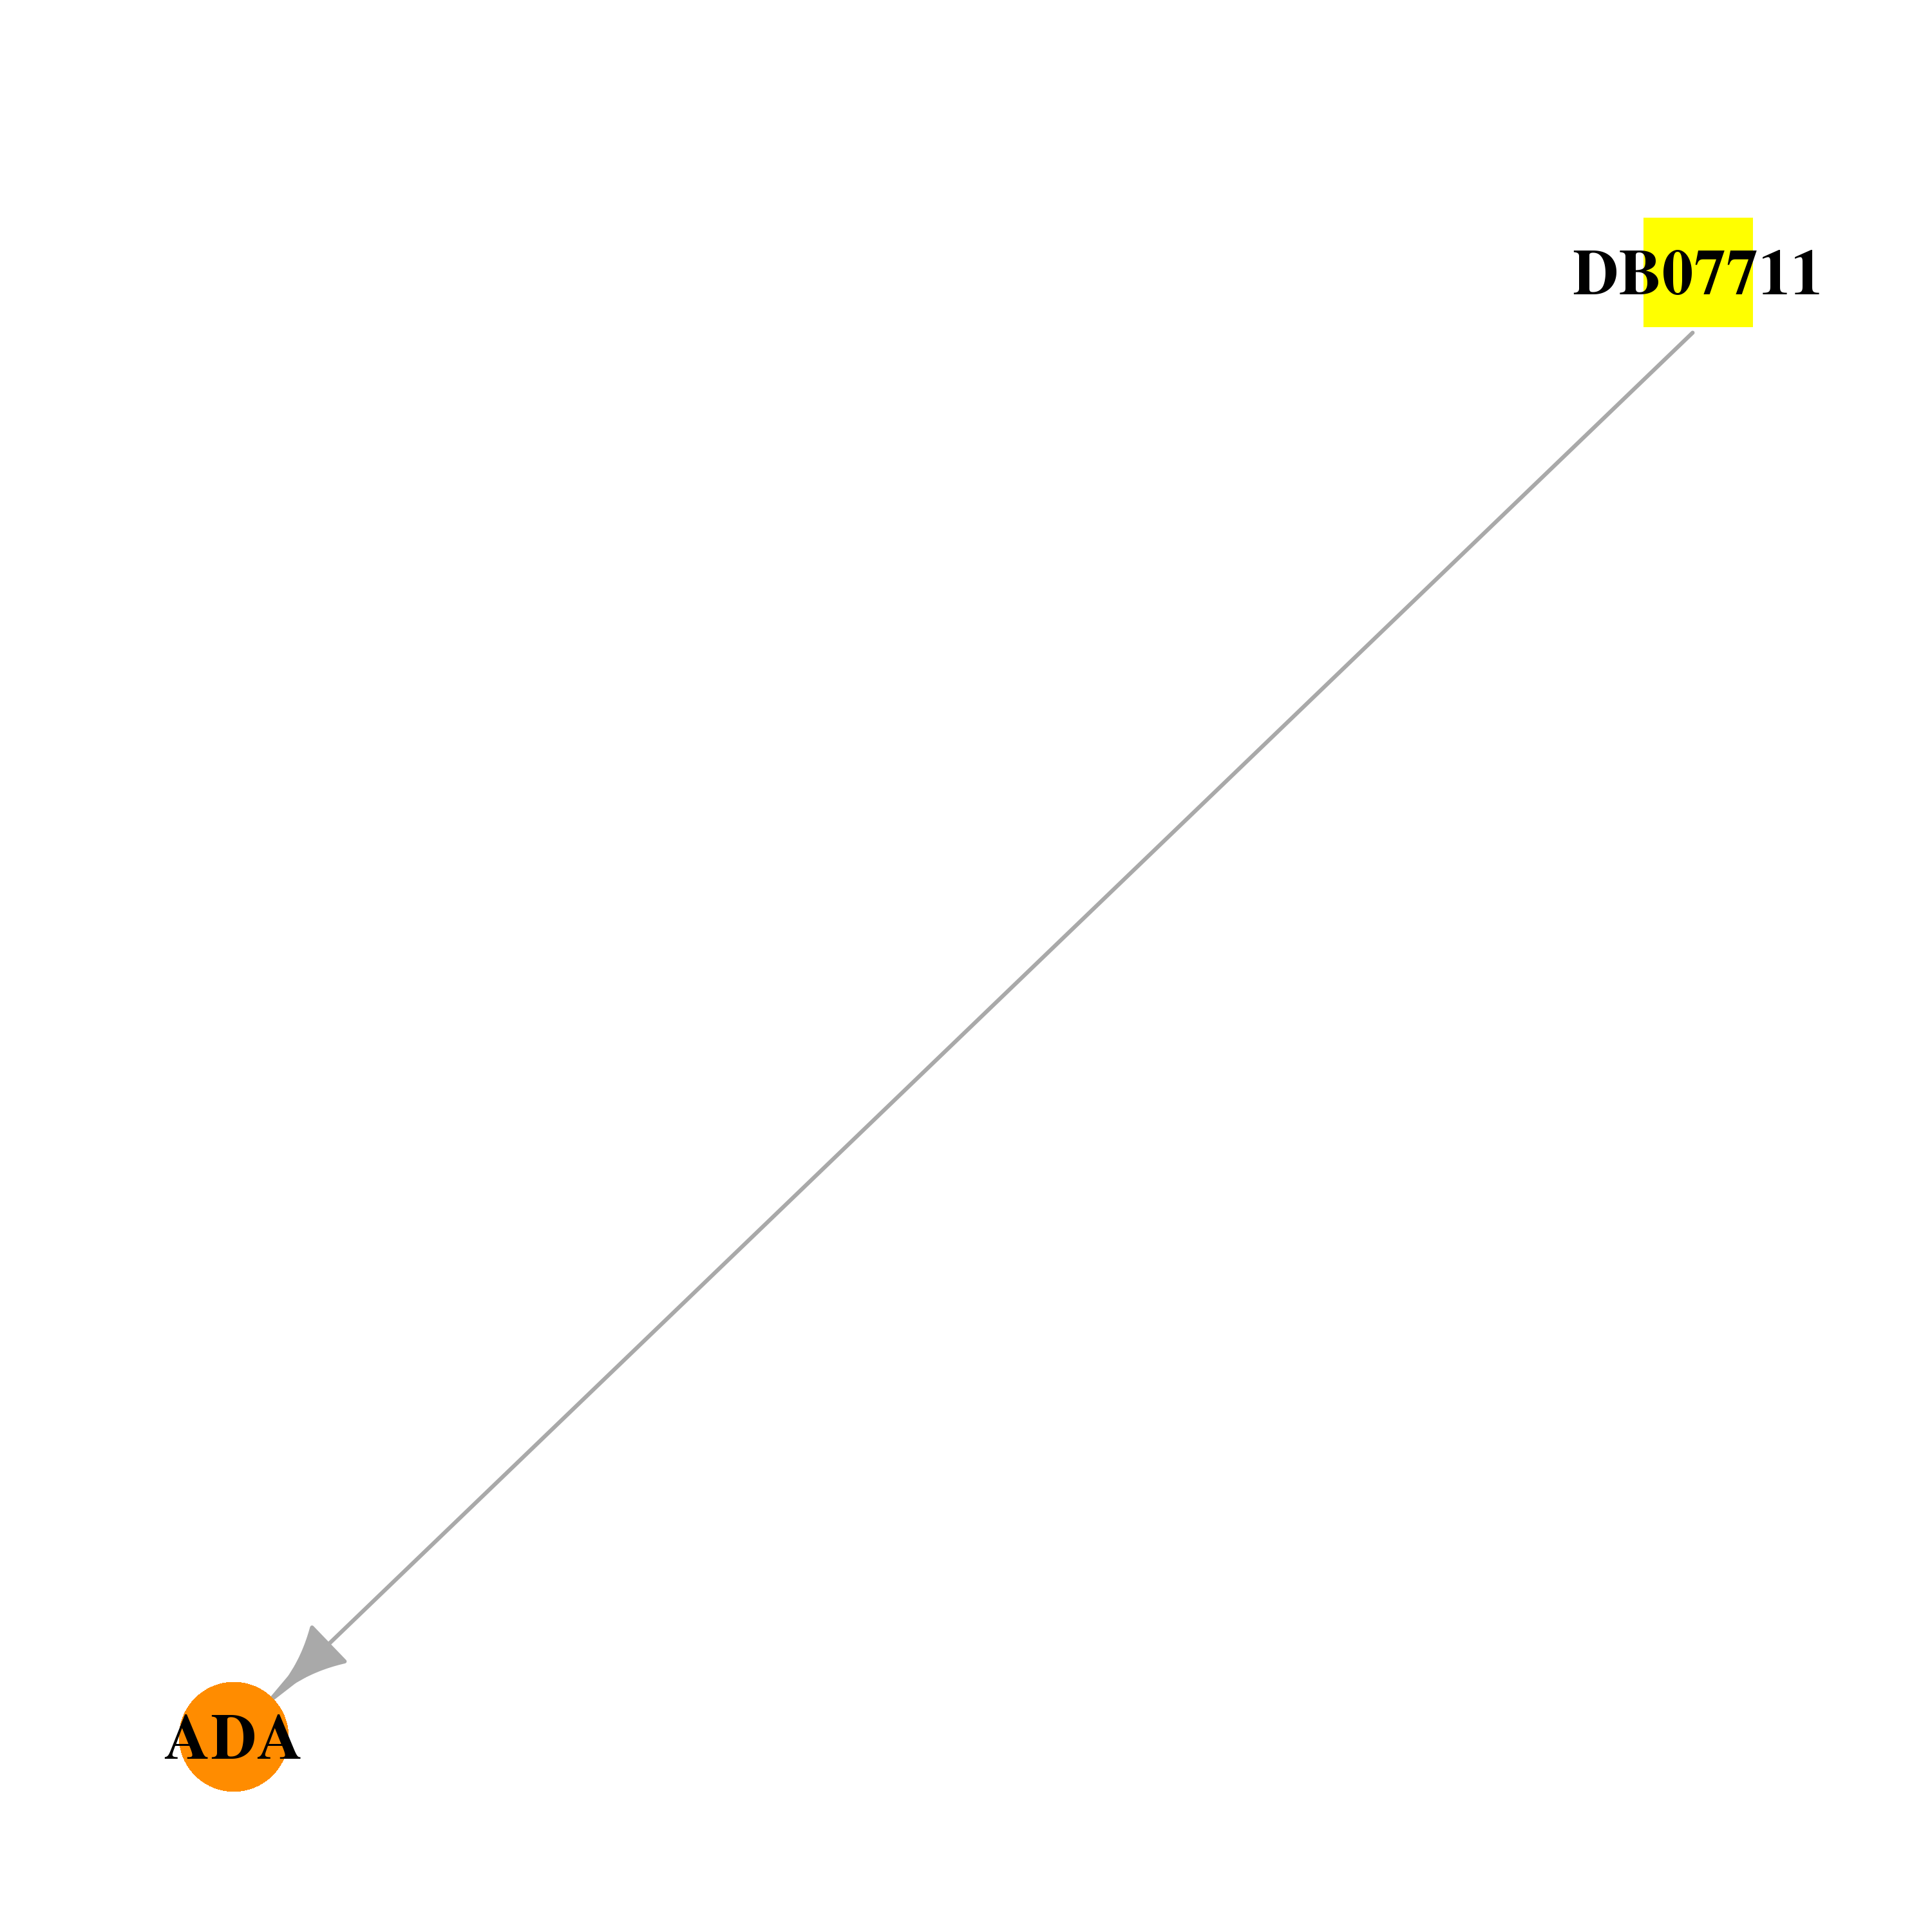 | 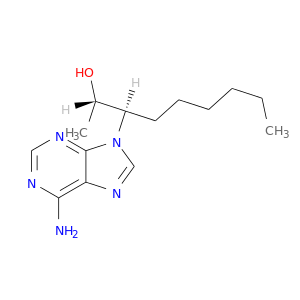 |
| DB07783 | adenosine deaminase | experimental | 1-((1R)-1-(HYDROXYMETHYL)-3-{6-[(3-PHENYLPROPANOYL)AMINO]-1H-INDOL-1-YL}PROPYL)-1H-IMIDAZOLE-4-CARBOXAMIDE |  |  |
| DB07785 | adenosine deaminase | experimental | 1-{(1R,2S)-2-HYDROXY-1-[2-(2-NAPHTHYLOXY)ETHYL]PROPYL}-1H-IMIDAZONE-4-CARBOXAMIDE |  |  |
| DB07786 | adenosine deaminase | experimental | 1-((1R,2S)-1-{2-[2-(4-CHLOROPHENYL)-1,3-BENZOXAZOL-7-YL]ETHYL}-2-HYDROXYPROPYL)-1H-IMIDAZOLE-4-CARBOXAMIDE |  | 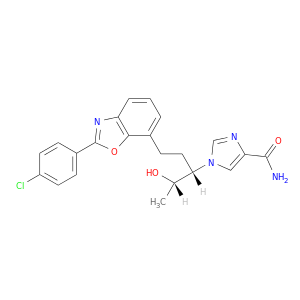 |
| DB00173 | adenosine deaminase | approved; nutraceutical | Adenine | 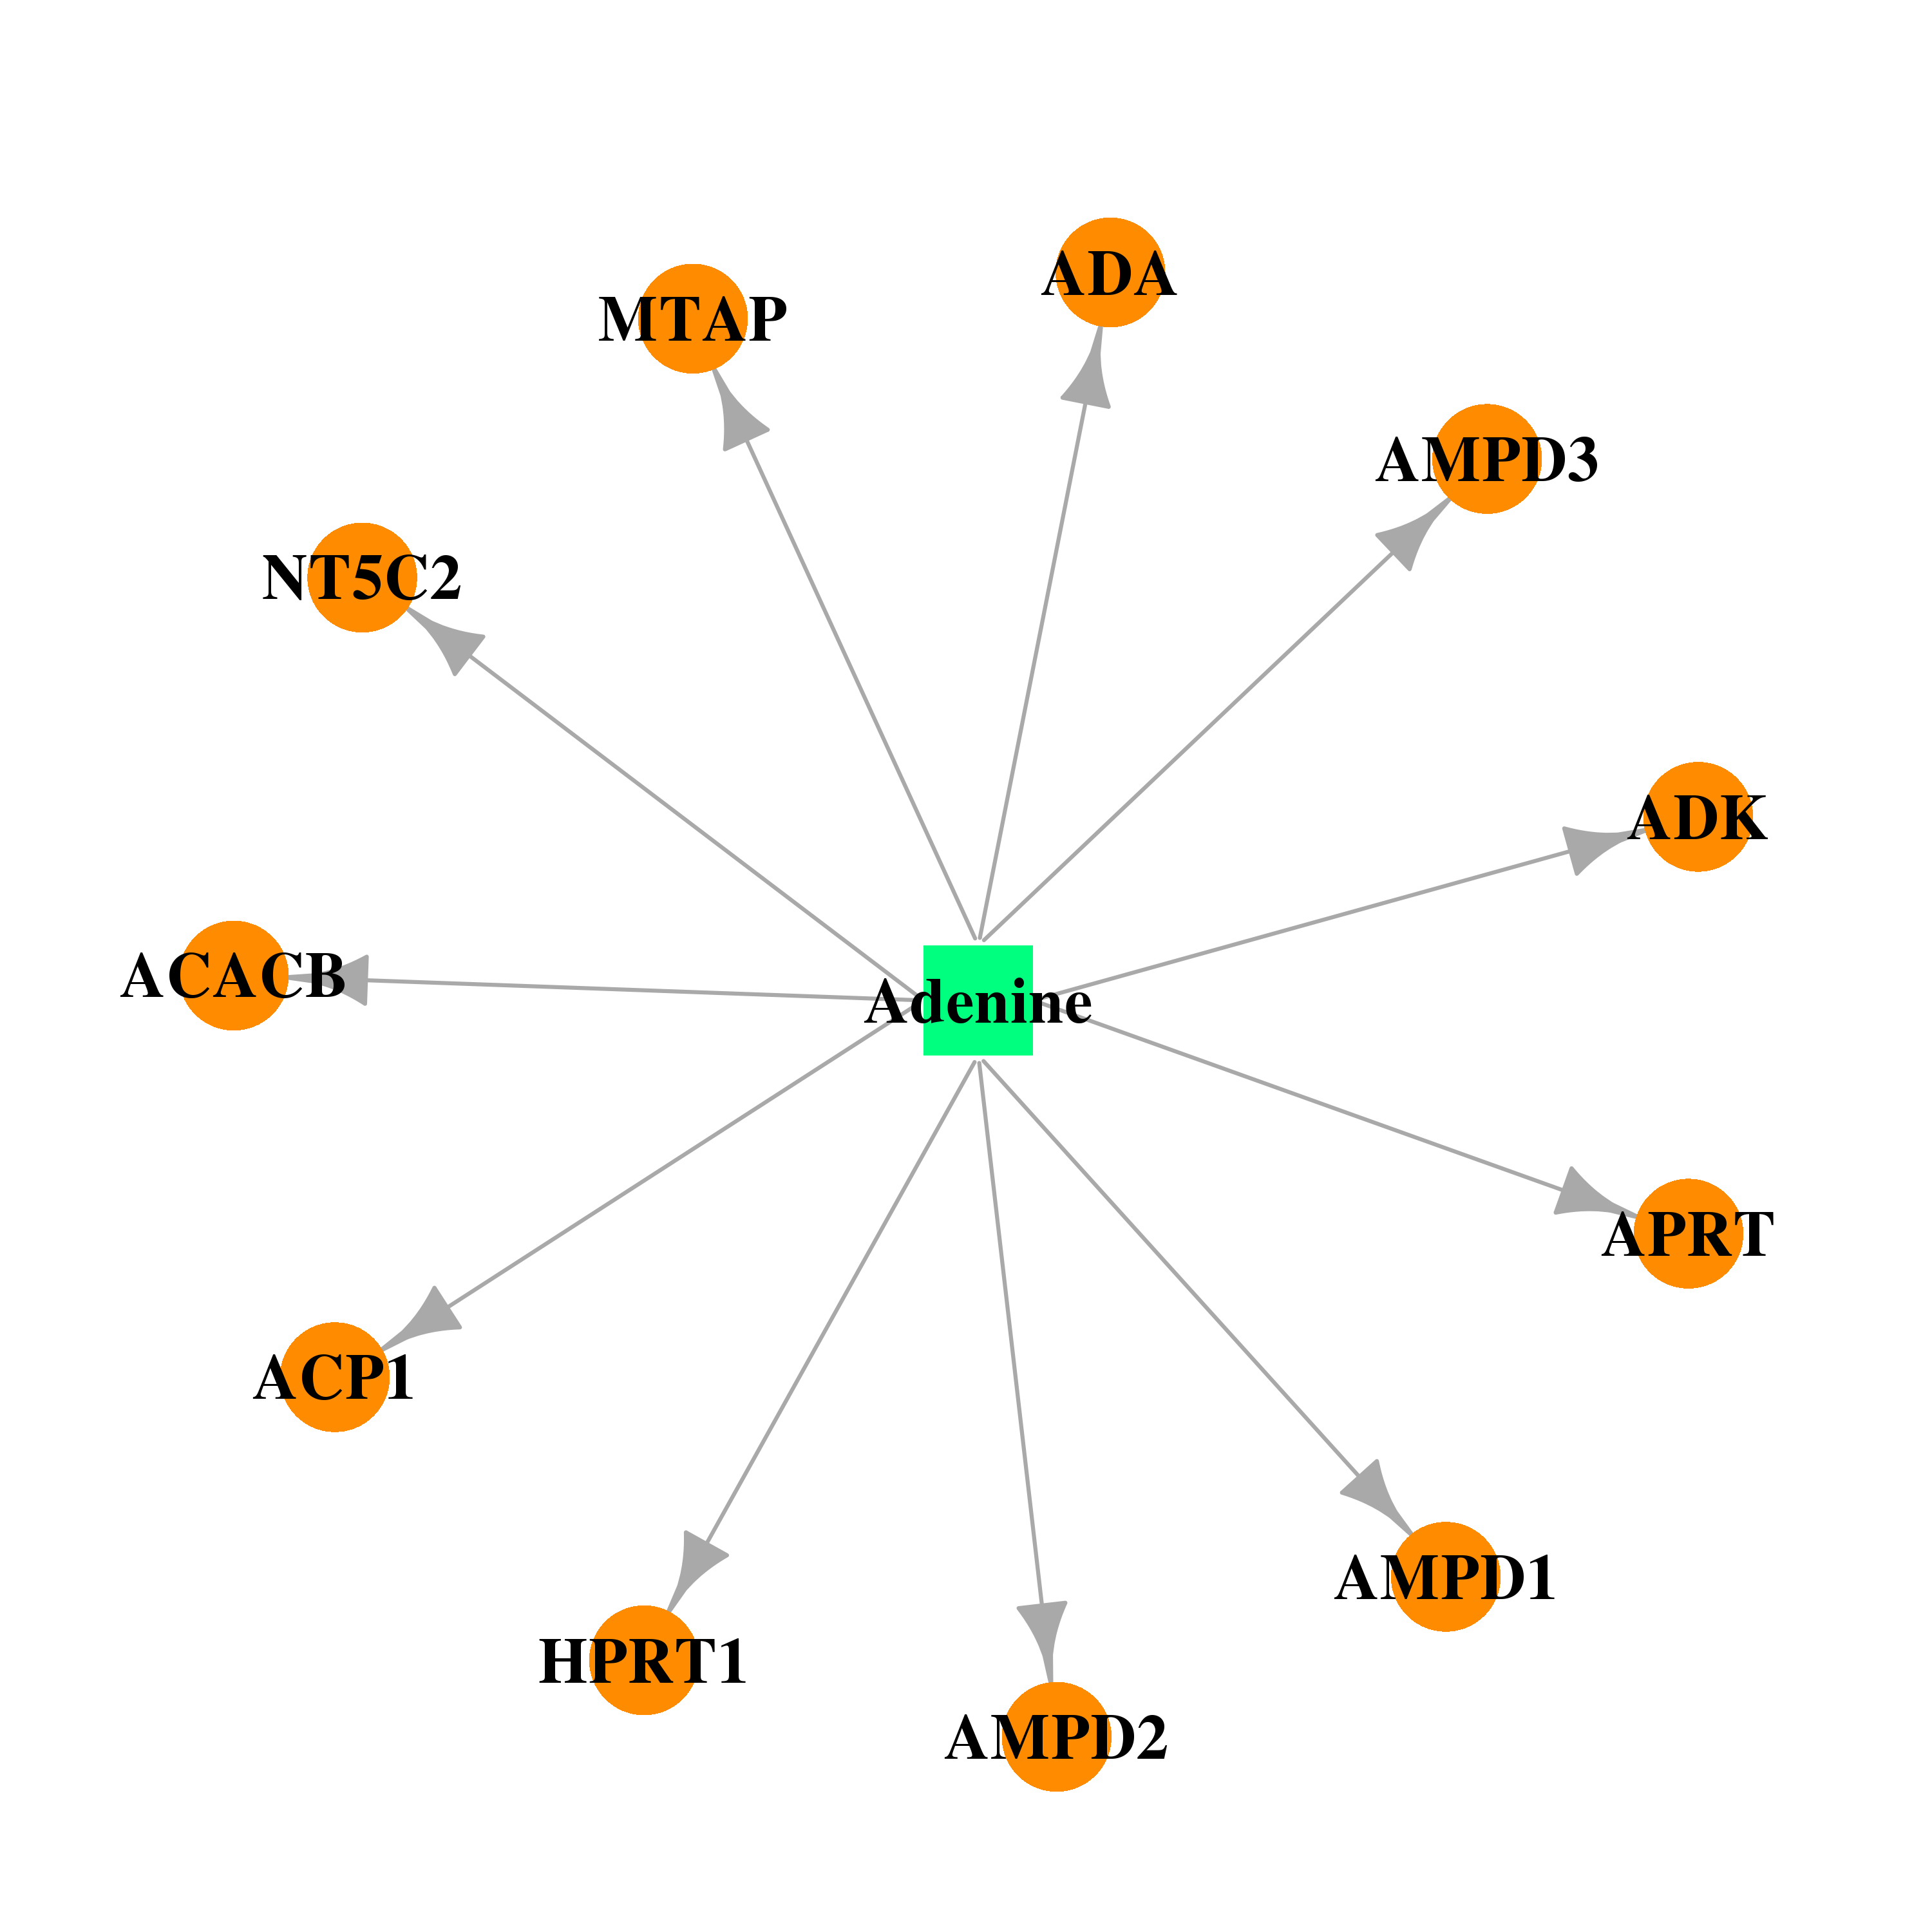 | 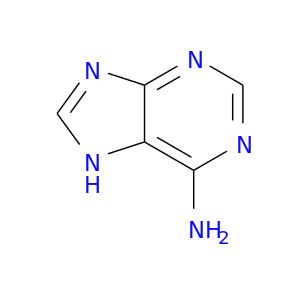 |
| DB00563 | adenosine deaminase | approved | Methotrexate |  |  |
| DB00640 | adenosine deaminase | approved; investigational | Adenosine | 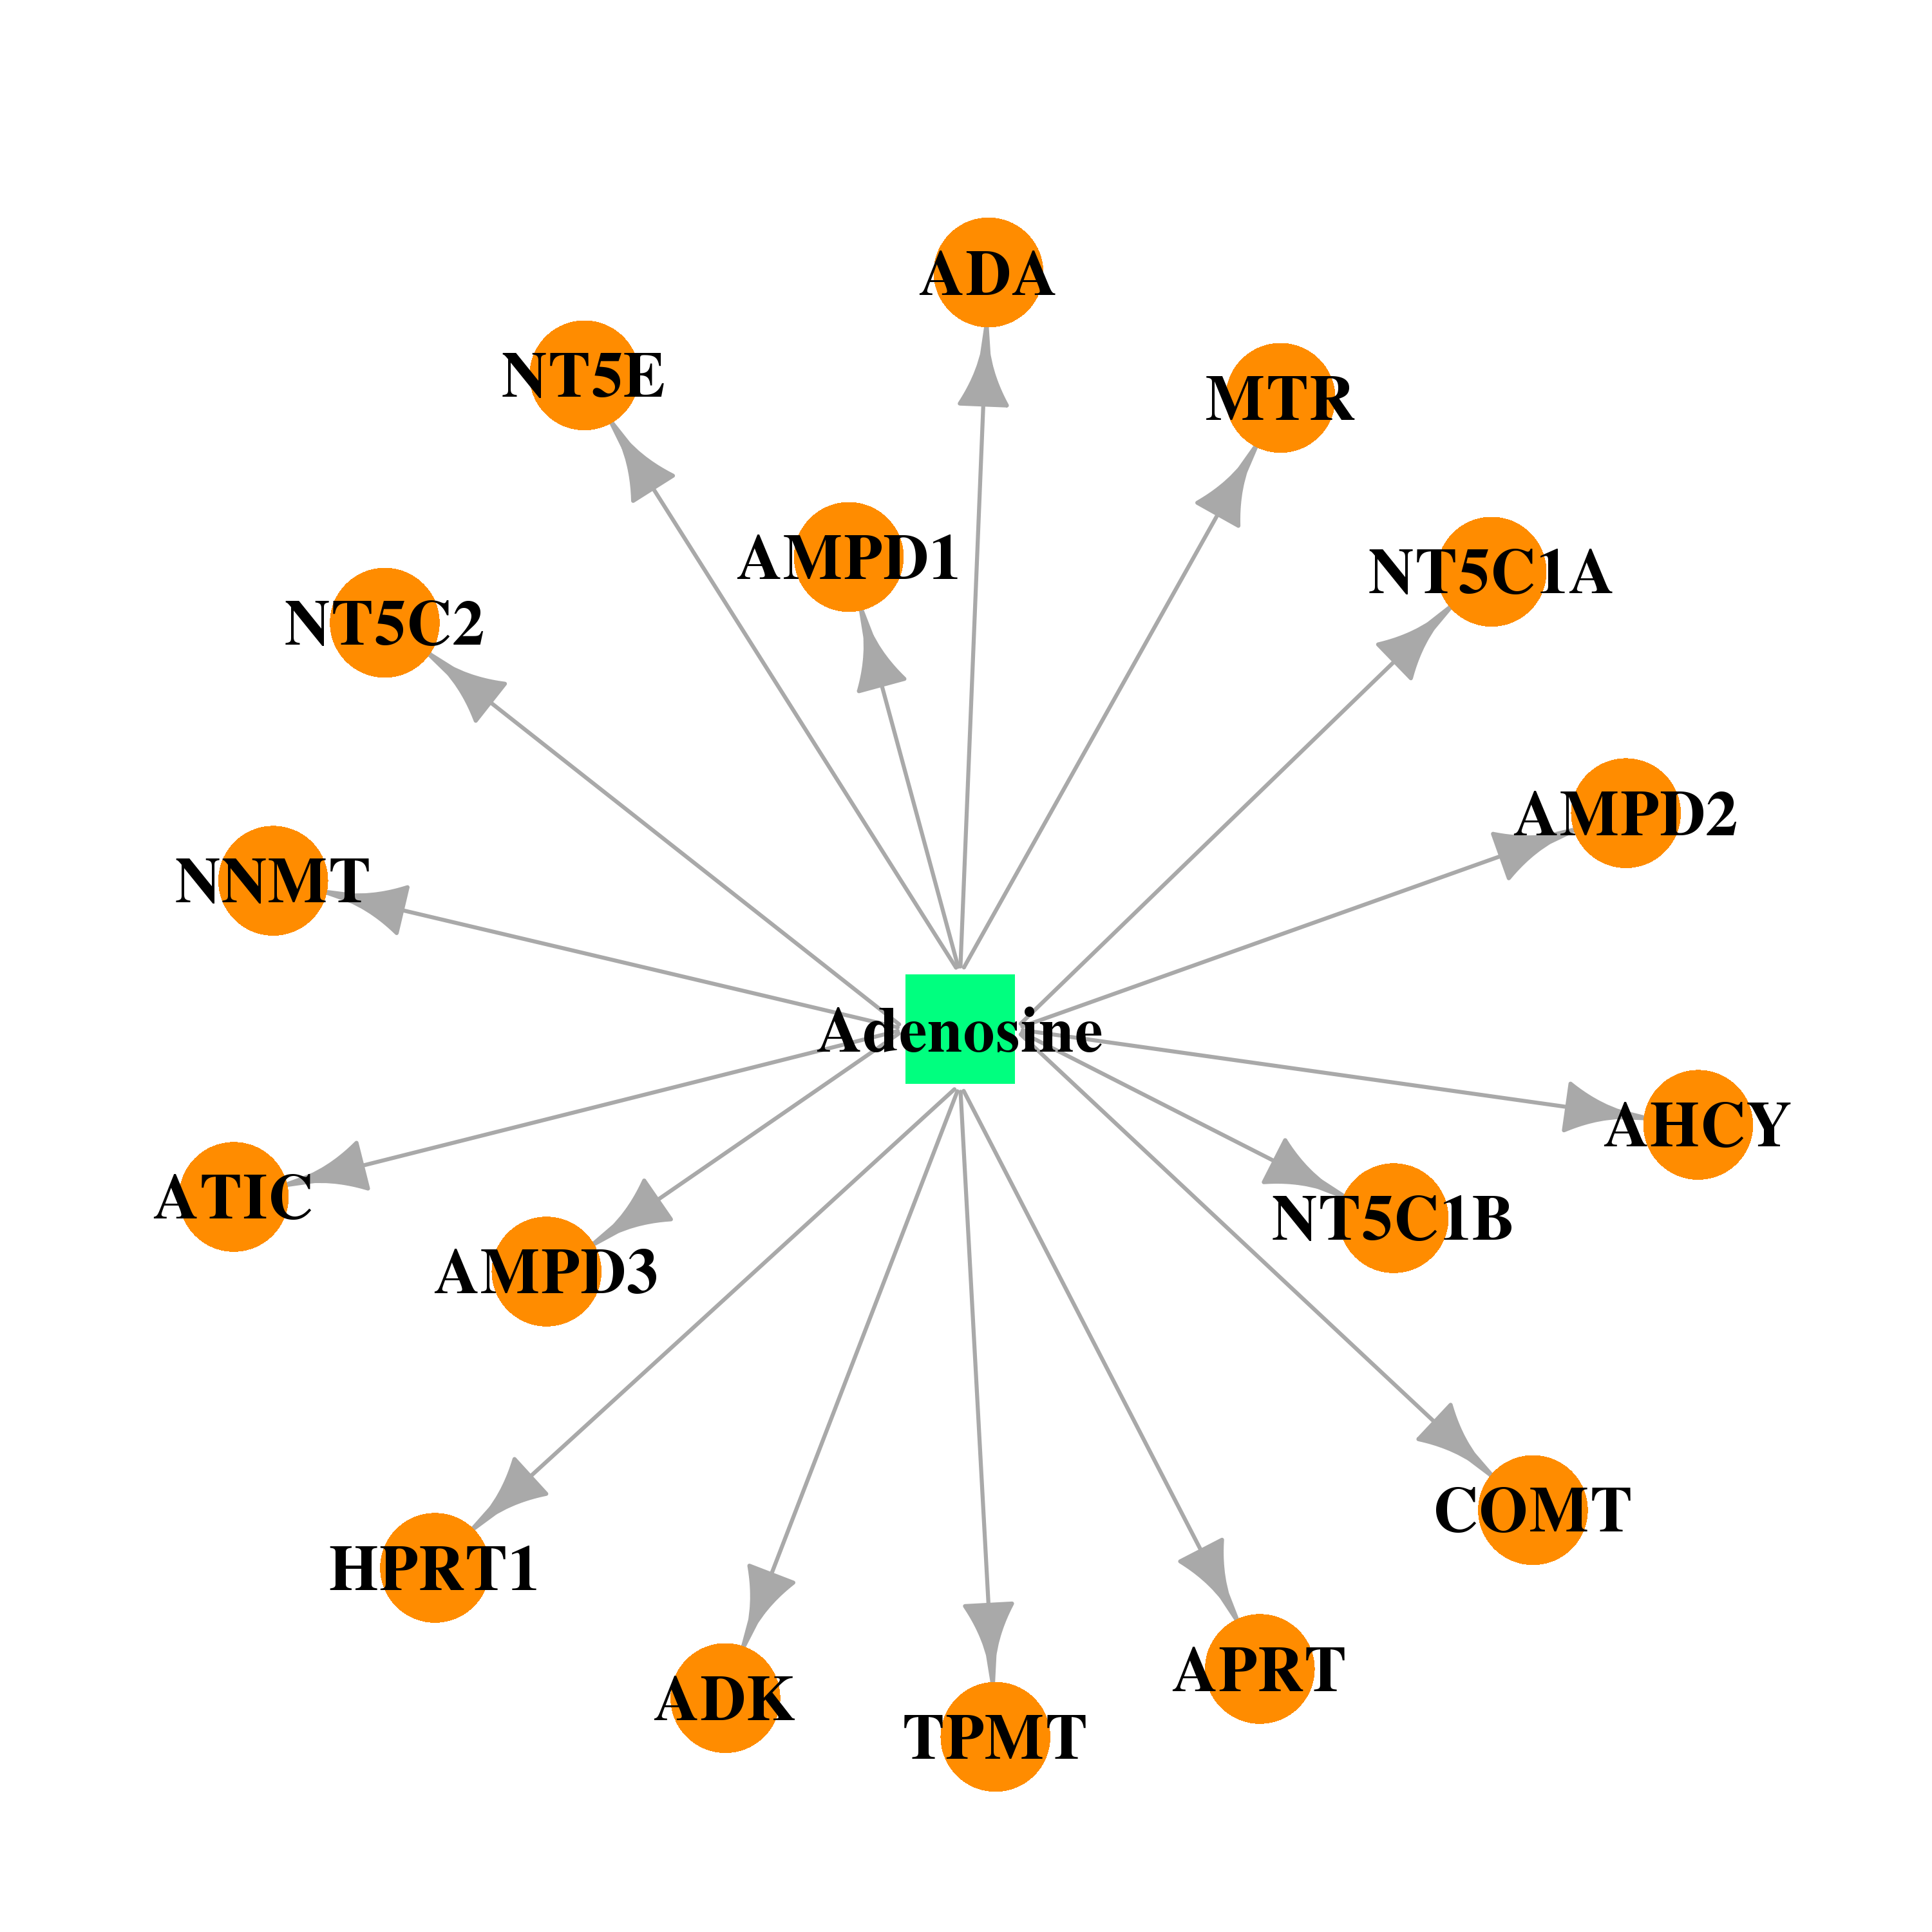 |  |
| Top |
| Cross referenced IDs for ADA |
| * We obtained these cross-references from Uniprot database. It covers 150 different DBs, 18 categories. http://www.uniprot.org/help/cross_references_section |
: Open all cross reference information
|
Copyright © 2016-Present - The Univsersity of Texas Health Science Center at Houston @ |