|
||||||||||||||||||||
| |
| Phenotypic Information (metabolism pathway, cancer, disease, phenome) |
| |
| |
| Gene-Gene Network Information: Co-Expression Network, Interacting Genes & KEGG |
| |
|


| Gene Summary for GNPDA1 |
| Top |
| Phenotypic Information for GNPDA1(metabolism pathway, cancer, disease, phenome) |
| Cancer | CGAP: GNPDA1 |
| Familial Cancer Database: GNPDA1 | |
| * This gene is included in those cancer gene databases. |
|
|
|
|
|
|
| ||||||||||||||
Oncogene 1 | Significant driver gene in | |||||||||||||||||||
| cf) number; DB name 1 Oncogene; http://nar.oxfordjournals.org/content/35/suppl_1/D721.long, 2 Tumor Suppressor gene; https://bioinfo.uth.edu/TSGene/, 3 Cancer Gene Census; http://www.nature.com/nrc/journal/v4/n3/abs/nrc1299.html, 4 CancerGenes; http://nar.oxfordjournals.org/content/35/suppl_1/D721.long, 5 Network of Cancer Gene; http://ncg.kcl.ac.uk/index.php, 1Therapeutic Vulnerabilities in Cancer; http://cbio.mskcc.org/cancergenomics/statius/ |
| KEGG_AMINO_SUGAR_AND_NUCLEOTIDE_SUGAR_METABOLISM | |
| OMIM | |
| Orphanet | |
| Disease | KEGG Disease: GNPDA1 |
| MedGen: GNPDA1 (Human Medical Genetics with Condition) | |
| ClinVar: GNPDA1 | |
| Phenotype | MGI: GNPDA1 (International Mouse Phenotyping Consortium) |
| PhenomicDB: GNPDA1 | |
| Mutations for GNPDA1 |
| * Under tables are showing count per each tissue to give us broad intuition about tissue specific mutation patterns.You can go to the detailed page for each mutation database's web site. |
| There's no structural variation information in COSMIC data for this gene. |
| * From mRNA Sanger sequences, Chitars2.0 arranged chimeric transcripts. This table shows GNPDA1 related fusion information. |
| ID | Head Gene | Tail Gene | Accession | Gene_a | qStart_a | qEnd_a | Chromosome_a | tStart_a | tEnd_a | Gene_a | qStart_a | qEnd_a | Chromosome_a | tStart_a | tEnd_a |
| N45950 | GNPDA1 | 1 | 79 | 5 | 141380562 | 141380640 | GNPDA1 | 75 | 363 | 5 | 141380253 | 141380539 | |
| BU619601 | GNPDA1 | 13 | 201 | 5 | 141380236 | 141382699 | GNPDA1 | 196 | 579 | 5 | 141381388 | 141382729 | |
| BU618872 | GNPDA1 | 13 | 200 | 5 | 141380236 | 141382699 | GNPDA1 | 195 | 578 | 5 | 141381388 | 141382729 | |
| AA383455 | GNPDA1 | 13 | 98 | 5 | 141380559 | 141380644 | PPP2R2B | 95 | 115 | 5 | 146299111 | 146299131 | |
| W00428 | GNPDA1 | 2 | 82 | 5 | 141380560 | 141380640 | GNPDA1 | 78 | 377 | 5 | 141380241 | 141380539 | |
| BE162856 | KLHL10 | 187 | 206 | 17 | 40001320 | 40001339 | GNPDA1 | 194 | 329 | 5 | 141380648 | 141380783 | |
| Top |
| There's no copy number variation information in COSMIC data for this gene. |
| Top |
|
 |
| Top |
| Stat. for Non-Synonymous SNVs (# total SNVs=11) | (# total SNVs=3) |
 |  |
(# total SNVs=2) | (# total SNVs=0) |
 |
| Top |
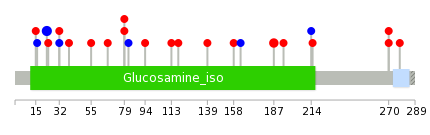
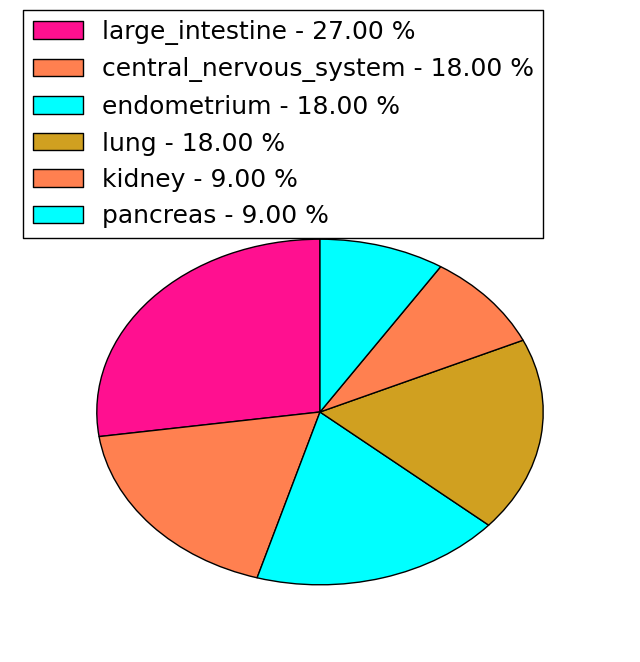
| * When you move the cursor on each content, you can see more deailed mutation information on the Tooltip. Those are primary_site,primary_histology,mutation(aa),pubmedID. |
| GRCh37 position | Mutation(aa) | Unique sampleID count |
| chr5:141391532-141391532 | p.R23R | 3 |
| chr5:141385882-141385882 | p.R79Q | 2 |
| chr5:141384531-141384531 | p.T187M | 2 |
| chr5:141391505-141391505 | p.E32D | 2 |
| chr5:141391553-141391553 | p.A16A | 1 |
| chr5:141381655-141381655 | p.Y270C | 1 |
| chr5:141385781-141385781 | p.D113N | 1 |
| chr5:141391557-141391557 | p.W15L | 1 |
| chr5:141381656-141381656 | p.Y270H | 1 |
| chr5:141385836-141385838 | p.F94delF | 1 |
| Top |
|
 |
| Point Mutation/ Tissue ID | 1 | 2 | 3 | 4 | 5 | 6 | 7 | 8 | 9 | 10 | 11 | 12 | 13 | 14 | 15 | 16 | 17 | 18 | 19 | 20 |
| # sample | 2 | 1 | 1 | 2 | 1 | 3 | 3 | |||||||||||||
| # mutation | 2 | 1 | 1 | 2 | 1 | 3 | 2 | |||||||||||||
| nonsynonymous SNV | 2 | 1 | 1 | 2 | 3 | 2 | ||||||||||||||
| synonymous SNV | 1 | 1 |
| cf) Tissue ID; Tissue type (1; BLCA[Bladder Urothelial Carcinoma], 2; BRCA[Breast invasive carcinoma], 3; CESC[Cervical squamous cell carcinoma and endocervical adenocarcinoma], 4; COAD[Colon adenocarcinoma], 5; GBM[Glioblastoma multiforme], 6; Glioma Low Grade, 7; HNSC[Head and Neck squamous cell carcinoma], 8; KICH[Kidney Chromophobe], 9; KIRC[Kidney renal clear cell carcinoma], 10; KIRP[Kidney renal papillary cell carcinoma], 11; LAML[Acute Myeloid Leukemia], 12; LUAD[Lung adenocarcinoma], 13; LUSC[Lung squamous cell carcinoma], 14; OV[Ovarian serous cystadenocarcinoma ], 15; PAAD[Pancreatic adenocarcinoma], 16; PRAD[Prostate adenocarcinoma], 17; SKCM[Skin Cutaneous Melanoma], 18:STAD[Stomach adenocarcinoma], 19:THCA[Thyroid carcinoma], 20:UCEC[Uterine Corpus Endometrial Carcinoma]) |
| Top |
| * We represented just top 10 SNVs. When you move the cursor on each content, you can see more deailed mutation information on the Tooltip. Those are primary_site, primary_histology, mutation(aa), pubmedID. |
| Genomic Position | Mutation(aa) | Unique sampleID count |
| chr5:141391505 | p.E32D | 2 |
| chr5:141381655 | p.R158C | 1 |
| chr5:141391485 | p.T157T | 1 |
| chr5:141381656 | p.G139C | 1 |
| chr5:141382753 | p.G136A | 1 |
| chr5:141384619 | p.C118Y | 1 |
| chr5:141384620 | p.D113N | 1 |
| chr5:141384676 | p.R79Q | 1 |
| chr5:141385711 | p.K67N | 1 |
| chr5:141385765 | p.L39H | 1 |
| * Copy number data were extracted from TCGA using R package TCGA-Assembler. The URLs of all public data files on TCGA DCC data server were gathered on Jan-05-2015. Function ProcessCNAData in TCGA-Assembler package was used to obtain gene-level copy number value which is calculated as the average copy number of the genomic region of a gene. |
 |
| cf) Tissue ID[Tissue type]: BLCA[Bladder Urothelial Carcinoma], BRCA[Breast invasive carcinoma], CESC[Cervical squamous cell carcinoma and endocervical adenocarcinoma], COAD[Colon adenocarcinoma], GBM[Glioblastoma multiforme], Glioma Low Grade, HNSC[Head and Neck squamous cell carcinoma], KICH[Kidney Chromophobe], KIRC[Kidney renal clear cell carcinoma], KIRP[Kidney renal papillary cell carcinoma], LAML[Acute Myeloid Leukemia], LUAD[Lung adenocarcinoma], LUSC[Lung squamous cell carcinoma], OV[Ovarian serous cystadenocarcinoma ], PAAD[Pancreatic adenocarcinoma], PRAD[Prostate adenocarcinoma], SKCM[Skin Cutaneous Melanoma], STAD[Stomach adenocarcinoma], THCA[Thyroid carcinoma], UCEC[Uterine Corpus Endometrial Carcinoma] |
| Top |
| Gene Expression for GNPDA1 |
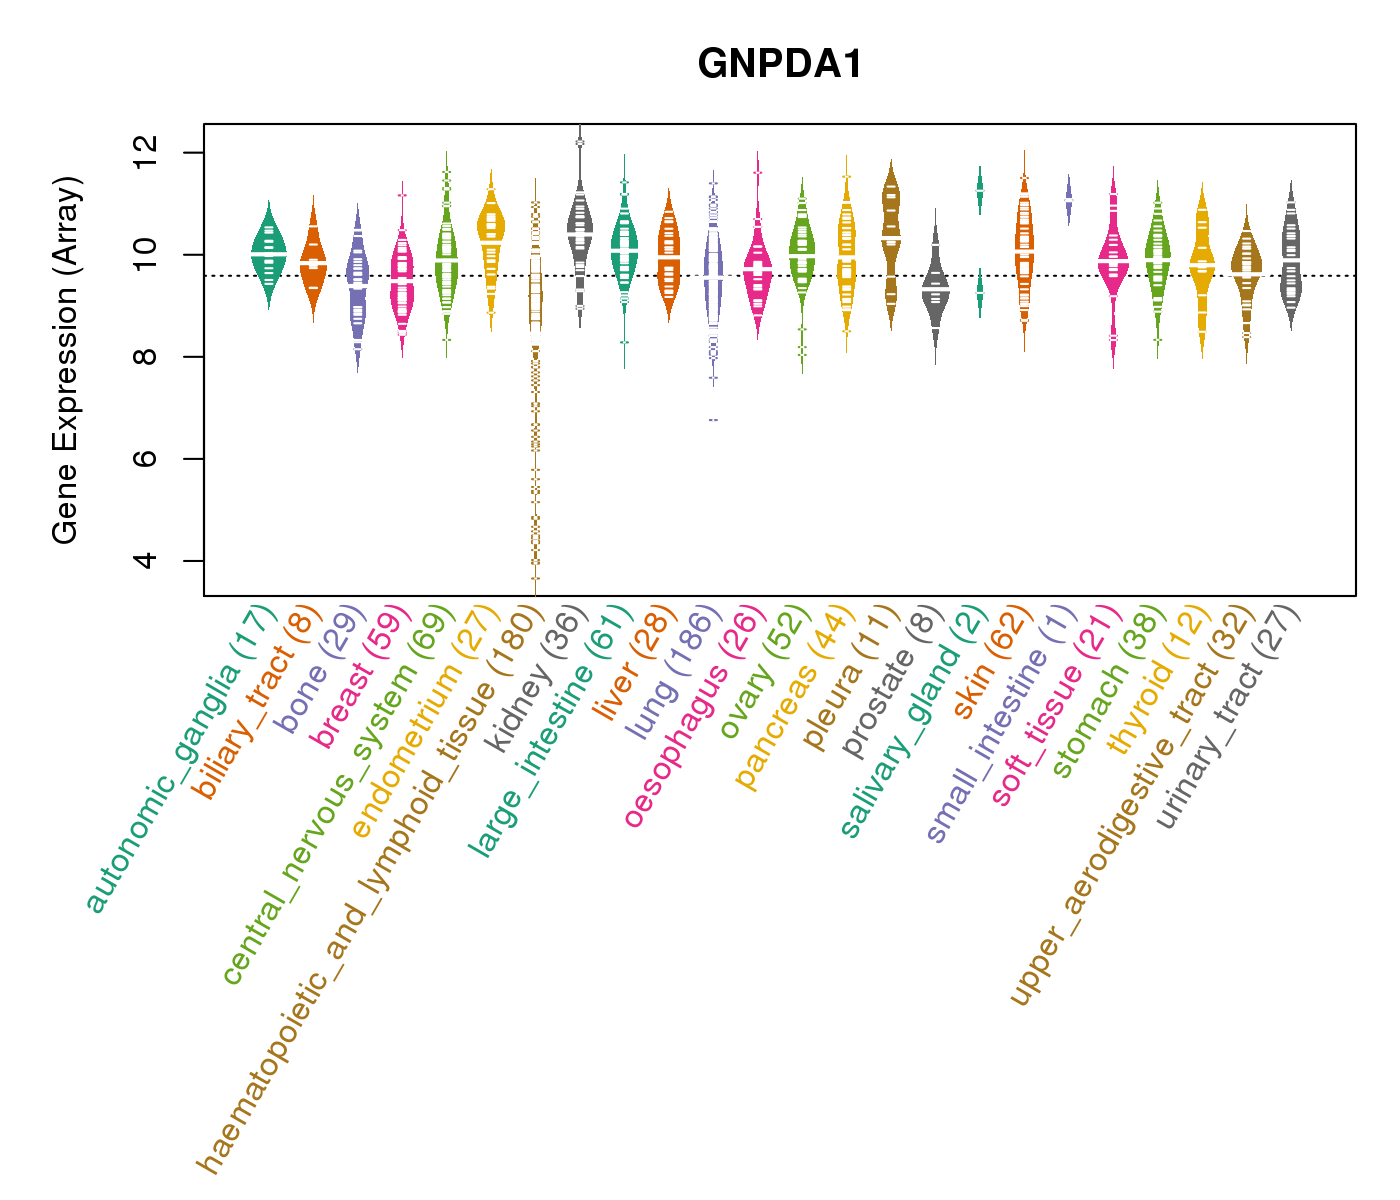
| * CCLE gene expression data were extracted from CCLE_Expression_Entrez_2012-10-18.res: Gene-centric RMA-normalized mRNA expression data. |
 |
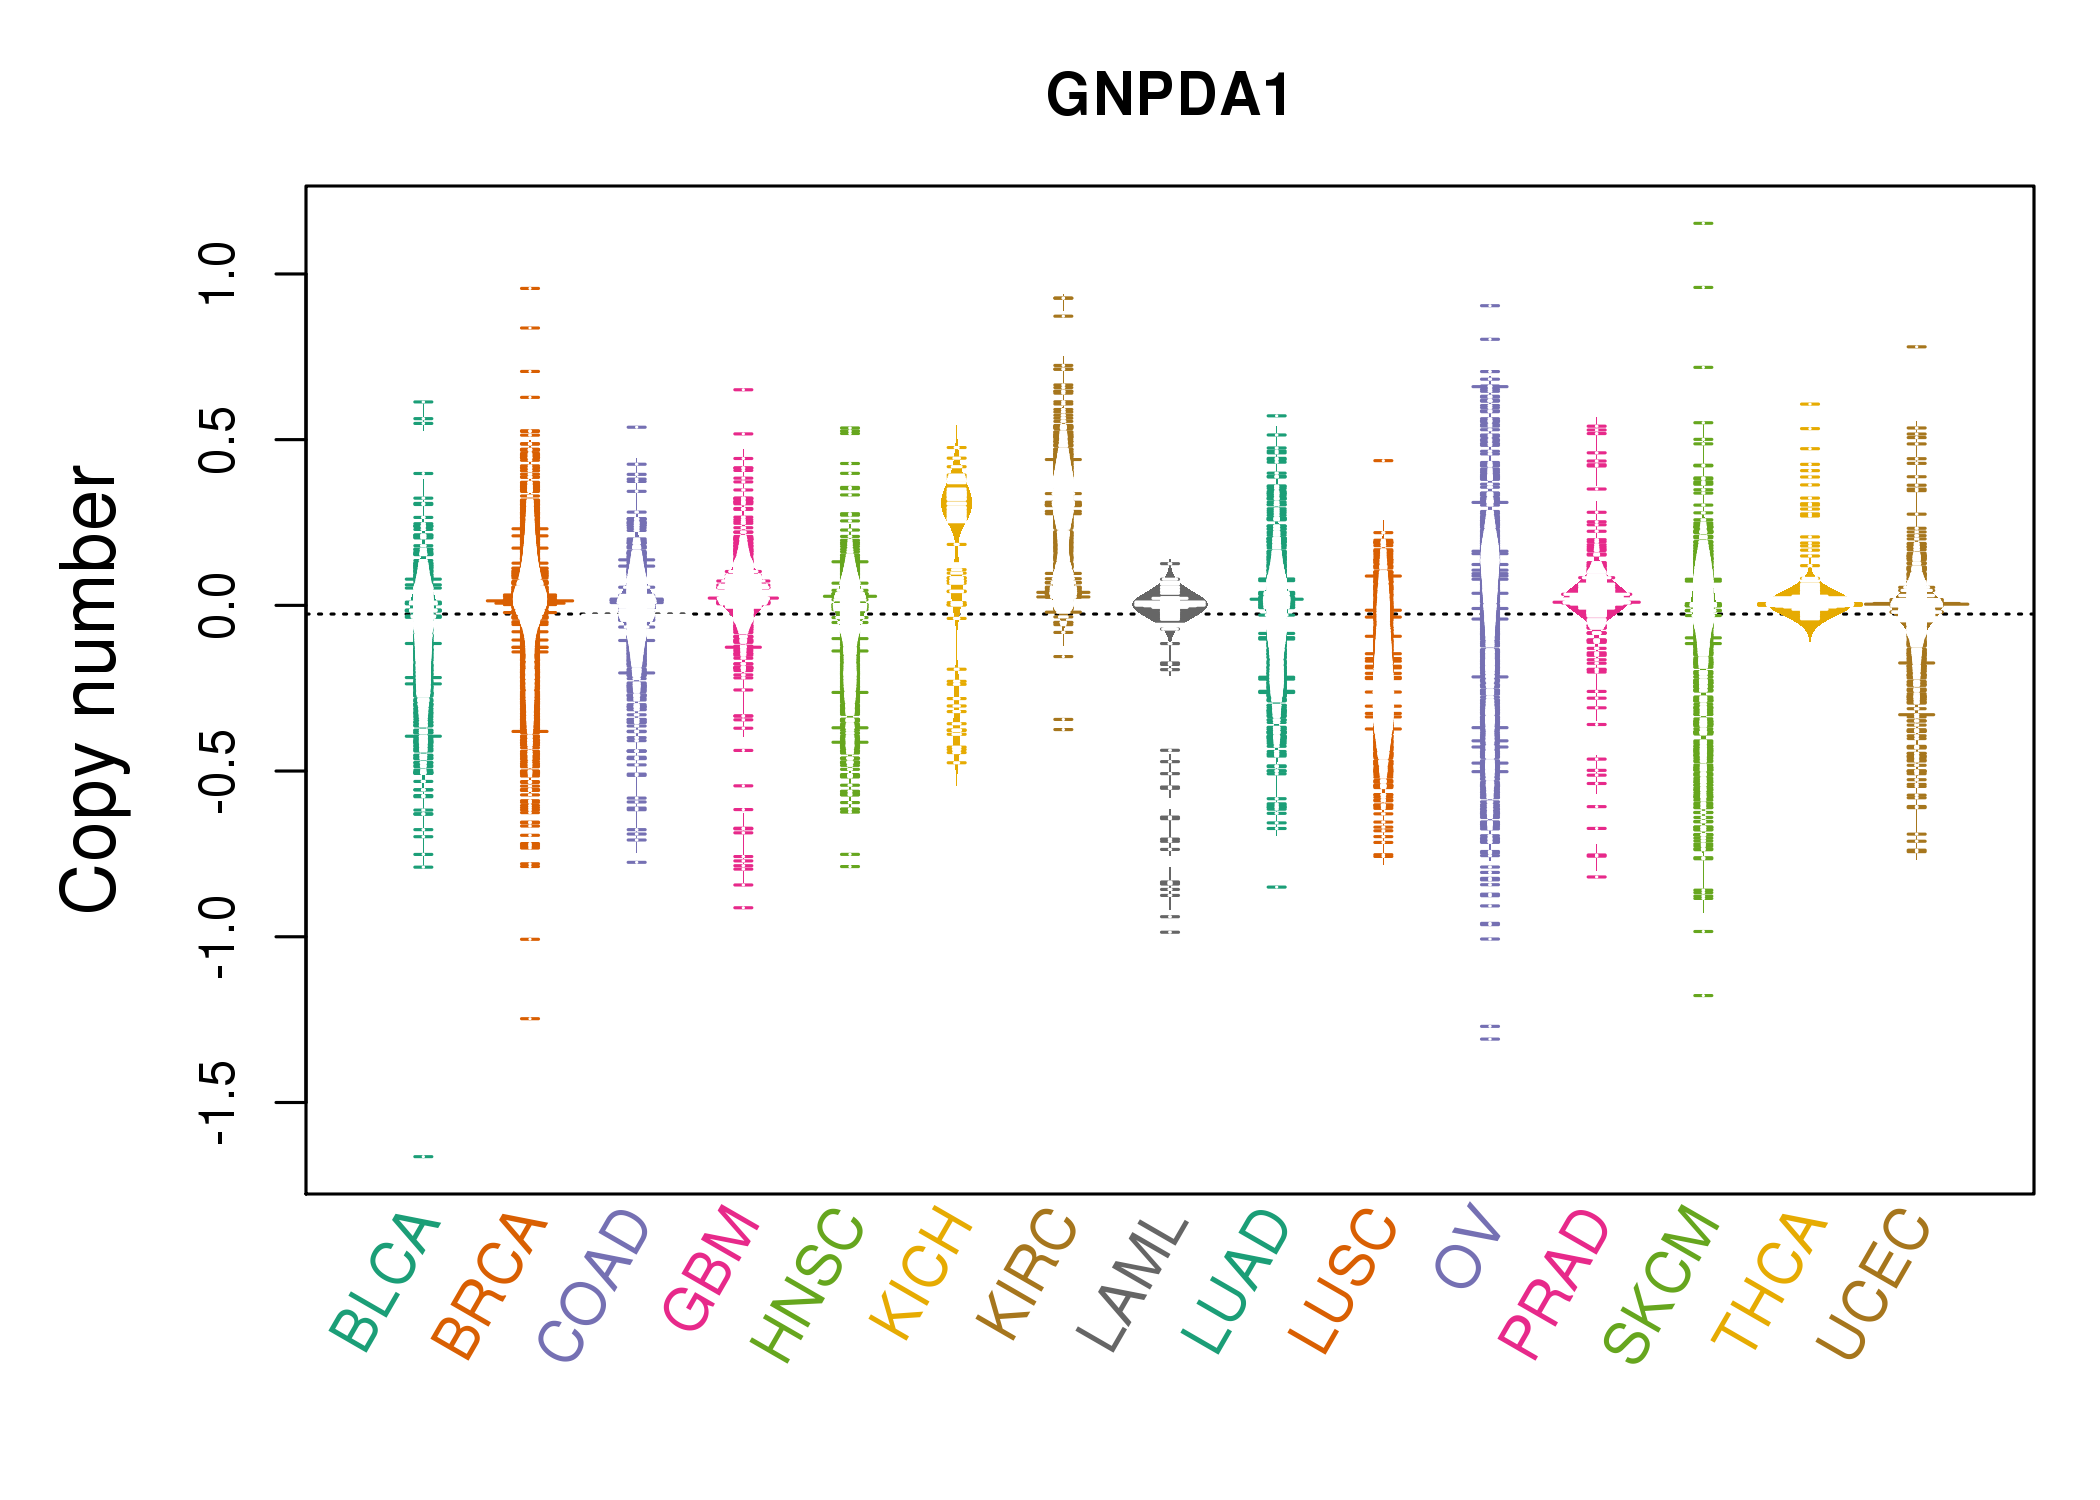
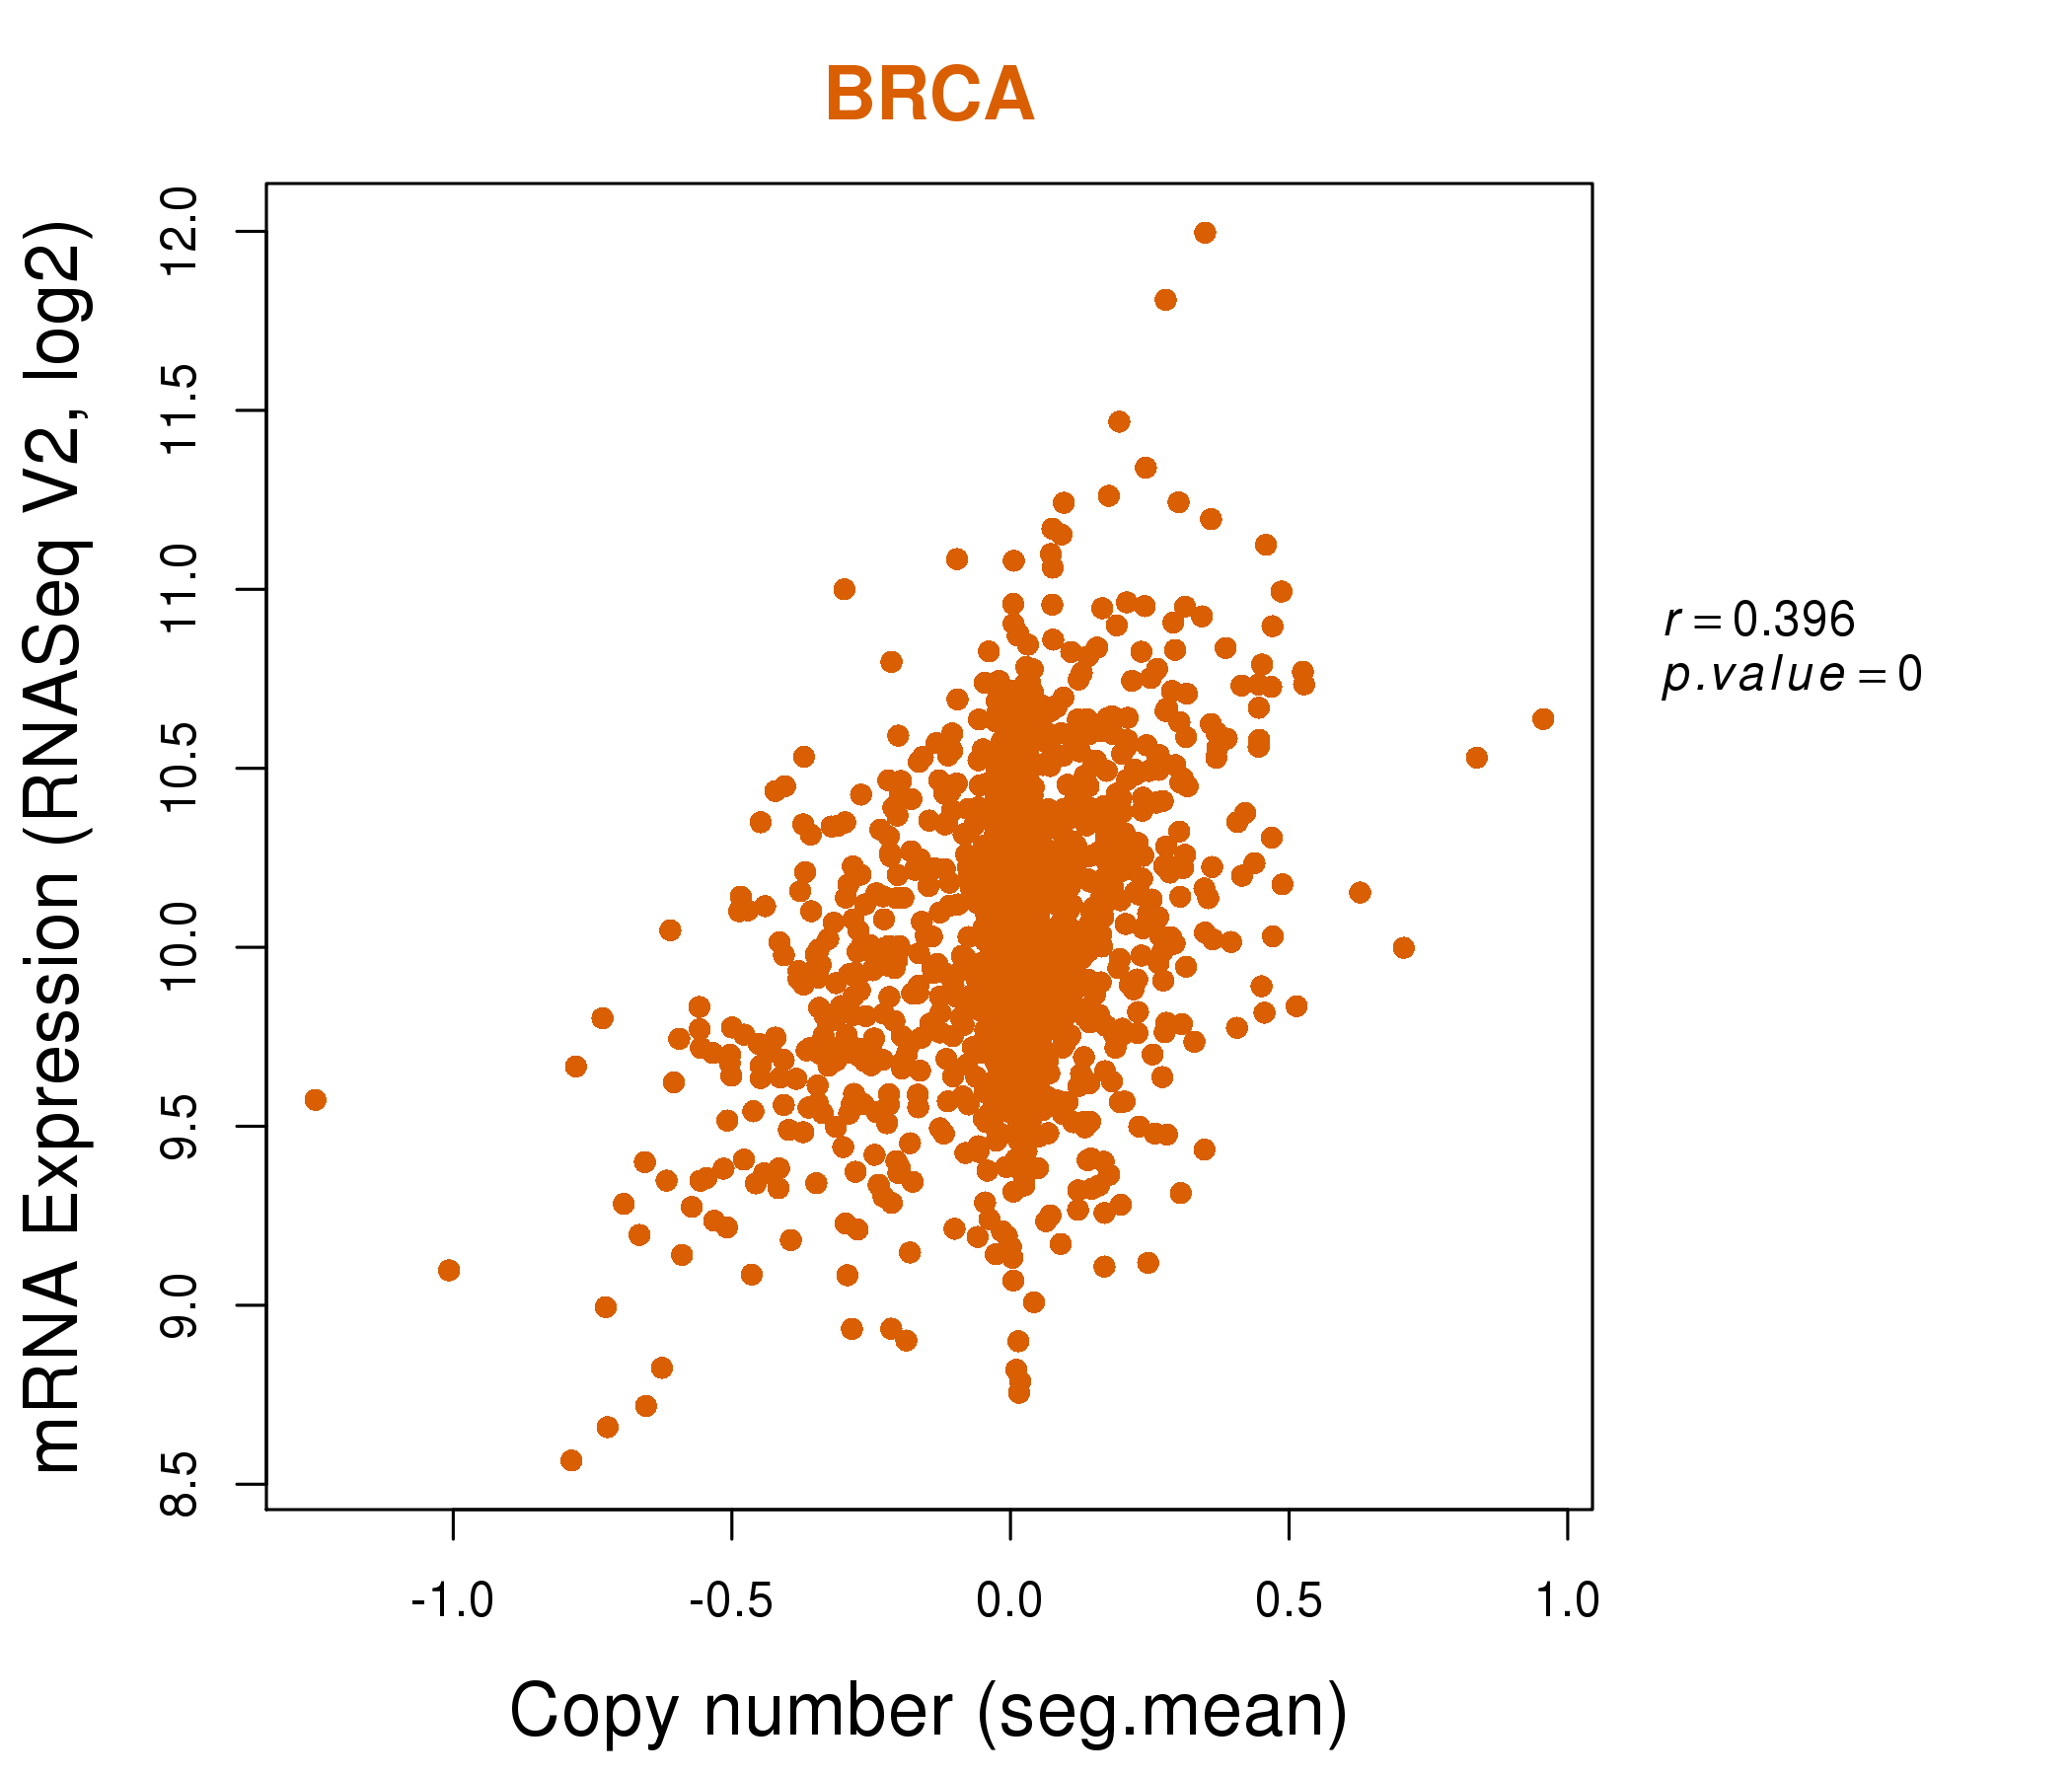
| * Normalized gene expression data of RNASeqV2 was extracted from TCGA using R package TCGA-Assembler. The URLs of all public data files on TCGA DCC data server were gathered at Jan-05-2015. Only eight cancer types have enough normal control samples for differential expression analysis. (t test, adjusted p<0.05 (using Benjamini-Hochberg FDR)) |
 |
| Top |
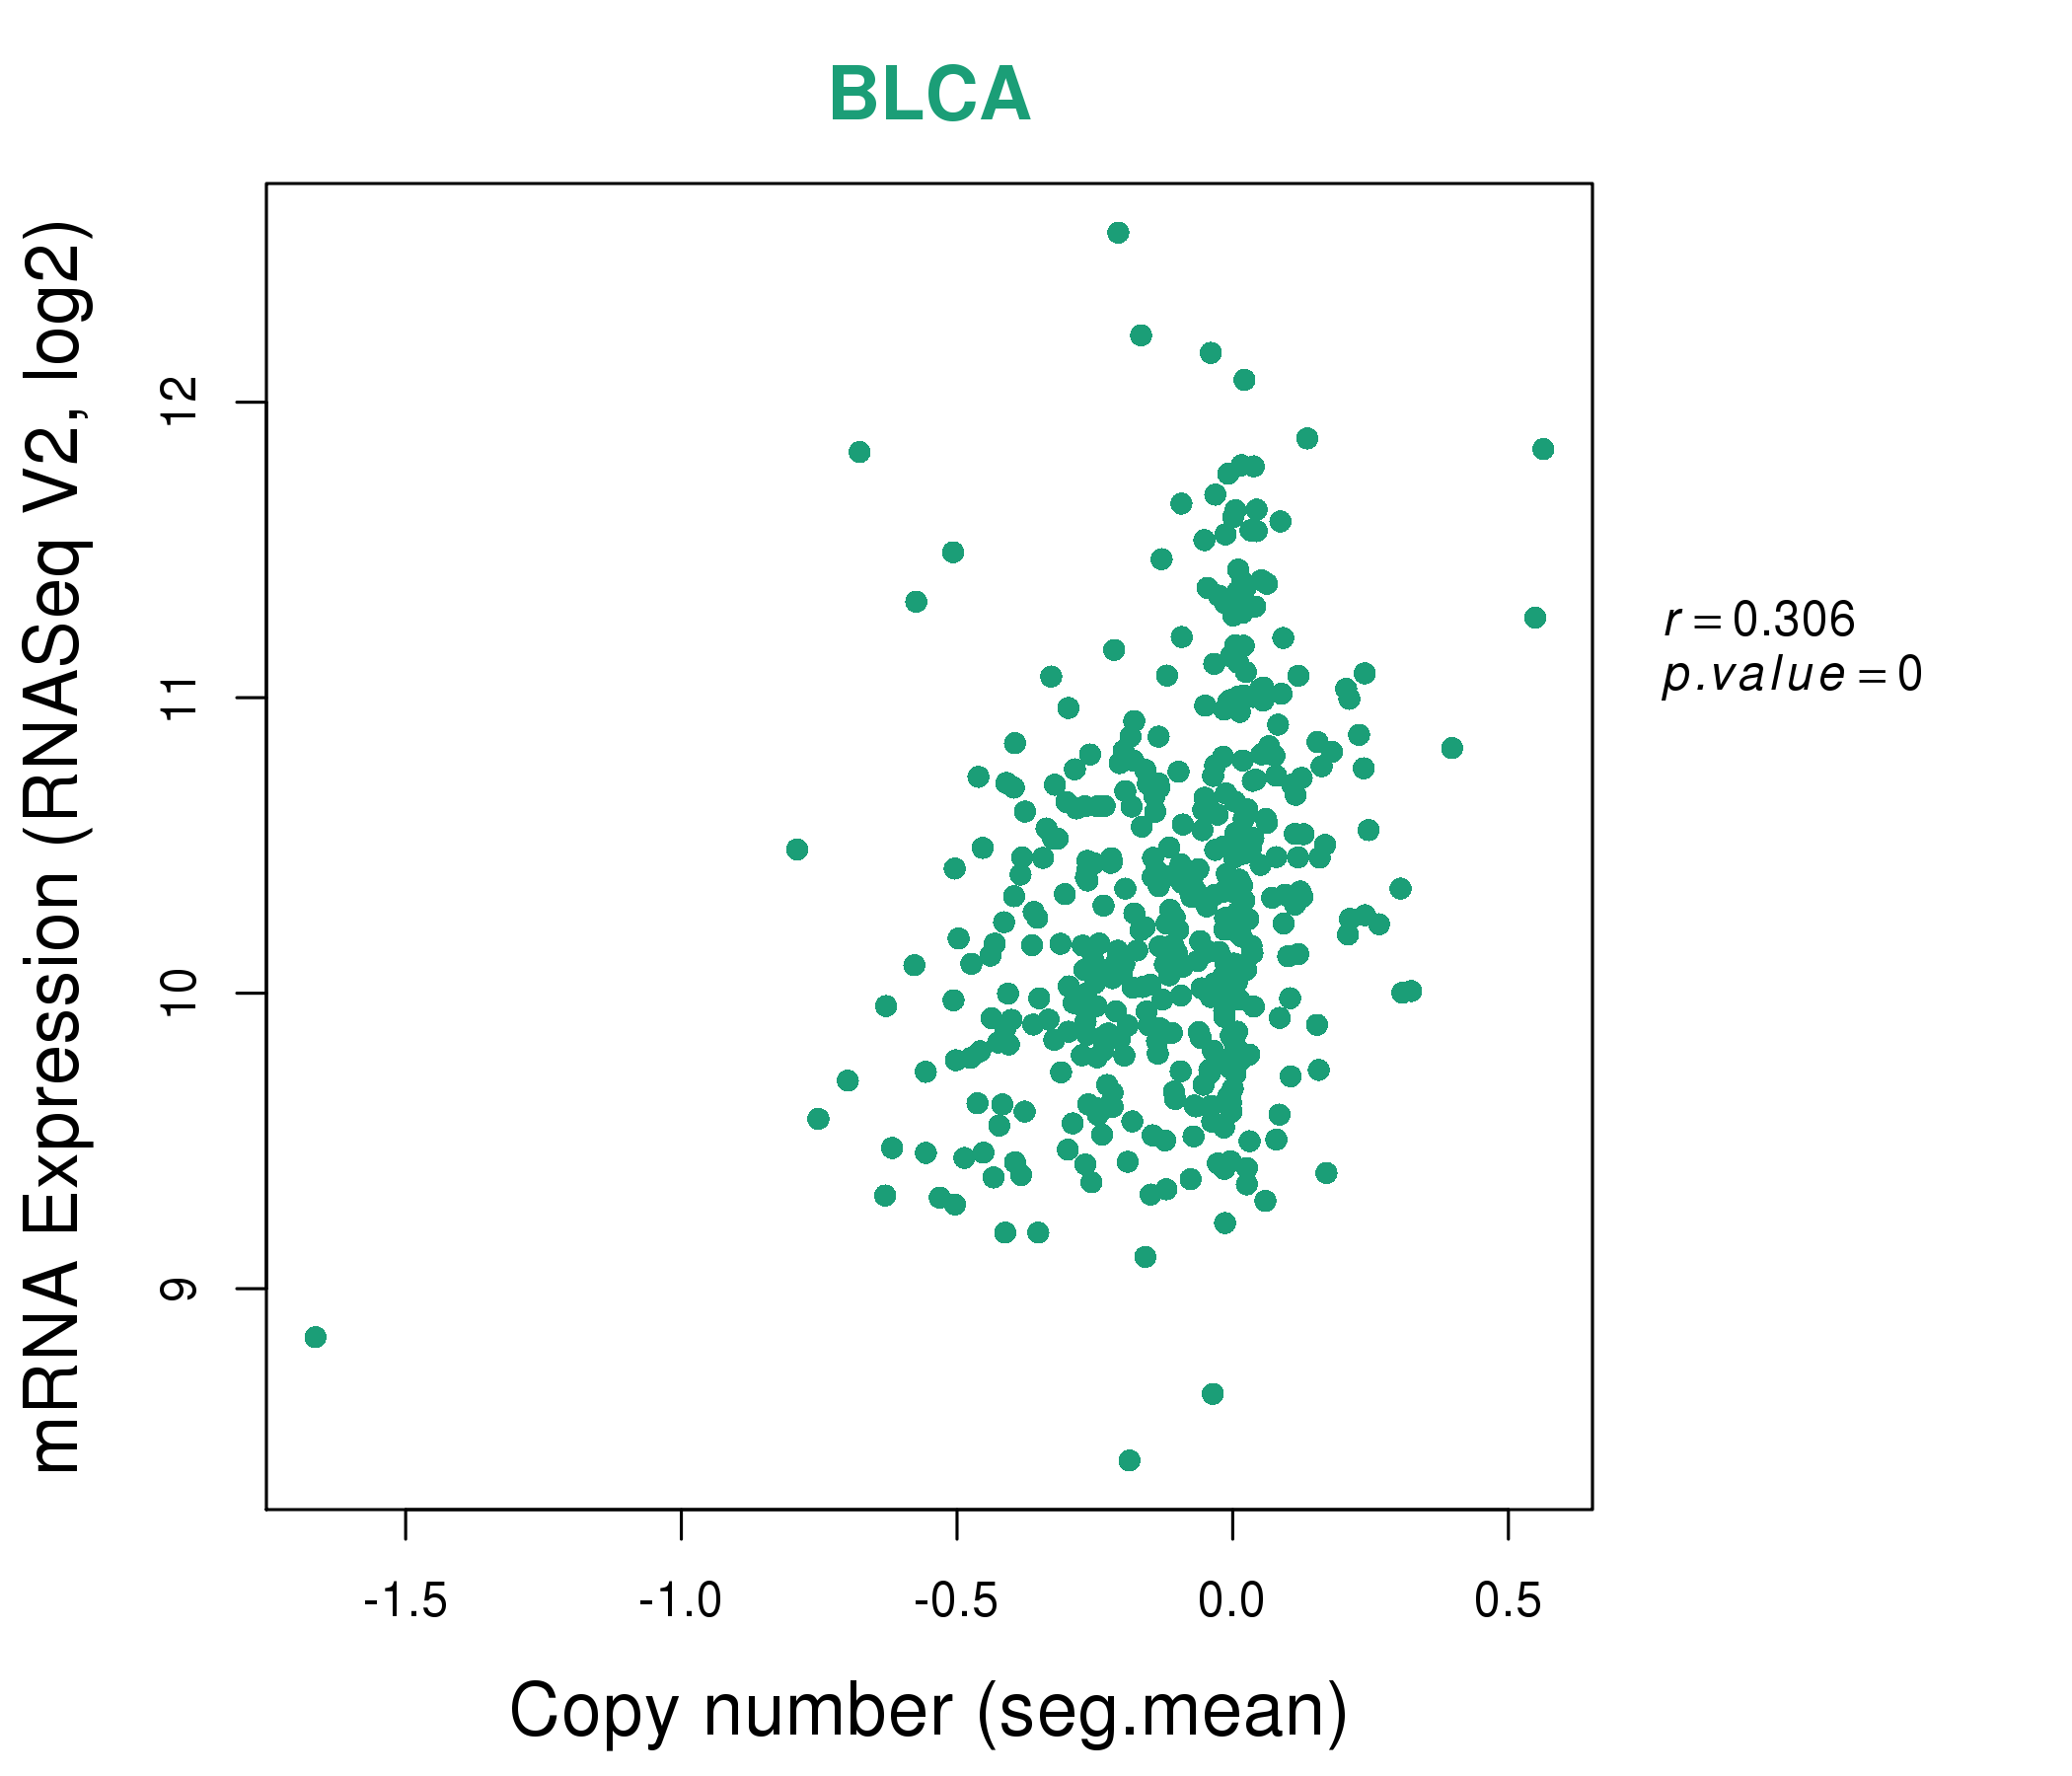
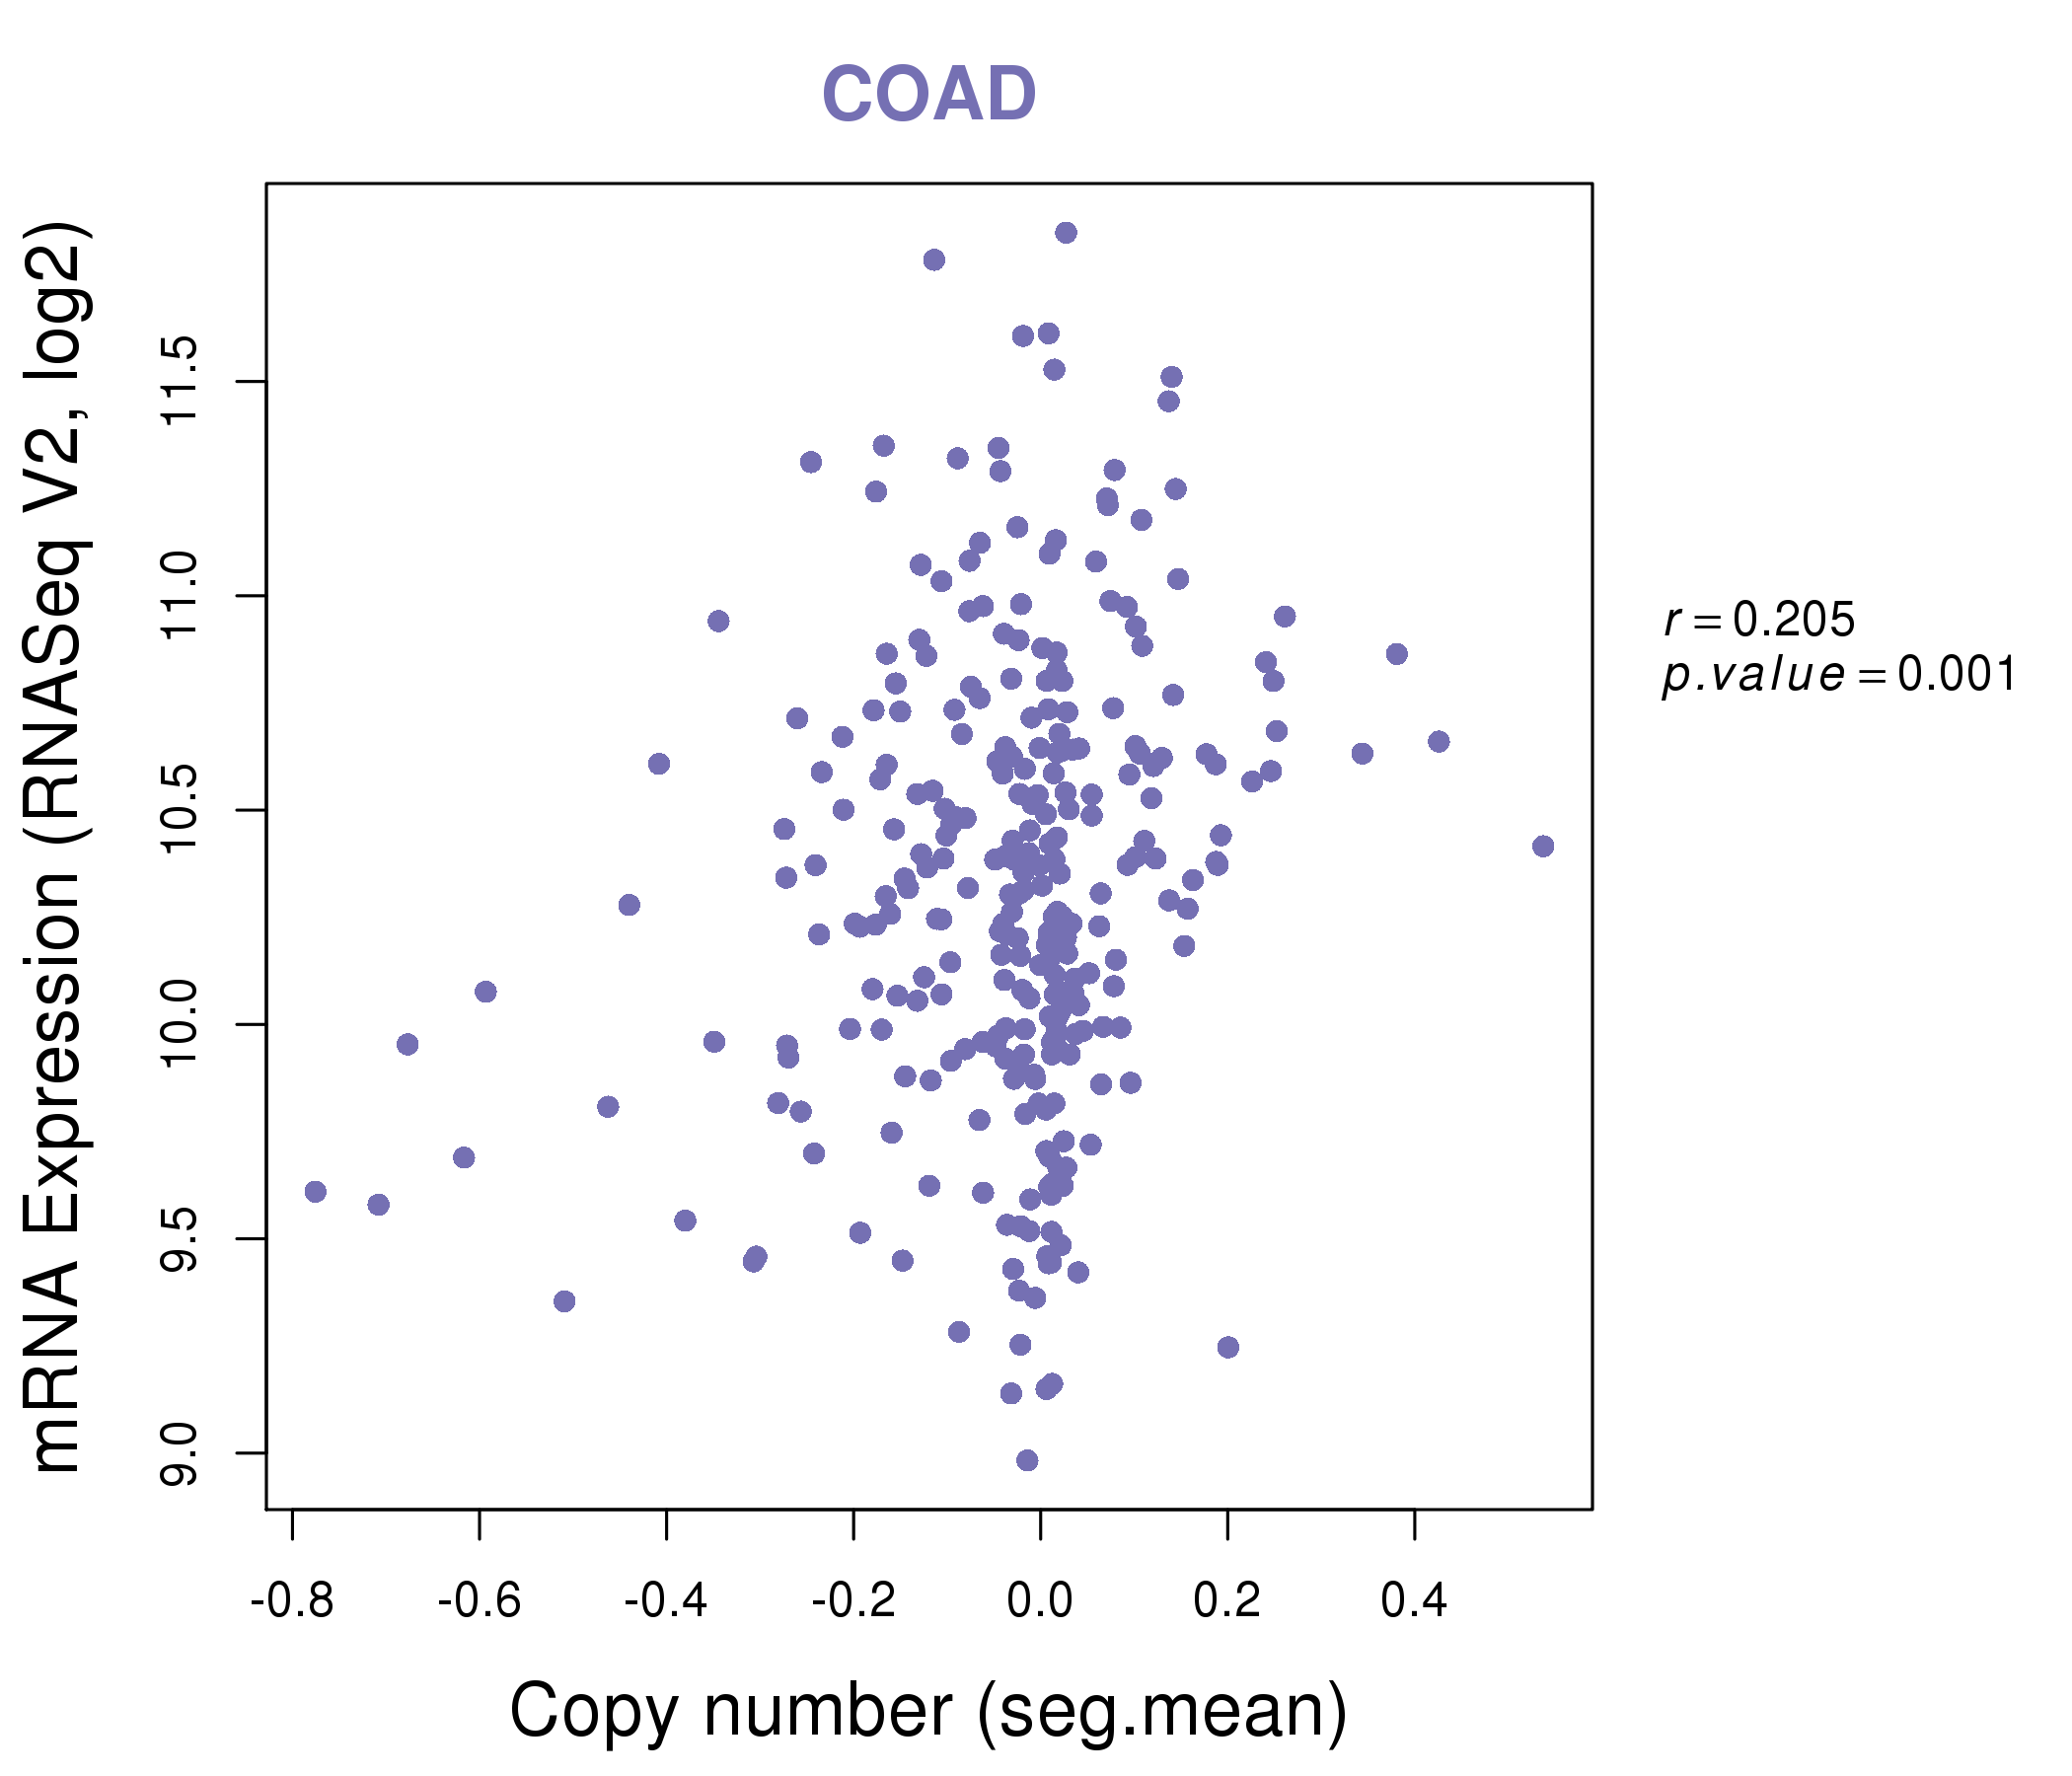
| * This plots show the correlation between CNV and gene expression. |
: Open all plots for all cancer types
 |
|
 |
|

| Top |
| Gene-Gene Network Information |
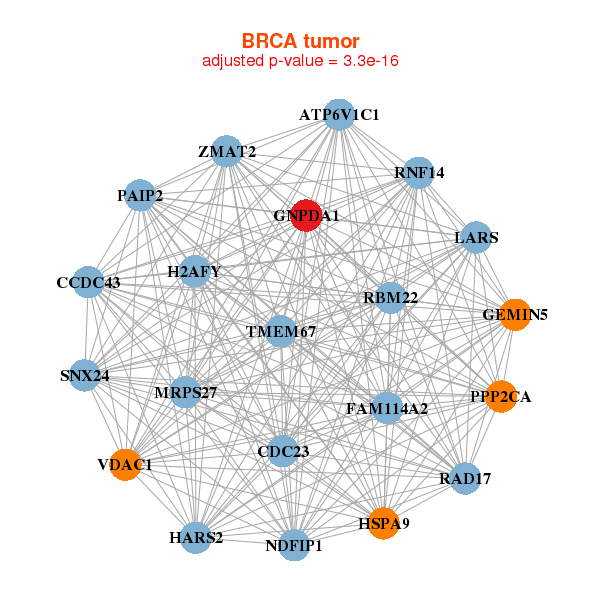
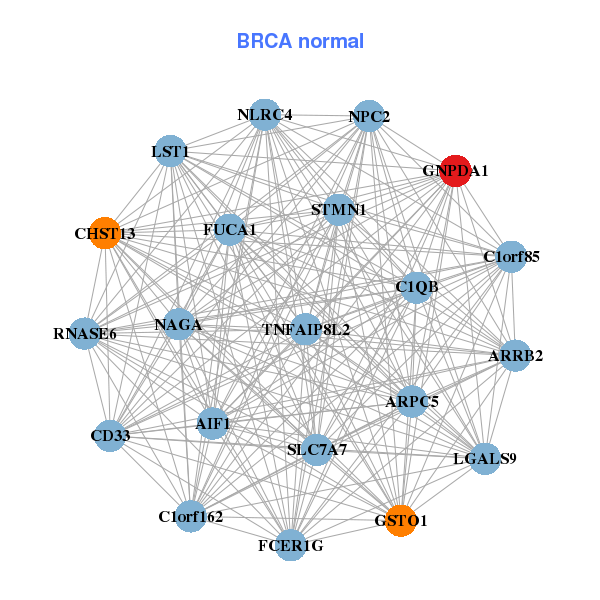
| * Co-Expression network figures were drawn using R package igraph. Only the top 20 genes with the highest correlations were shown. Red circle: input gene, orange circle: cell metabolism gene, sky circle: other gene |
: Open all plots for all cancer types
 |
| ||||
| ATP6V1C1,CCDC43,CDC23,FAM114A2,GEMIN5,GNPDA1,H2AFY, HARS2,HSPA9,LARS,MRPS27,NDFIP1,PAIP2,PPP2CA, RAD17,RBM22,RNF14,SNX24,TMEM67,VDAC1,ZMAT2 | AIF1,ARPC5,ARRB2,C1orf162,C1orf85,C1QB,CD33, CHST13,FCER1G,FUCA1,GNPDA1,GSTO1,LGALS9,LST1, NAGA,NLRC4,NPC2,RNASE6,SLC7A7,STMN1,TNFAIP8L2 | ||||
 |
| ||||
| ABCF2,AHCY,ATP5E,ATP6V1F,COPRS,C20orf24,MALSU1, CDK5,EIF2S2,GNPDA1,HDAC3,MRPS23,NIT2,PDRG1, PDZD11,PSMA7,PSMB3,RAE1,ROMO1,TP53RK,UQCC1 | ALDH1A1,ATP6V1B2,CISD1,CUTC,CYB5A,DKFZp779M0652,FTL, GATM,GNPDA1,LMO4,NINJ1,PFN2,RWDD2A,SCPEP1, SIRT2,SIRT4,SNX2,STOML1,VKORC1,ZBTB14,ZNF16 |
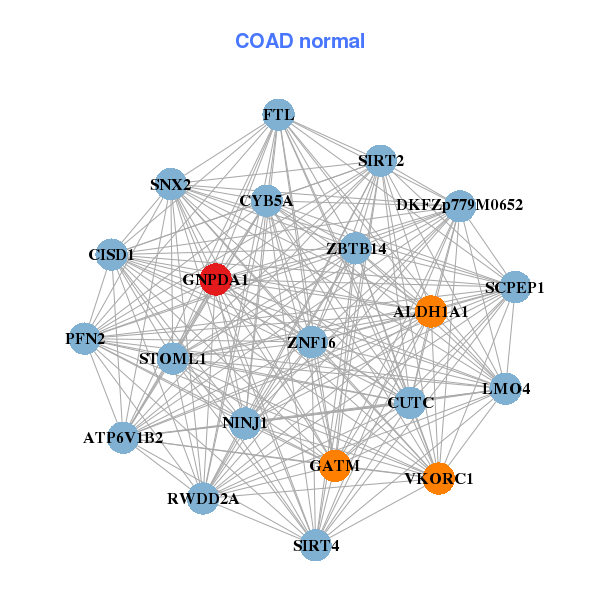
| * Co-Expression network figures were drawn using R package igraph. Only the top 20 genes with the highest correlations were shown. Red circle: input gene, orange circle: cell metabolism gene, sky circle: other gene |
: Open all plots for all cancer types
| Top |
: Open all interacting genes' information including KEGG pathway for all interacting genes from DAVID
| Top |
| Pharmacological Information for GNPDA1 |
| DB Category | DB Name | DB's ID and Url link |
| * Gene Centered Interaction Network. |
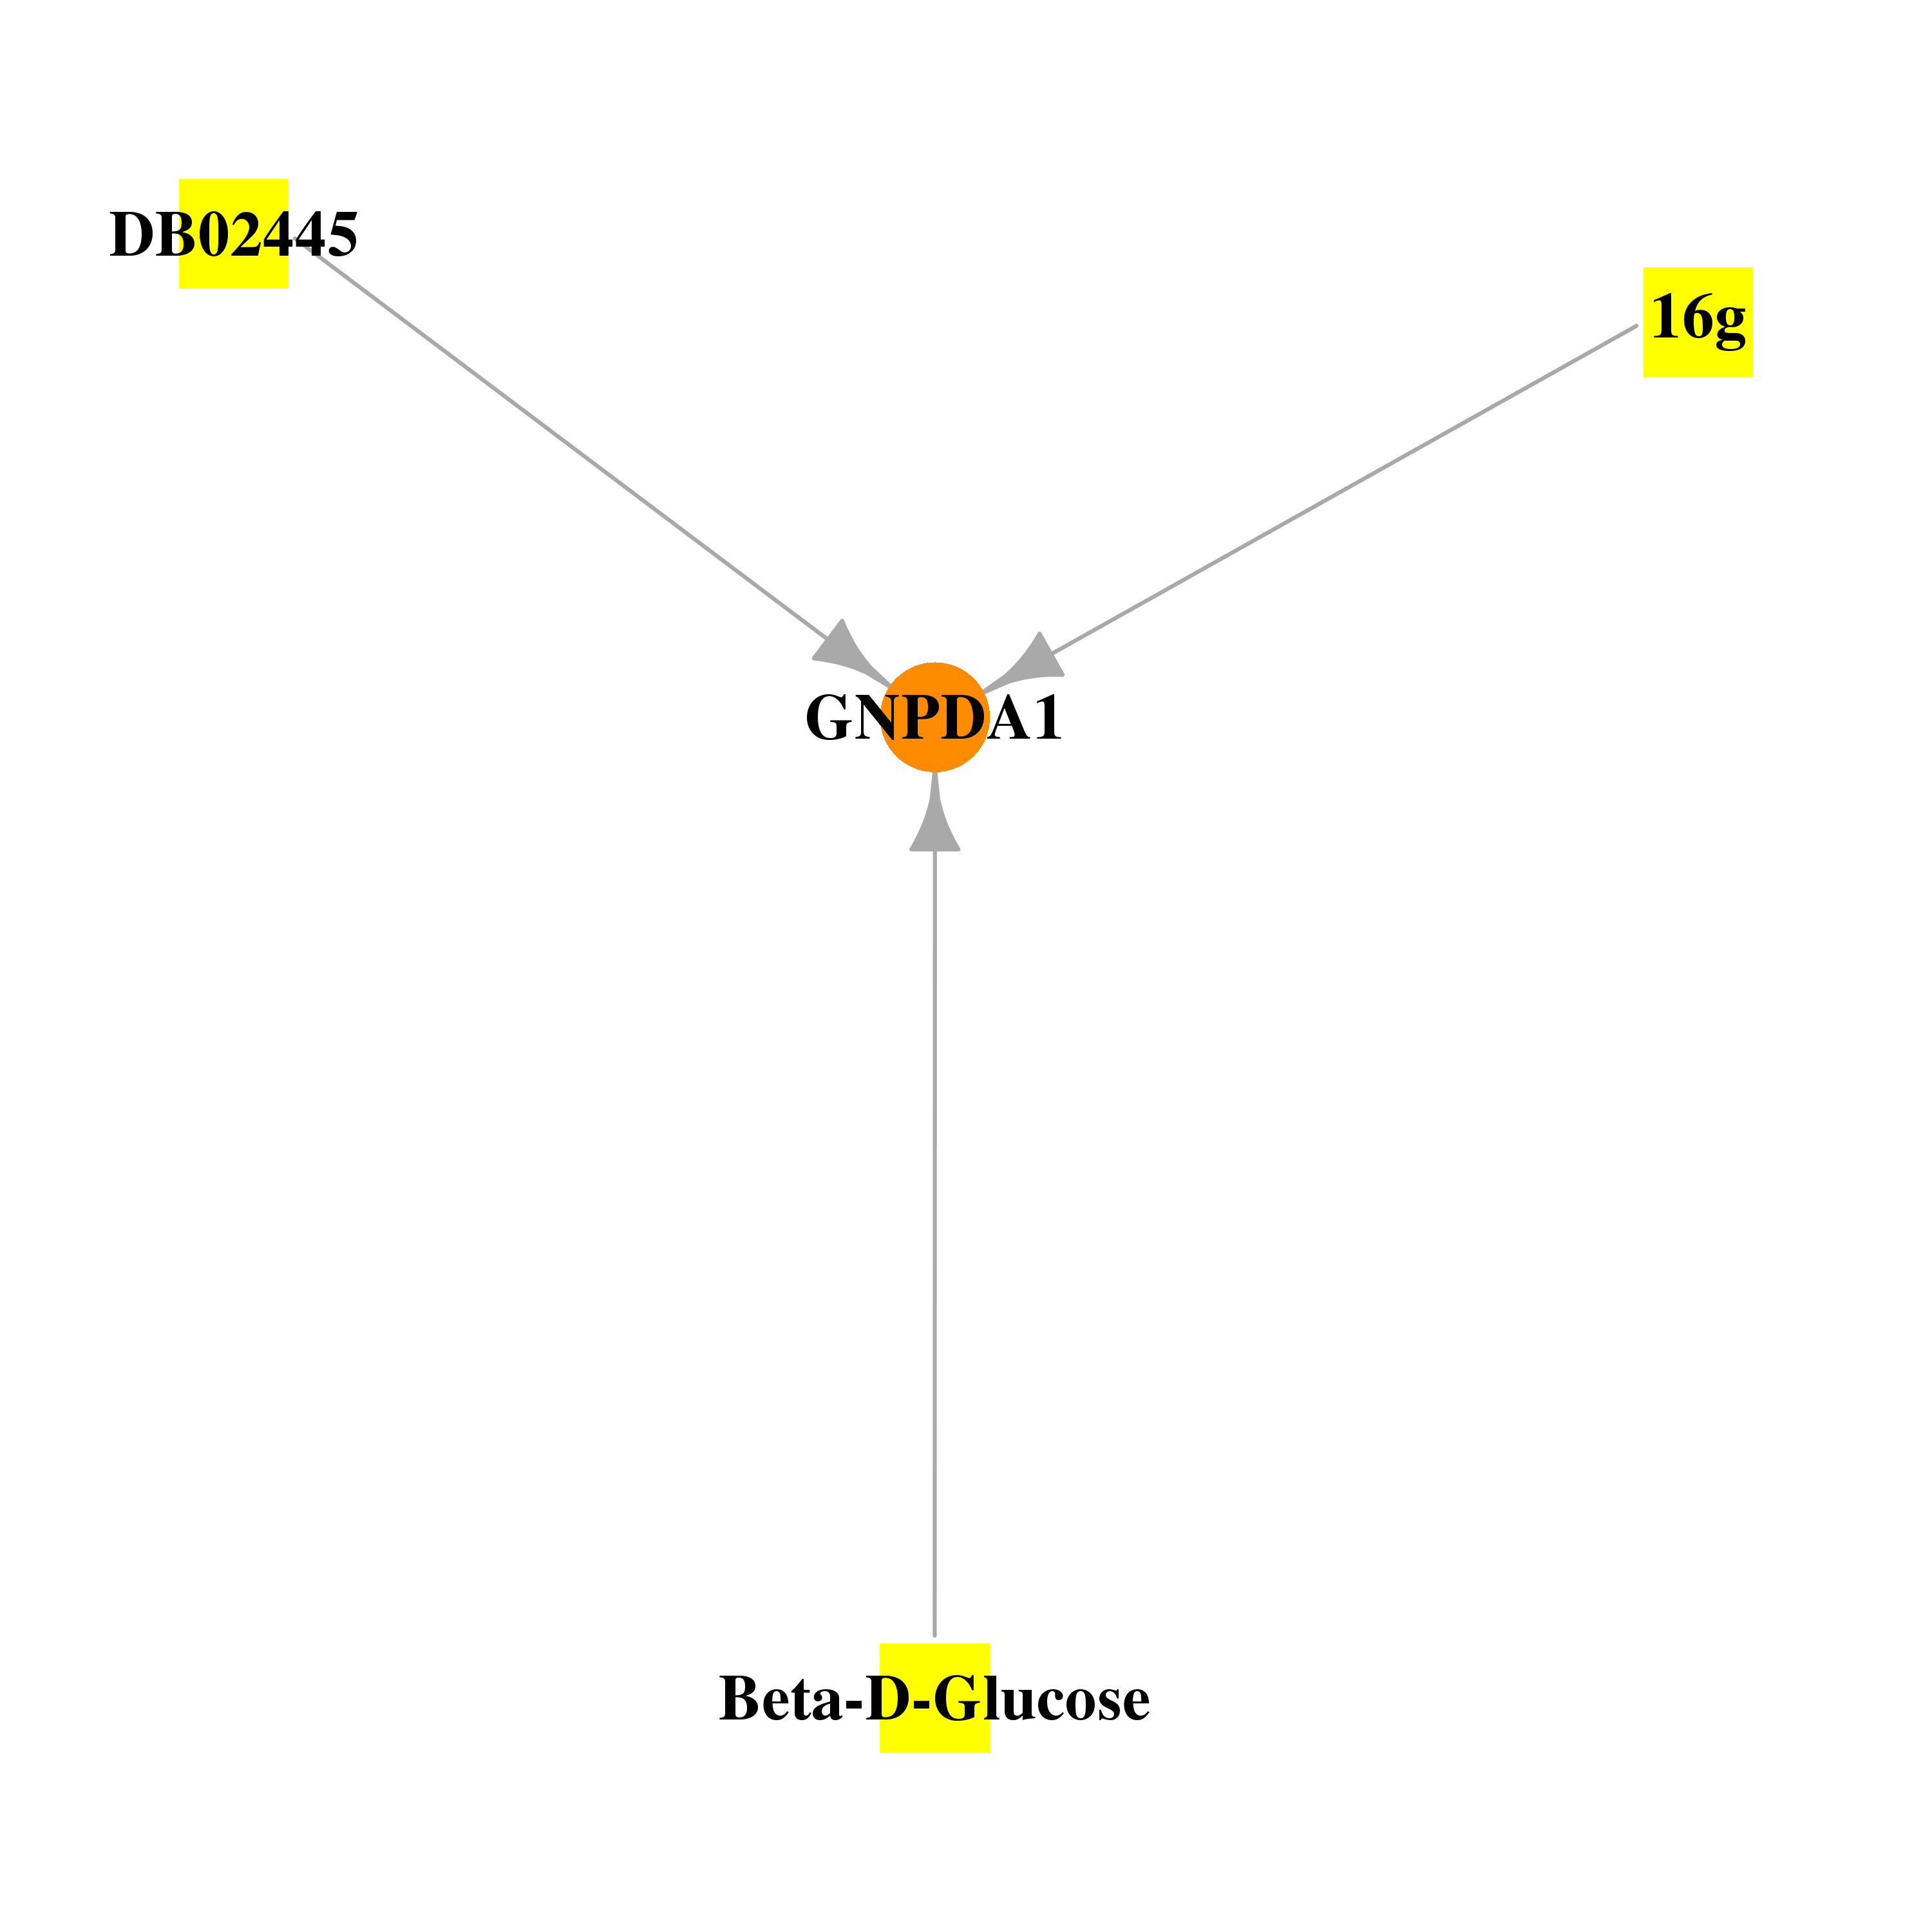 |
| * Drug Centered Interaction Network. |
| DrugBank ID | Target Name | Drug Groups | Generic Name | Drug Centered Network | Drug Structure |
| DB02379 | glucosamine-6-phosphate deaminase 1 | experimental | Beta-D-Glucose | 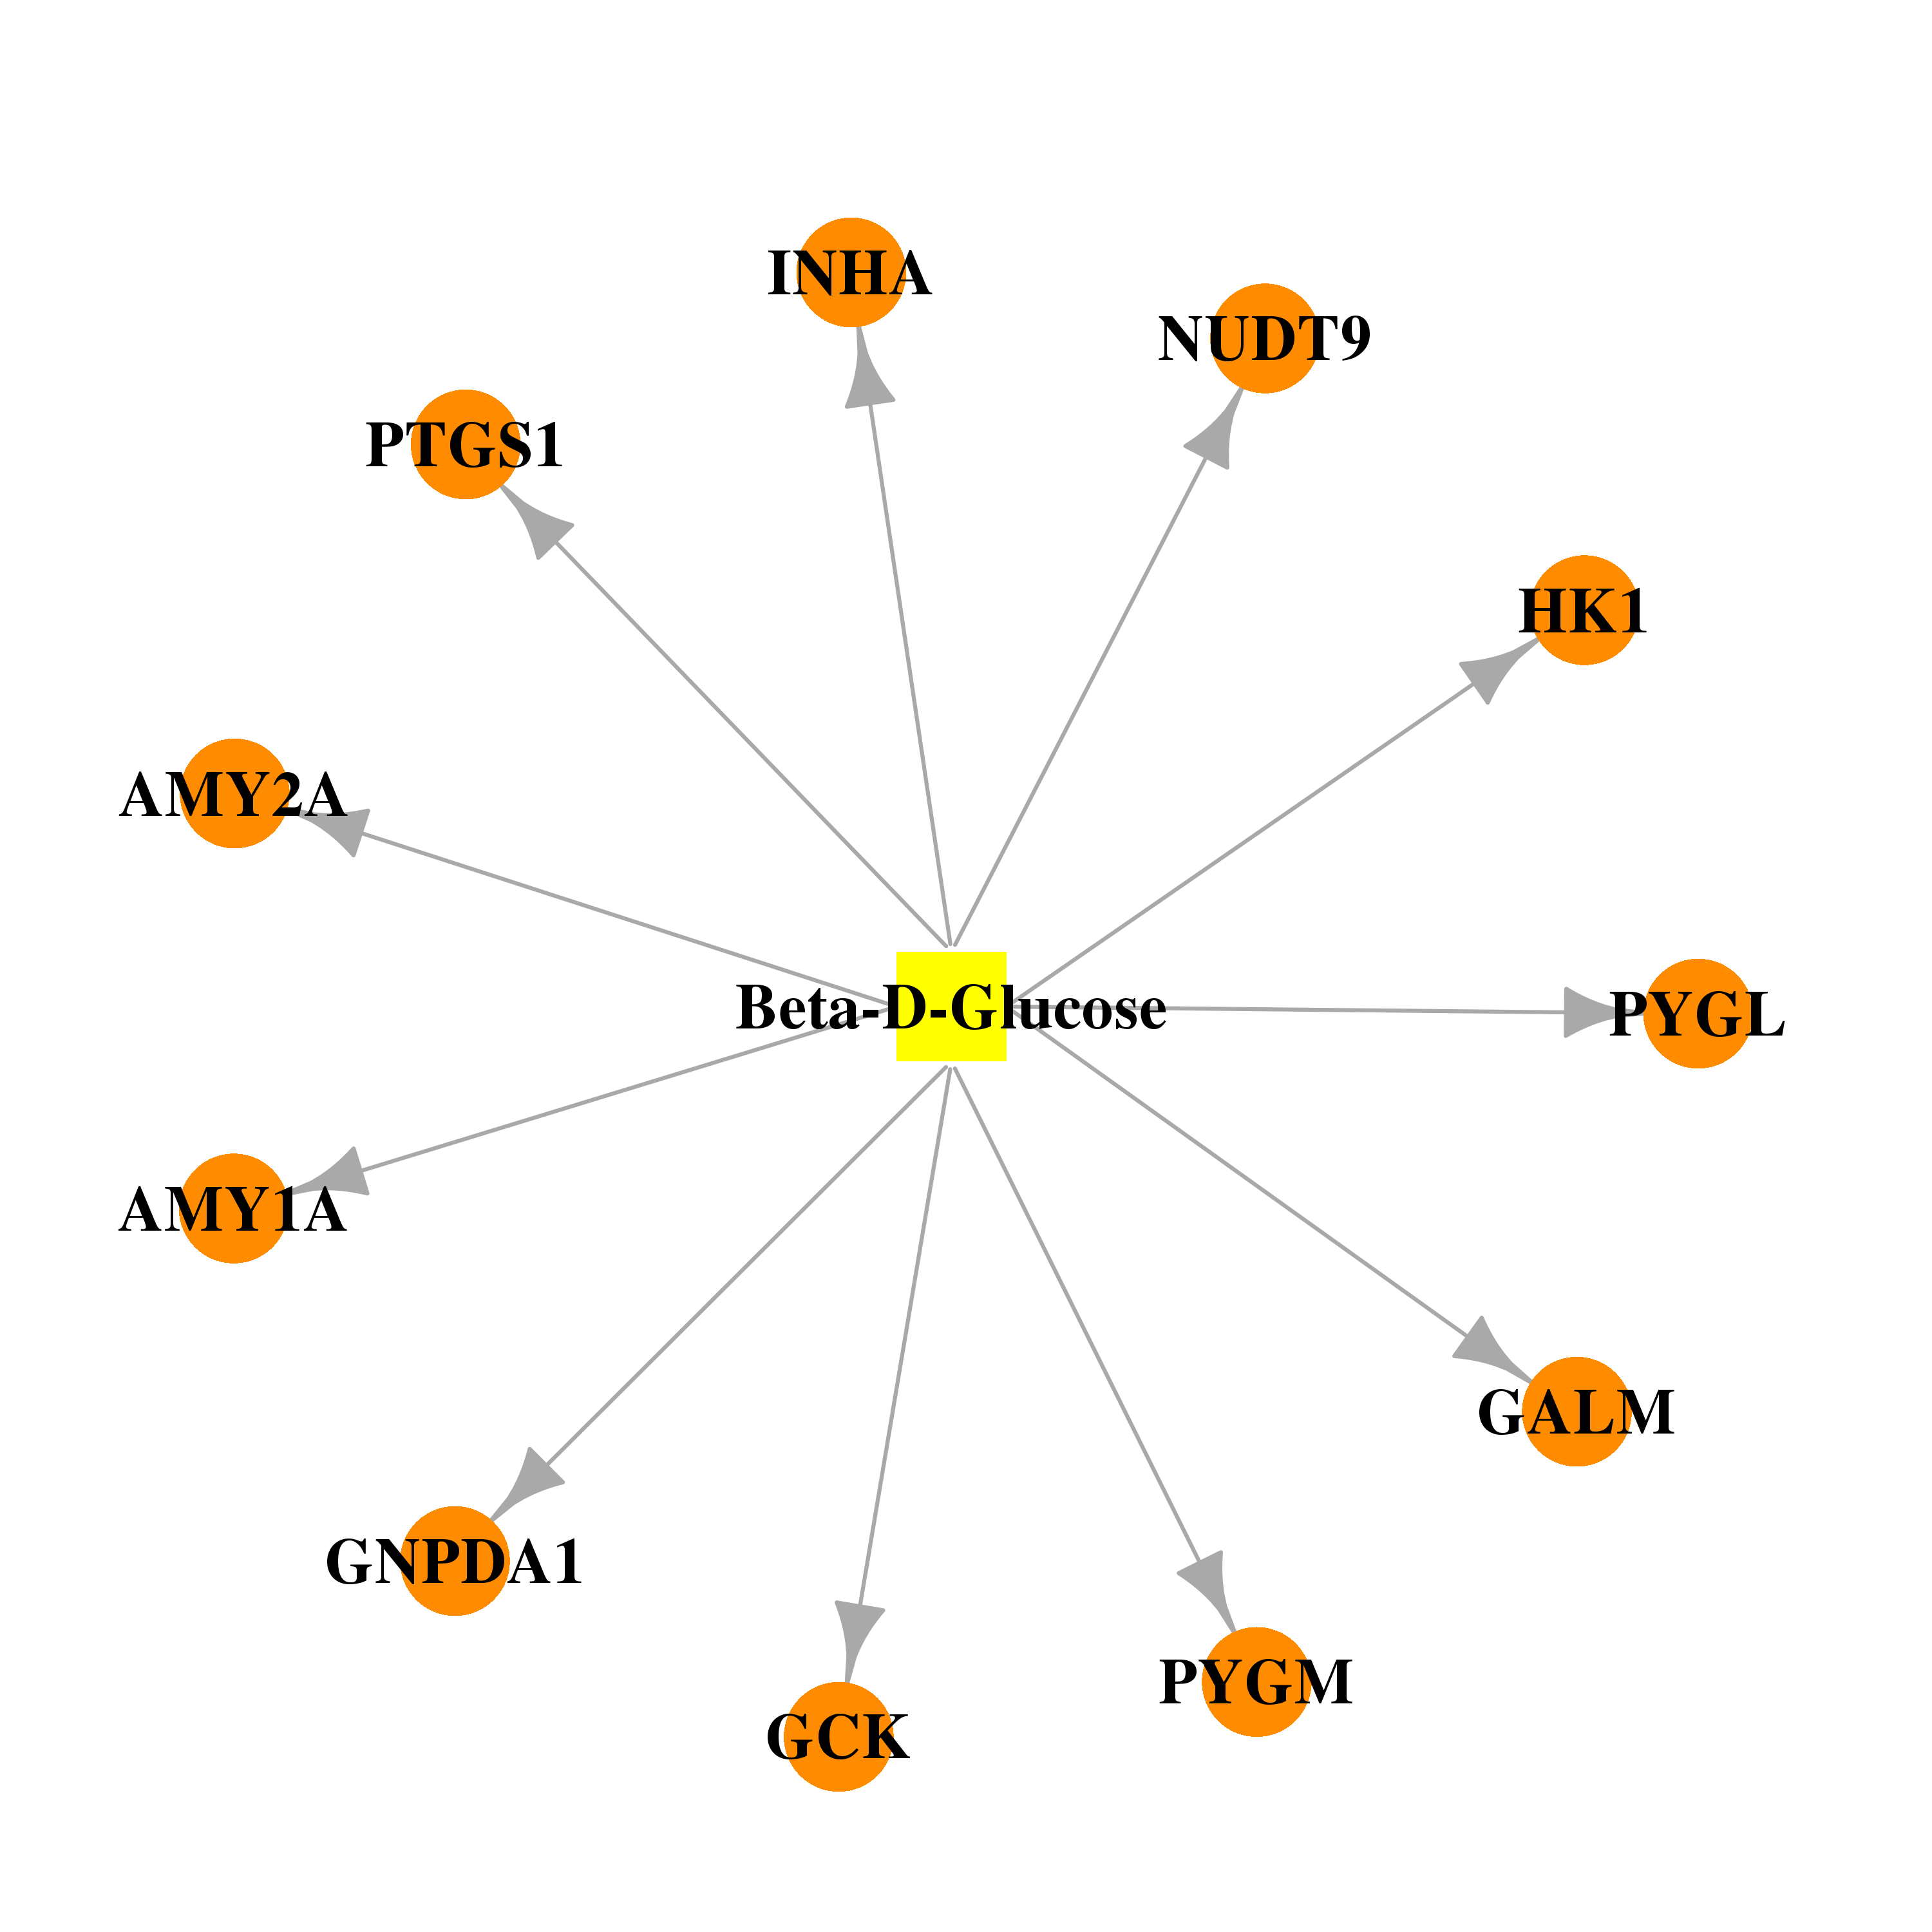 | 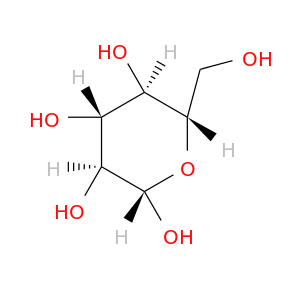 |
| DB02445 | glucosamine-6-phosphate deaminase 1 | experimental | 2-Deoxy-2-Amino Glucitol-6-Phosphate | 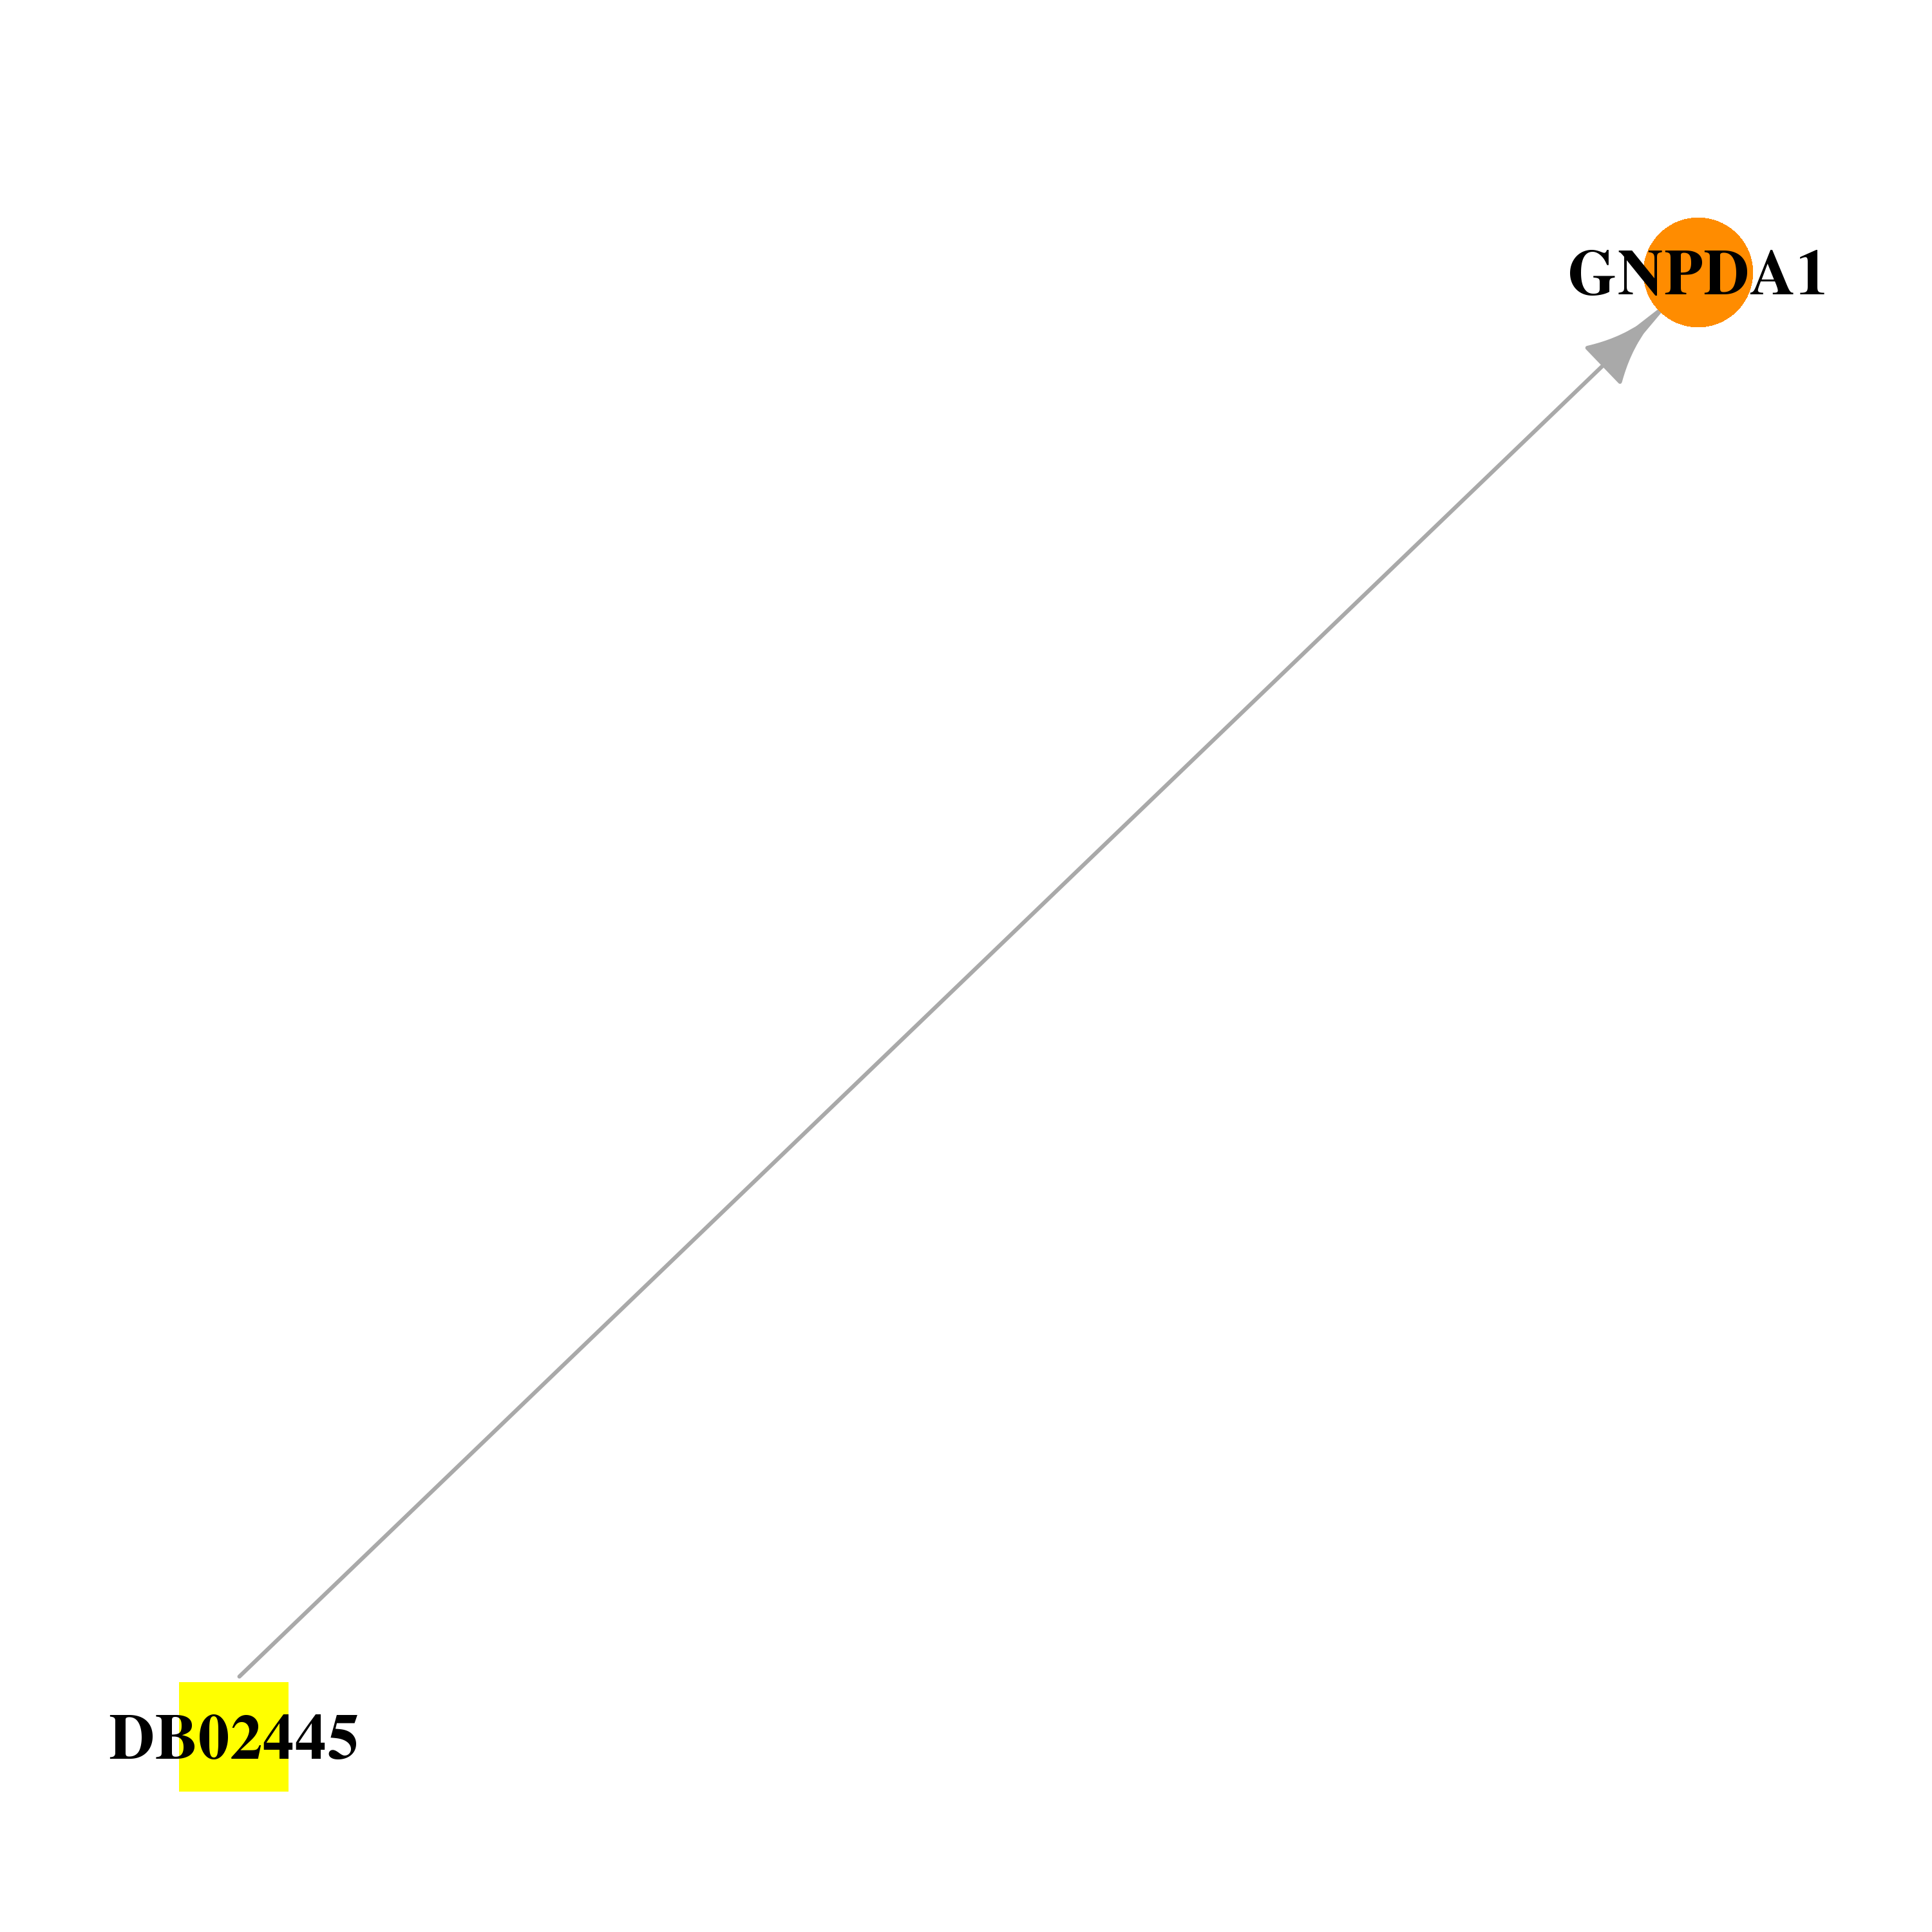 |  |
| DB03951 | glucosamine-6-phosphate deaminase 1 | experimental | 16g |  | 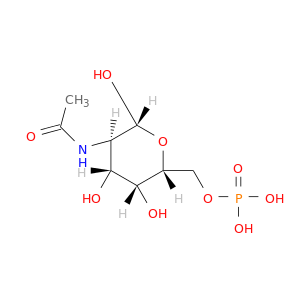 |
| Top |
| Cross referenced IDs for GNPDA1 |
| * We obtained these cross-references from Uniprot database. It covers 150 different DBs, 18 categories. http://www.uniprot.org/help/cross_references_section |
: Open all cross reference information
|
Copyright © 2016-Present - The Univsersity of Texas Health Science Center at Houston @ |