|
||||||||||||||||||||||||||||||||||||||||||||||||||||||||||||||||||||||||||||||||||||||||||||||||||||||||||||||||||||||||||||||||||||||||||||||||||||||||||||||||||||||||||||||||||||||||||||||||||||||||||||||||||||||||||||||||||||||||||||||||||||||||||||||||||||||||||||||||||||||||||||||||||||||||||||||||||||||||||
| |
| Phenotypic Information (metabolism pathway, cancer, disease, phenome) |
| |
| |
| Gene-Gene Network Information: Co-Expression Network, Interacting Genes & KEGG |
| |
|


| Gene Summary for GNE |
| Basic gene info. | Gene symbol | GNE |
| Gene name | glucosamine (UDP-N-acetyl)-2-epimerase/N-acetylmannosamine kinase | |
| Synonyms | DMRV|GLCNE|IBM2|NM|Uae1 | |
| Cytomap | UCSC genome browser: 9p13.3 | |
| Genomic location | chr9 :36214438-36258496 | |
| Type of gene | protein-coding | |
| RefGenes | NM_001128227.2, NM_001190383.1,NM_001190384.1,NM_001190388.1,NM_005476.5, | |
| Ensembl id | ENSG00000159921 | |
| Description | N-acylmannosamine kinaseUDP-GlcNAc-2-epimerase/ManAc kinaseUDP-N-acetylglucosamine 2-epimerase/N-acetylmannosamine kinaseUDP-N-acetylglucosamine-2-epimerase/N-acetylmannosamine kinasebifunctional UDP-N-acetylglucosamine 2-epimerase/N-acetylmannosamine | |
| Modification date | 20141222 | |
| dbXrefs | MIM : 603824 | |
| HGNC : HGNC | ||
| Ensembl : ENSG00000159921 | ||
| HPRD : 04825 | ||
| Vega : OTTHUMG00000019899 | ||
| Protein | UniProt: go to UniProt's Cross Reference DB Table | |
| Expression | CleanEX: HS_GNE | |
| BioGPS: 10020 | ||
| Gene Expression Atlas: ENSG00000159921 | ||
| The Human Protein Atlas: ENSG00000159921 | ||
| Pathway | NCI Pathway Interaction Database: GNE | |
| KEGG: GNE | ||
| REACTOME: GNE | ||
| ConsensusPathDB | ||
| Pathway Commons: GNE | ||
| Metabolism | MetaCyc: GNE | |
| HUMANCyc: GNE | ||
| Regulation | Ensembl's Regulation: ENSG00000159921 | |
| miRBase: chr9 :36,214,438-36,258,496 | ||
| TargetScan: NM_001128227 | ||
| cisRED: ENSG00000159921 | ||
| Context | iHOP: GNE | |
| cancer metabolism search in PubMed: GNE | ||
| UCL Cancer Institute: GNE | ||
| Assigned class in ccmGDB | C | |
| Top |
| Phenotypic Information for GNE(metabolism pathway, cancer, disease, phenome) |
| Cancer | CGAP: GNE |
| Familial Cancer Database: GNE | |
| * This gene is included in those cancer gene databases. |
|
|
|
|
|
| . | ||||||||||||||||||||||||||||||||||||||||||||||||||||||||||||||||||||||||||||||||||||||||||||||||||||||||||||||||||||||||||||||||||||||||||||||||||||||||||||||||||||||||||||||||||||||||||||||||||||||||||||||||||||||||||||||||||||||||||||||||||||||||||||||||||||||||||||||||||||||||||||||||||||||||||||||||||||
Oncogene 1 | Significant driver gene in | |||||||||||||||||||||||||||||||||||||||||||||||||||||||||||||||||||||||||||||||||||||||||||||||||||||||||||||||||||||||||||||||||||||||||||||||||||||||||||||||||||||||||||||||||||||||||||||||||||||||||||||||||||||||||||||||||||||||||||||||||||||||||||||||||||||||||||||||||||||||||||||||||||||||||||||||||||||||||
| cf) number; DB name 1 Oncogene; http://nar.oxfordjournals.org/content/35/suppl_1/D721.long, 2 Tumor Suppressor gene; https://bioinfo.uth.edu/TSGene/, 3 Cancer Gene Census; http://www.nature.com/nrc/journal/v4/n3/abs/nrc1299.html, 4 CancerGenes; http://nar.oxfordjournals.org/content/35/suppl_1/D721.long, 5 Network of Cancer Gene; http://ncg.kcl.ac.uk/index.php, 1Therapeutic Vulnerabilities in Cancer; http://cbio.mskcc.org/cancergenomics/statius/ |
| KEGG_AMINO_SUGAR_AND_NUCLEOTIDE_SUGAR_METABOLISM | |
| OMIM | |
| Orphanet | |
| Disease | KEGG Disease: GNE |
| MedGen: GNE (Human Medical Genetics with Condition) | |
| ClinVar: GNE | |
| Phenotype | MGI: GNE (International Mouse Phenotyping Consortium) |
| PhenomicDB: GNE | |
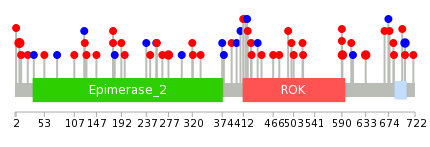
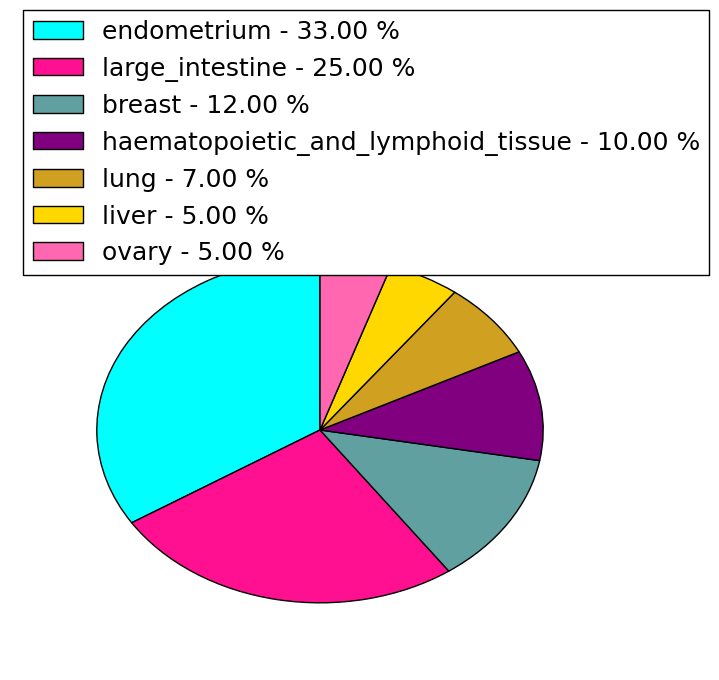
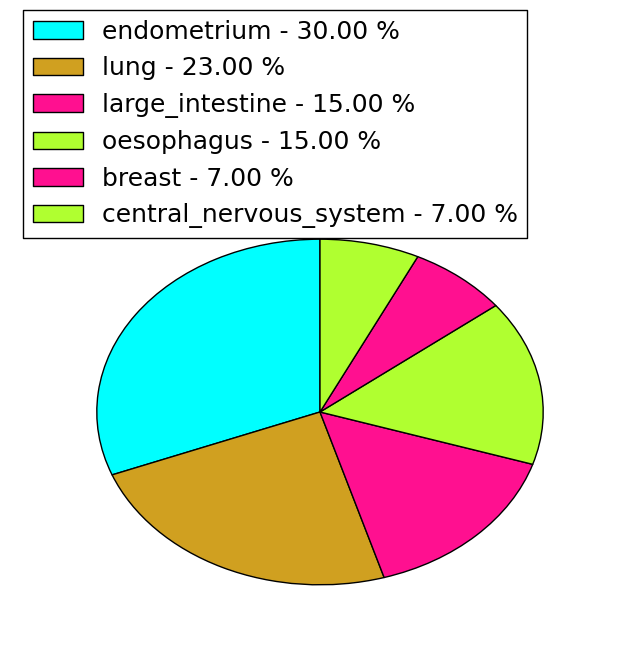
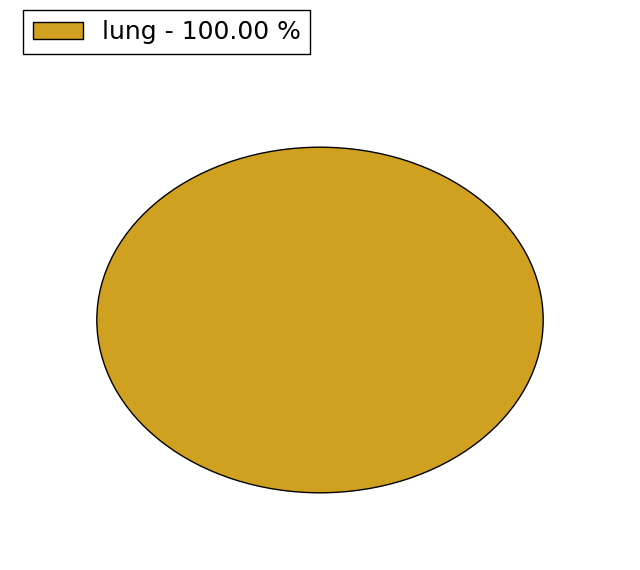
| Mutations for GNE |
| * Under tables are showing count per each tissue to give us broad intuition about tissue specific mutation patterns.You can go to the detailed page for each mutation database's web site. |
| There's no structural variation information in COSMIC data for this gene. |
| * From mRNA Sanger sequences, Chitars2.0 arranged chimeric transcripts. This table shows GNE related fusion information. |
| ID | Head Gene | Tail Gene | Accession | Gene_a | qStart_a | qEnd_a | Chromosome_a | tStart_a | tEnd_a | Gene_a | qStart_a | qEnd_a | Chromosome_a | tStart_a | tEnd_a |
| AU117634 | GNE | 5 | 407 | 9 | 36246411 | 36258445 | COL1A2 | 405 | 863 | 7 | 94058697 | 94059974 | |
| AW753960 | GNE | 1 | 45 | 9 | 36237296 | 36237340 | RPA3 | 41 | 405 | 7 | 7722774 | 7723136 | |
| BQ417504 | GNE | 9 | 326 | 9 | 36214438 | 36214755 | GNE | 324 | 466 | 9 | 36214960 | 36215102 | |
| Top |
| Mutation type/ Tissue ID | brca | cns | cerv | endome | haematopo | kidn | Lintest | liver | lung | ns | ovary | pancre | prost | skin | stoma | thyro | urina | |||
| Total # sample | 2 | 1 | ||||||||||||||||||
| GAIN (# sample) | 2 | 1 | ||||||||||||||||||
| LOSS (# sample) |
| cf) Tissue ID; Tissue type (1; Breast, 2; Central_nervous_system, 3; Cervix, 4; Endometrium, 5; Haematopoietic_and_lymphoid_tissue, 6; Kidney, 7; Large_intestine, 8; Liver, 9; Lung, 10; NS, 11; Ovary, 12; Pancreas, 13; Prostate, 14; Skin, 15; Stomach, 16; Thyroid, 17; Urinary_tract) |
| Top |
|
 |
| Top |
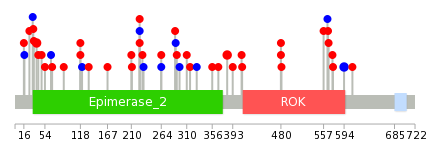
| Stat. for Non-Synonymous SNVs (# total SNVs=39) | (# total SNVs=13) |
 |  |
(# total SNVs=1) | (# total SNVs=0) |
 |
| Top |
| * When you move the cursor on each content, you can see more deailed mutation information on the Tooltip. Those are primary_site,primary_histology,mutation(aa),pubmedID. |
| GRCh37 position | Mutation(aa) | Unique sampleID count |
| chr9:36249330-36249330 | p.R8Q | 3 |
| chr9:36218216-36218216 | p.L633I | 2 |
| chr9:36217419-36217419 | p.P704P | 2 |
| chr9:36219880-36219880 | p.A591T | 2 |
| chr9:36234070-36234070 | p.R277C | 2 |
| chr9:36217532-36217532 | p.L667I | 1 |
| chr9:36233937-36233937 | p.R321H | 1 |
| chr9:36222900-36222900 | p.P503S | 1 |
| chr9:36246023-36246023 | p.? | 1 |
| chr9:36227280-36227280 | p.G416R | 1 |
| Top |
|
 |
| Point Mutation/ Tissue ID | 1 | 2 | 3 | 4 | 5 | 6 | 7 | 8 | 9 | 10 | 11 | 12 | 13 | 14 | 15 | 16 | 17 | 18 | 19 | 20 |
| # sample | 4 | 3 | 9 | 2 | 4 | 2 | 2 | 2 | 6 | 14 | ||||||||||
| # mutation | 6 | 3 | 9 | 2 | 5 | 2 | 2 | 2 | 6 | 15 | ||||||||||
| nonsynonymous SNV | 4 | 3 | 7 | 1 | 2 | 2 | 2 | 2 | 6 | 11 | ||||||||||
| synonymous SNV | 2 | 2 | 1 | 3 | 4 |
| cf) Tissue ID; Tissue type (1; BLCA[Bladder Urothelial Carcinoma], 2; BRCA[Breast invasive carcinoma], 3; CESC[Cervical squamous cell carcinoma and endocervical adenocarcinoma], 4; COAD[Colon adenocarcinoma], 5; GBM[Glioblastoma multiforme], 6; Glioma Low Grade, 7; HNSC[Head and Neck squamous cell carcinoma], 8; KICH[Kidney Chromophobe], 9; KIRC[Kidney renal clear cell carcinoma], 10; KIRP[Kidney renal papillary cell carcinoma], 11; LAML[Acute Myeloid Leukemia], 12; LUAD[Lung adenocarcinoma], 13; LUSC[Lung squamous cell carcinoma], 14; OV[Ovarian serous cystadenocarcinoma ], 15; PAAD[Pancreatic adenocarcinoma], 16; PRAD[Prostate adenocarcinoma], 17; SKCM[Skin Cutaneous Melanoma], 18:STAD[Stomach adenocarcinoma], 19:THCA[Thyroid carcinoma], 20:UCEC[Uterine Corpus Endometrial Carcinoma]) |
| Top |
| * We represented just top 10 SNVs. When you move the cursor on each content, you can see more deailed mutation information on the Tooltip. Those are primary_site, primary_histology, mutation(aa), pubmedID. |
| Genomic Position | Mutation(aa) | Unique sampleID count |
| chr9:36217419 | p.R225L,GNE | 2 |
| chr9:36249330 | p.R39Q,GNE | 2 |
| chr9:36222930 | p.Q383K,GNE | 2 |
| chr9:36229084 | p.P594P,GNE | 2 |
| chr9:36219880 | p.C410G,GNE | 1 |
| chr9:36246416 | p.R42W,GNE | 1 |
| chr9:36227267 | p.N409D,GNE | 1 |
| chr9:36234070 | p.R211H,GNE | 1 |
| chr9:36219882 | p.P393S,GNE | 1 |
| chr9:36249251 | p.T210I,GNE | 1 |
| * Copy number data were extracted from TCGA using R package TCGA-Assembler. The URLs of all public data files on TCGA DCC data server were gathered on Jan-05-2015. Function ProcessCNAData in TCGA-Assembler package was used to obtain gene-level copy number value which is calculated as the average copy number of the genomic region of a gene. |
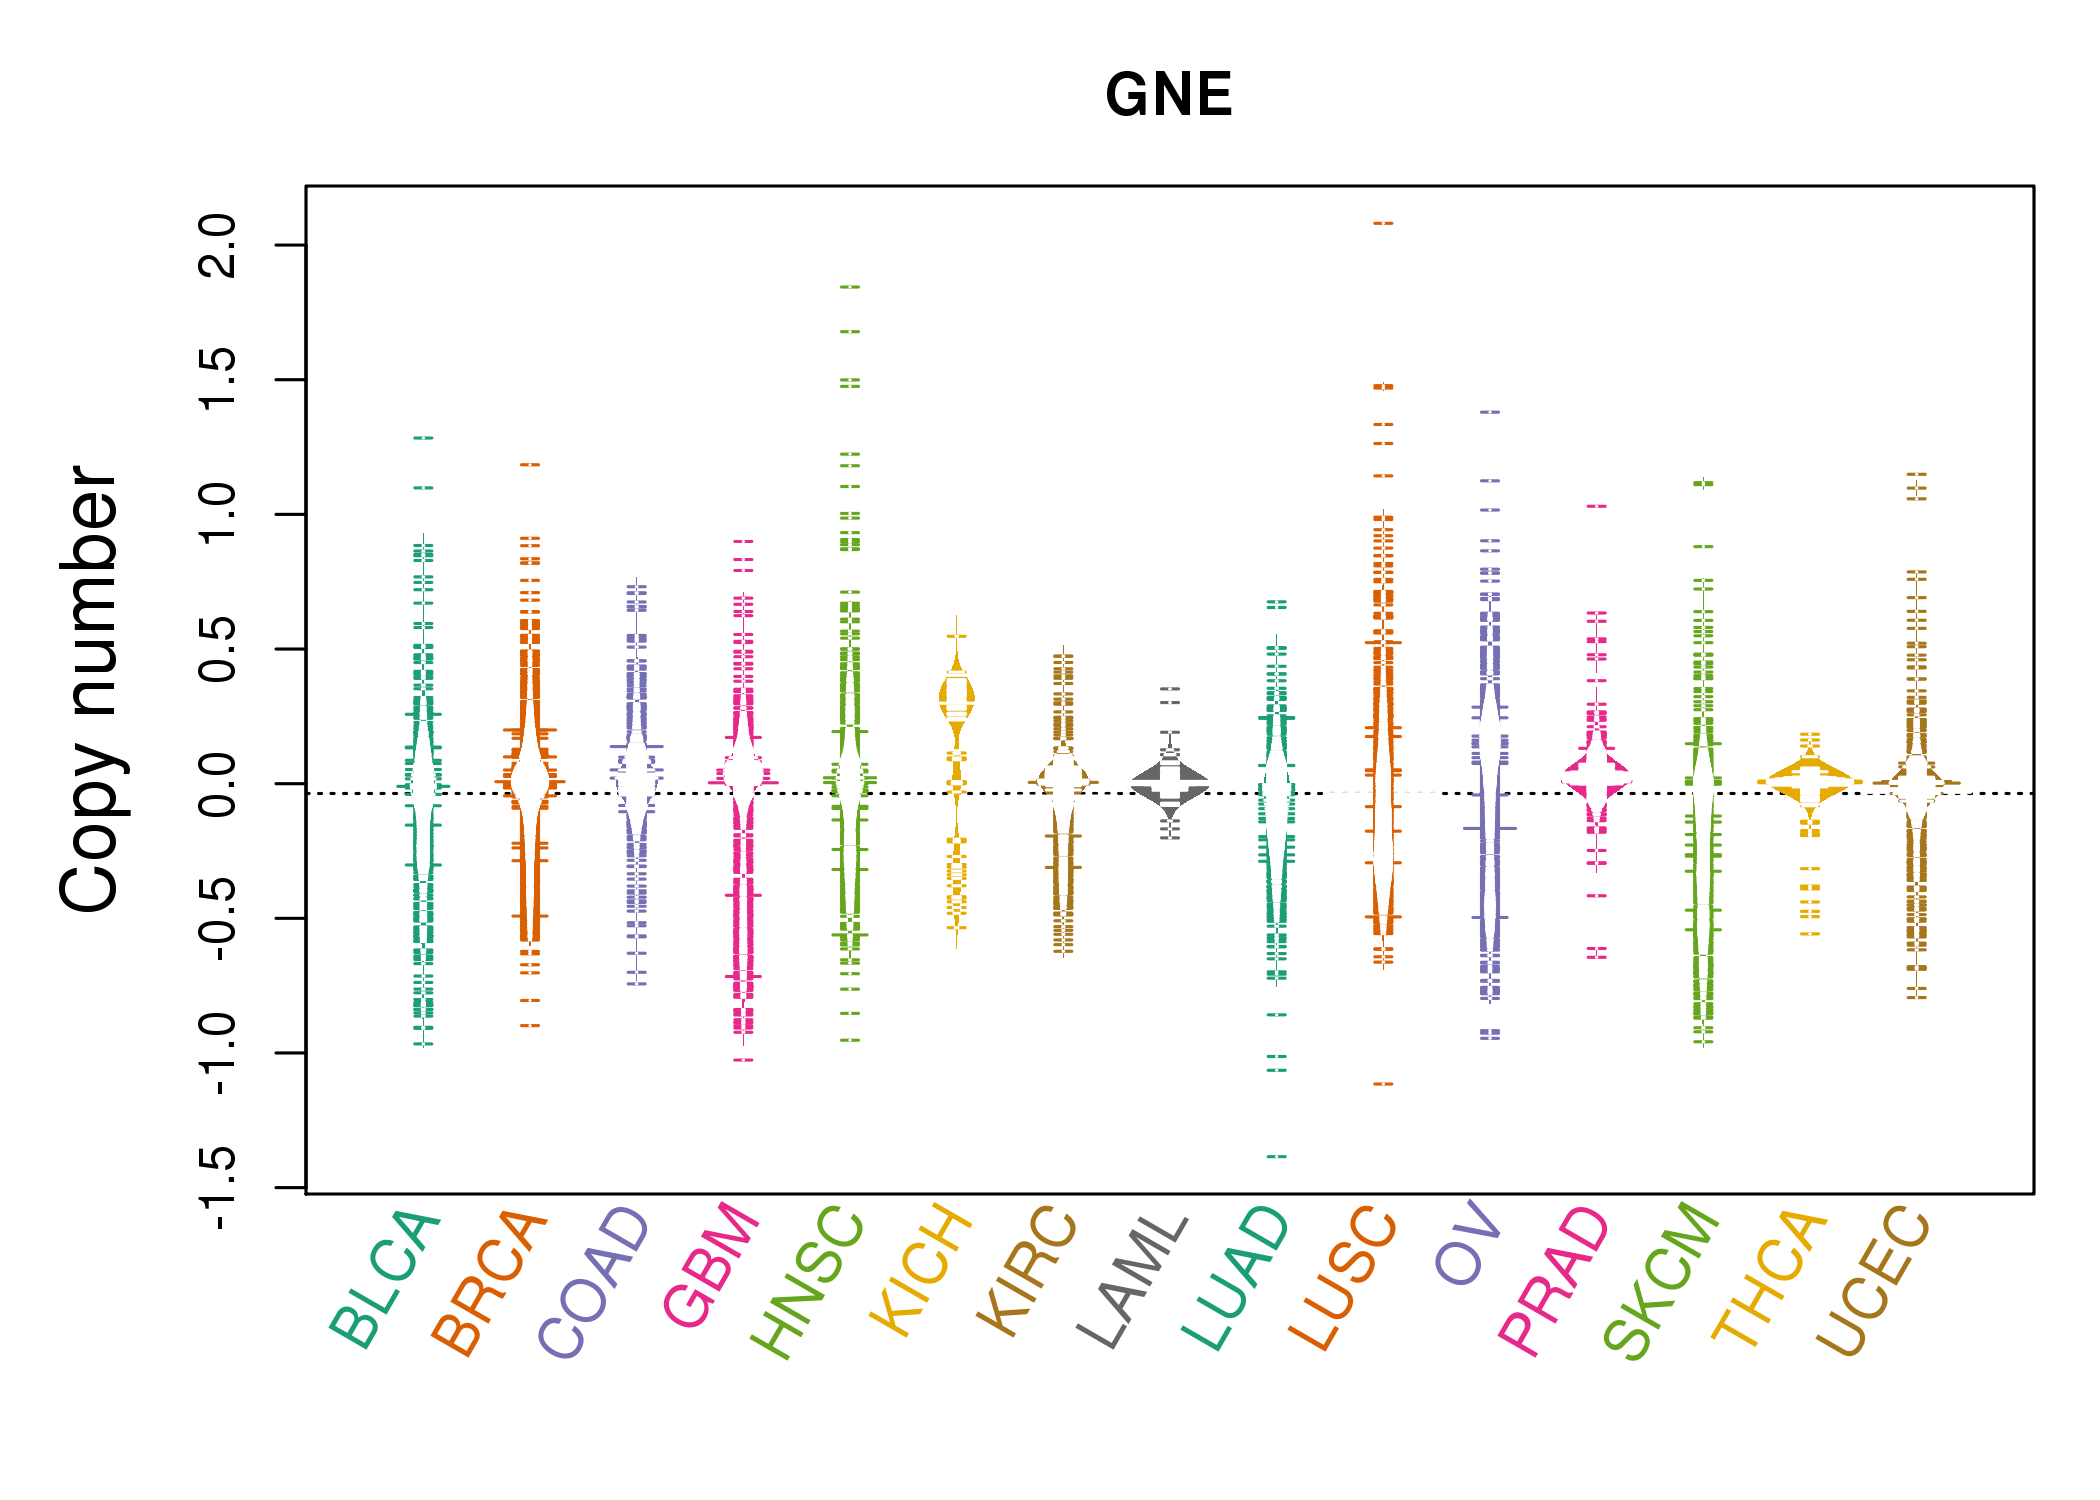 |
| cf) Tissue ID[Tissue type]: BLCA[Bladder Urothelial Carcinoma], BRCA[Breast invasive carcinoma], CESC[Cervical squamous cell carcinoma and endocervical adenocarcinoma], COAD[Colon adenocarcinoma], GBM[Glioblastoma multiforme], Glioma Low Grade, HNSC[Head and Neck squamous cell carcinoma], KICH[Kidney Chromophobe], KIRC[Kidney renal clear cell carcinoma], KIRP[Kidney renal papillary cell carcinoma], LAML[Acute Myeloid Leukemia], LUAD[Lung adenocarcinoma], LUSC[Lung squamous cell carcinoma], OV[Ovarian serous cystadenocarcinoma ], PAAD[Pancreatic adenocarcinoma], PRAD[Prostate adenocarcinoma], SKCM[Skin Cutaneous Melanoma], STAD[Stomach adenocarcinoma], THCA[Thyroid carcinoma], UCEC[Uterine Corpus Endometrial Carcinoma] |
| Top |
| Gene Expression for GNE |
| * CCLE gene expression data were extracted from CCLE_Expression_Entrez_2012-10-18.res: Gene-centric RMA-normalized mRNA expression data. |
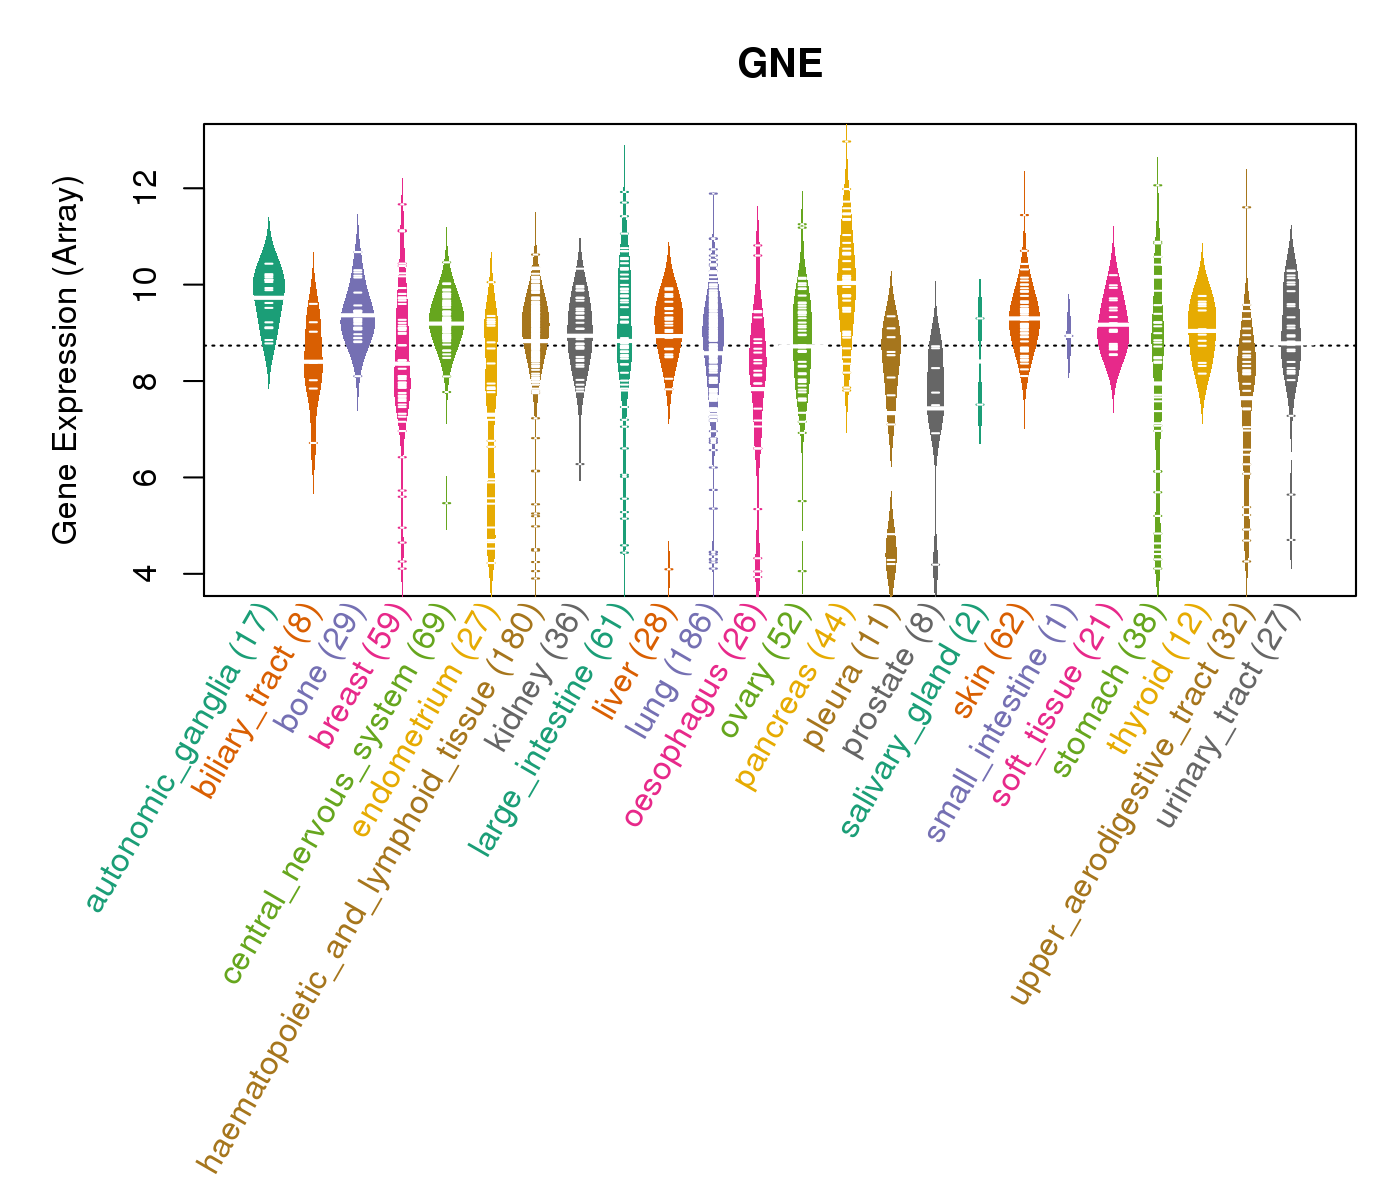 |
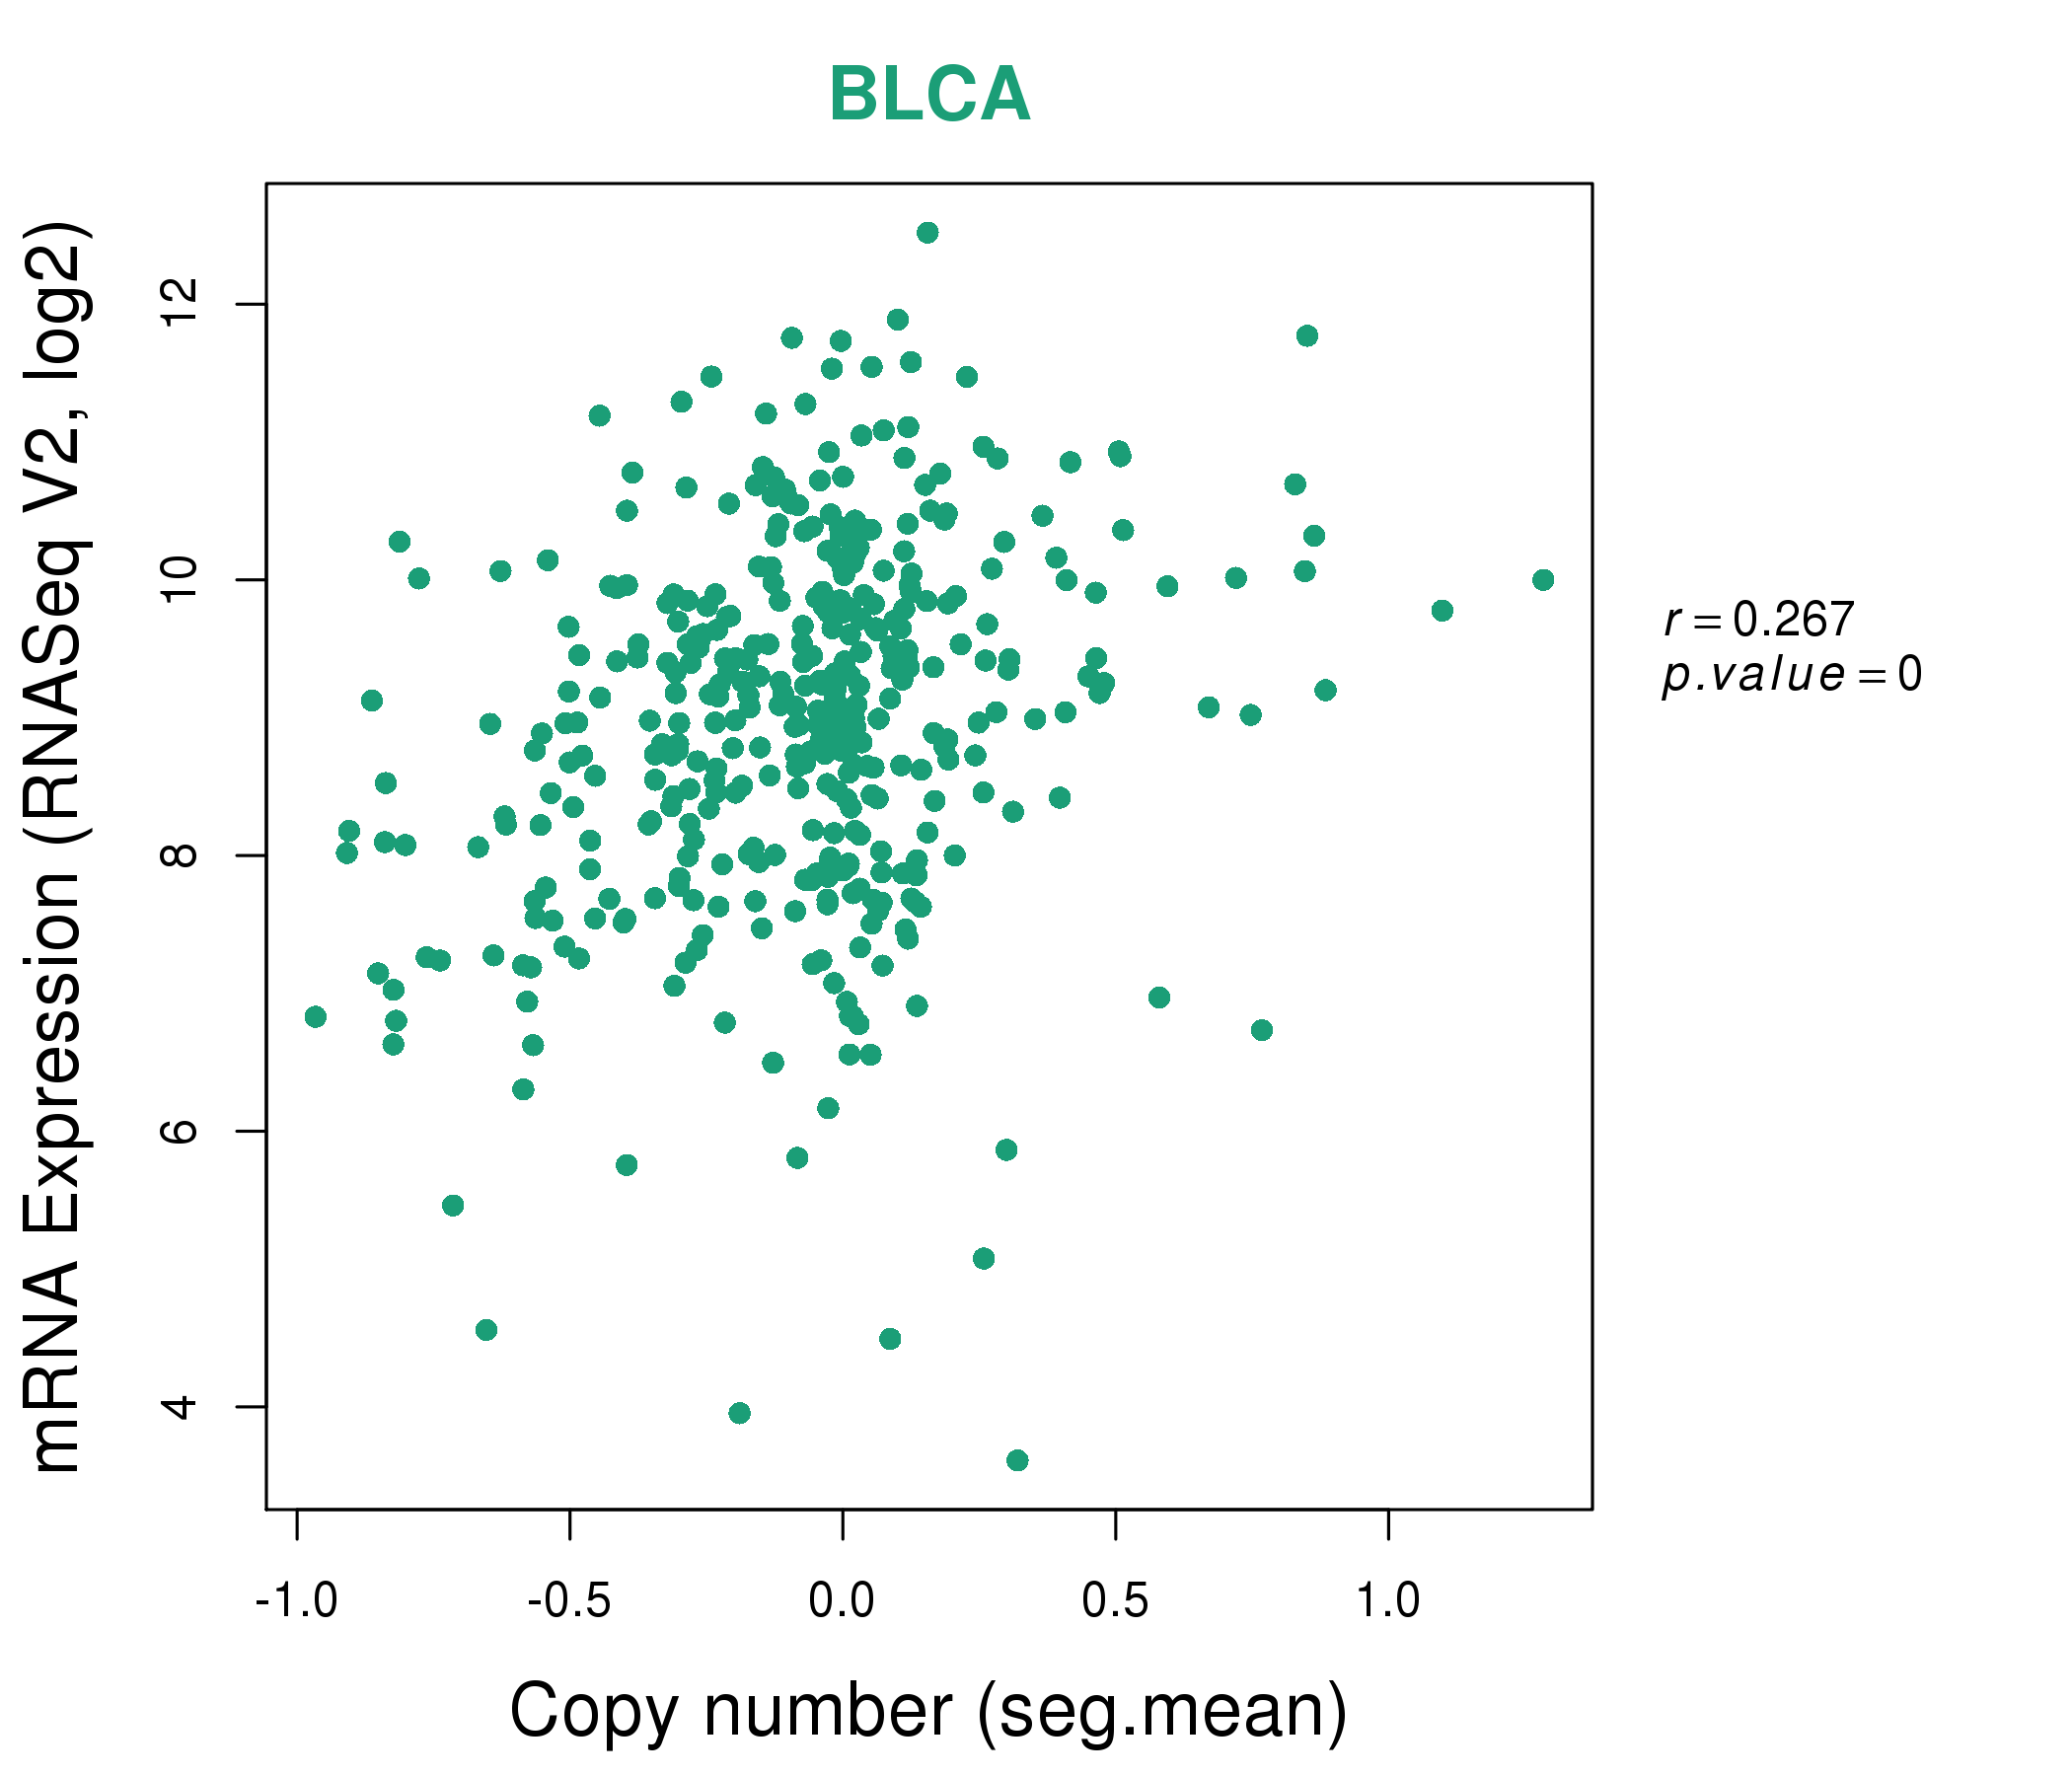
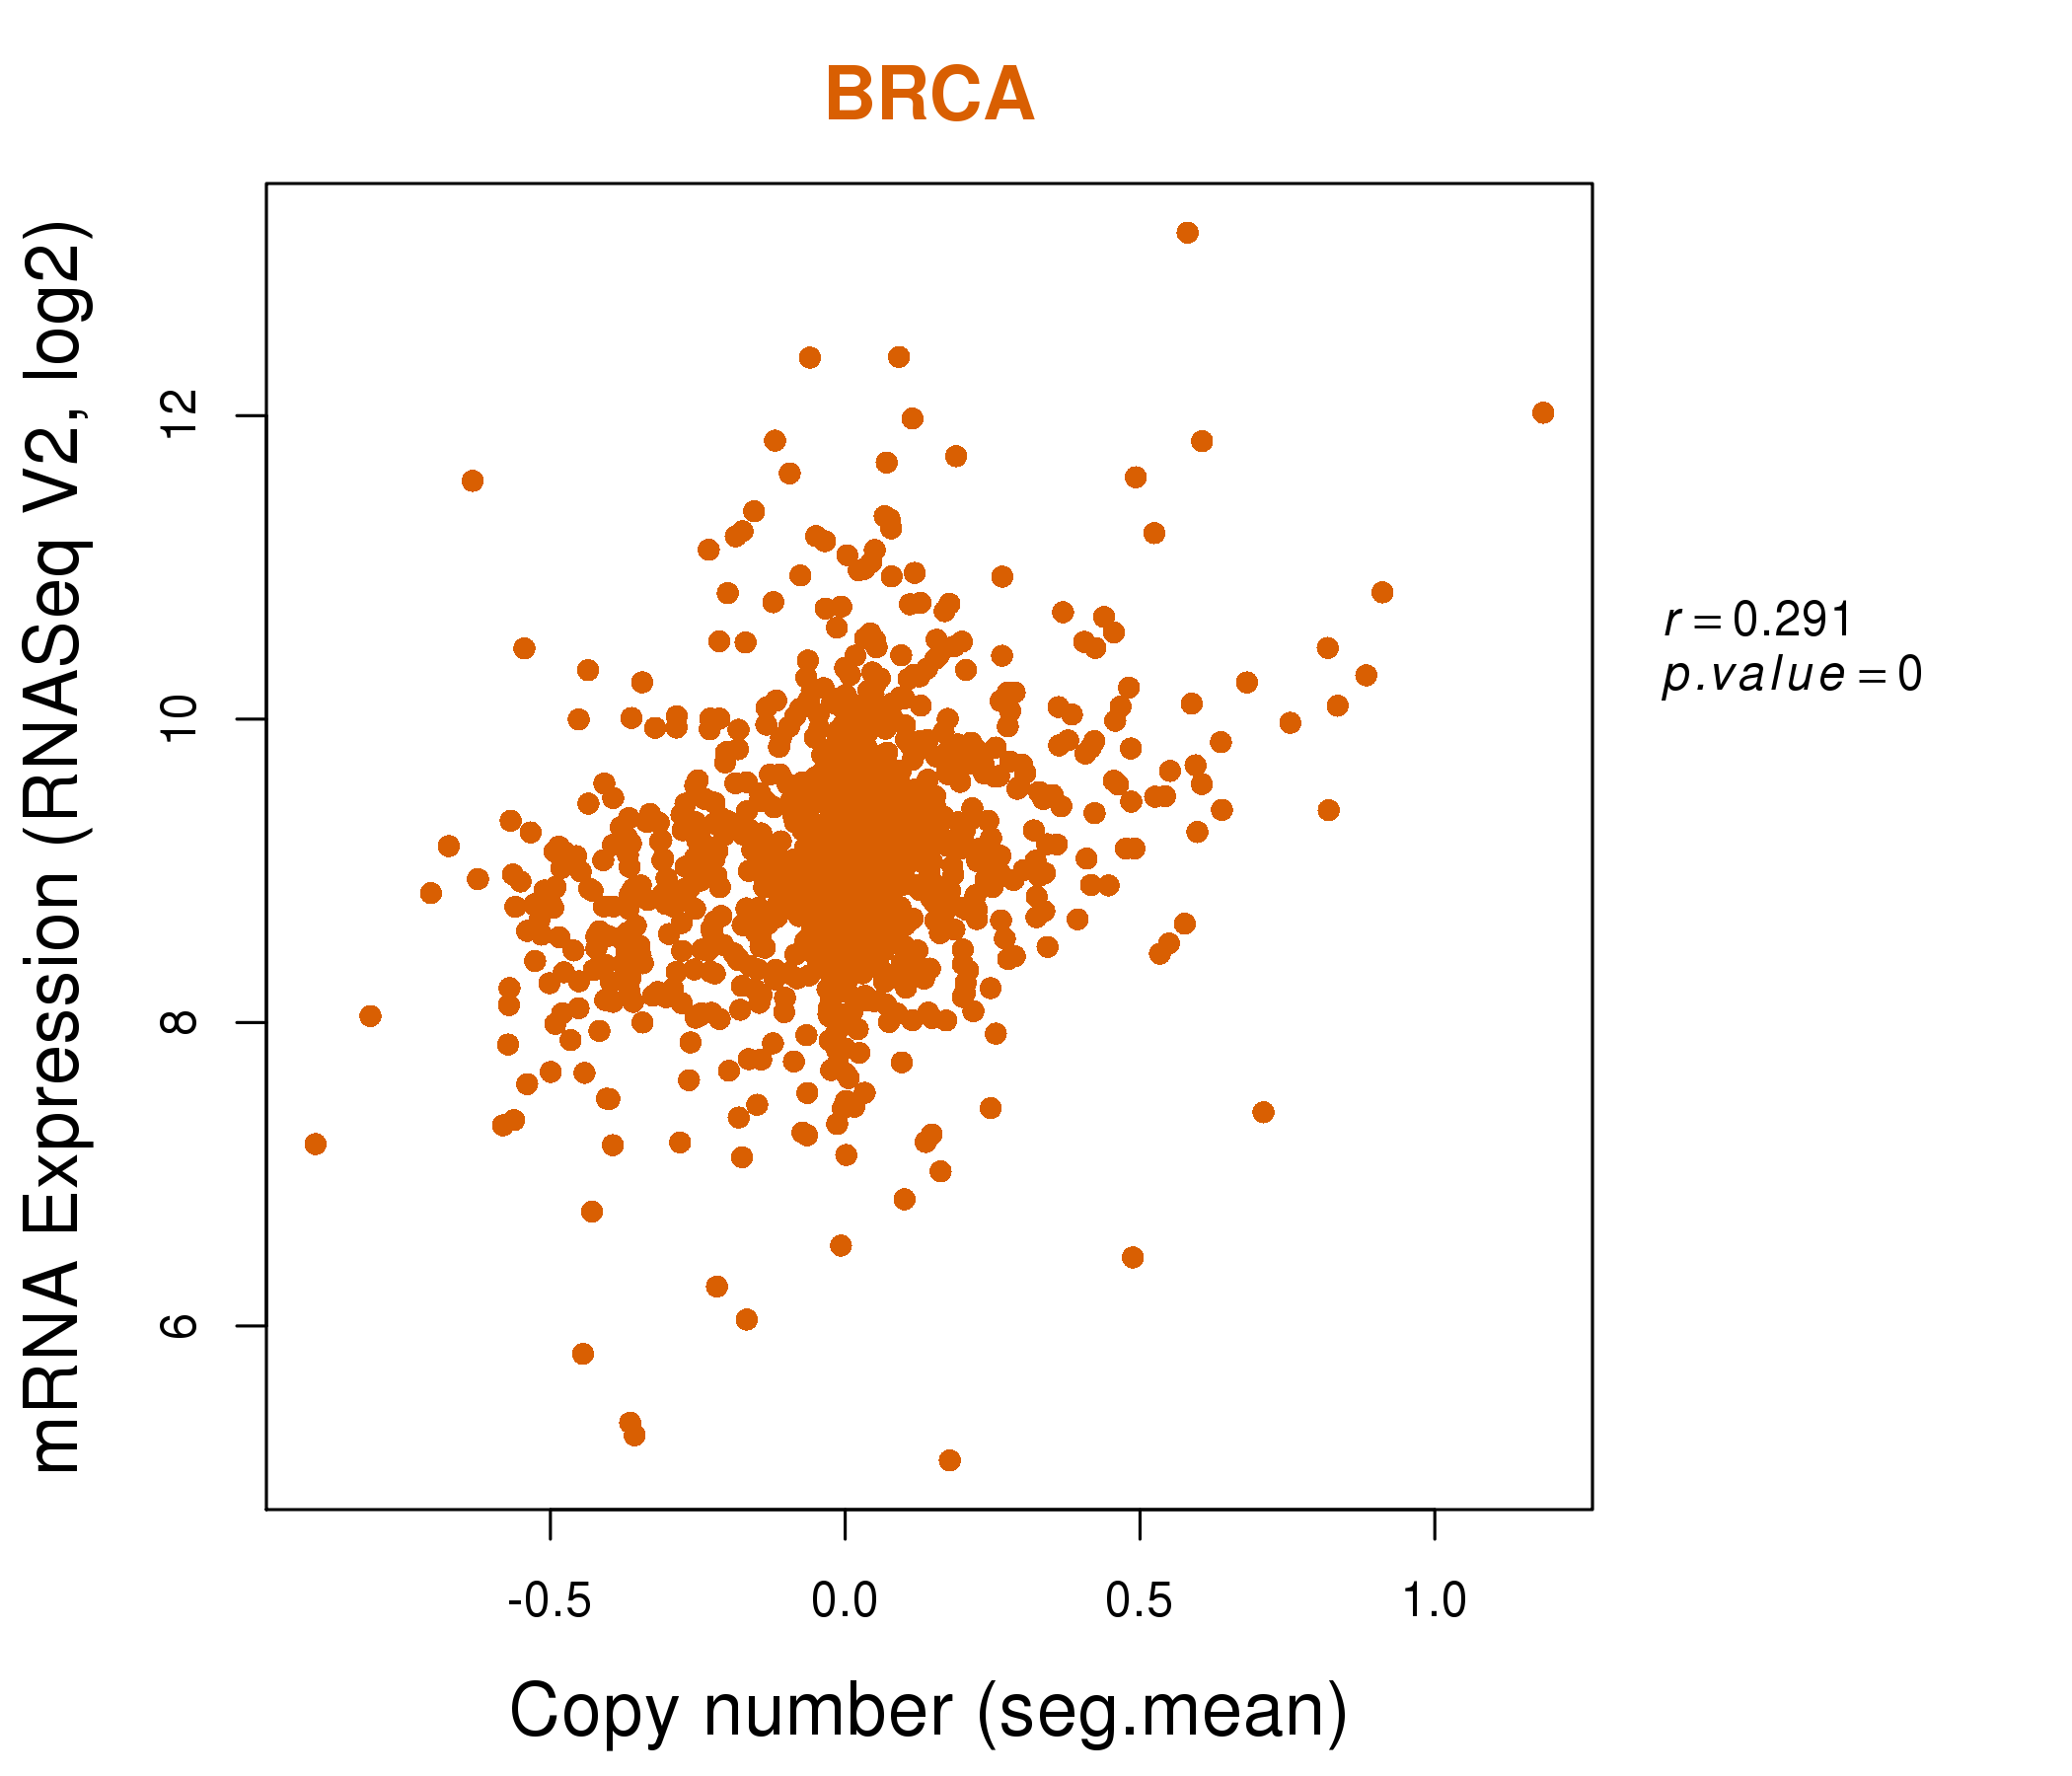
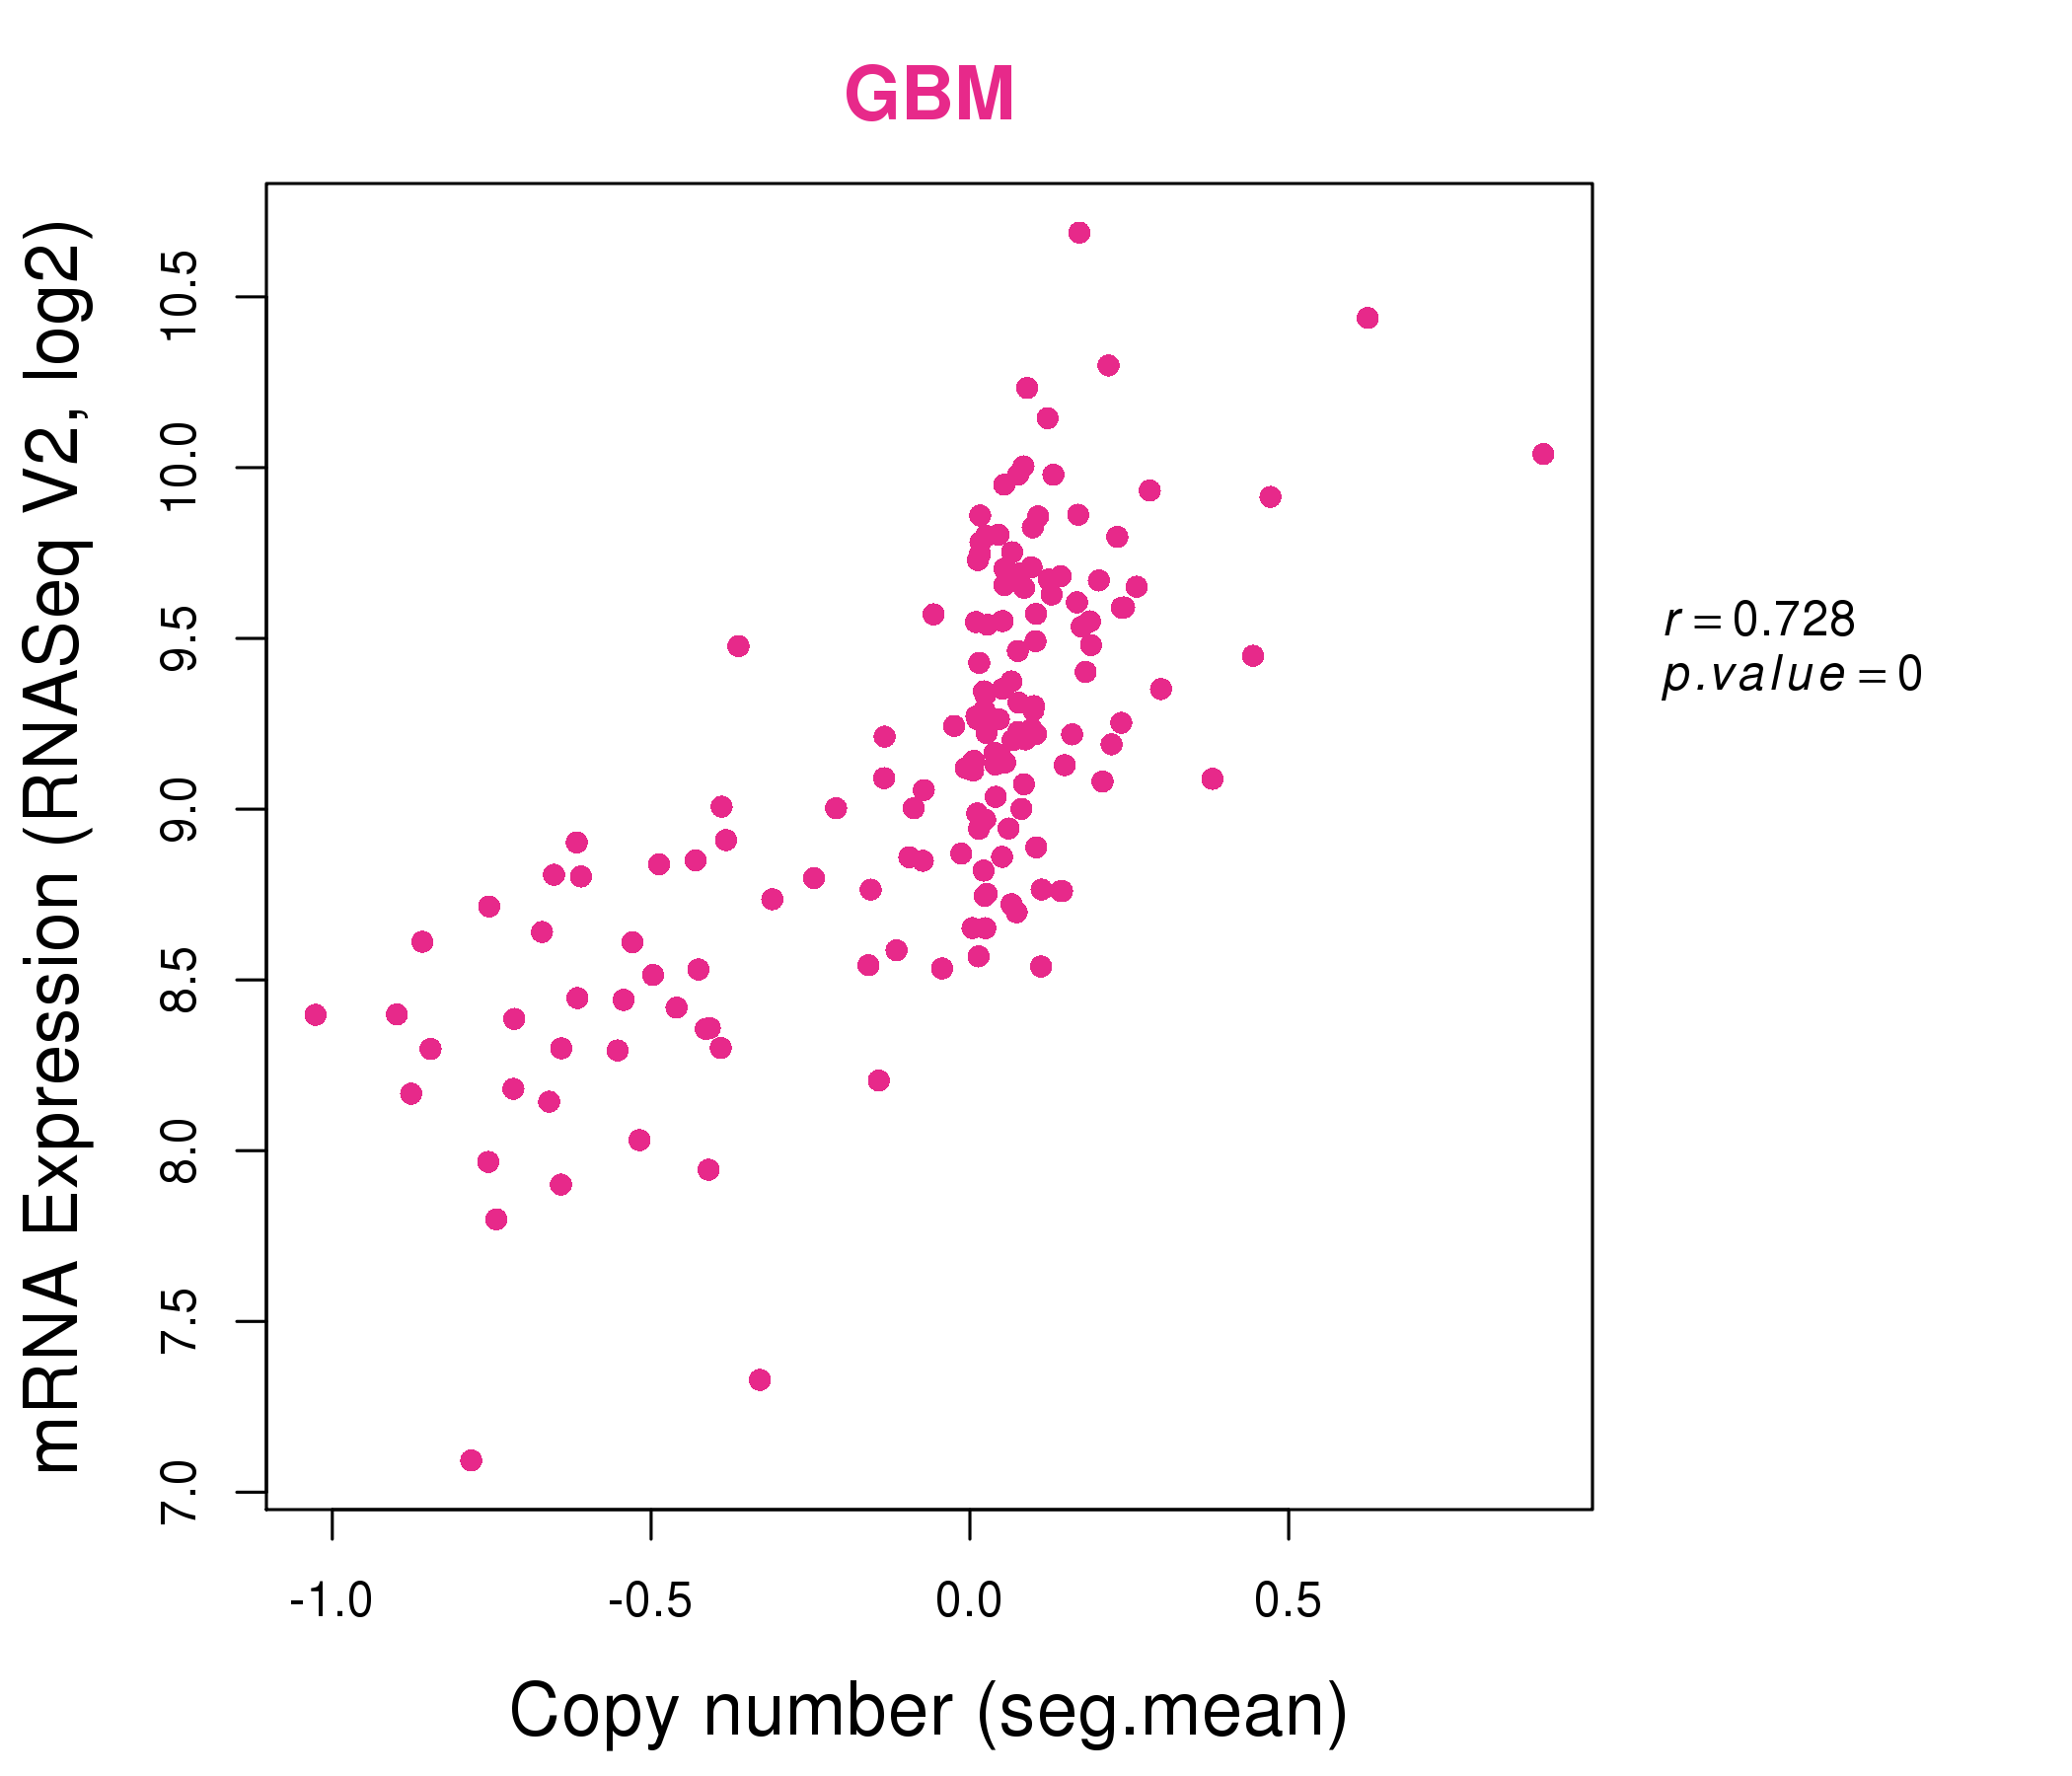
| * Normalized gene expression data of RNASeqV2 was extracted from TCGA using R package TCGA-Assembler. The URLs of all public data files on TCGA DCC data server were gathered at Jan-05-2015. Only eight cancer types have enough normal control samples for differential expression analysis. (t test, adjusted p<0.05 (using Benjamini-Hochberg FDR)) |
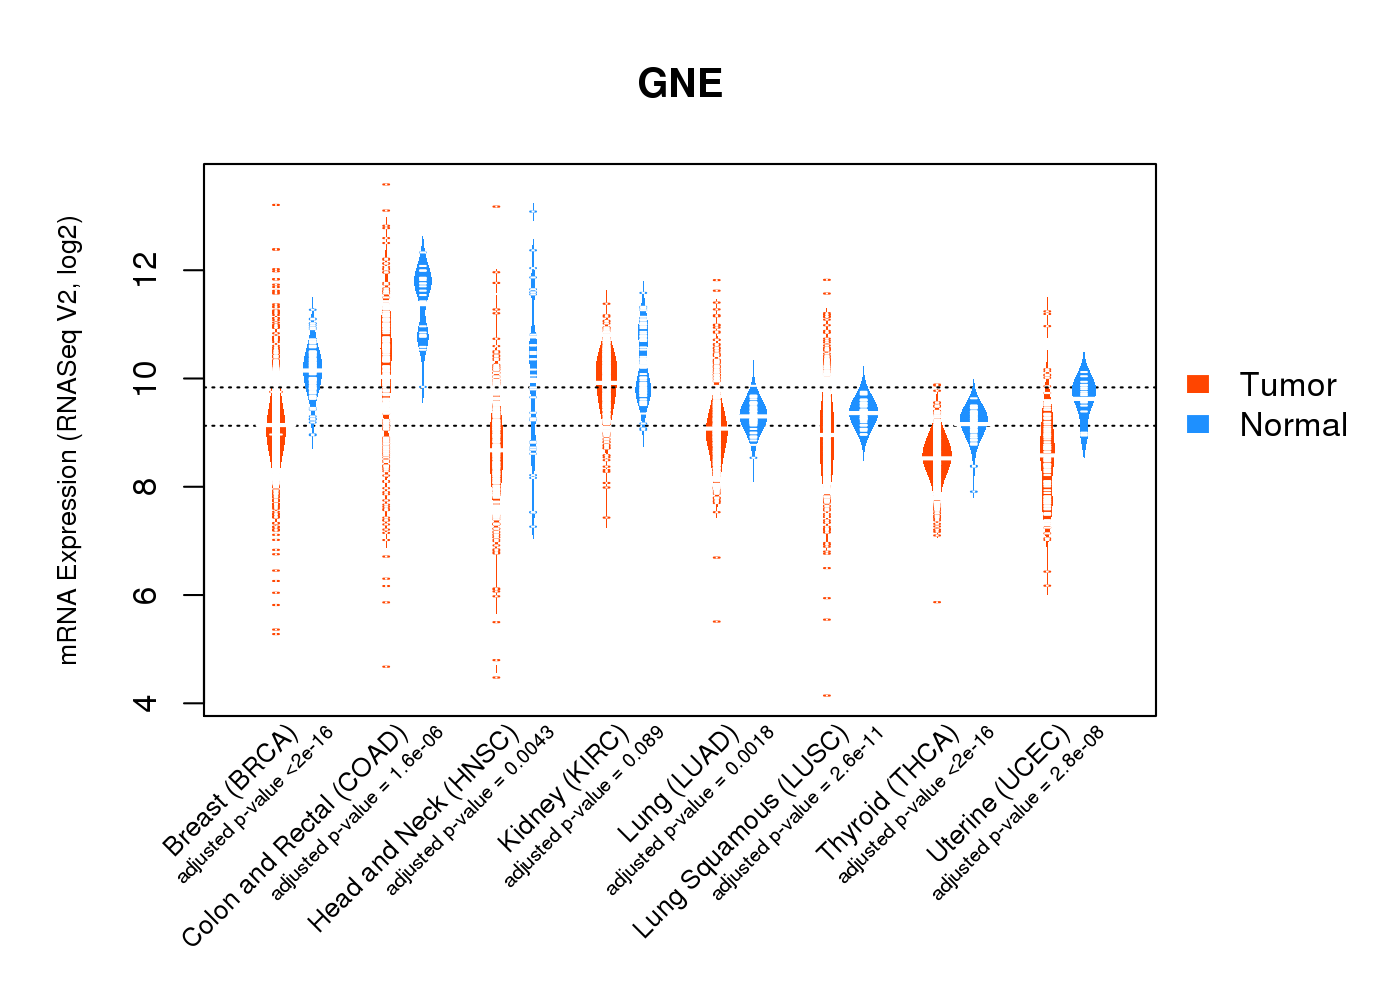 |
| Top |
| * This plots show the correlation between CNV and gene expression. |
: Open all plots for all cancer types
 |
|
 |
|
| Top |
| Gene-Gene Network Information |
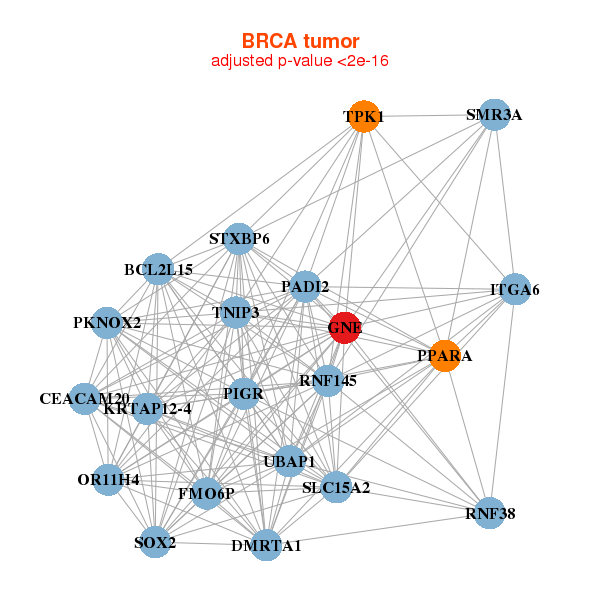
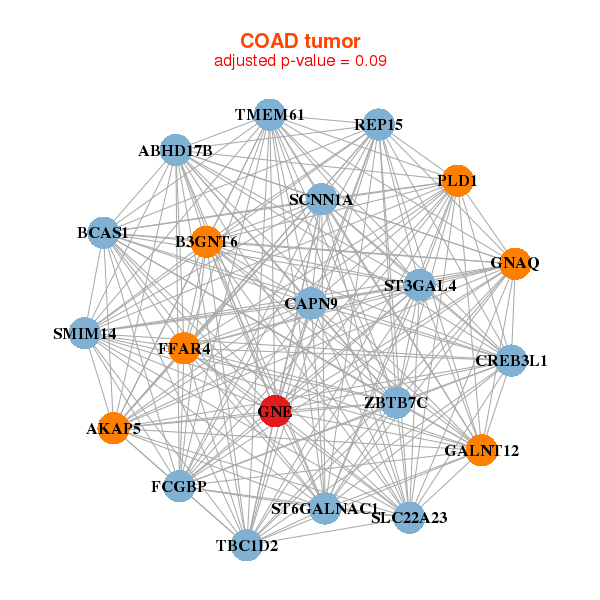
| * Co-Expression network figures were drawn using R package igraph. Only the top 20 genes with the highest correlations were shown. Red circle: input gene, orange circle: cell metabolism gene, sky circle: other gene |
: Open all plots for all cancer types
 |
|
| BCL2L15,CEACAM20,DMRTA1,FMO6P,GNE,ITGA6,KRTAP12-4, OR11H4,PADI2,PIGR,PKNOX2,PPARA,RNF145,RNF38, SLC15A2,SMR3A,SOX2,STXBP6,TNIP3,TPK1,UBAP1 | ANAPC1,ANKRD17,ARID4A,ATF7,BTBD8,CLCN3,FAM73A, GNE,HEATR5B,WNK1,KIAA1107,KLHL8,LRRC58,NCAPD3, PDS5A,PHLPP1,RFC1,SETD2,SHPRH,SPTLC2,TXNDC16 |
 |
|
| AKAP5,B3GNT6,BCAS1,SMIM14,CAPN9,CREB3L1,ABHD17B, FCGBP,GALNT12,GNAQ,GNE,FFAR4,PLD1,REP15, SCNN1A,SLC22A23,ST3GAL4,ST6GALNAC1,TBC1D2,TMEM61,ZBTB7C | B3GNT7,CKAP4,CREB3L1,DCDC2,DDX31,NXPE1,FOXA2, GABRB2,GALNT5,GNE,HOXB13,MFSD6L,NANS,SLC12A8, SLC17A9,SLC35A2,SLC39A8,SPDEF,ST6GALNAC4,TTC13,TTC39A |
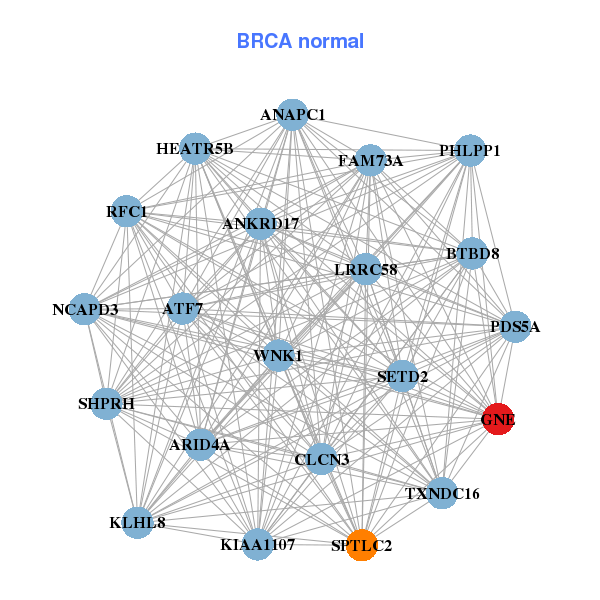
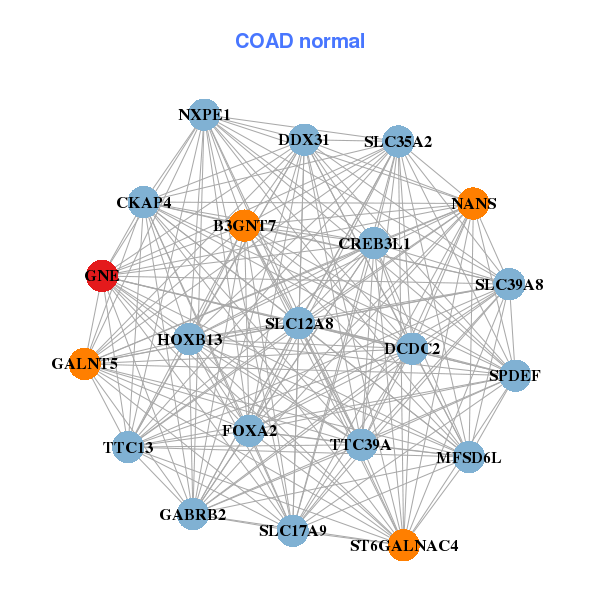
| * Co-Expression network figures were drawn using R package igraph. Only the top 20 genes with the highest correlations were shown. Red circle: input gene, orange circle: cell metabolism gene, sky circle: other gene |
: Open all plots for all cancer types
| Top |
: Open all interacting genes' information including KEGG pathway for all interacting genes from DAVID
| Top |
| Pharmacological Information for GNE |
| There's no related Drug. |
| Top |
| Cross referenced IDs for GNE |
| * We obtained these cross-references from Uniprot database. It covers 150 different DBs, 18 categories. http://www.uniprot.org/help/cross_references_section |
: Open all cross reference information
|
Copyright © 2016-Present - The Univsersity of Texas Health Science Center at Houston @ |