|
||||||||||||||||||||||||||||||||||||||||||||||||||||||||||||||||||||||||||||||||||||||||||||||||||||||||||||||||||||||||||||||||||||||||||||||||||||||||||||||||||||||||||||||||||||||||||||||||||||||||||||||||||||||||||||||||||||||||||||||||||||||||||||||||||||||||||||||||||||||||||||||||||||||||||||||||||||||||||
| |
| Phenotypic Information (metabolism pathway, cancer, disease, phenome) |
| |
| |
| Gene-Gene Network Information: Co-Expression Network, Interacting Genes & KEGG |
| |
|


| Gene Summary for MED16 |
| Basic gene info. | Gene symbol | MED16 |
| Gene name | mediator complex subunit 16 | |
| Synonyms | DRIP92|THRAP5|TRAP95 | |
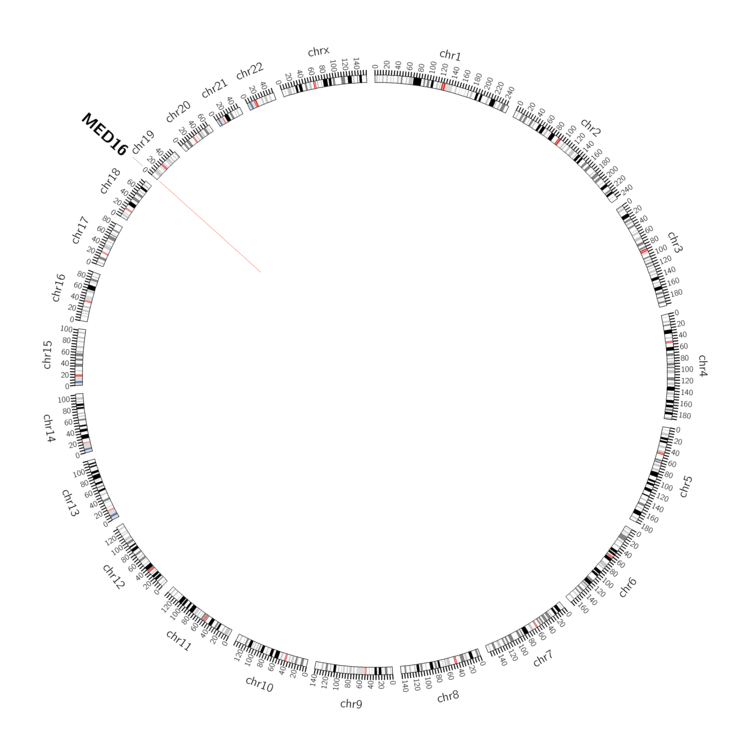
| Cytomap | UCSC genome browser: 19p13.3 | |
| Genomic location | chr19 :867961-893218 | |
| Type of gene | protein-coding | |
| RefGenes | NM_005481.2, | |
| Ensembl id | ENSG00000175221 | |
| Description | mediator of RNA polymerase II transcription subunit 16thyroid hormone receptor-associated protein 5thyroid hormone receptor-associated protein complex 95 kDa componentthyroid hormone receptor-associated protein, 95-kD subunitvitamin D3 receptor-intera | |
| Modification date | 20141207 | |
| dbXrefs | MIM : 604062 | |
| HGNC : HGNC | ||
| Ensembl : ENSG00000175221 | ||
| HPRD : 06816 | ||
| Vega : OTTHUMG00000181841 | ||
| Protein | UniProt: go to UniProt's Cross Reference DB Table | |
| Expression | CleanEX: HS_MED16 | |
| BioGPS: 10025 | ||
| Gene Expression Atlas: ENSG00000175221 | ||
| The Human Protein Atlas: ENSG00000175221 | ||
| Pathway | NCI Pathway Interaction Database: MED16 | |
| KEGG: MED16 | ||
| REACTOME: MED16 | ||
| ConsensusPathDB | ||
| Pathway Commons: MED16 | ||
| Metabolism | MetaCyc: MED16 | |
| HUMANCyc: MED16 | ||
| Regulation | Ensembl's Regulation: ENSG00000175221 | |
| miRBase: chr19 :867,961-893,218 | ||
| TargetScan: NM_005481 | ||
| cisRED: ENSG00000175221 | ||
| Context | iHOP: MED16 | |
| cancer metabolism search in PubMed: MED16 | ||
| UCL Cancer Institute: MED16 | ||
| Assigned class in ccmGDB | C | |
| Top |
| Phenotypic Information for MED16(metabolism pathway, cancer, disease, phenome) |
| Cancer | CGAP: MED16 |
| Familial Cancer Database: MED16 | |
| * This gene is included in those cancer gene databases. |
|
|
|
|
|
| . | ||||||||||||||||||||||||||||||||||||||||||||||||||||||||||||||||||||||||||||||||||||||||||||||||||||||||||||||||||||||||||||||||||||||||||||||||||||||||||||||||||||||||||||||||||||||||||||||||||||||||||||||||||||||||||||||||||||||||||||||||||||||||||||||||||||||||||||||||||||||||||||||||||||||||||||||||||||
Oncogene 1 | Significant driver gene in | |||||||||||||||||||||||||||||||||||||||||||||||||||||||||||||||||||||||||||||||||||||||||||||||||||||||||||||||||||||||||||||||||||||||||||||||||||||||||||||||||||||||||||||||||||||||||||||||||||||||||||||||||||||||||||||||||||||||||||||||||||||||||||||||||||||||||||||||||||||||||||||||||||||||||||||||||||||||||
| cf) number; DB name 1 Oncogene; http://nar.oxfordjournals.org/content/35/suppl_1/D721.long, 2 Tumor Suppressor gene; https://bioinfo.uth.edu/TSGene/, 3 Cancer Gene Census; http://www.nature.com/nrc/journal/v4/n3/abs/nrc1299.html, 4 CancerGenes; http://nar.oxfordjournals.org/content/35/suppl_1/D721.long, 5 Network of Cancer Gene; http://ncg.kcl.ac.uk/index.php, 1Therapeutic Vulnerabilities in Cancer; http://cbio.mskcc.org/cancergenomics/statius/ |
| REACTOME_METABOLISM_OF_LIPIDS_AND_LIPOPROTEINS | |
| OMIM | |
| Orphanet | |
| Disease | KEGG Disease: MED16 |
| MedGen: MED16 (Human Medical Genetics with Condition) | |
| ClinVar: MED16 | |
| Phenotype | MGI: MED16 (International Mouse Phenotyping Consortium) |
| PhenomicDB: MED16 | |
| Mutations for MED16 |
| * Under tables are showing count per each tissue to give us broad intuition about tissue specific mutation patterns.You can go to the detailed page for each mutation database's web site. |
| - Statistics for Tissue and Mutation type | Top |
 |
| - For Inter-chromosomal Variations |
| There's no inter-chromosomal structural variation. |
| - For Intra-chromosomal Variations |
| * Intra-chromosomal variantions includes 'intrachromosomal amplicon to amplicon', 'intrachromosomal amplicon to non-amplified dna', 'intrachromosomal deletion', 'intrachromosomal fold-back inversion', 'intrachromosomal inversion', 'intrachromosomal tandem duplication', 'Intrachromosomal unknown type', 'intrachromosomal with inverted orientation', 'intrachromosomal with non-inverted orientation'. |
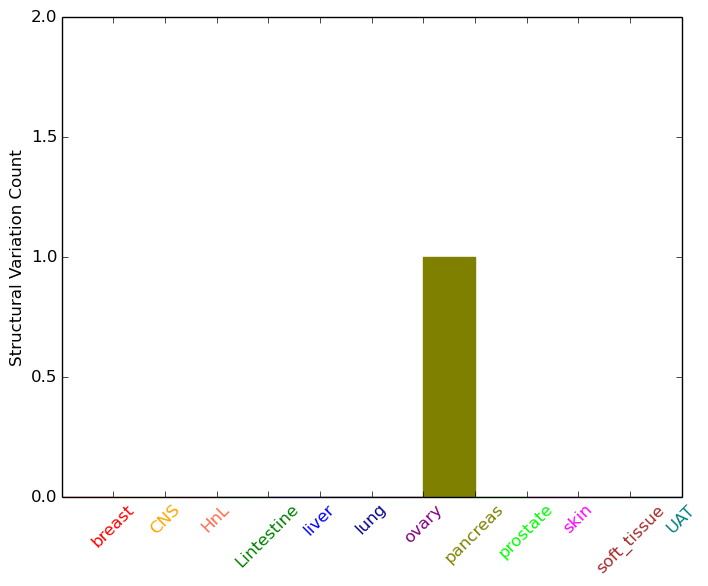 |
| Sample | Symbol_a | Chr_a | Start_a | End_a | Symbol_b | Chr_b | Start_b | End_b |
| pancreas | MED16 | chr19 | 887889 | 887909 | MED16 | chr19 | 892119 | 892139 |
| cf) Tissue number; Tissue name (1;Breast, 2;Central_nervous_system, 3;Haematopoietic_and_lymphoid_tissue, 4;Large_intestine, 5;Liver, 6;Lung, 7;Ovary, 8;Pancreas, 9;Prostate, 10;Skin, 11;Soft_tissue, 12;Upper_aerodigestive_tract) |
| * From mRNA Sanger sequences, Chitars2.0 arranged chimeric transcripts. This table shows MED16 related fusion information. |
| ID | Head Gene | Tail Gene | Accession | Gene_a | qStart_a | qEnd_a | Chromosome_a | tStart_a | tEnd_a | Gene_a | qStart_a | qEnd_a | Chromosome_a | tStart_a | tEnd_a |
| BM919198 | MED16 | 1 | 60 | 19 | 879940 | 879999 | MED16 | 54 | 402 | 19 | 884903 | 886012 | |
| BM825118 | CFD | 1 | 96 | 19 | 861861 | 861956 | MED16 | 95 | 627 | 19 | 871050 | 873584 | |
| BF766064 | RBFOX2 | 1 | 61 | 22 | 36137280 | 36137340 | MED16 | 58 | 235 | 19 | 876403 | 876580 | |
| Top |
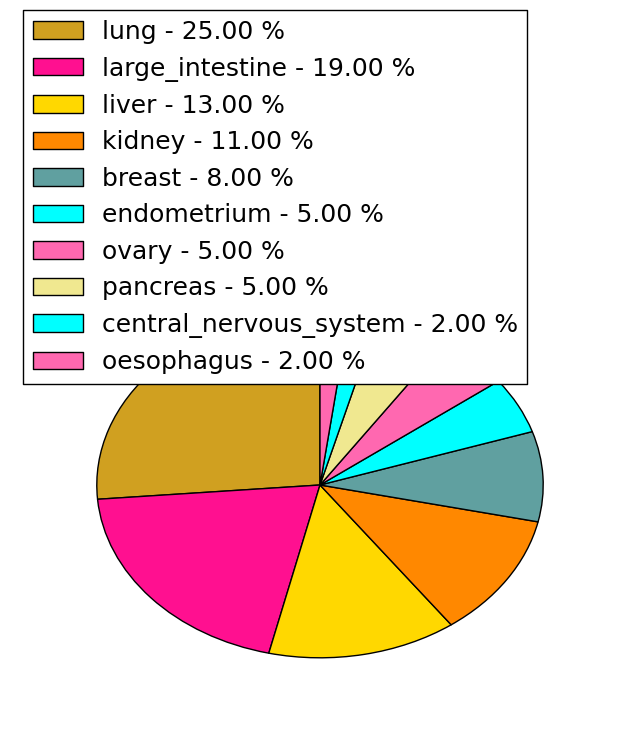
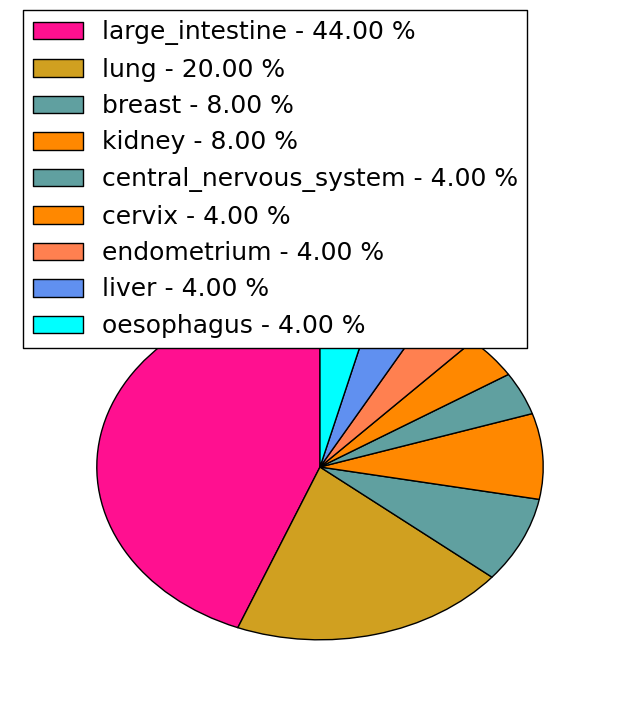
| Mutation type/ Tissue ID | brca | cns | cerv | endome | haematopo | kidn | Lintest | liver | lung | ns | ovary | pancre | prost | skin | stoma | thyro | urina | |||
| Total # sample | 1 | |||||||||||||||||||
| GAIN (# sample) | 1 | |||||||||||||||||||
| LOSS (# sample) |
| cf) Tissue ID; Tissue type (1; Breast, 2; Central_nervous_system, 3; Cervix, 4; Endometrium, 5; Haematopoietic_and_lymphoid_tissue, 6; Kidney, 7; Large_intestine, 8; Liver, 9; Lung, 10; NS, 11; Ovary, 12; Pancreas, 13; Prostate, 14; Skin, 15; Stomach, 16; Thyroid, 17; Urinary_tract) |
| Top |
|
 |
| Top |
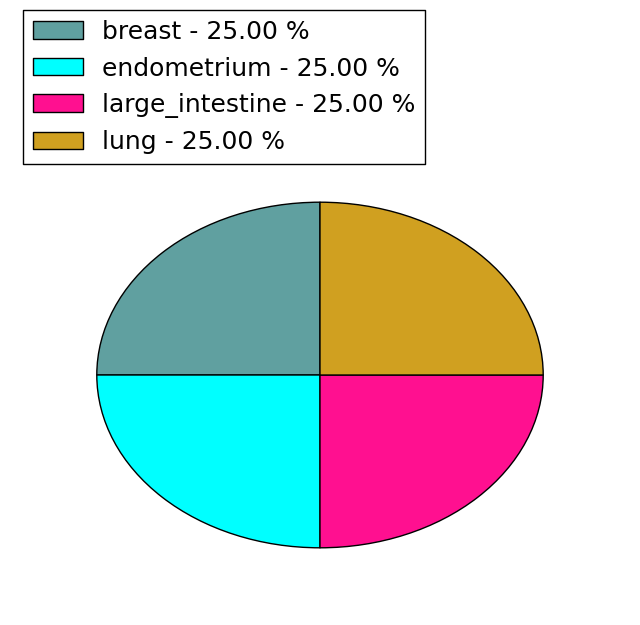
| Stat. for Non-Synonymous SNVs (# total SNVs=36) | (# total SNVs=25) |
 |  |
(# total SNVs=4) | (# total SNVs=0) |
 |
| Top |
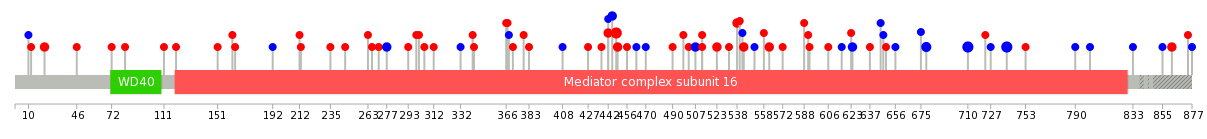
| * When you move the cursor on each content, you can see more deailed mutation information on the Tooltip. Those are primary_site,primary_histology,mutation(aa),pubmedID. |
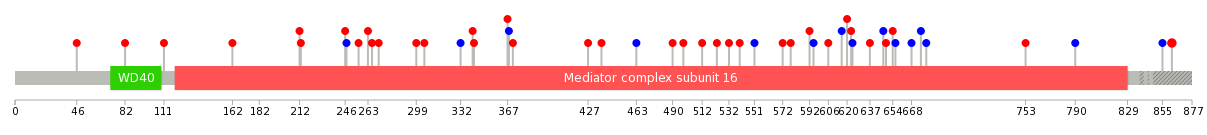
| GRCh37 position | Mutation(aa) | Unique sampleID count |
| chr19:879947-879947 | p.S448N | 5 |
| chr19:871222-871222 | p.D710D | 5 |
| chr19:871135-871135 | p.V739V | 5 |
| chr19:871987-871987 | p.T679T | 3 |
| chr19:875275-875279 | p.R579fs*13 | 3 |
| chr19:875447-875447 | p.S523F | 2 |
| chr19:873482-873482 | p.F624F | 2 |
| chr19:879943-879943 | p.H449Q | 2 |
| chr19:875330-875330 | p.S562L | 2 |
| chr19:876999-876999 | p.T512K | 2 |
| Top |
|
 |
| Point Mutation/ Tissue ID | 1 | 2 | 3 | 4 | 5 | 6 | 7 | 8 | 9 | 10 | 11 | 12 | 13 | 14 | 15 | 16 | 17 | 18 | 19 | 20 |
| # sample | 3 | 1 | 1 | 4 | 1 | 3 | 2 | 7 | 3 | 1 | 1 | 1 | 9 | 9 | 1 | 3 | ||||
| # mutation | 3 | 1 | 1 | 4 | 1 | 3 | 2 | 7 | 3 | 1 | 1 | 1 | 8 | 10 | 1 | 3 | ||||
| nonsynonymous SNV | 2 | 1 | 4 | 2 | 1 | 5 | 1 | 1 | 1 | 1 | 6 | 8 | 1 | 2 | ||||||
| synonymous SNV | 1 | 1 | 1 | 1 | 1 | 2 | 2 | 2 | 2 | 1 |
| cf) Tissue ID; Tissue type (1; BLCA[Bladder Urothelial Carcinoma], 2; BRCA[Breast invasive carcinoma], 3; CESC[Cervical squamous cell carcinoma and endocervical adenocarcinoma], 4; COAD[Colon adenocarcinoma], 5; GBM[Glioblastoma multiforme], 6; Glioma Low Grade, 7; HNSC[Head and Neck squamous cell carcinoma], 8; KICH[Kidney Chromophobe], 9; KIRC[Kidney renal clear cell carcinoma], 10; KIRP[Kidney renal papillary cell carcinoma], 11; LAML[Acute Myeloid Leukemia], 12; LUAD[Lung adenocarcinoma], 13; LUSC[Lung squamous cell carcinoma], 14; OV[Ovarian serous cystadenocarcinoma ], 15; PAAD[Pancreatic adenocarcinoma], 16; PRAD[Prostate adenocarcinoma], 17; SKCM[Skin Cutaneous Melanoma], 18:STAD[Stomach adenocarcinoma], 19:THCA[Thyroid carcinoma], 20:UCEC[Uterine Corpus Endometrial Carcinoma]) |
| Top |
| * We represented just top 10 SNVs. When you move the cursor on each content, you can see more deailed mutation information on the Tooltip. Those are primary_site, primary_histology, mutation(aa), pubmedID. |
| Genomic Position | Mutation(aa) | Unique sampleID count |
| chr19:868150 | p.P862L | 2 |
| chr19:872083 | p.Q616Q | 1 |
| chr19:885883 | p.A371S | 1 |
| chr19:875362 | p.V162I | 1 |
| chr19:881596 | p.L606P | 1 |
| chr19:872114 | p.L368L | 1 |
| chr19:885908 | p.A111T | 1 |
| chr19:875396 | p.P855P | 1 |
| chr19:868170 | p.V595V | 1 |
| chr19:881601 | p.D367N | 1 |
| * Copy number data were extracted from TCGA using R package TCGA-Assembler. The URLs of all public data files on TCGA DCC data server were gathered on Jan-05-2015. Function ProcessCNAData in TCGA-Assembler package was used to obtain gene-level copy number value which is calculated as the average copy number of the genomic region of a gene. |
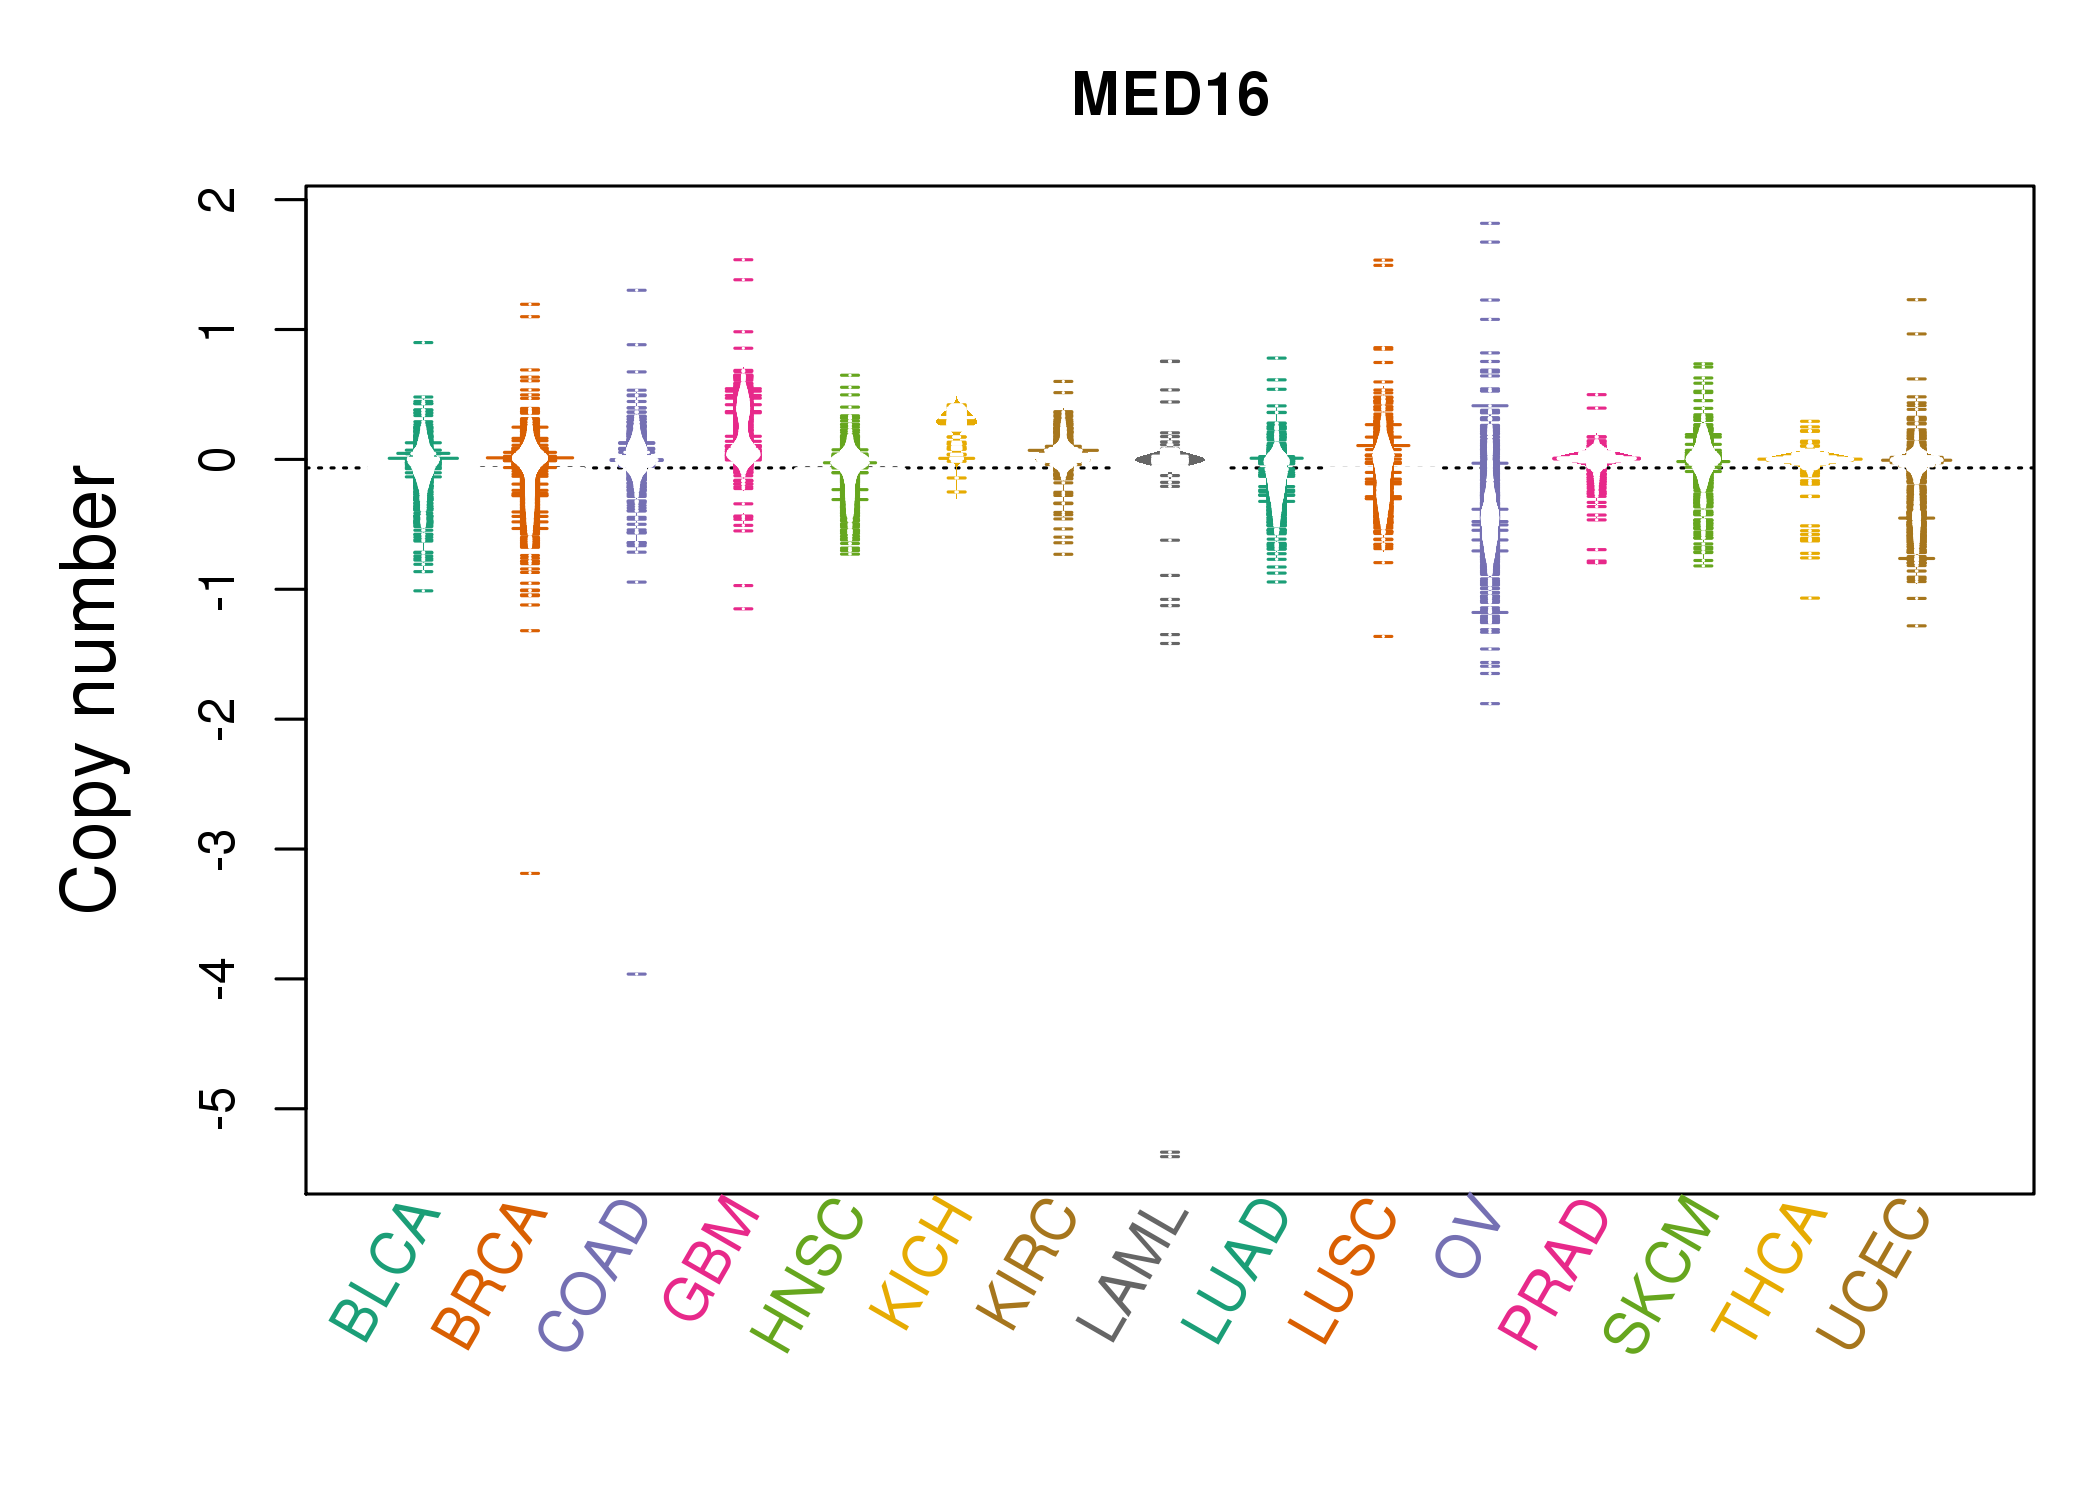 |
| cf) Tissue ID[Tissue type]: BLCA[Bladder Urothelial Carcinoma], BRCA[Breast invasive carcinoma], CESC[Cervical squamous cell carcinoma and endocervical adenocarcinoma], COAD[Colon adenocarcinoma], GBM[Glioblastoma multiforme], Glioma Low Grade, HNSC[Head and Neck squamous cell carcinoma], KICH[Kidney Chromophobe], KIRC[Kidney renal clear cell carcinoma], KIRP[Kidney renal papillary cell carcinoma], LAML[Acute Myeloid Leukemia], LUAD[Lung adenocarcinoma], LUSC[Lung squamous cell carcinoma], OV[Ovarian serous cystadenocarcinoma ], PAAD[Pancreatic adenocarcinoma], PRAD[Prostate adenocarcinoma], SKCM[Skin Cutaneous Melanoma], STAD[Stomach adenocarcinoma], THCA[Thyroid carcinoma], UCEC[Uterine Corpus Endometrial Carcinoma] |
| Top |
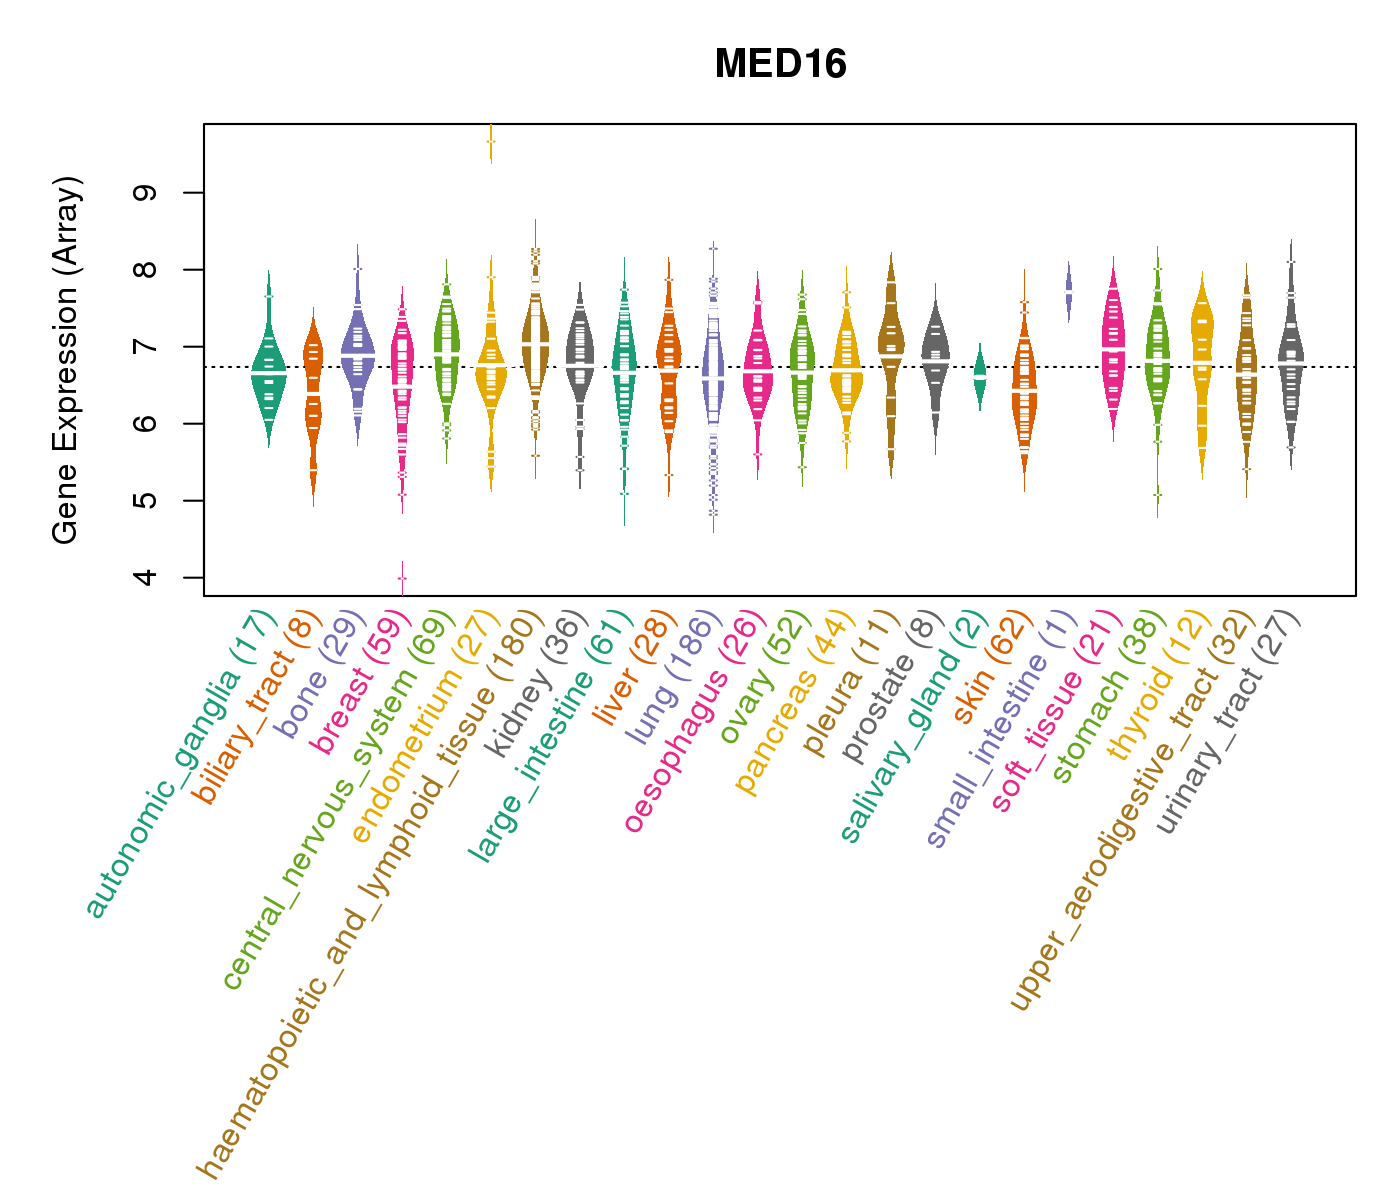
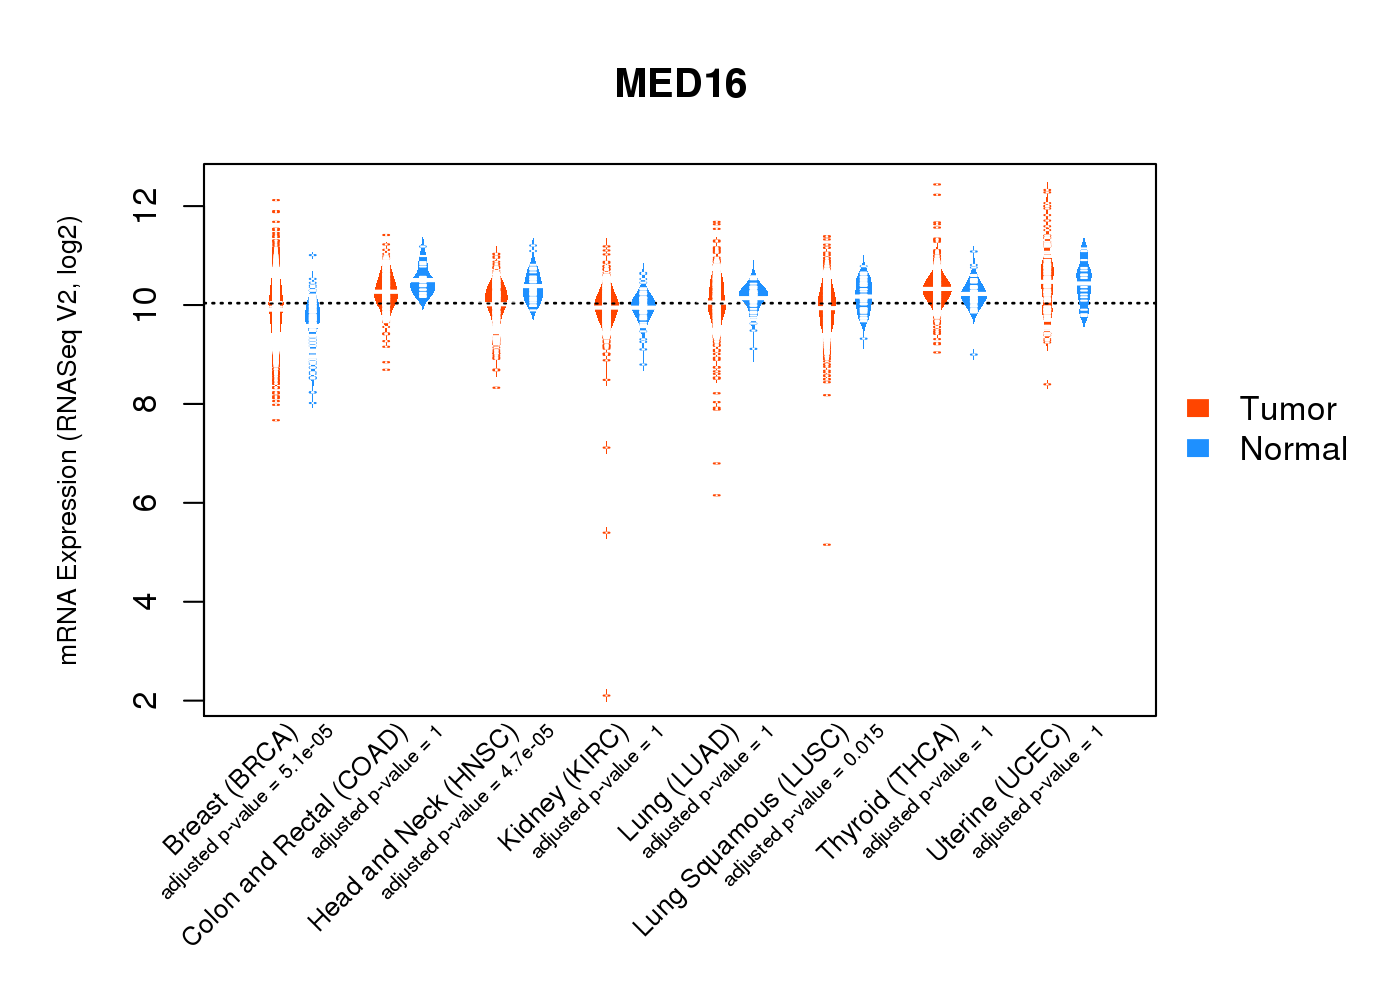
| Gene Expression for MED16 |
| * CCLE gene expression data were extracted from CCLE_Expression_Entrez_2012-10-18.res: Gene-centric RMA-normalized mRNA expression data. |
 |
| * Normalized gene expression data of RNASeqV2 was extracted from TCGA using R package TCGA-Assembler. The URLs of all public data files on TCGA DCC data server were gathered at Jan-05-2015. Only eight cancer types have enough normal control samples for differential expression analysis. (t test, adjusted p<0.05 (using Benjamini-Hochberg FDR)) |
 |
| Top |
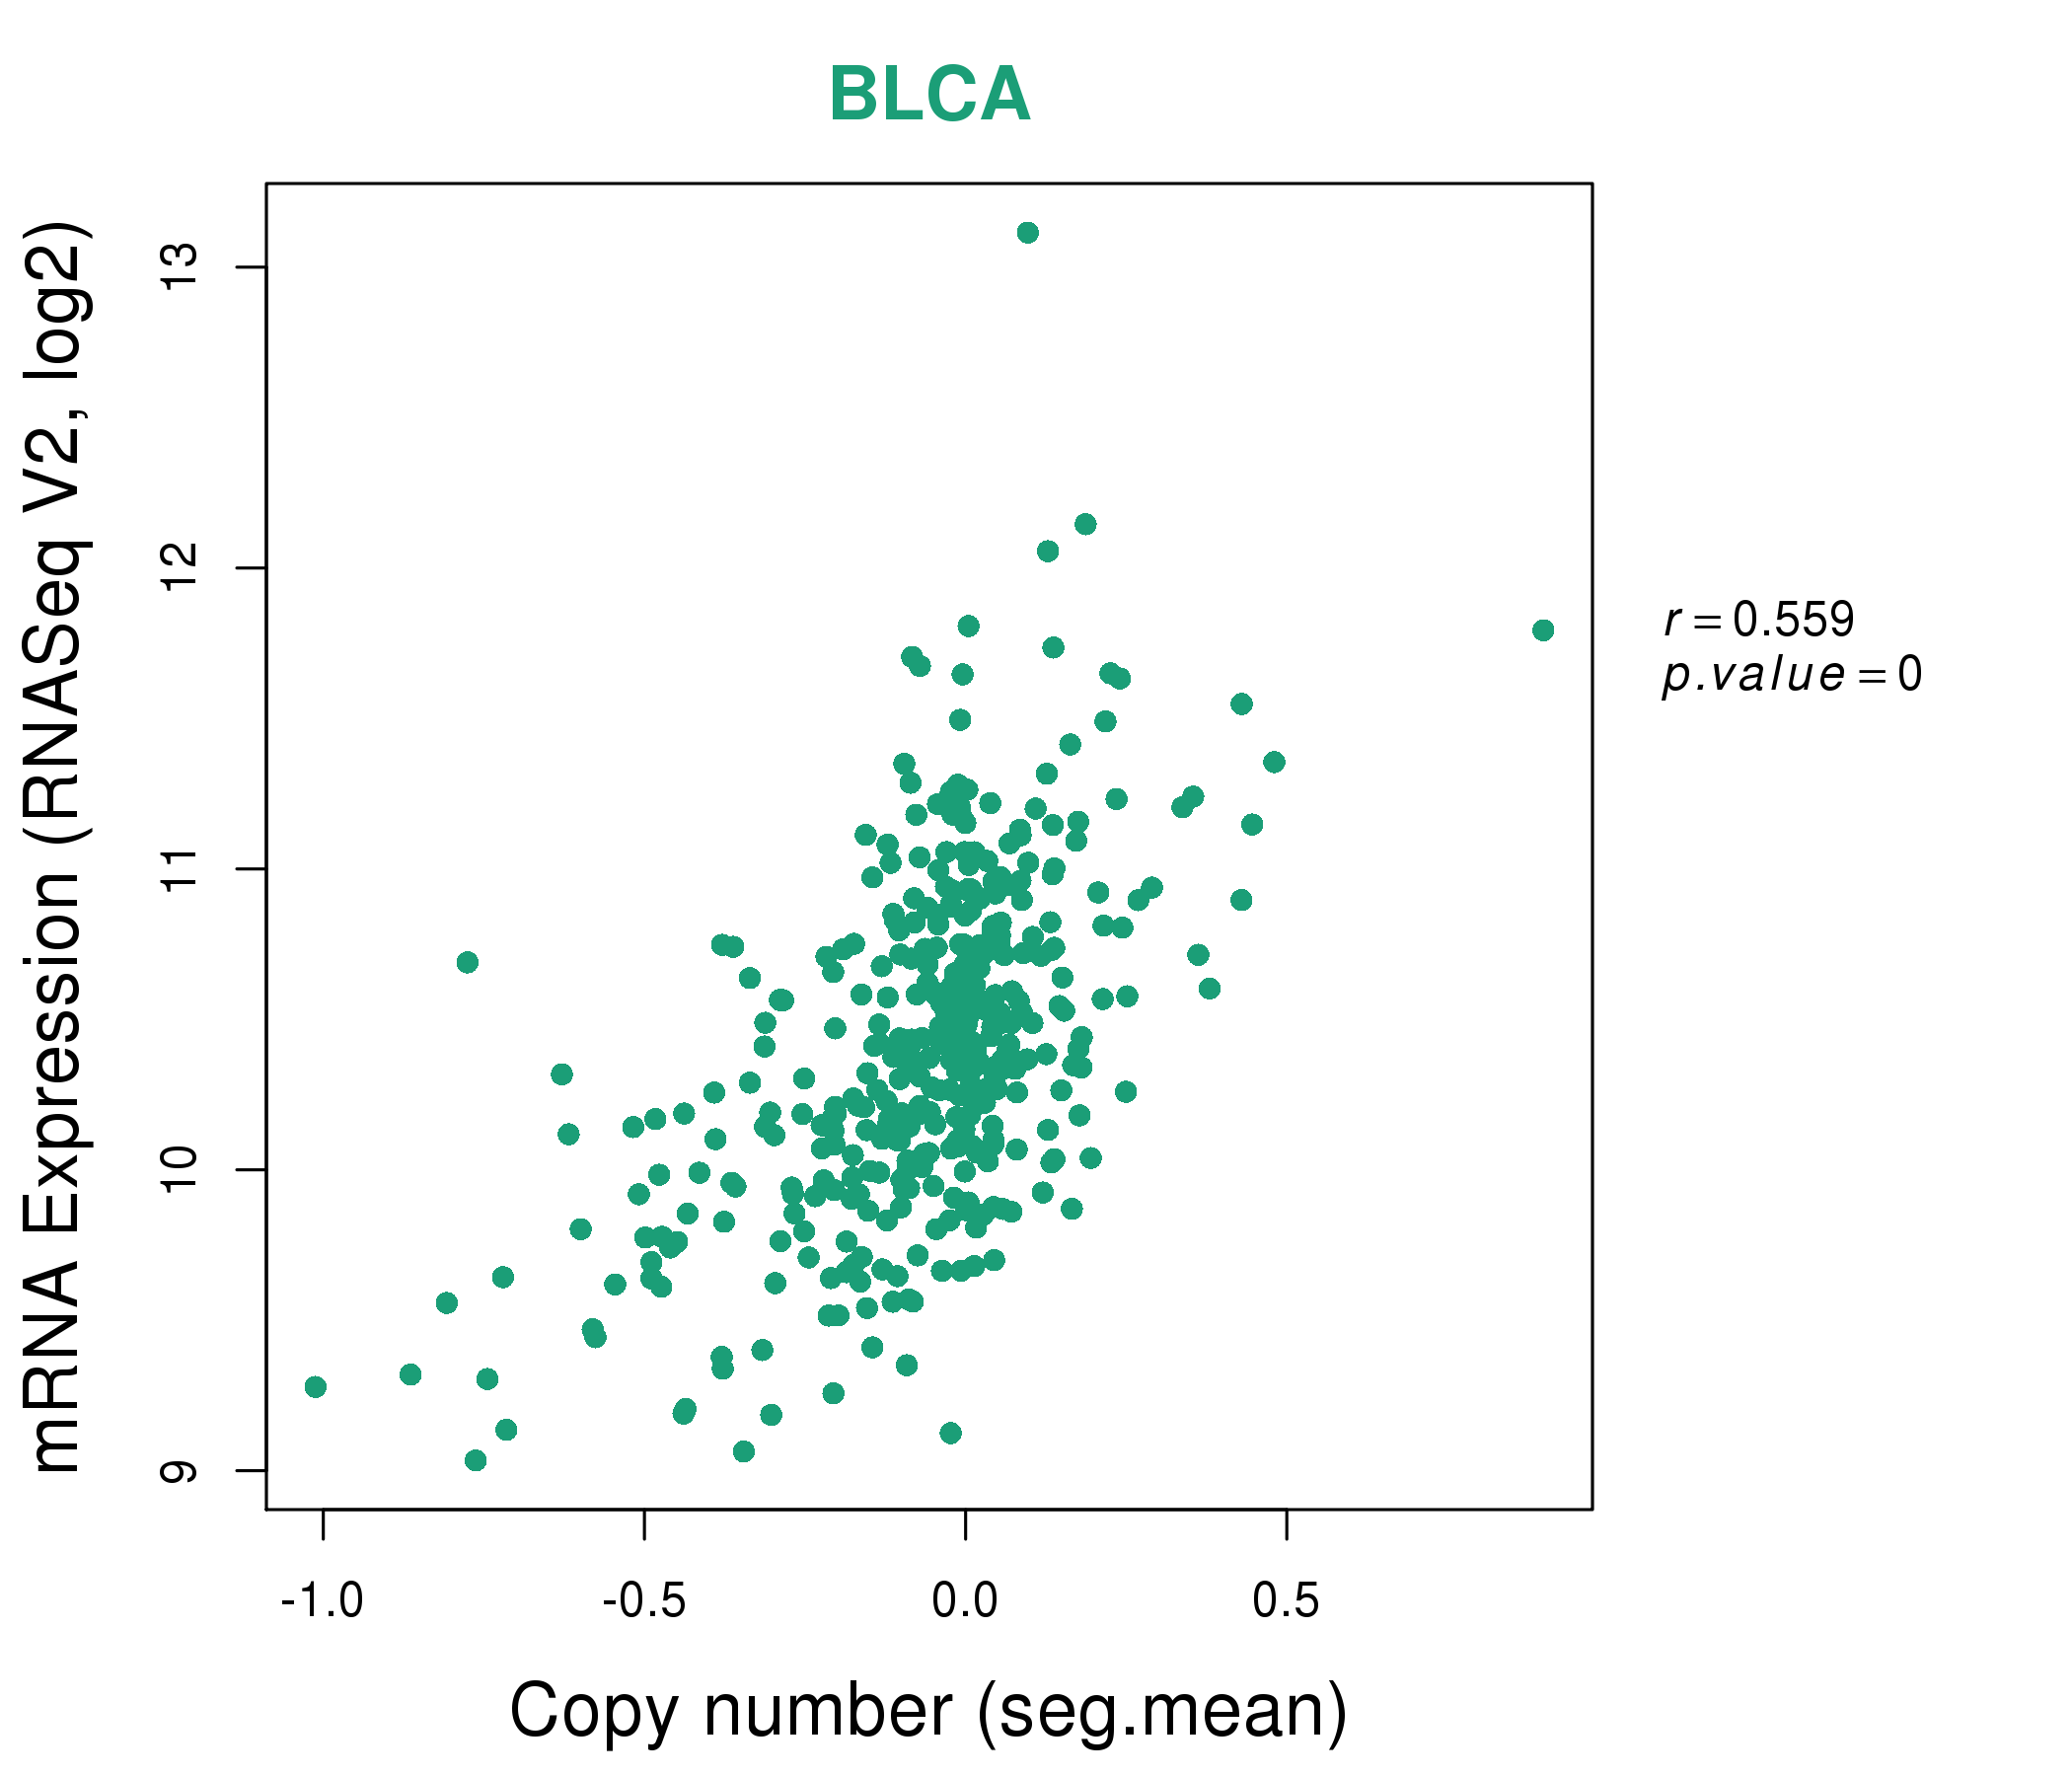
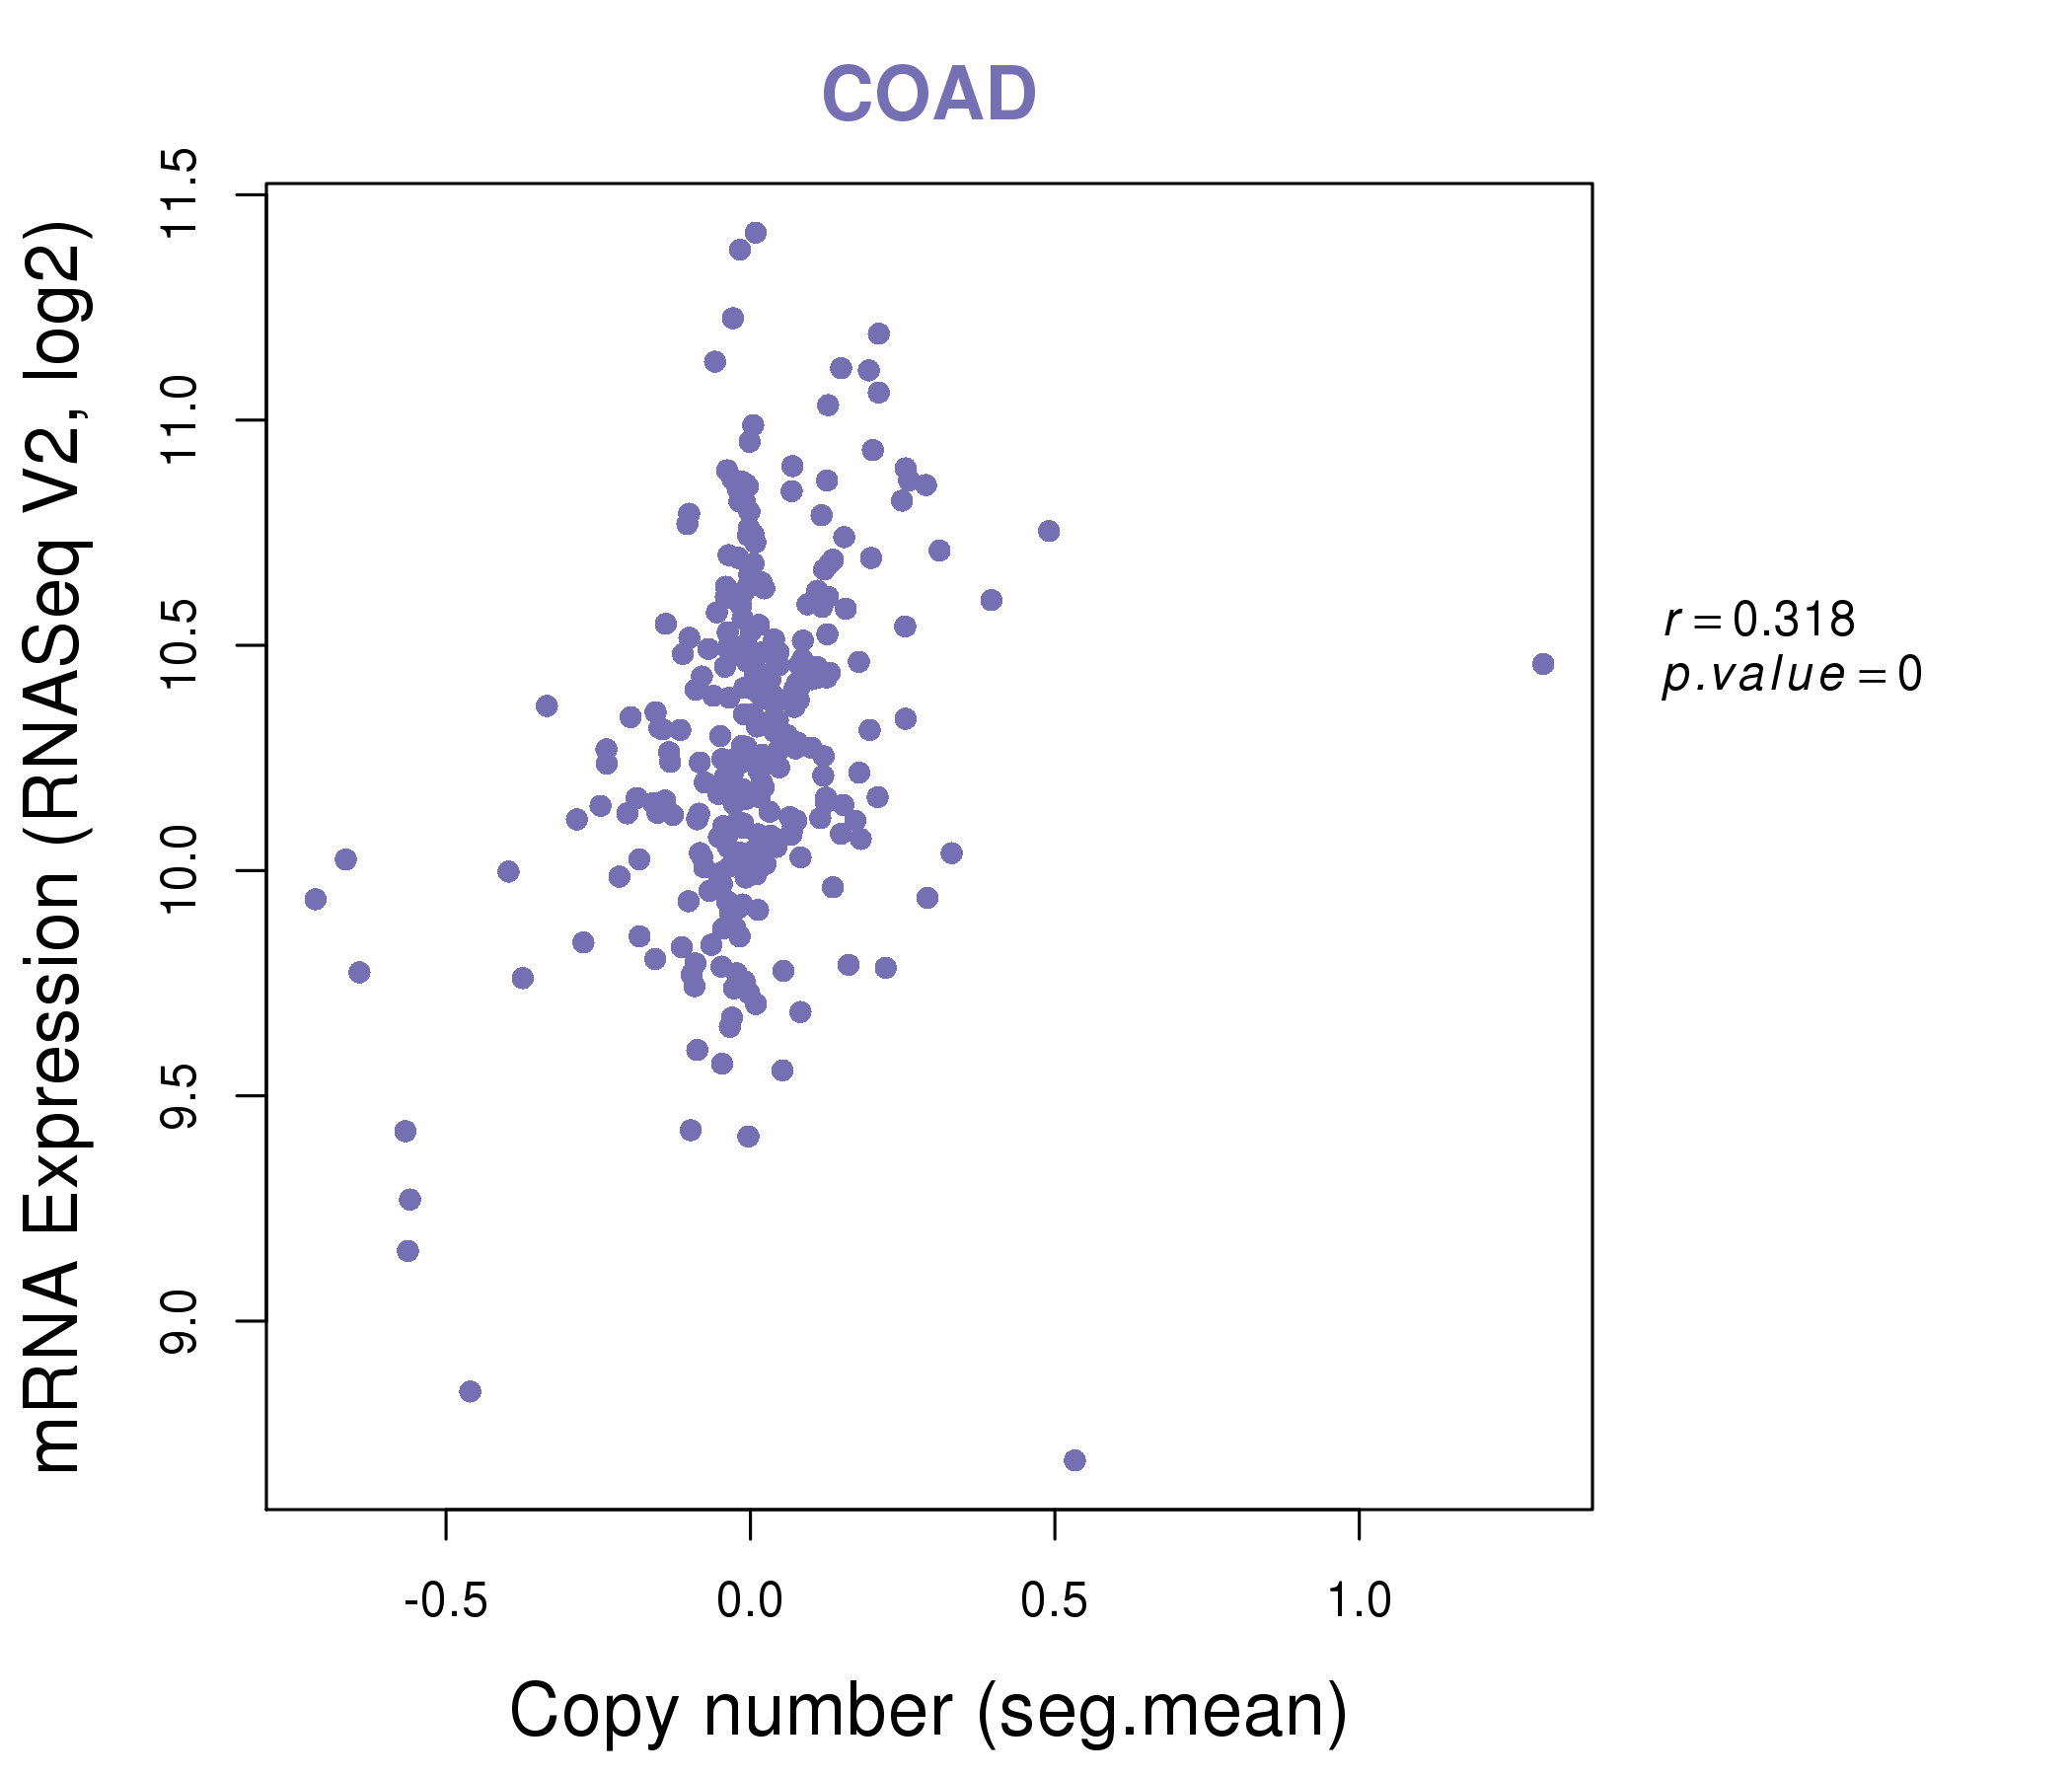
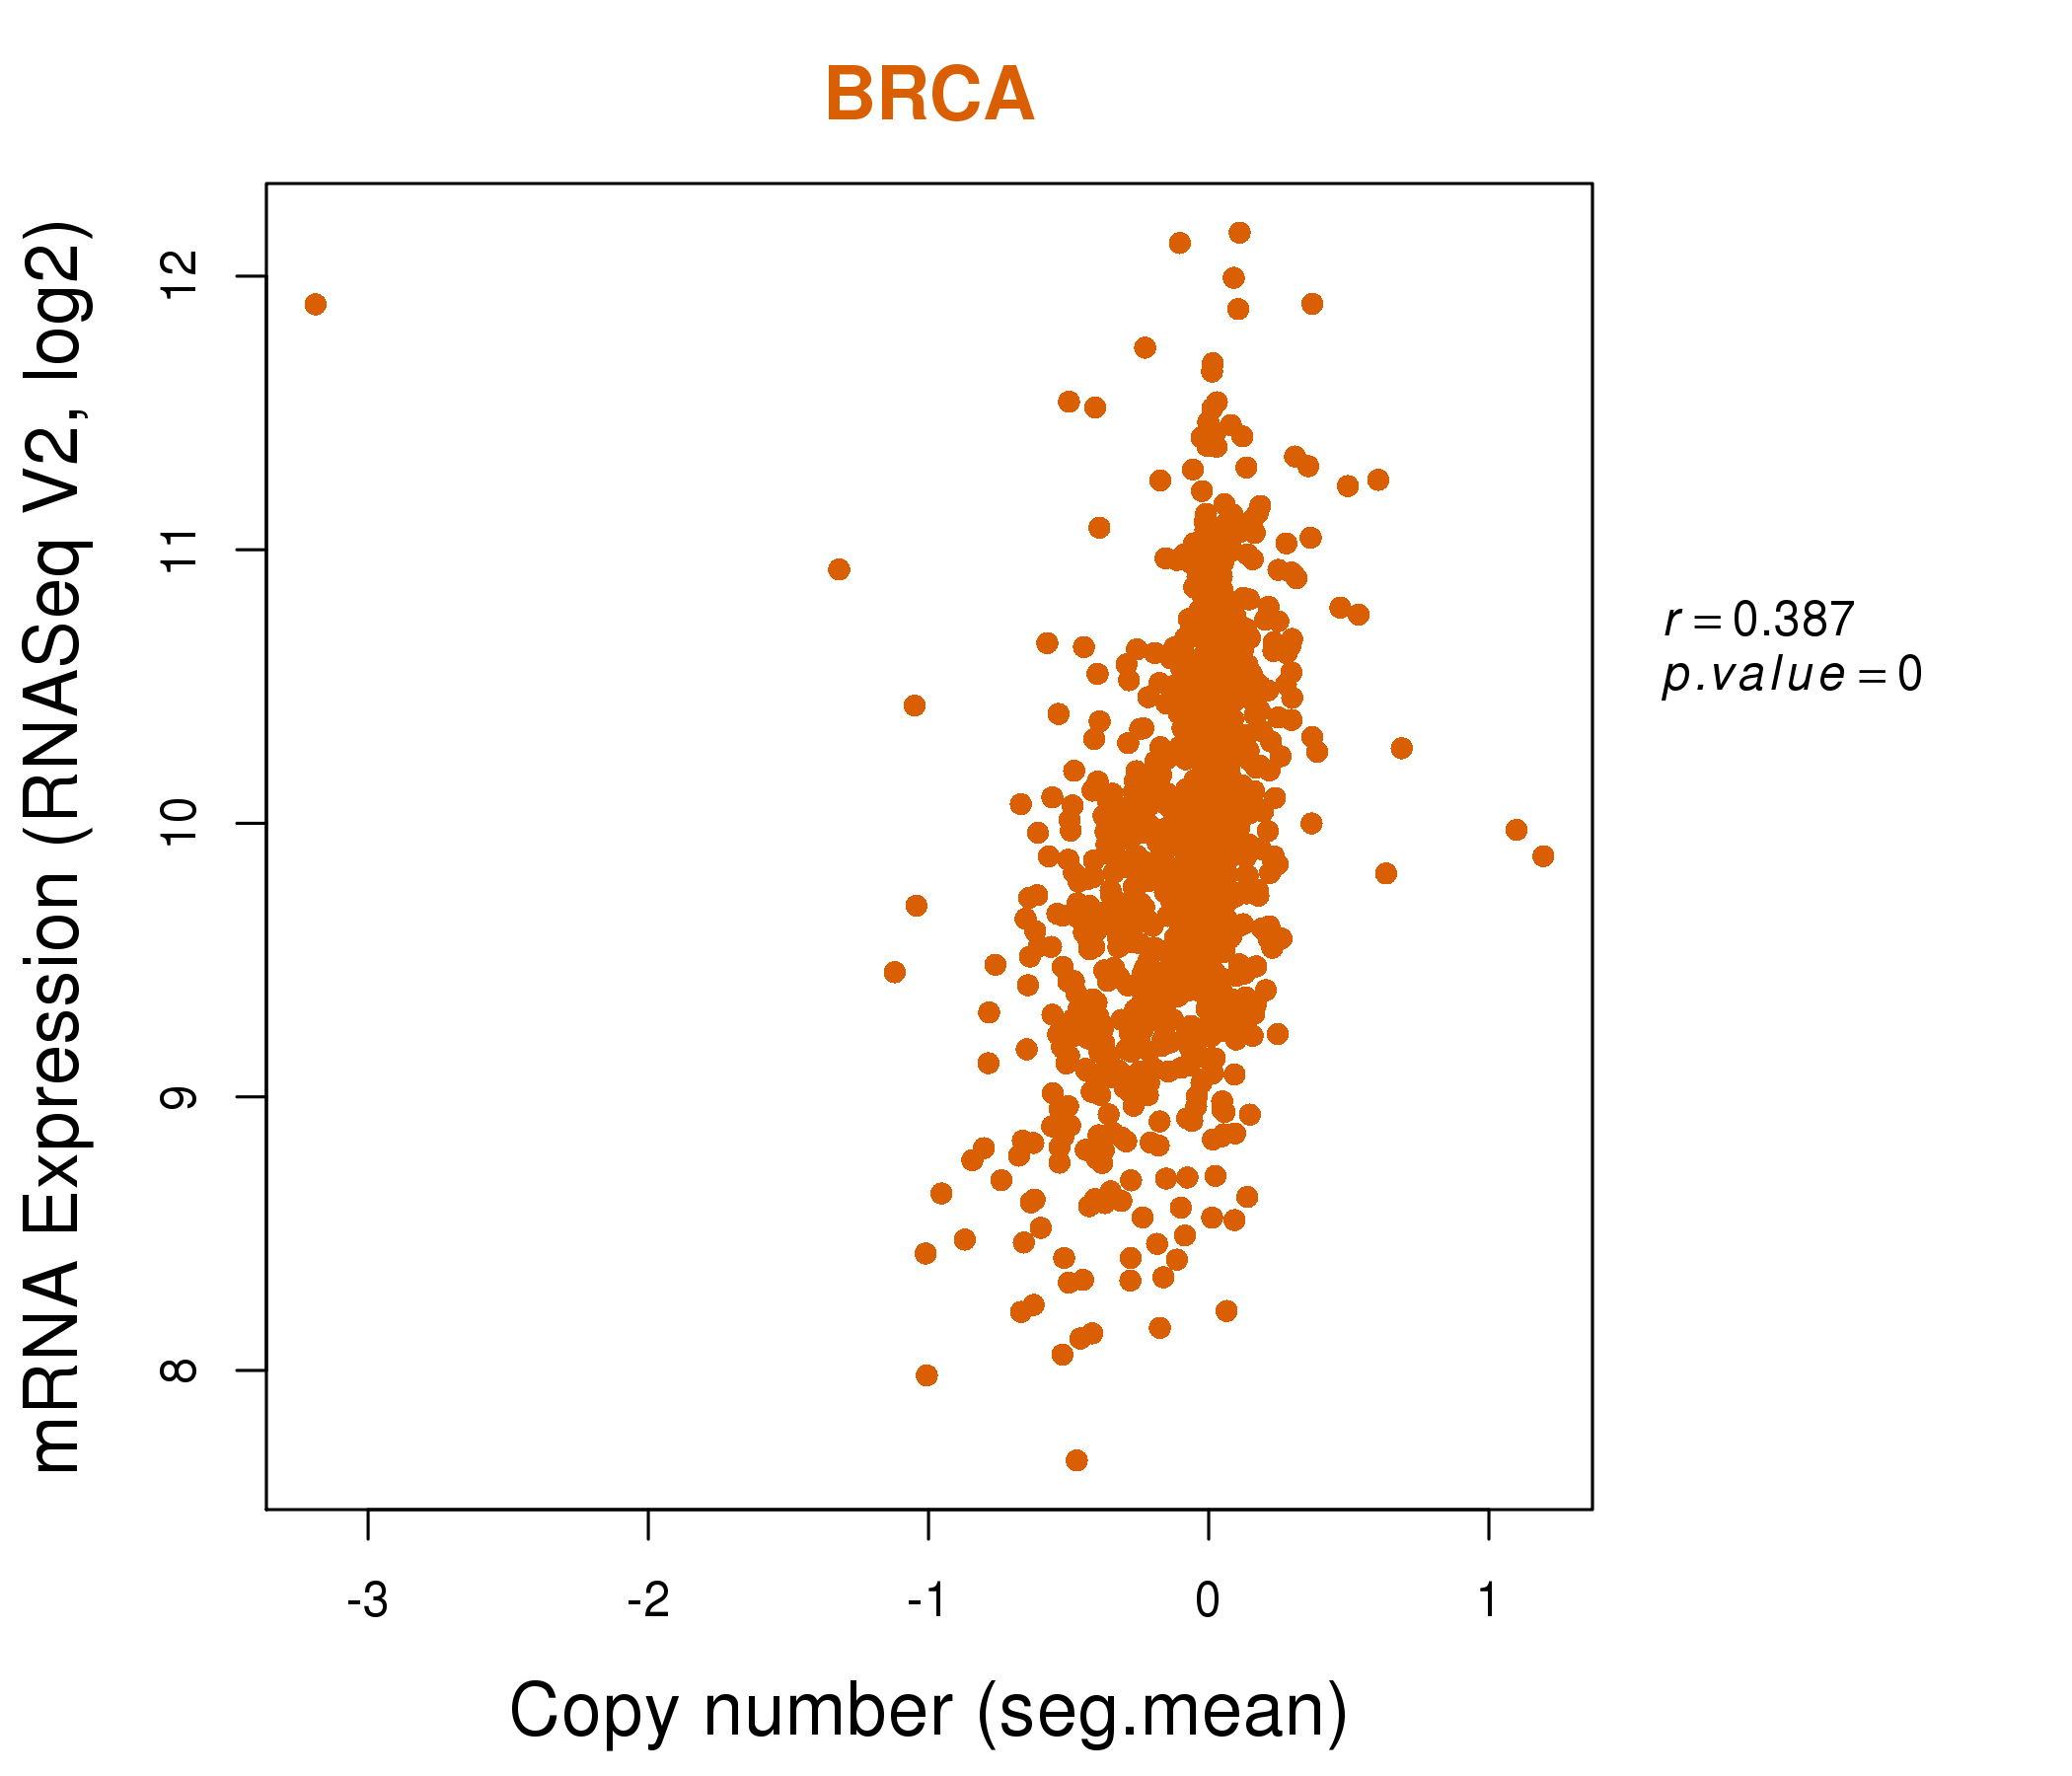
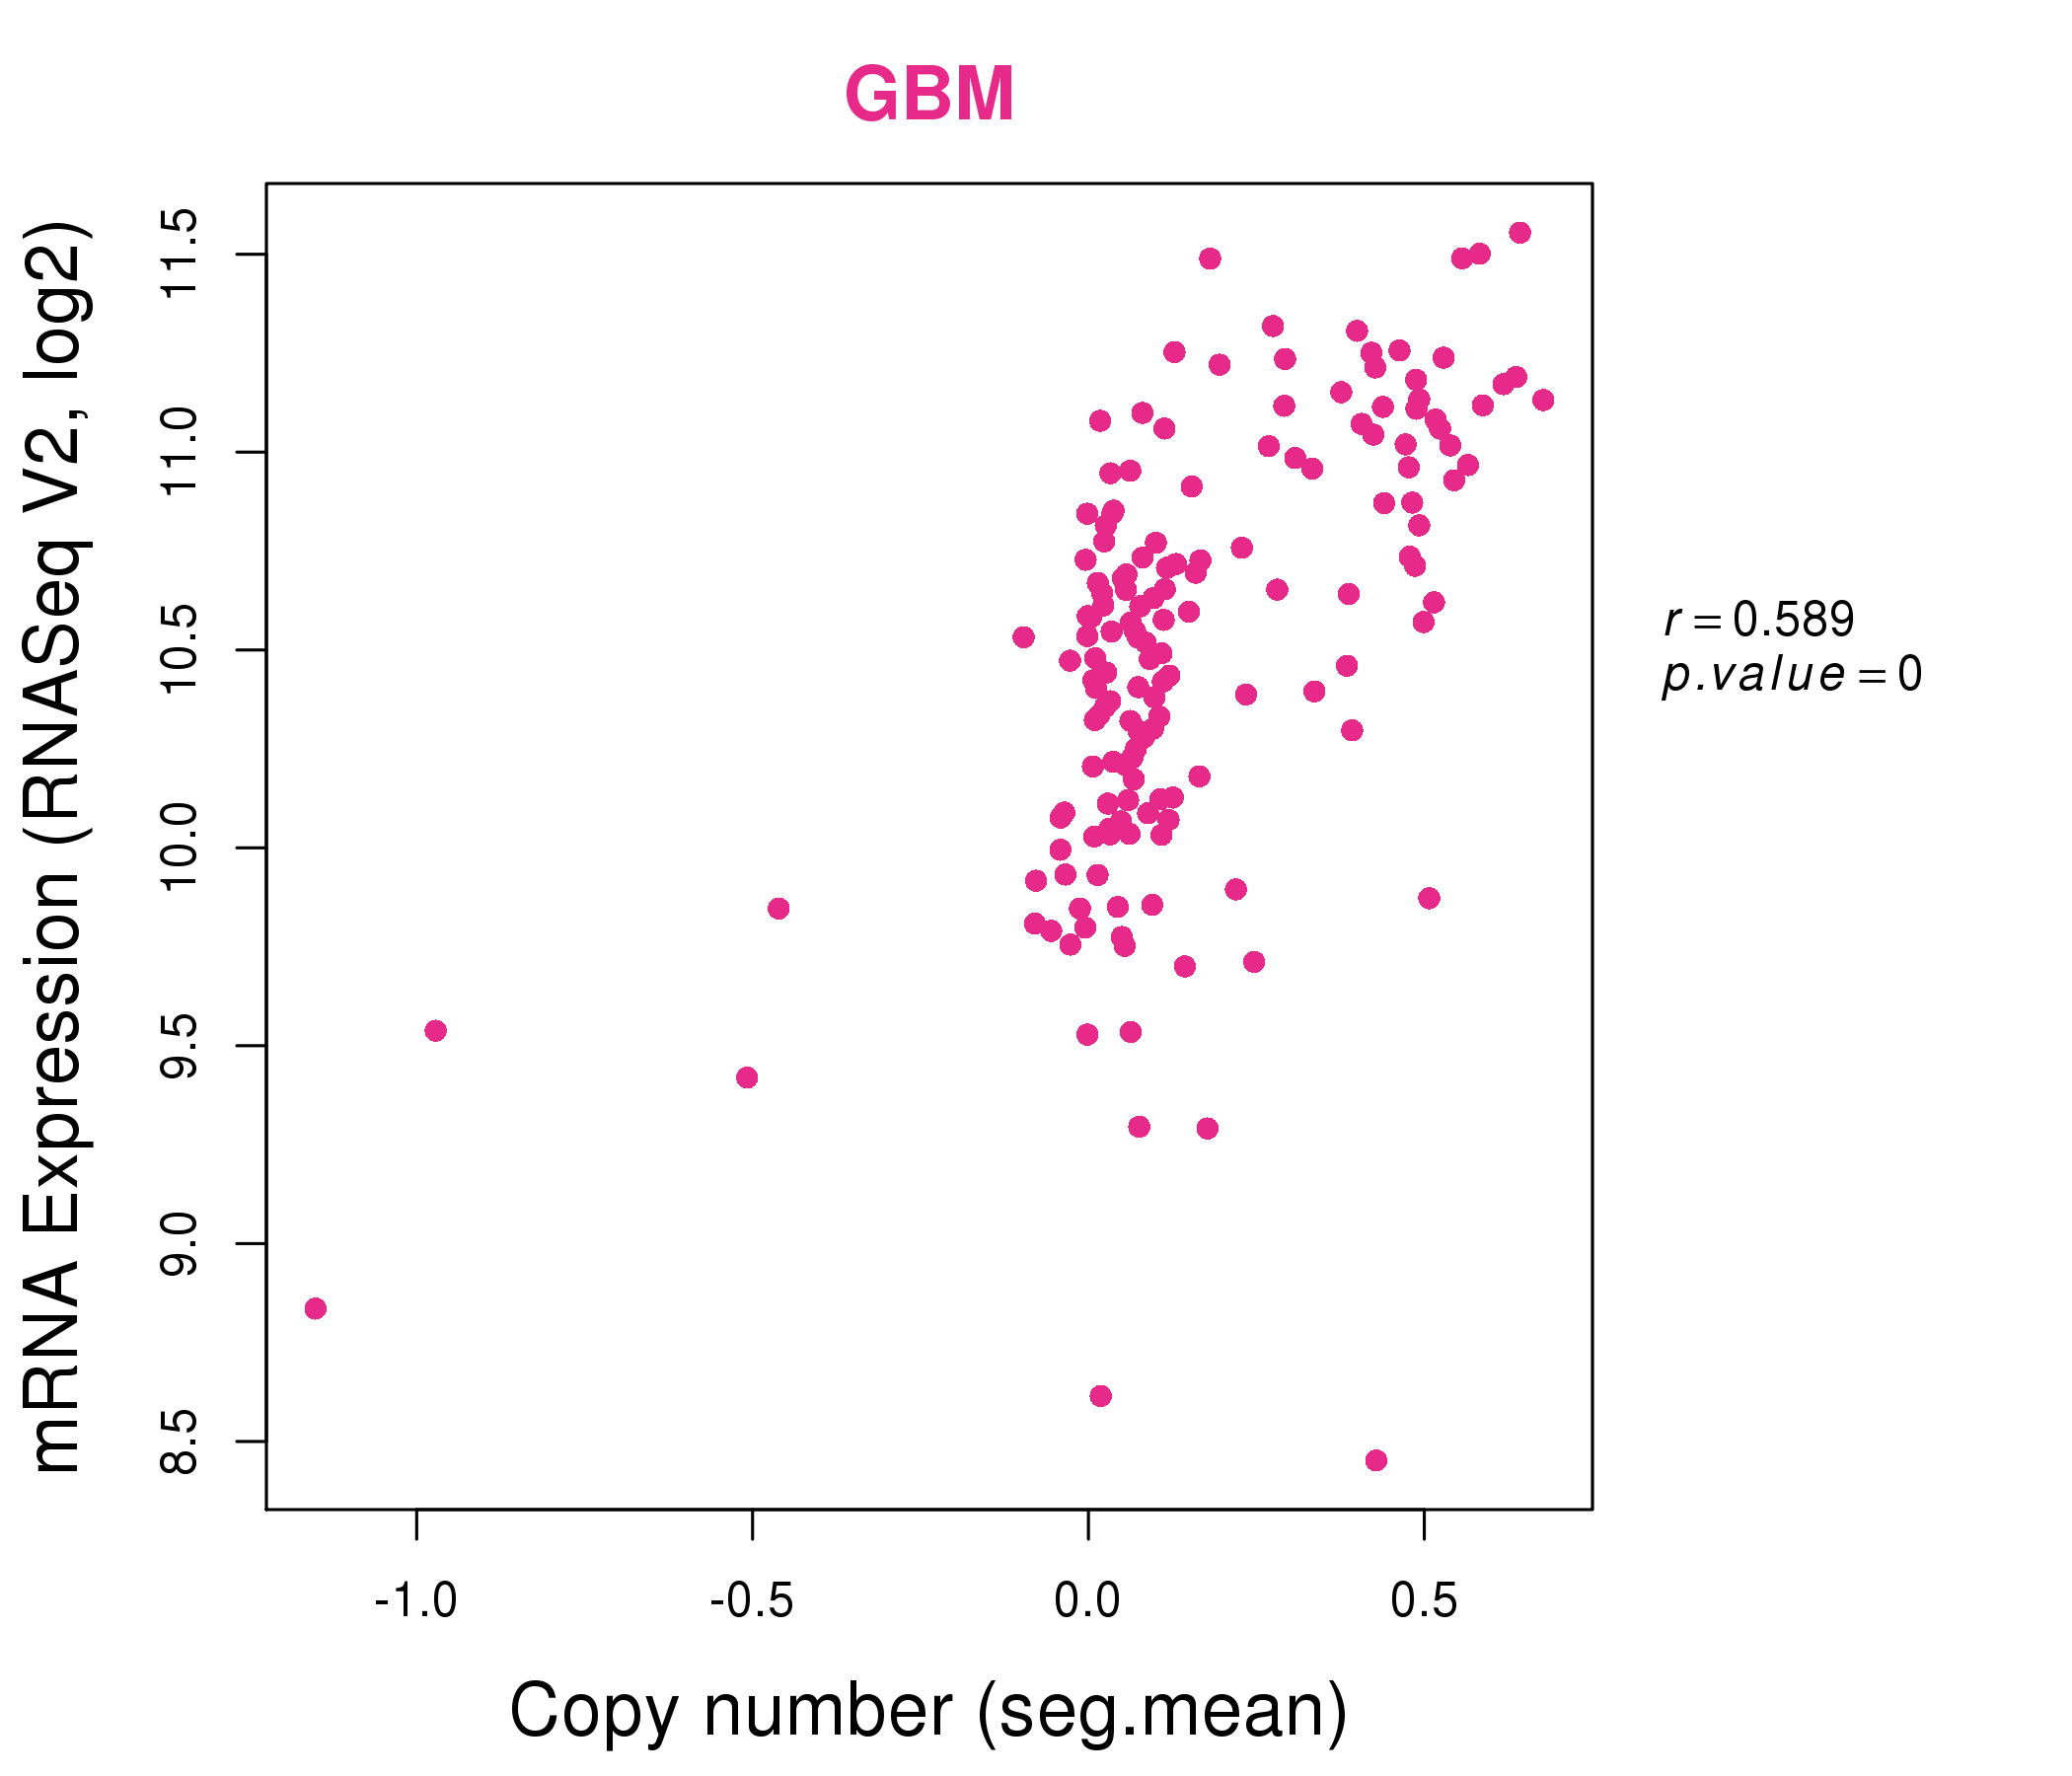
| * This plots show the correlation between CNV and gene expression. |
: Open all plots for all cancer types
 |
|
 |
|
| Top |
| Gene-Gene Network Information |
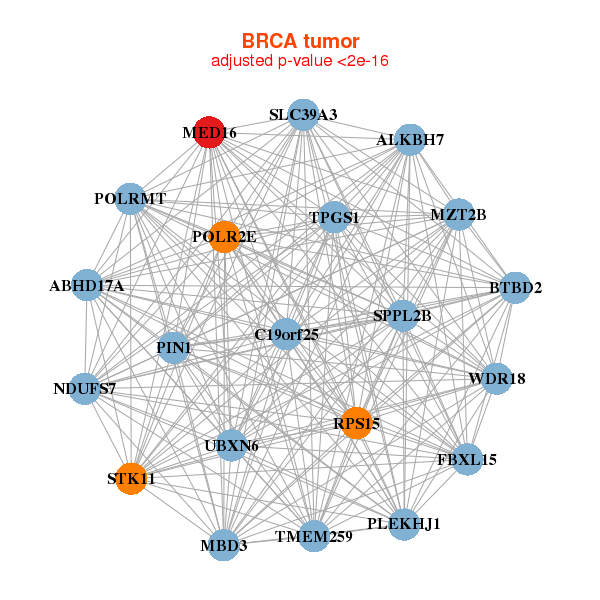
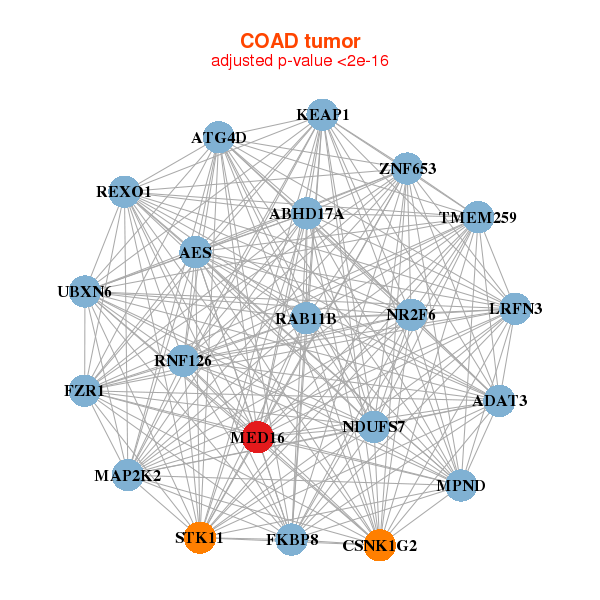
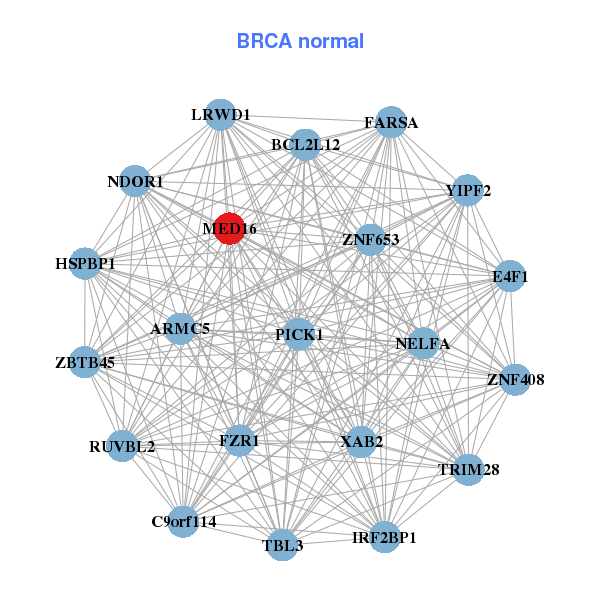
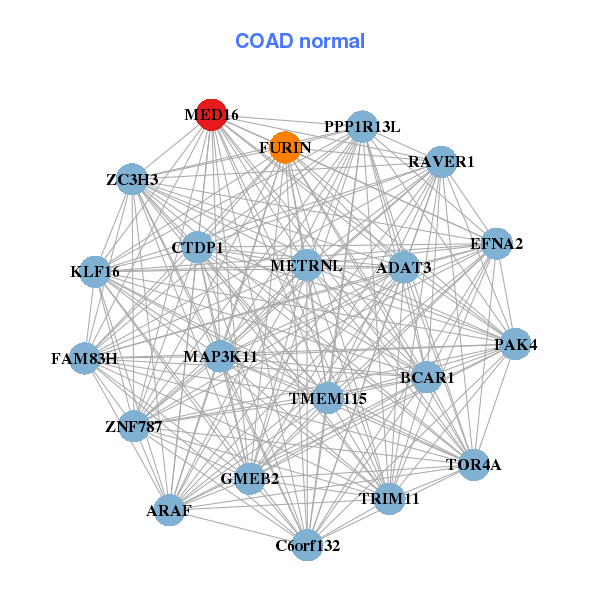
| * Co-Expression network figures were drawn using R package igraph. Only the top 20 genes with the highest correlations were shown. Red circle: input gene, orange circle: cell metabolism gene, sky circle: other gene |
: Open all plots for all cancer types
 |
|
| ALKBH7,BTBD2,TPGS1,C19orf25,TMEM259,ABHD17A,MZT2B, FBXL15,MBD3,MED16,NDUFS7,PIN1,PLEKHJ1,POLR2E, POLRMT,RPS15,SLC39A3,SPPL2B,STK11,UBXN6,WDR18 | ARMC5,BCL2L12,C9orf114,E4F1,FARSA,FZR1,HSPBP1, IRF2BP1,LRWD1,MED16,NDOR1,PICK1,RUVBL2,TBL3, TRIM28,NELFA,XAB2,YIPF2,ZBTB45,ZNF408,ZNF653 |
 |
|
| ADAT3,AES,ATG4D,TMEM259,CSNK1G2,ABHD17A,FKBP8, FZR1,KEAP1,LRFN3,MAP2K2,MED16,MPND,NDUFS7, NR2F6,RAB11B,REXO1,RNF126,STK11,UBXN6,ZNF653 | ADAT3,ARAF,BCAR1,C6orf132,TOR4A,CTDP1,EFNA2, FAM83H,FURIN,GMEB2,KLF16,MAP3K11,MED16,METRNL, PAK4,PPP1R13L,RAVER1,TMEM115,TRIM11,ZC3H3,ZNF787 |
| * Co-Expression network figures were drawn using R package igraph. Only the top 20 genes with the highest correlations were shown. Red circle: input gene, orange circle: cell metabolism gene, sky circle: other gene |
: Open all plots for all cancer types
| Top |
: Open all interacting genes' information including KEGG pathway for all interacting genes from DAVID
| Top |
| Pharmacological Information for MED16 |
| There's no related Drug. |
| Top |
| Cross referenced IDs for MED16 |
| * We obtained these cross-references from Uniprot database. It covers 150 different DBs, 18 categories. http://www.uniprot.org/help/cross_references_section |
: Open all cross reference information
|
Copyright © 2016-Present - The Univsersity of Texas Health Science Center at Houston @ |