|
||||||||||||||||||||||||||||||||||||||||||||||||||||||||||||||||||||||||||||||||||||||||||||||||||||||||||||||||||||||||||||||||||||||||||||||||||||||||||||||||||||||||||||||||||||||||||||||||||||||||||||||||||||||||||||||||||||||||||||||||||||||||||||||||||||||||||||||||||||||||||||||||||||||||||||||||||||||||||
| |
| Phenotypic Information (metabolism pathway, cancer, disease, phenome) |
| |
| |
| Gene-Gene Network Information: Co-Expression Network, Interacting Genes & KEGG |
| |
|


| Gene Summary for PIGK |
| Basic gene info. | Gene symbol | PIGK |
| Gene name | phosphatidylinositol glycan anchor biosynthesis, class K | |
| Synonyms | GPI8 | |
| Cytomap | UCSC genome browser: 1p31.1 | |
| Genomic location | chr1 :77554666-77685132 | |
| Type of gene | protein-coding | |
| RefGenes | NM_005482.2, | |
| Ensembl id | ENSG00000142892 | |
| Description | GPI transamidase subunitGPI-anchor transamidaseGPI8 homologPIG-Kphosphatidylinositol glycan, class Kphosphatidylinositol-glycan biosynthesis class K protein | |
| Modification date | 20141207 | |
| dbXrefs | MIM : 605087 | |
| HGNC : HGNC | ||
| Ensembl : ENSG00000142892 | ||
| HPRD : 05474 | ||
| Vega : OTTHUMG00000009686 | ||
| Protein | UniProt: go to UniProt's Cross Reference DB Table | |
| Expression | CleanEX: HS_PIGK | |
| BioGPS: 10026 | ||
| Gene Expression Atlas: ENSG00000142892 | ||
| The Human Protein Atlas: ENSG00000142892 | ||
| Pathway | NCI Pathway Interaction Database: PIGK | |
| KEGG: PIGK | ||
| REACTOME: PIGK | ||
| ConsensusPathDB | ||
| Pathway Commons: PIGK | ||
| Metabolism | MetaCyc: PIGK | |
| HUMANCyc: PIGK | ||
| Regulation | Ensembl's Regulation: ENSG00000142892 | |
| miRBase: chr1 :77,554,666-77,685,132 | ||
| TargetScan: NM_005482 | ||
| cisRED: ENSG00000142892 | ||
| Context | iHOP: PIGK | |
| cancer metabolism search in PubMed: PIGK | ||
| UCL Cancer Institute: PIGK | ||
| Assigned class in ccmGDB | C | |
| Top |
| Phenotypic Information for PIGK(metabolism pathway, cancer, disease, phenome) |
| Cancer | CGAP: PIGK |
| Familial Cancer Database: PIGK | |
| * This gene is included in those cancer gene databases. |
|
|
|
|
|
| . | ||||||||||||||||||||||||||||||||||||||||||||||||||||||||||||||||||||||||||||||||||||||||||||||||||||||||||||||||||||||||||||||||||||||||||||||||||||||||||||||||||||||||||||||||||||||||||||||||||||||||||||||||||||||||||||||||||||||||||||||||||||||||||||||||||||||||||||||||||||||||||||||||||||||||||||||||||||
Oncogene 1 | Significant driver gene in | |||||||||||||||||||||||||||||||||||||||||||||||||||||||||||||||||||||||||||||||||||||||||||||||||||||||||||||||||||||||||||||||||||||||||||||||||||||||||||||||||||||||||||||||||||||||||||||||||||||||||||||||||||||||||||||||||||||||||||||||||||||||||||||||||||||||||||||||||||||||||||||||||||||||||||||||||||||||||
| cf) number; DB name 1 Oncogene; http://nar.oxfordjournals.org/content/35/suppl_1/D721.long, 2 Tumor Suppressor gene; https://bioinfo.uth.edu/TSGene/, 3 Cancer Gene Census; http://www.nature.com/nrc/journal/v4/n3/abs/nrc1299.html, 4 CancerGenes; http://nar.oxfordjournals.org/content/35/suppl_1/D721.long, 5 Network of Cancer Gene; http://ncg.kcl.ac.uk/index.php, 1Therapeutic Vulnerabilities in Cancer; http://cbio.mskcc.org/cancergenomics/statius/ |
| REACTOME_METABOLISM_OF_PROTEINS | |
| OMIM | |
| Orphanet | |
| Disease | KEGG Disease: PIGK |
| MedGen: PIGK (Human Medical Genetics with Condition) | |
| ClinVar: PIGK | |
| Phenotype | MGI: PIGK (International Mouse Phenotyping Consortium) |
| PhenomicDB: PIGK | |
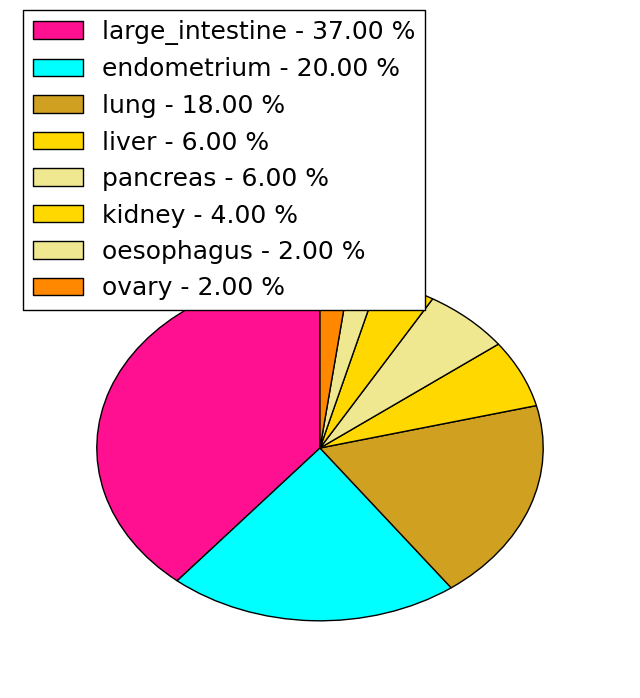
| Mutations for PIGK |
| * Under tables are showing count per each tissue to give us broad intuition about tissue specific mutation patterns.You can go to the detailed page for each mutation database's web site. |
| - Statistics for Tissue and Mutation type | Top |
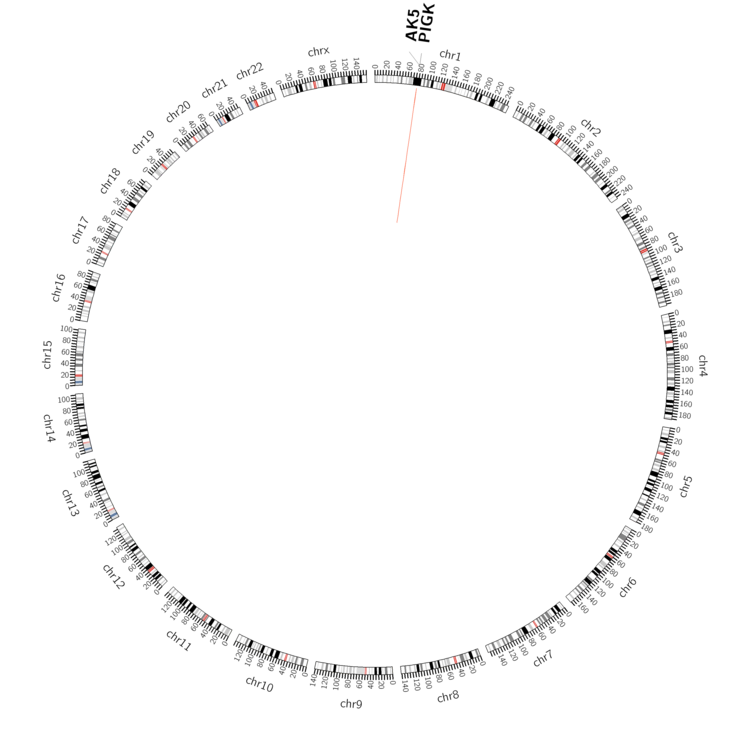 |
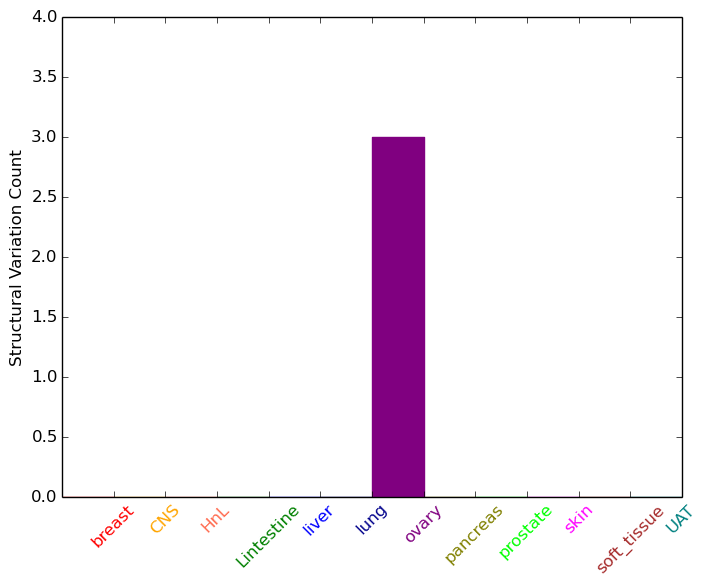
| - For Inter-chromosomal Variations |
| There's no inter-chromosomal structural variation. |
| - For Intra-chromosomal Variations |
| * Intra-chromosomal variantions includes 'intrachromosomal amplicon to amplicon', 'intrachromosomal amplicon to non-amplified dna', 'intrachromosomal deletion', 'intrachromosomal fold-back inversion', 'intrachromosomal inversion', 'intrachromosomal tandem duplication', 'Intrachromosomal unknown type', 'intrachromosomal with inverted orientation', 'intrachromosomal with non-inverted orientation'. |
 |
| Sample | Symbol_a | Chr_a | Start_a | End_a | Symbol_b | Chr_b | Start_b | End_b |
| ovary | PIGK | chr1 | 77590715 | 77590735 | chr1 | 77533638 | 77533658 | |
| ovary | PIGK | chr1 | 77661616 | 77661636 | AK5 | chr1 | 77752686 | 77752706 |
| cf) Tissue number; Tissue name (1;Breast, 2;Central_nervous_system, 3;Haematopoietic_and_lymphoid_tissue, 4;Large_intestine, 5;Liver, 6;Lung, 7;Ovary, 8;Pancreas, 9;Prostate, 10;Skin, 11;Soft_tissue, 12;Upper_aerodigestive_tract) |
| * From mRNA Sanger sequences, Chitars2.0 arranged chimeric transcripts. This table shows PIGK related fusion information. |
| ID | Head Gene | Tail Gene | Accession | Gene_a | qStart_a | qEnd_a | Chromosome_a | tStart_a | tEnd_a | Gene_a | qStart_a | qEnd_a | Chromosome_a | tStart_a | tEnd_a |
| CB243604 | PIGK | 1 | 103 | 1 | 77595295 | 77595396 | KIF21A | 89 | 415 | 12 | 39726154 | 39726810 | |
| Top |
| Mutation type/ Tissue ID | brca | cns | cerv | endome | haematopo | kidn | Lintest | liver | lung | ns | ovary | pancre | prost | skin | stoma | thyro | urina | |||
| Total # sample | 1 | 2 | 1 | 1 | 1 | |||||||||||||||
| GAIN (# sample) | 1 | 2 | 1 | 1 | ||||||||||||||||
| LOSS (# sample) | 1 |
| cf) Tissue ID; Tissue type (1; Breast, 2; Central_nervous_system, 3; Cervix, 4; Endometrium, 5; Haematopoietic_and_lymphoid_tissue, 6; Kidney, 7; Large_intestine, 8; Liver, 9; Lung, 10; NS, 11; Ovary, 12; Pancreas, 13; Prostate, 14; Skin, 15; Stomach, 16; Thyroid, 17; Urinary_tract) |
| Top |
|
 |
| Top |
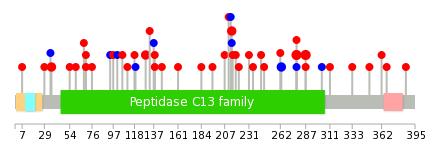
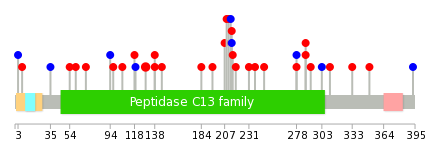
| Stat. for Non-Synonymous SNVs (# total SNVs=43) | (# total SNVs=7) |
 |  |
(# total SNVs=1) | (# total SNVs=0) |
 |
| Top |
| * When you move the cursor on each content, you can see more deailed mutation information on the Tooltip. Those are primary_site,primary_histology,mutation(aa),pubmedID. |
| GRCh37 position | Mutation(aa) | Unique sampleID count |
| chr1:77627341-77627341 | p.R214* | 3 |
| chr1:77620260-77620260 | p.R287H | 3 |
| chr1:77620288-77620288 | p.S278G | 3 |
| chr1:77632504-77632504 | p.E129D | 2 |
| chr1:77627004-77627004 | p.A263A | 2 |
| chr1:77676161-77676161 | p.Q36R | 2 |
| chr1:77627340-77627340 | p.R214Q | 2 |
| chr1:77676163-77676163 | p.E35E | 1 |
| chr1:77632478-77632478 | p.R138K | 1 |
| chr1:77620189-77620189 | p.E311Q | 1 |
| Top |
|
 |
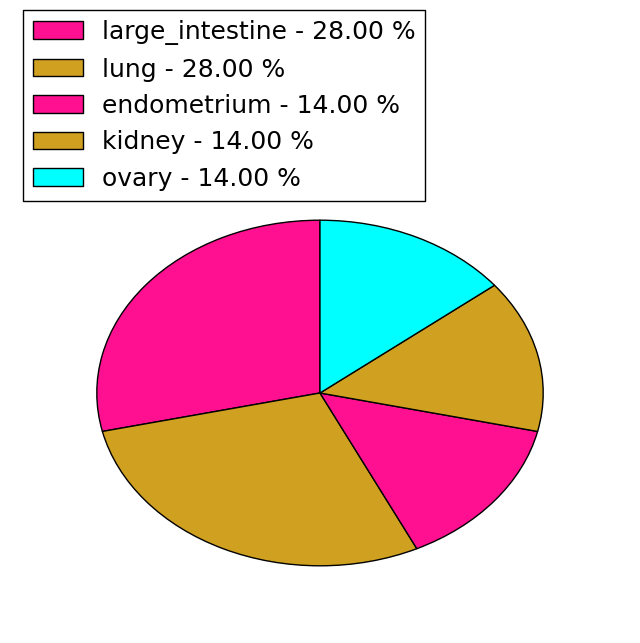
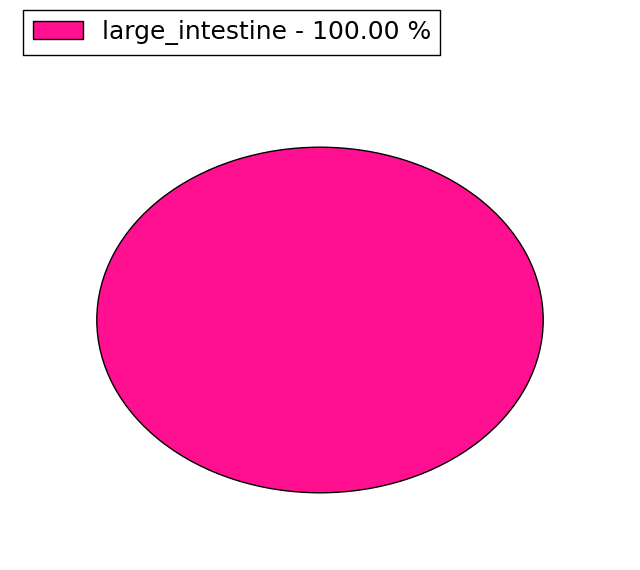
| Point Mutation/ Tissue ID | 1 | 2 | 3 | 4 | 5 | 6 | 7 | 8 | 9 | 10 | 11 | 12 | 13 | 14 | 15 | 16 | 17 | 18 | 19 | 20 |
| # sample | 2 | 1 | 8 | 4 | 1 | 3 | 1 | 2 | 6 | 2 | 9 | |||||||||
| # mutation | 2 | 1 | 8 | 4 | 1 | 3 | 1 | 2 | 6 | 2 | 8 | |||||||||
| nonsynonymous SNV | 2 | 6 | 3 | 1 | 2 | 1 | 1 | 5 | 1 | 7 | ||||||||||
| synonymous SNV | 1 | 2 | 1 | 1 | 1 | 1 | 1 | 1 |
| cf) Tissue ID; Tissue type (1; BLCA[Bladder Urothelial Carcinoma], 2; BRCA[Breast invasive carcinoma], 3; CESC[Cervical squamous cell carcinoma and endocervical adenocarcinoma], 4; COAD[Colon adenocarcinoma], 5; GBM[Glioblastoma multiforme], 6; Glioma Low Grade, 7; HNSC[Head and Neck squamous cell carcinoma], 8; KICH[Kidney Chromophobe], 9; KIRC[Kidney renal clear cell carcinoma], 10; KIRP[Kidney renal papillary cell carcinoma], 11; LAML[Acute Myeloid Leukemia], 12; LUAD[Lung adenocarcinoma], 13; LUSC[Lung squamous cell carcinoma], 14; OV[Ovarian serous cystadenocarcinoma ], 15; PAAD[Pancreatic adenocarcinoma], 16; PRAD[Prostate adenocarcinoma], 17; SKCM[Skin Cutaneous Melanoma], 18:STAD[Stomach adenocarcinoma], 19:THCA[Thyroid carcinoma], 20:UCEC[Uterine Corpus Endometrial Carcinoma]) |
| Top |
| * We represented just top 10 SNVs. When you move the cursor on each content, you can see more deailed mutation information on the Tooltip. Those are primary_site, primary_histology, mutation(aa), pubmedID. |
| Genomic Position | Mutation(aa) | Unique sampleID count |
| chr1:77632504 | p.E129D | 2 |
| chr1:77634966 | p.M246T | 1 |
| chr1:77620261 | p.V119V | 1 |
| chr1:77627348 | p.P237L | 1 |
| chr1:77635002 | p.E118D | 1 |
| chr1:77620286 | p.D231H | 1 |
| chr1:77627356 | p.K106N | 1 |
| chr1:77635030 | p.P218H | 1 |
| chr1:77620287 | p.P97L | 1 |
| chr1:77627362 | p.F215L | 1 |
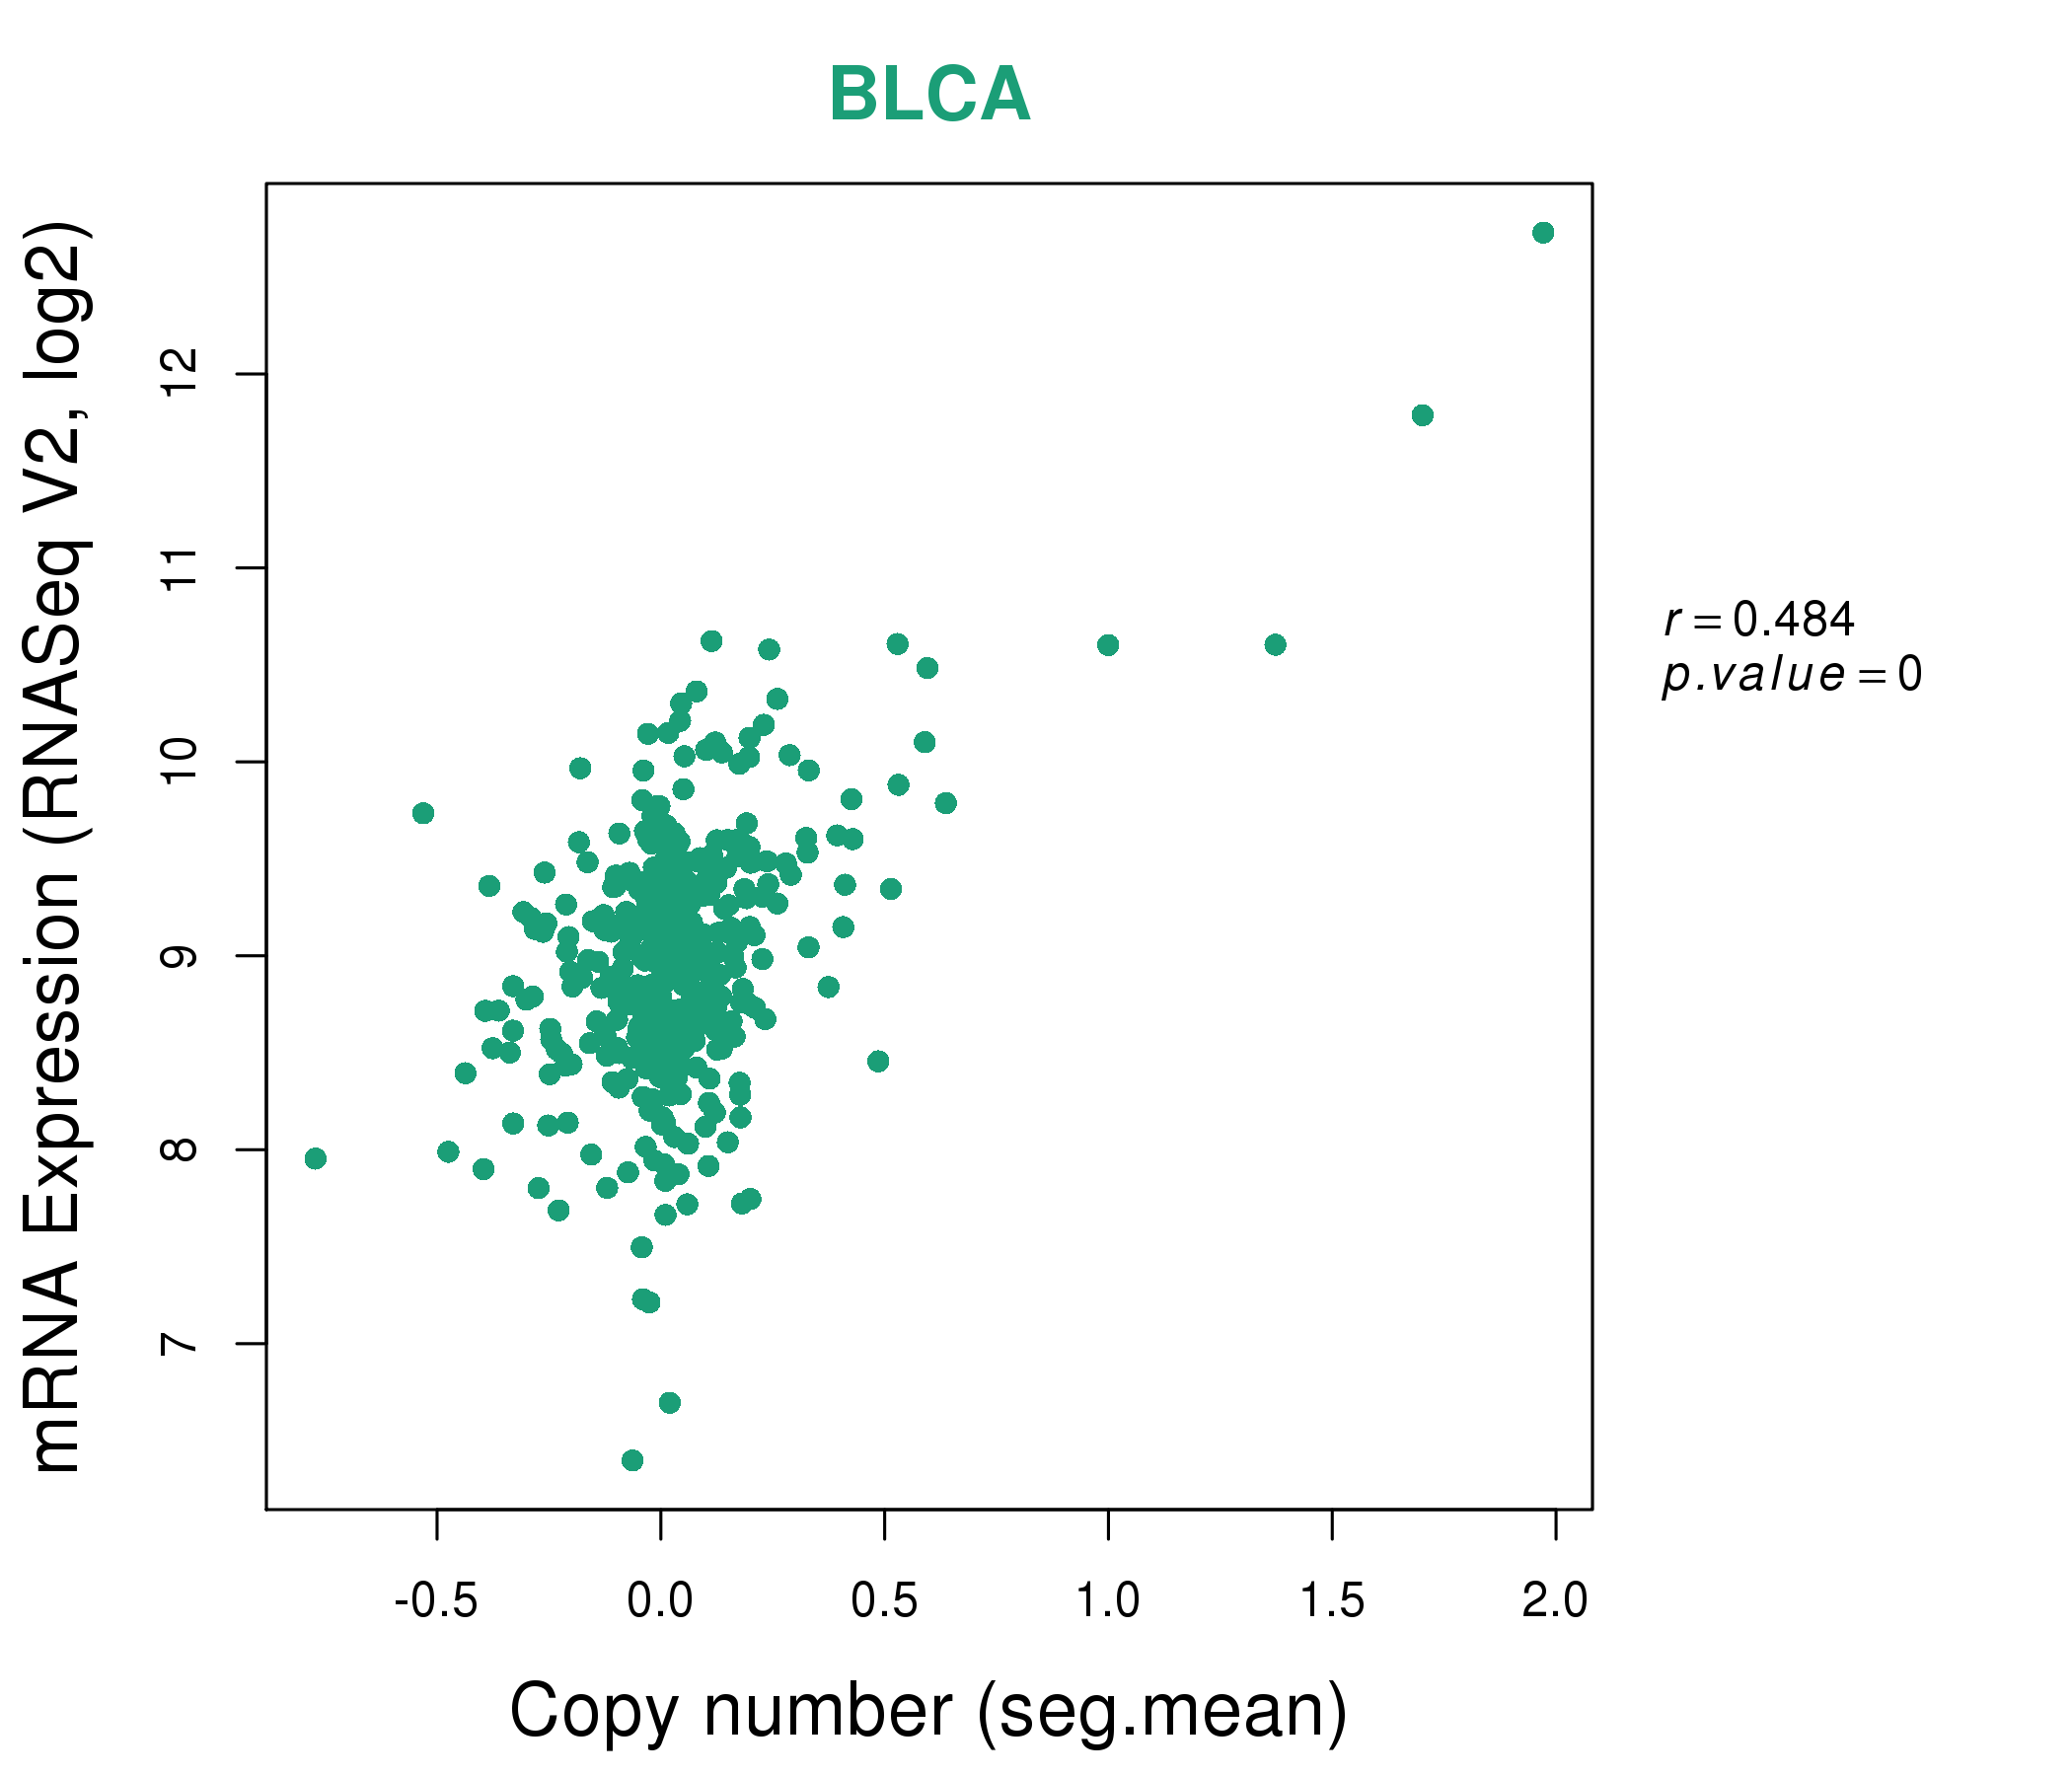
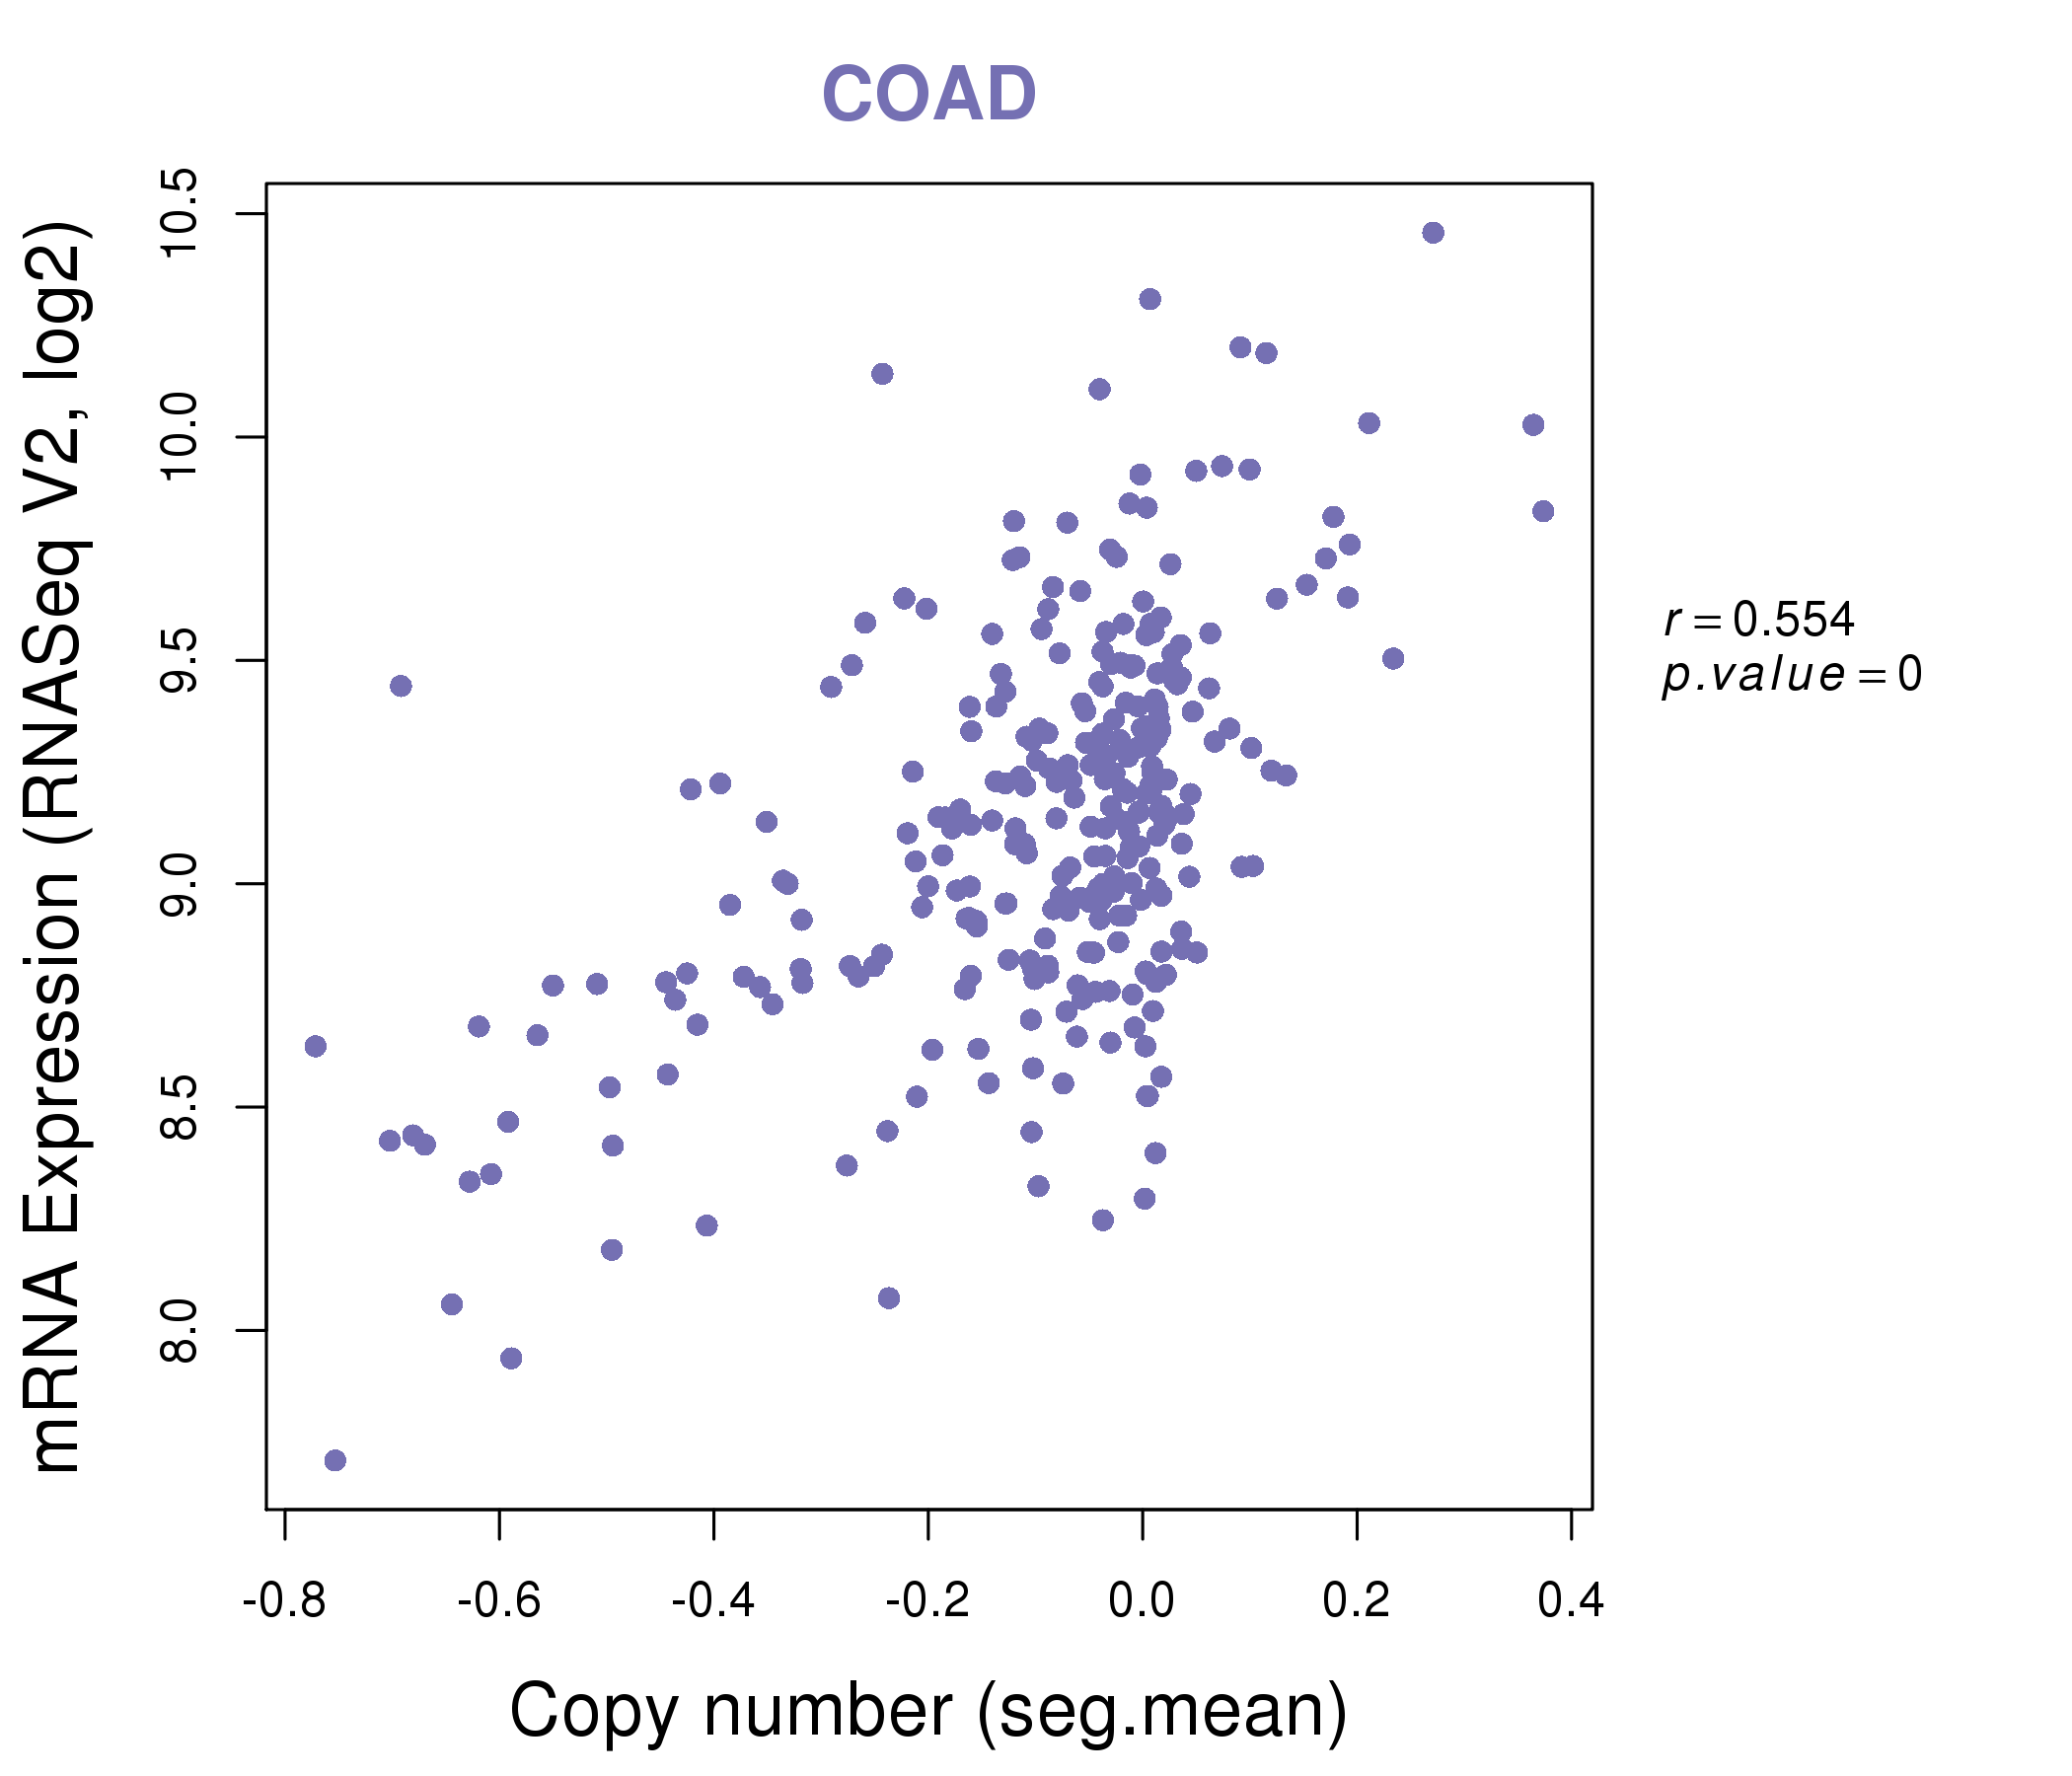
| * Copy number data were extracted from TCGA using R package TCGA-Assembler. The URLs of all public data files on TCGA DCC data server were gathered on Jan-05-2015. Function ProcessCNAData in TCGA-Assembler package was used to obtain gene-level copy number value which is calculated as the average copy number of the genomic region of a gene. |
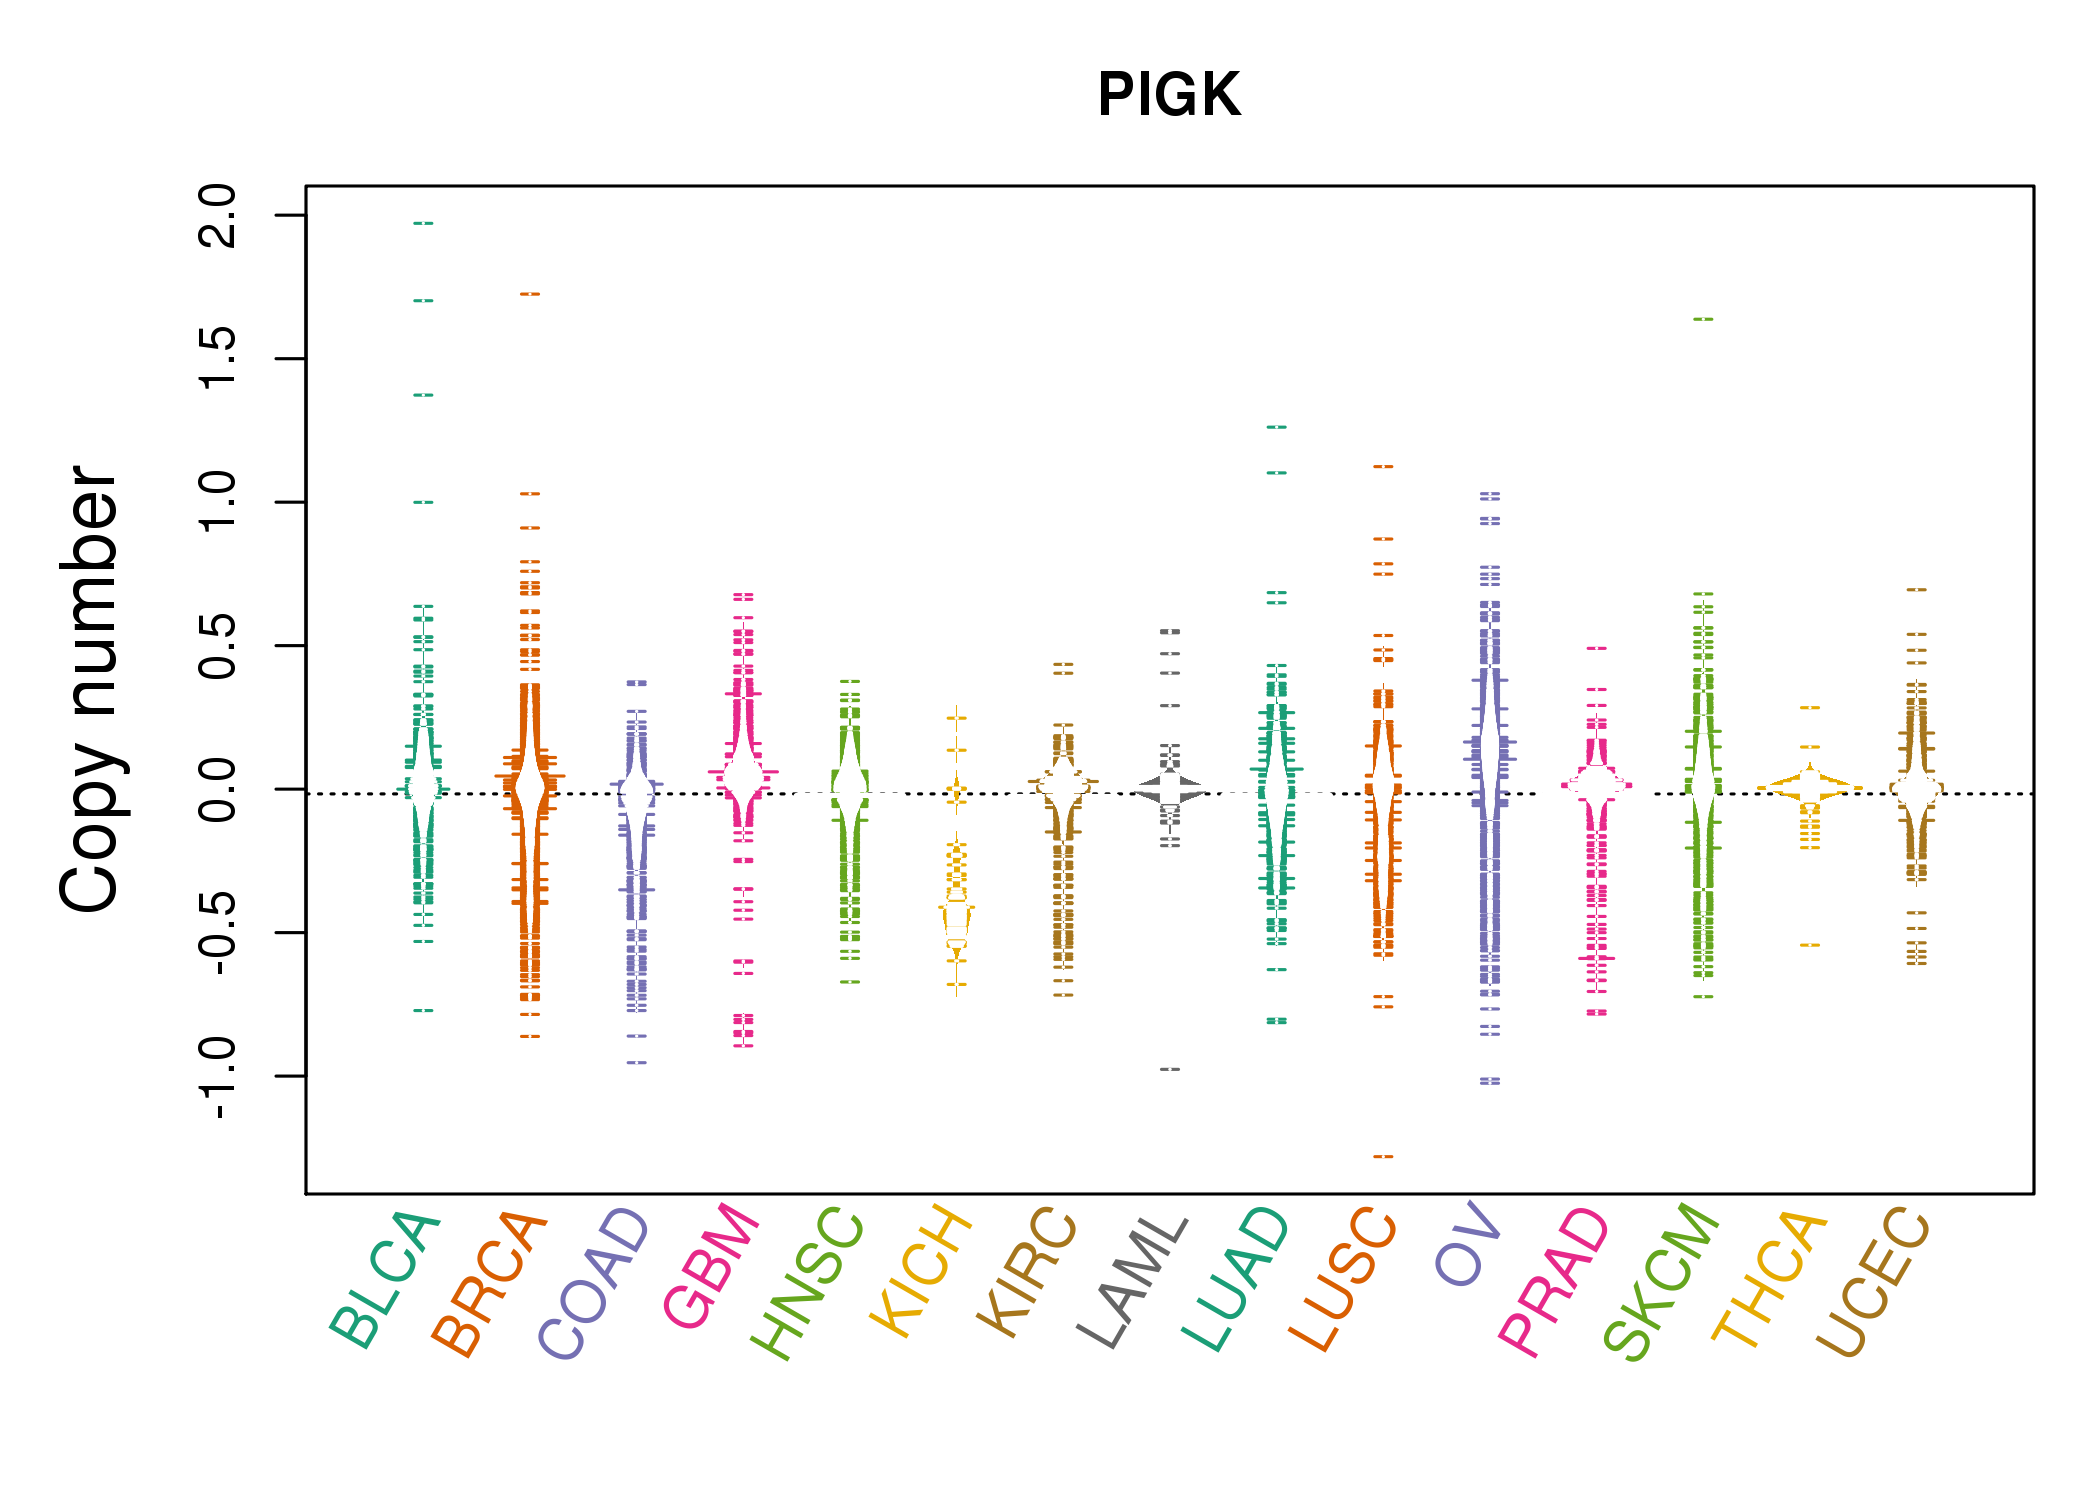 |
| cf) Tissue ID[Tissue type]: BLCA[Bladder Urothelial Carcinoma], BRCA[Breast invasive carcinoma], CESC[Cervical squamous cell carcinoma and endocervical adenocarcinoma], COAD[Colon adenocarcinoma], GBM[Glioblastoma multiforme], Glioma Low Grade, HNSC[Head and Neck squamous cell carcinoma], KICH[Kidney Chromophobe], KIRC[Kidney renal clear cell carcinoma], KIRP[Kidney renal papillary cell carcinoma], LAML[Acute Myeloid Leukemia], LUAD[Lung adenocarcinoma], LUSC[Lung squamous cell carcinoma], OV[Ovarian serous cystadenocarcinoma ], PAAD[Pancreatic adenocarcinoma], PRAD[Prostate adenocarcinoma], SKCM[Skin Cutaneous Melanoma], STAD[Stomach adenocarcinoma], THCA[Thyroid carcinoma], UCEC[Uterine Corpus Endometrial Carcinoma] |
| Top |
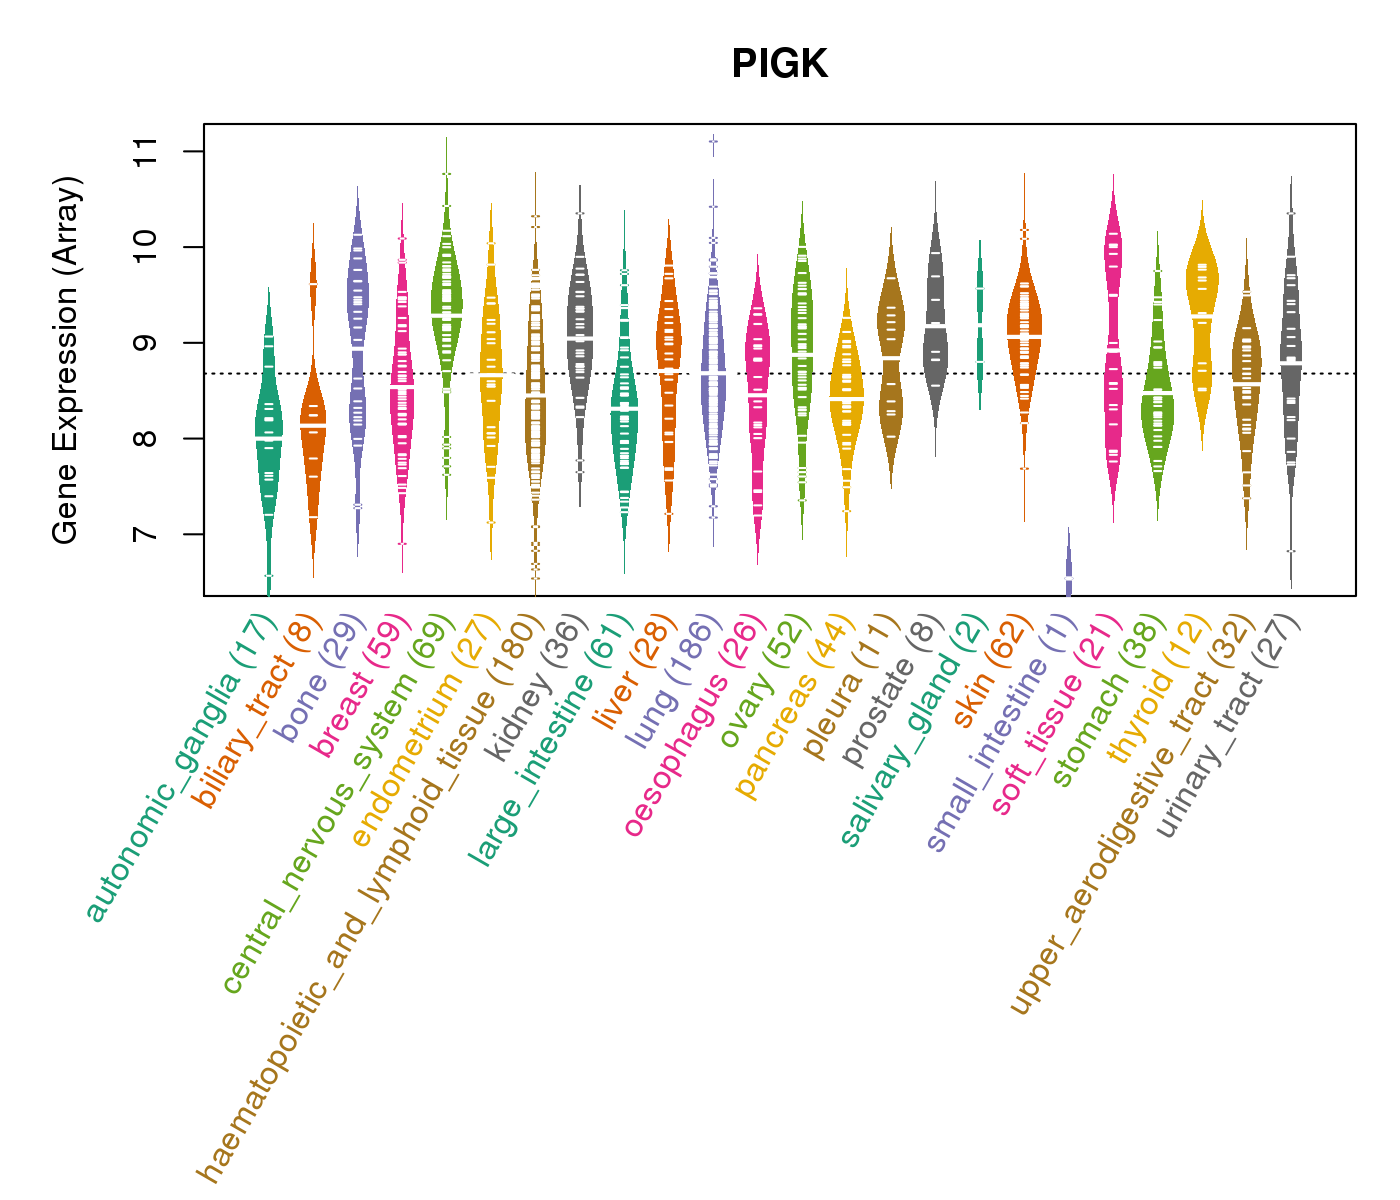
| Gene Expression for PIGK |
| * CCLE gene expression data were extracted from CCLE_Expression_Entrez_2012-10-18.res: Gene-centric RMA-normalized mRNA expression data. |
 |
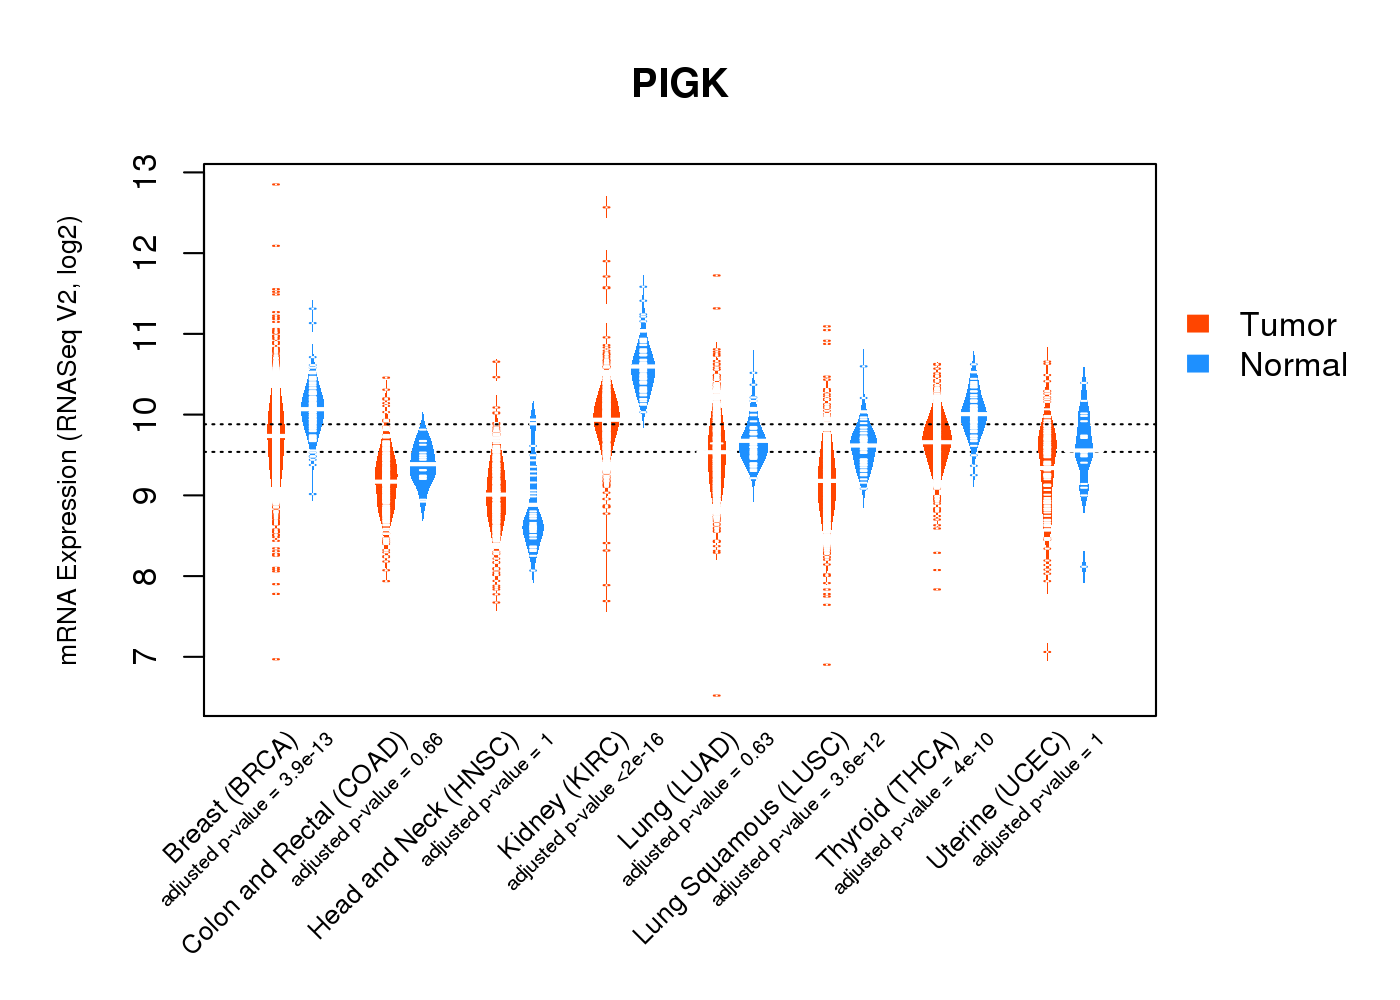
| * Normalized gene expression data of RNASeqV2 was extracted from TCGA using R package TCGA-Assembler. The URLs of all public data files on TCGA DCC data server were gathered at Jan-05-2015. Only eight cancer types have enough normal control samples for differential expression analysis. (t test, adjusted p<0.05 (using Benjamini-Hochberg FDR)) |
 |
| Top |
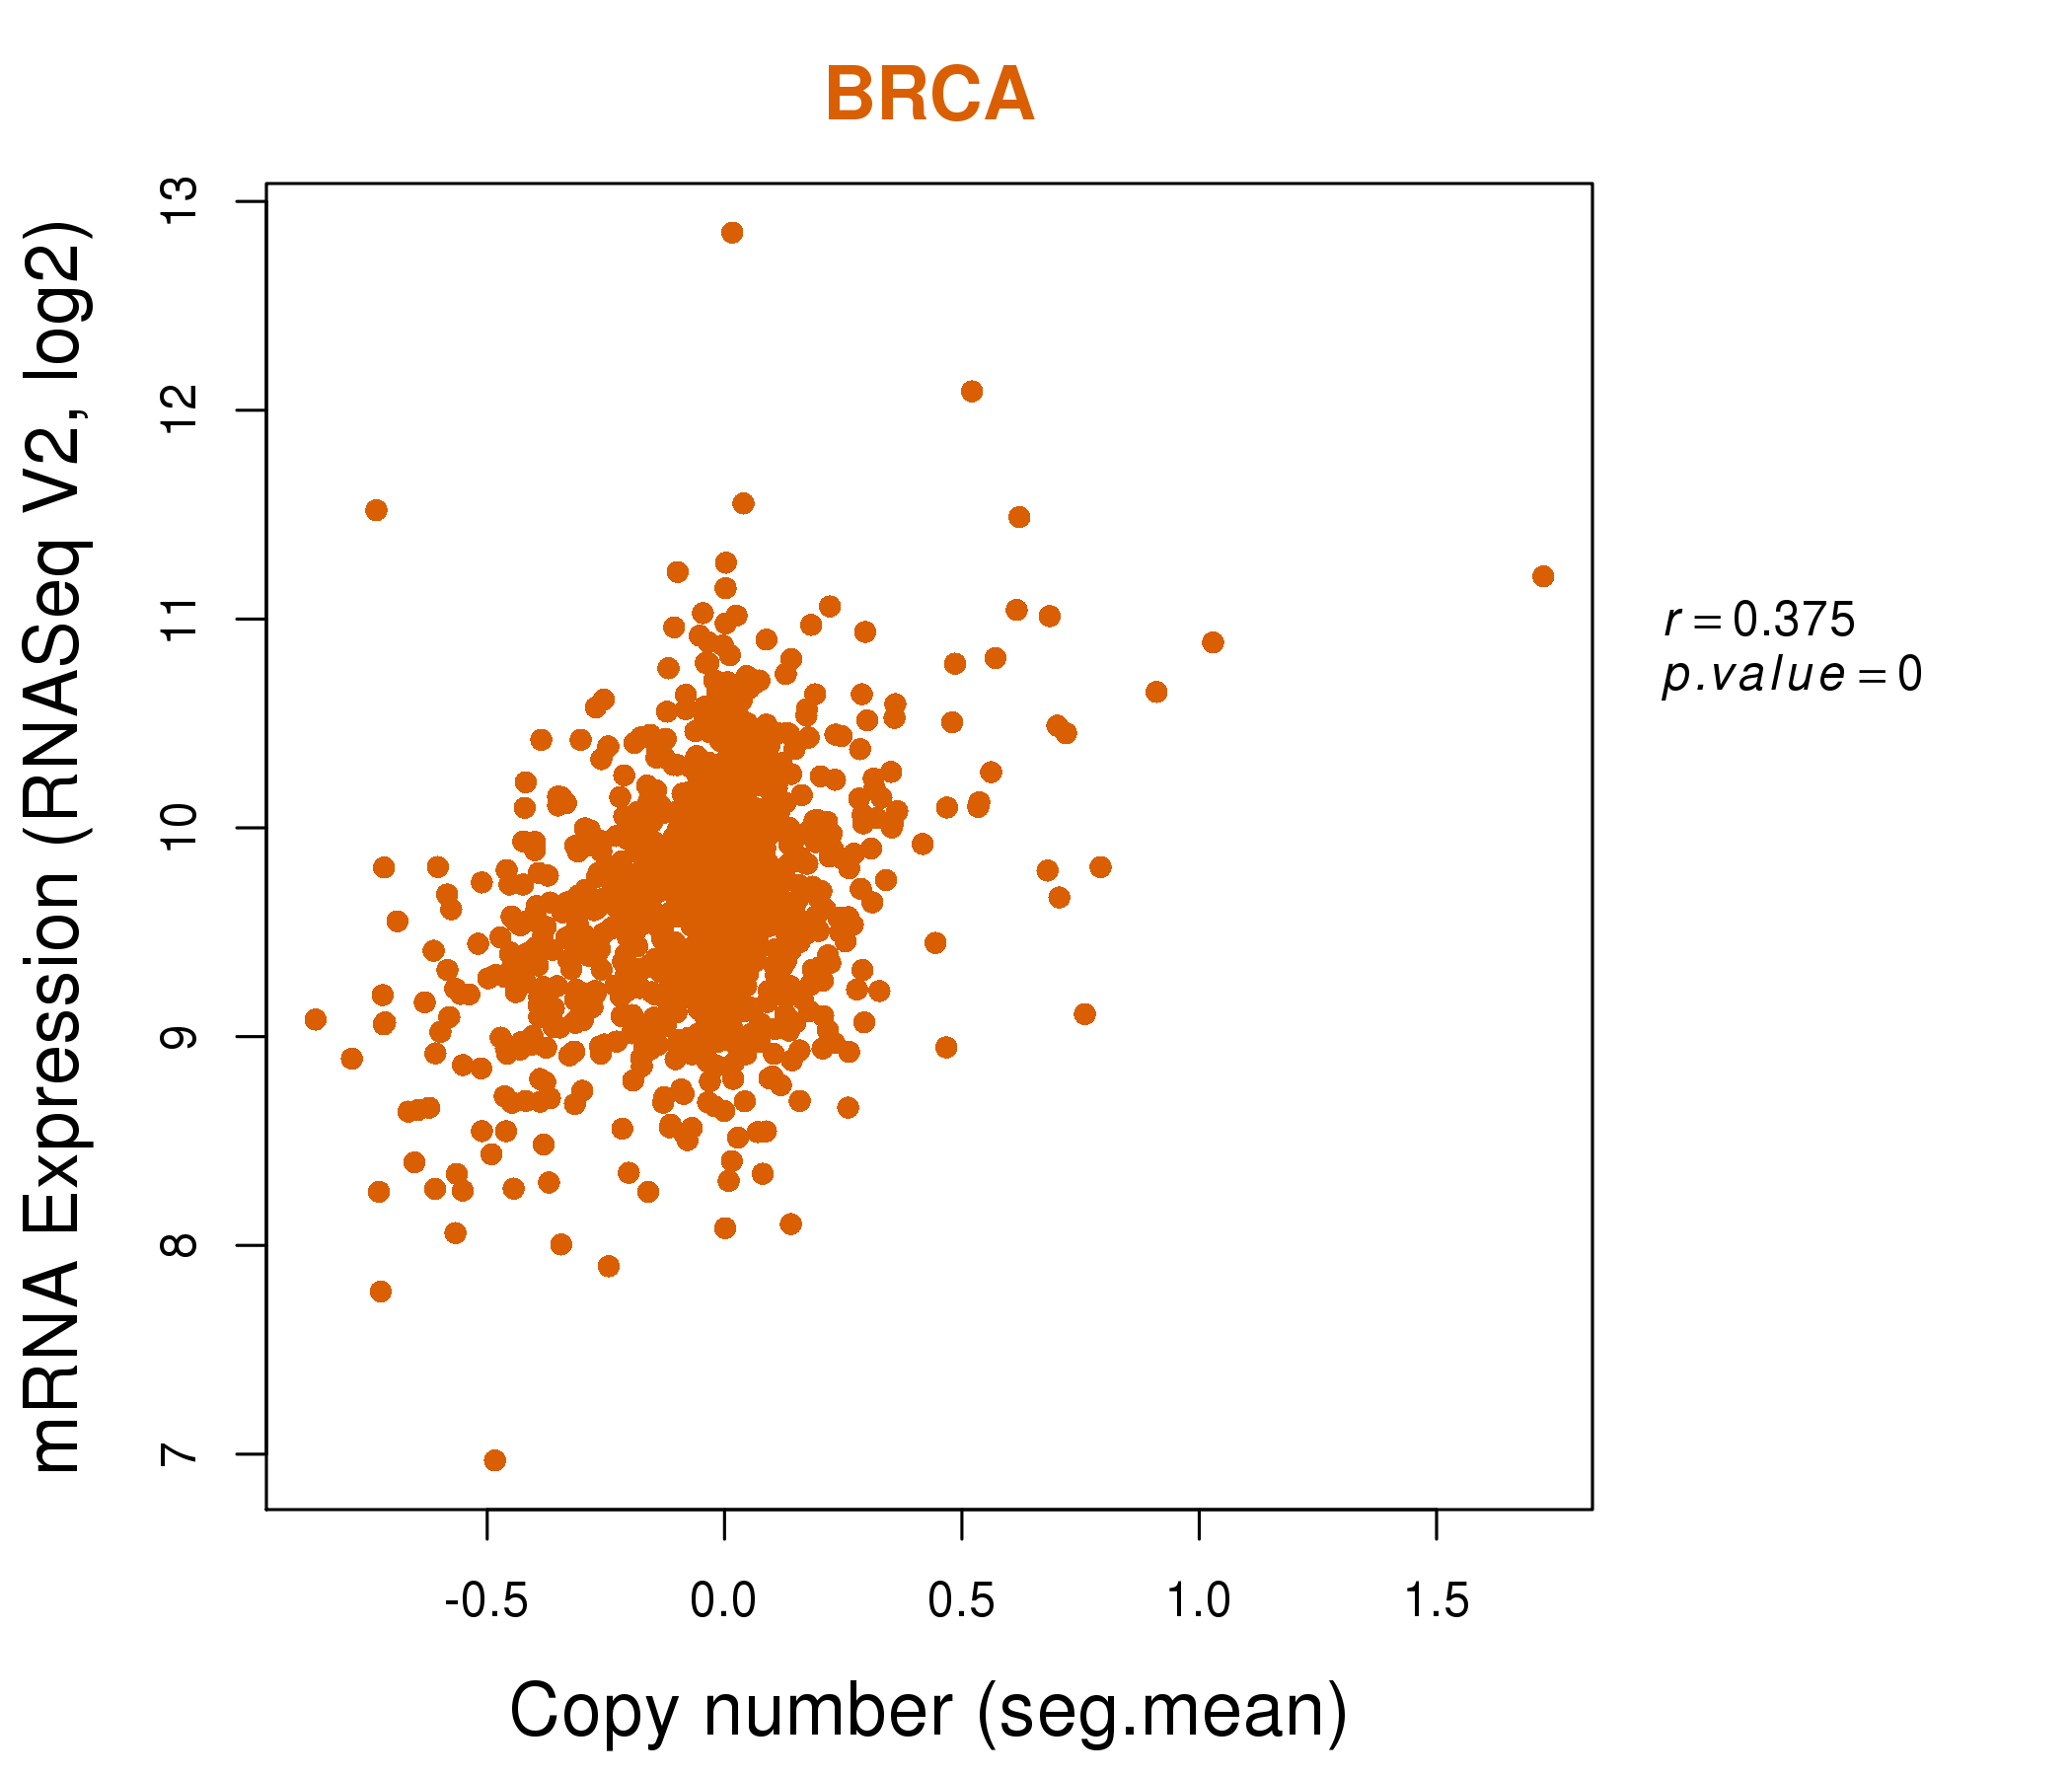
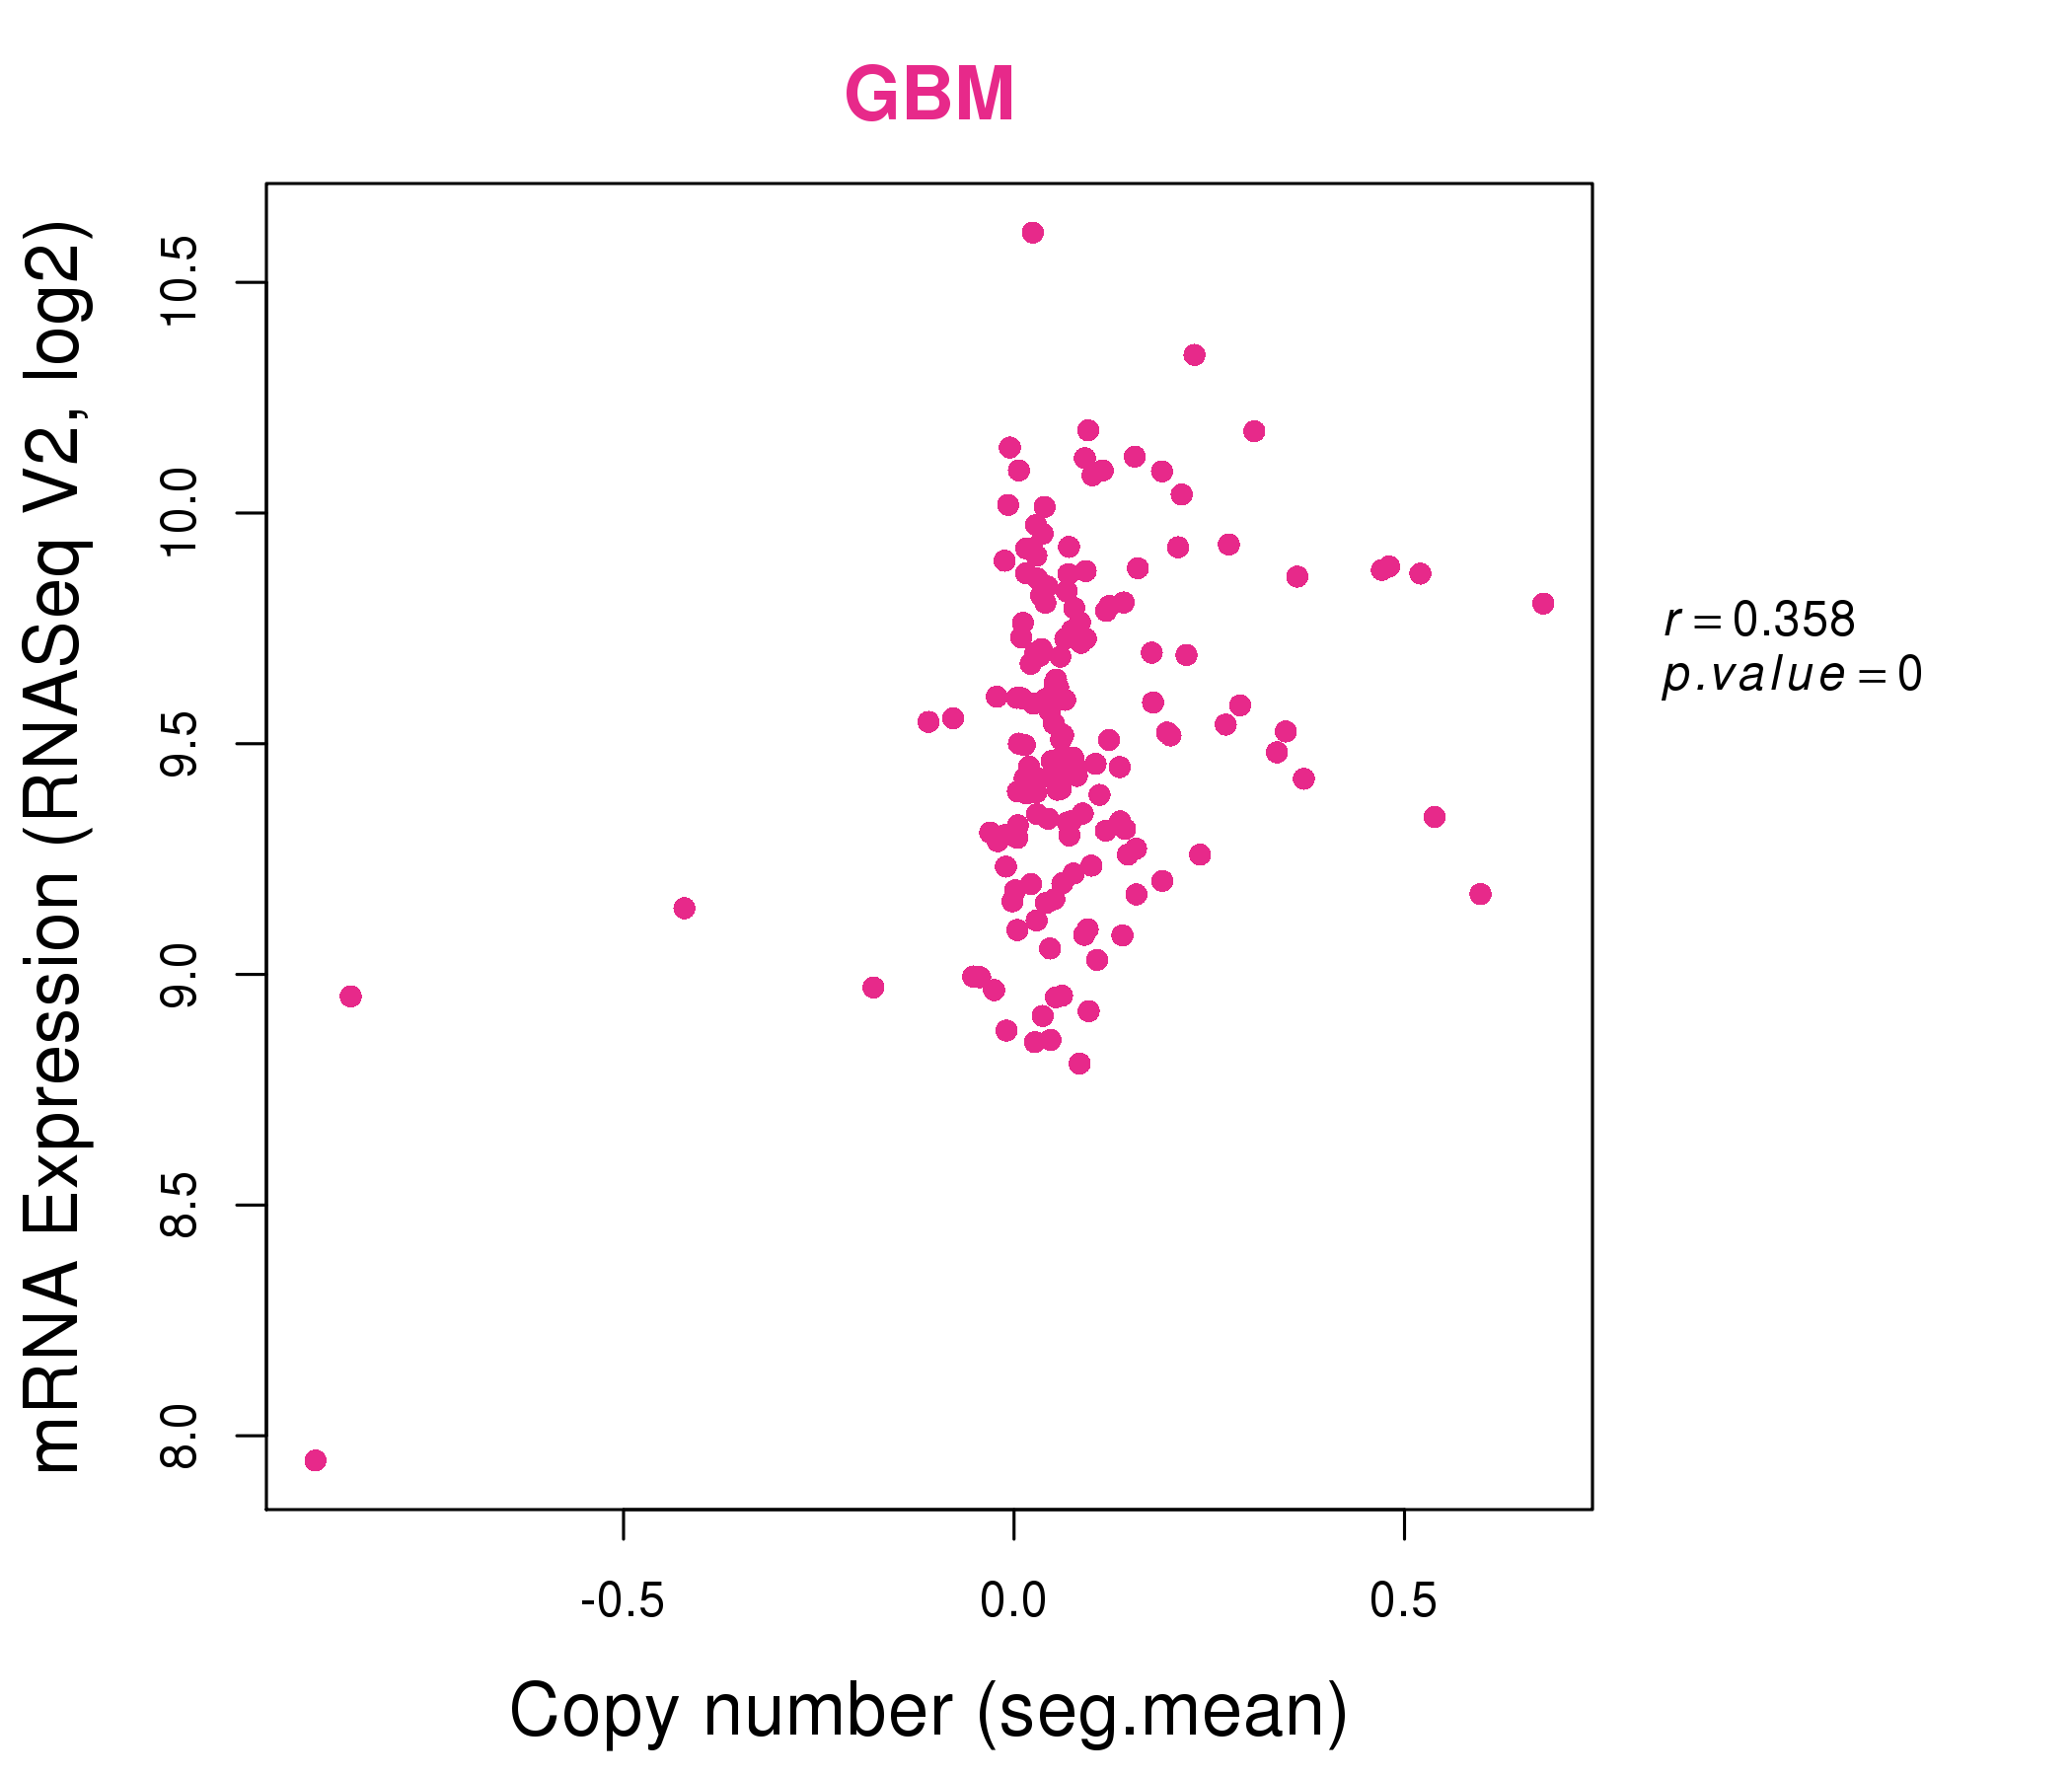
| * This plots show the correlation between CNV and gene expression. |
: Open all plots for all cancer types
 |
|
 |
|
| Top |
| Gene-Gene Network Information |
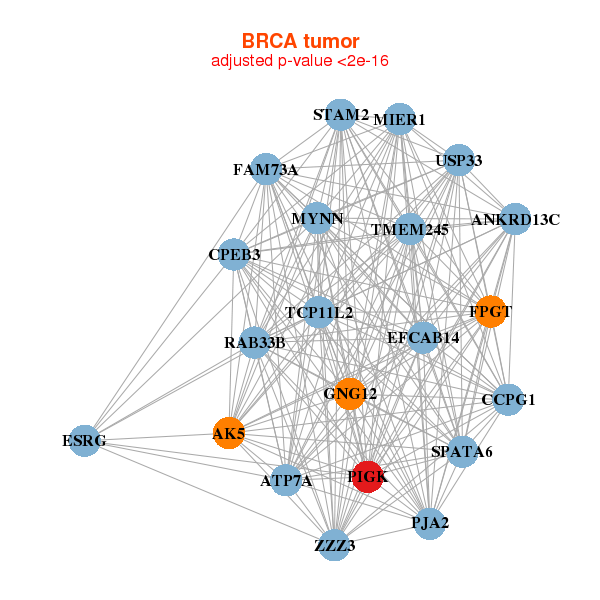
| * Co-Expression network figures were drawn using R package igraph. Only the top 20 genes with the highest correlations were shown. Red circle: input gene, orange circle: cell metabolism gene, sky circle: other gene |
: Open all plots for all cancer types
 |
|
| AK5,ANKRD13C,ATP7A,TMEM245,CCPG1,CPEB3,FAM73A, FPGT,GNG12,ESRG,EFCAB14,MIER1,MYNN,PIGK, PJA2,RAB33B,SPATA6,STAM2,TCP11L2,USP33,ZZZ3 | CASC4,CTSO,ERLEC1,FAM3C,HIAT1,LAMP2,MIER1, PIGK,RAB11A,RAB14,SCOC,SELT,SPTLC1,TM9SF3, TMED7,TMX1,TRAM1,TWF1,TWSG1,UBLCP1,ZMPSTE24 |
 |
|
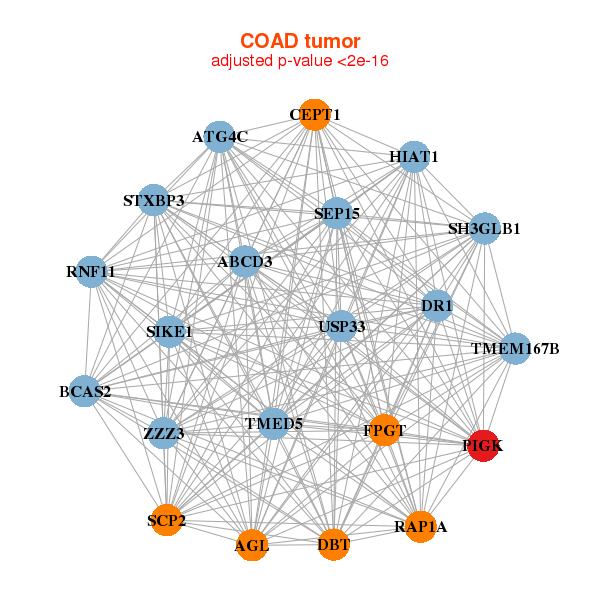
| ABCD3,AGL,ATG4C,BCAS2,CEPT1,DBT,DR1, FPGT,HIAT1,PIGK,RAP1A,RNF11,SCP2,SEP15, SH3GLB1,SIKE1,STXBP3,TMED5,TMEM167B,USP33,ZZZ3 | TMEM237,NADK2,CDC73,COPS8,CWC27,DARS,DYNC1LI1, HIAT1,KIAA1586,NBN,PIGK,PRTFDC1,RAB28,RPAP3, RPRD1A,SMARCE1,SSB,STYX,SYPL1,UTP11L,YBX1 |
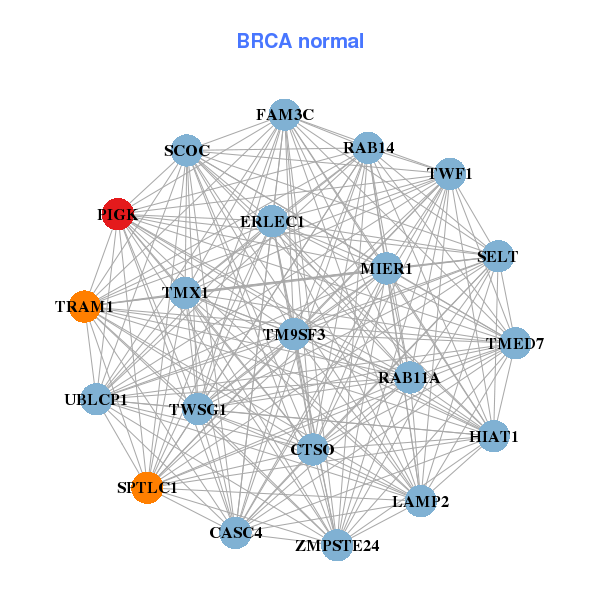
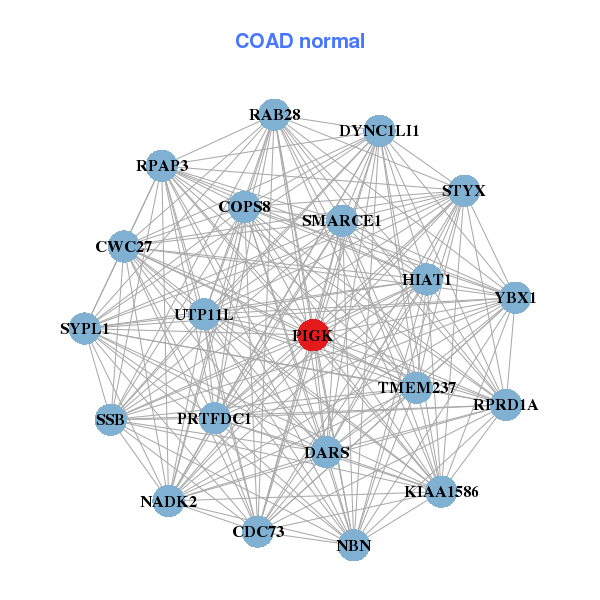
| * Co-Expression network figures were drawn using R package igraph. Only the top 20 genes with the highest correlations were shown. Red circle: input gene, orange circle: cell metabolism gene, sky circle: other gene |
: Open all plots for all cancer types
| Top |
: Open all interacting genes' information including KEGG pathway for all interacting genes from DAVID
| Top |
| Pharmacological Information for PIGK |
| There's no related Drug. |
| Top |
| Cross referenced IDs for PIGK |
| * We obtained these cross-references from Uniprot database. It covers 150 different DBs, 18 categories. http://www.uniprot.org/help/cross_references_section |
: Open all cross reference information
|
Copyright © 2016-Present - The Univsersity of Texas Health Science Center at Houston @ |