|
||||||||||||||||||||||||||||||||||||||||||||||||||||||||||||||||||||||||||||||||||||||||||||||||||||||||||||||||||||||||||||||||||||||||||||||||||||||||||||||||||||||||||||||||||||||||||||||||||||||||||||||||||||||||||||||||||||||||||||||||||||||||||||||||||||||||||||||||||||||||||||||||||||||||||||||||||||||||||
| |
| Phenotypic Information (metabolism pathway, cancer, disease, phenome) |
| |
| |
| Gene-Gene Network Information: Co-Expression Network, Interacting Genes & KEGG |
| |
|


| Gene Summary for MUC12 |
| Basic gene info. | Gene symbol | MUC12 |
| Gene name | mucin 12, cell surface associated | |
| Synonyms | MUC-11|MUC-12|MUC11 | |
| Cytomap | UCSC genome browser: 7q22 | |
| Genomic location | chr7 :100612903-100662230 | |
| Type of gene | protein-coding | |
| RefGenes | NM_001164462.1, | |
| Ensembl id | ENSG00000205277 | |
| Description | mucin 11mucin-11mucin-12 | |
| Modification date | 20141207 | |
| dbXrefs | MIM : 604609 | |
| HGNC : HGNC | ||
| Ensembl : ENSG00000205277 | ||
| Vega : OTTHUMG00000157042 | ||
| Protein | UniProt: go to UniProt's Cross Reference DB Table | |
| Expression | CleanEX: HS_MUC12 | |
| BioGPS: 10071 | ||
| Gene Expression Atlas: ENSG00000205277 | ||
| The Human Protein Atlas: ENSG00000205277 | ||
| Pathway | NCI Pathway Interaction Database: MUC12 | |
| KEGG: MUC12 | ||
| REACTOME: MUC12 | ||
| ConsensusPathDB | ||
| Pathway Commons: MUC12 | ||
| Metabolism | MetaCyc: MUC12 | |
| HUMANCyc: MUC12 | ||
| Regulation | Ensembl's Regulation: ENSG00000205277 | |
| miRBase: chr7 :100,612,903-100,662,230 | ||
| TargetScan: NM_001164462 | ||
| cisRED: ENSG00000205277 | ||
| Context | iHOP: MUC12 | |
| cancer metabolism search in PubMed: MUC12 | ||
| UCL Cancer Institute: MUC12 | ||
| Assigned class in ccmGDB | C | |
| Top |
| Phenotypic Information for MUC12(metabolism pathway, cancer, disease, phenome) |
| Cancer | CGAP: MUC12 |
| Familial Cancer Database: MUC12 | |
| * This gene is included in those cancer gene databases. |
|
|
|
|
|
| . | ||||||||||||||||||||||||||||||||||||||||||||||||||||||||||||||||||||||||||||||||||||||||||||||||||||||||||||||||||||||||||||||||||||||||||||||||||||||||||||||||||||||||||||||||||||||||||||||||||||||||||||||||||||||||||||||||||||||||||||||||||||||||||||||||||||||||||||||||||||||||||||||||||||||||||||||||||||
Oncogene 1 | Significant driver gene in | |||||||||||||||||||||||||||||||||||||||||||||||||||||||||||||||||||||||||||||||||||||||||||||||||||||||||||||||||||||||||||||||||||||||||||||||||||||||||||||||||||||||||||||||||||||||||||||||||||||||||||||||||||||||||||||||||||||||||||||||||||||||||||||||||||||||||||||||||||||||||||||||||||||||||||||||||||||||||
| cf) number; DB name 1 Oncogene; http://nar.oxfordjournals.org/content/35/suppl_1/D721.long, 2 Tumor Suppressor gene; https://bioinfo.uth.edu/TSGene/, 3 Cancer Gene Census; http://www.nature.com/nrc/journal/v4/n3/abs/nrc1299.html, 4 CancerGenes; http://nar.oxfordjournals.org/content/35/suppl_1/D721.long, 5 Network of Cancer Gene; http://ncg.kcl.ac.uk/index.php, 1Therapeutic Vulnerabilities in Cancer; http://cbio.mskcc.org/cancergenomics/statius/ |
| REACTOME_METABOLISM_OF_PROTEINS | |
| OMIM | |
| Orphanet | |
| Disease | KEGG Disease: MUC12 |
| MedGen: MUC12 (Human Medical Genetics with Condition) | |
| ClinVar: MUC12 | |
| Phenotype | MGI: MUC12 (International Mouse Phenotyping Consortium) |
| PhenomicDB: MUC12 | |
| Mutations for MUC12 |
| * Under tables are showing count per each tissue to give us broad intuition about tissue specific mutation patterns.You can go to the detailed page for each mutation database's web site. |
| - Statistics for Tissue and Mutation type | Top |
 |
| - For Inter-chromosomal Variations |
| There's no inter-chromosomal structural variation. |
| - For Intra-chromosomal Variations |
| There's no intra-chromosomal structural variation. |
| Sample | Symbol_a | Chr_a | Start_a | End_a | Symbol_b | Chr_b | Start_b | End_b |
| pancreas | MUC12 | chr7 | 100619868 | 100619888 | MUC12 | chr7 | 100624110 | 100624130 |
| pancreas | MUC12 | chr7 | 100636305 | 100636505 | MUC12 | chr7 | 100646425 | 100646625 |
| cf) Tissue number; Tissue name (1;Breast, 2;Central_nervous_system, 3;Haematopoietic_and_lymphoid_tissue, 4;Large_intestine, 5;Liver, 6;Lung, 7;Ovary, 8;Pancreas, 9;Prostate, 10;Skin, 11;Soft_tissue, 12;Upper_aerodigestive_tract) |
| * From mRNA Sanger sequences, Chitars2.0 arranged chimeric transcripts. This table shows MUC12 related fusion information. |
| ID | Head Gene | Tail Gene | Accession | Gene_a | qStart_a | qEnd_a | Chromosome_a | tStart_a | tEnd_a | Gene_a | qStart_a | qEnd_a | Chromosome_a | tStart_a | tEnd_a |
| BG955820 | FLNB | 1 | 168 | 3 | 58112376 | 58116524 | MUC12 | 163 | 364 | 7 | 100634934 | 100635135 | |
| AW603439 | SYNE2 | 279 | 301 | 14 | 64613669 | 64613691 | MUC12 | 284 | 554 | 7 | 100657290 | 100661914 | |
| Top |
| Mutation type/ Tissue ID | brca | cns | cerv | endome | haematopo | kidn | Lintest | liver | lung | ns | ovary | pancre | prost | skin | stoma | thyro | urina | |||
| Total # sample | 1 | 1 | ||||||||||||||||||
| GAIN (# sample) | 1 | 1 | ||||||||||||||||||
| LOSS (# sample) |
| cf) Tissue ID; Tissue type (1; Breast, 2; Central_nervous_system, 3; Cervix, 4; Endometrium, 5; Haematopoietic_and_lymphoid_tissue, 6; Kidney, 7; Large_intestine, 8; Liver, 9; Lung, 10; NS, 11; Ovary, 12; Pancreas, 13; Prostate, 14; Skin, 15; Stomach, 16; Thyroid, 17; Urinary_tract) |
| Top |
|
 |
| Top |
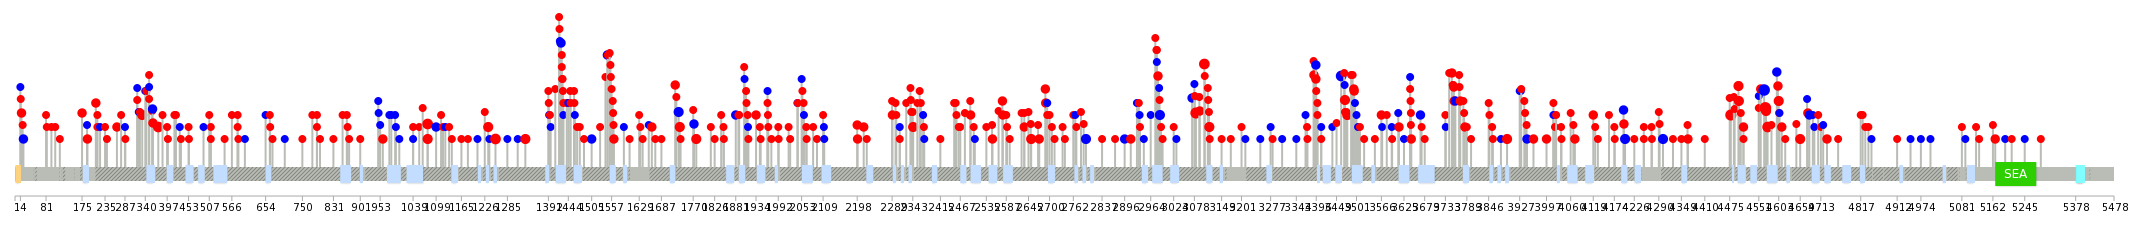
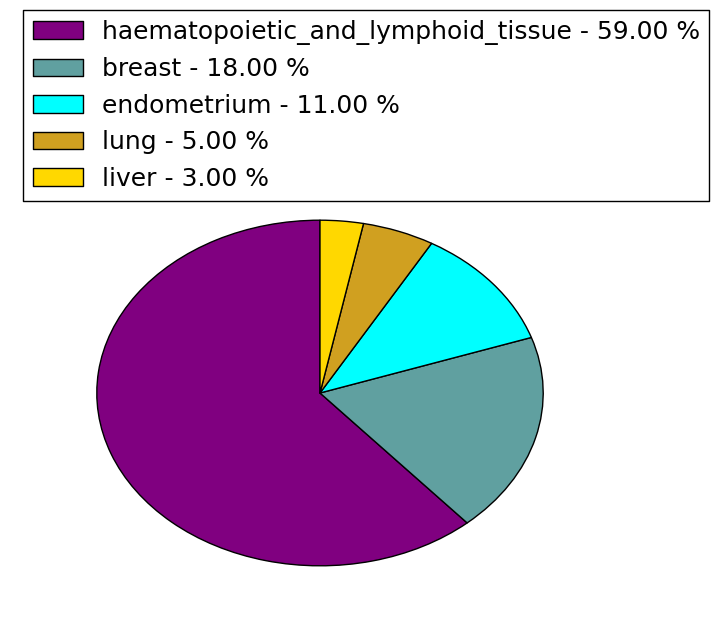
| Stat. for Non-Synonymous SNVs (# total SNVs=391) | (# total SNVs=115) |
 |  |
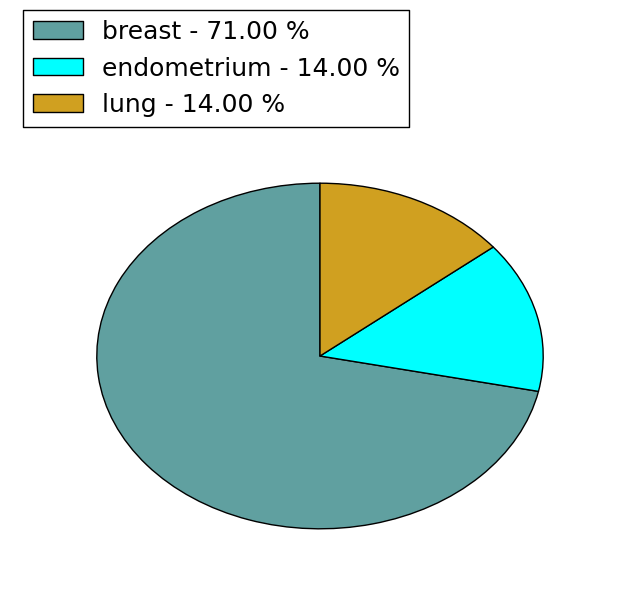
(# total SNVs=3) | (# total SNVs=7) |
 |  |
| Top |
| * When you move the cursor on each content, you can see more deailed mutation information on the Tooltip. Those are primary_site,primary_histology,mutation(aa),pubmedID. |
| GRCh37 position | Mutation(aa) | Unique sampleID count |
| chr7:100647548-100647548 | p.L4568F | 7 |
| chr7:100647539-100647539 | p.S4565S | 6 |
| chr7:100643088-100643088 | p.I3082V | 5 |
| chr7:100647276-100647276 | p.P4478T | 5 |
| chr7:100612955-100612956 | p.T18_T19insA | 5 |
| chr7:100647565-100647565 | p.S4574L | 4 |
| chr7:100644227-100644227 | p.E3461E | 4 |
| chr7:100637074-100637074 | p.R1077H | 4 |
| chr7:100643155-100643155 | p.K3104I | 4 |
| chr7:100637605-100637605 | p.K1254T | 4 |
| Top |
|
 |
| Point Mutation/ Tissue ID | 1 | 2 | 3 | 4 | 5 | 6 | 7 | 8 | 9 | 10 | 11 | 12 | 13 | 14 | 15 | 16 | 17 | 18 | 19 | 20 |
| # sample | 13 | 2 | 1 | 20 | ||||||||||||||||
| # mutation | 14 | 3 | 1 | 40 | ||||||||||||||||
| nonsynonymous SNV | 12 | 3 | 1 | 27 | ||||||||||||||||
| synonymous SNV | 2 | 13 |
| cf) Tissue ID; Tissue type (1; BLCA[Bladder Urothelial Carcinoma], 2; BRCA[Breast invasive carcinoma], 3; CESC[Cervical squamous cell carcinoma and endocervical adenocarcinoma], 4; COAD[Colon adenocarcinoma], 5; GBM[Glioblastoma multiforme], 6; Glioma Low Grade, 7; HNSC[Head and Neck squamous cell carcinoma], 8; KICH[Kidney Chromophobe], 9; KIRC[Kidney renal clear cell carcinoma], 10; KIRP[Kidney renal papillary cell carcinoma], 11; LAML[Acute Myeloid Leukemia], 12; LUAD[Lung adenocarcinoma], 13; LUSC[Lung squamous cell carcinoma], 14; OV[Ovarian serous cystadenocarcinoma ], 15; PAAD[Pancreatic adenocarcinoma], 16; PRAD[Prostate adenocarcinoma], 17; SKCM[Skin Cutaneous Melanoma], 18:STAD[Stomach adenocarcinoma], 19:THCA[Thyroid carcinoma], 20:UCEC[Uterine Corpus Endometrial Carcinoma]) |
| Top |
| * We represented just top 10 SNVs. When you move the cursor on each content, you can see more deailed mutation information on the Tooltip. Those are primary_site, primary_histology, mutation(aa), pubmedID. |
| Genomic Position | Mutation(aa) | Unique sampleID count |
| chr7:100634368 | p.T175M | 2 |
| chr7:100646595 | p.P4251S | 2 |
| chr7:100635320 | p.S358Y | 1 |
| chr7:100648570 | p.S1604Y | 1 |
| chr7:100639291 | p.R4679H | 1 |
| chr7:100634547 | p.E385K | 1 |
| chr7:100646890 | p.S1632Y | 1 |
| chr7:100635483 | p.G4706C | 1 |
| chr7:100648579 | p.K397E | 1 |
| chr7:100639899 | p.S1816F | 1 |
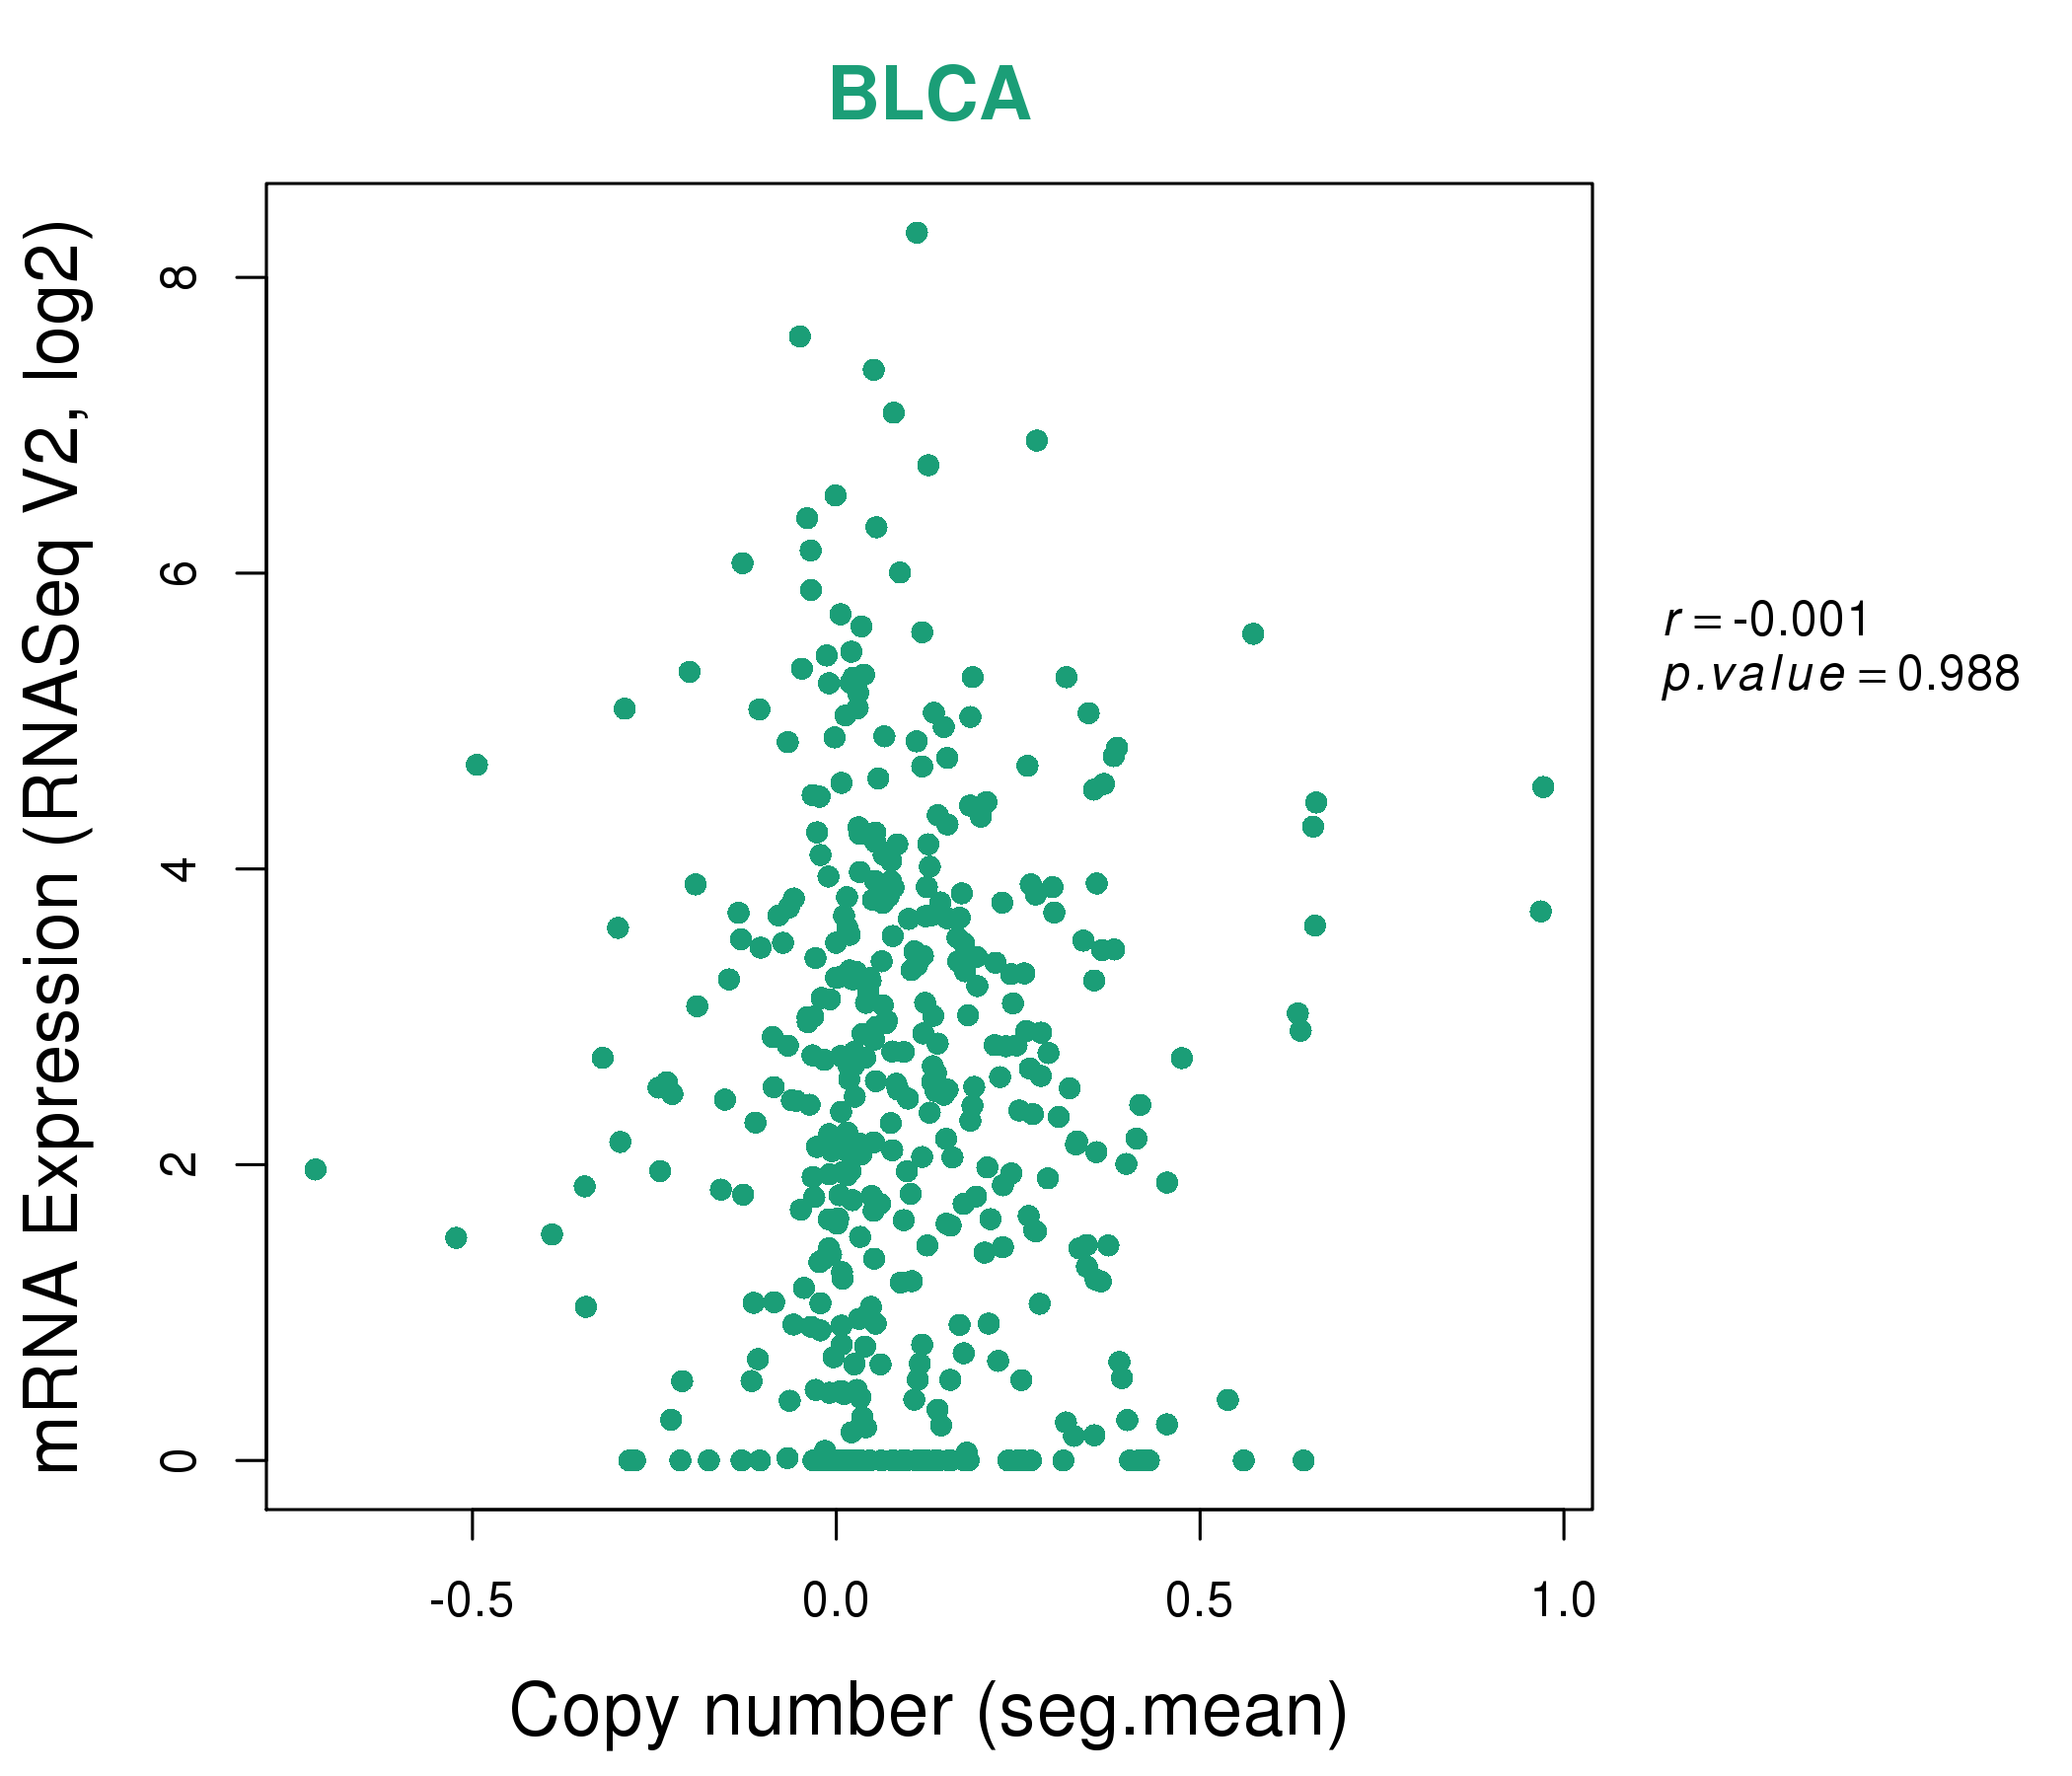
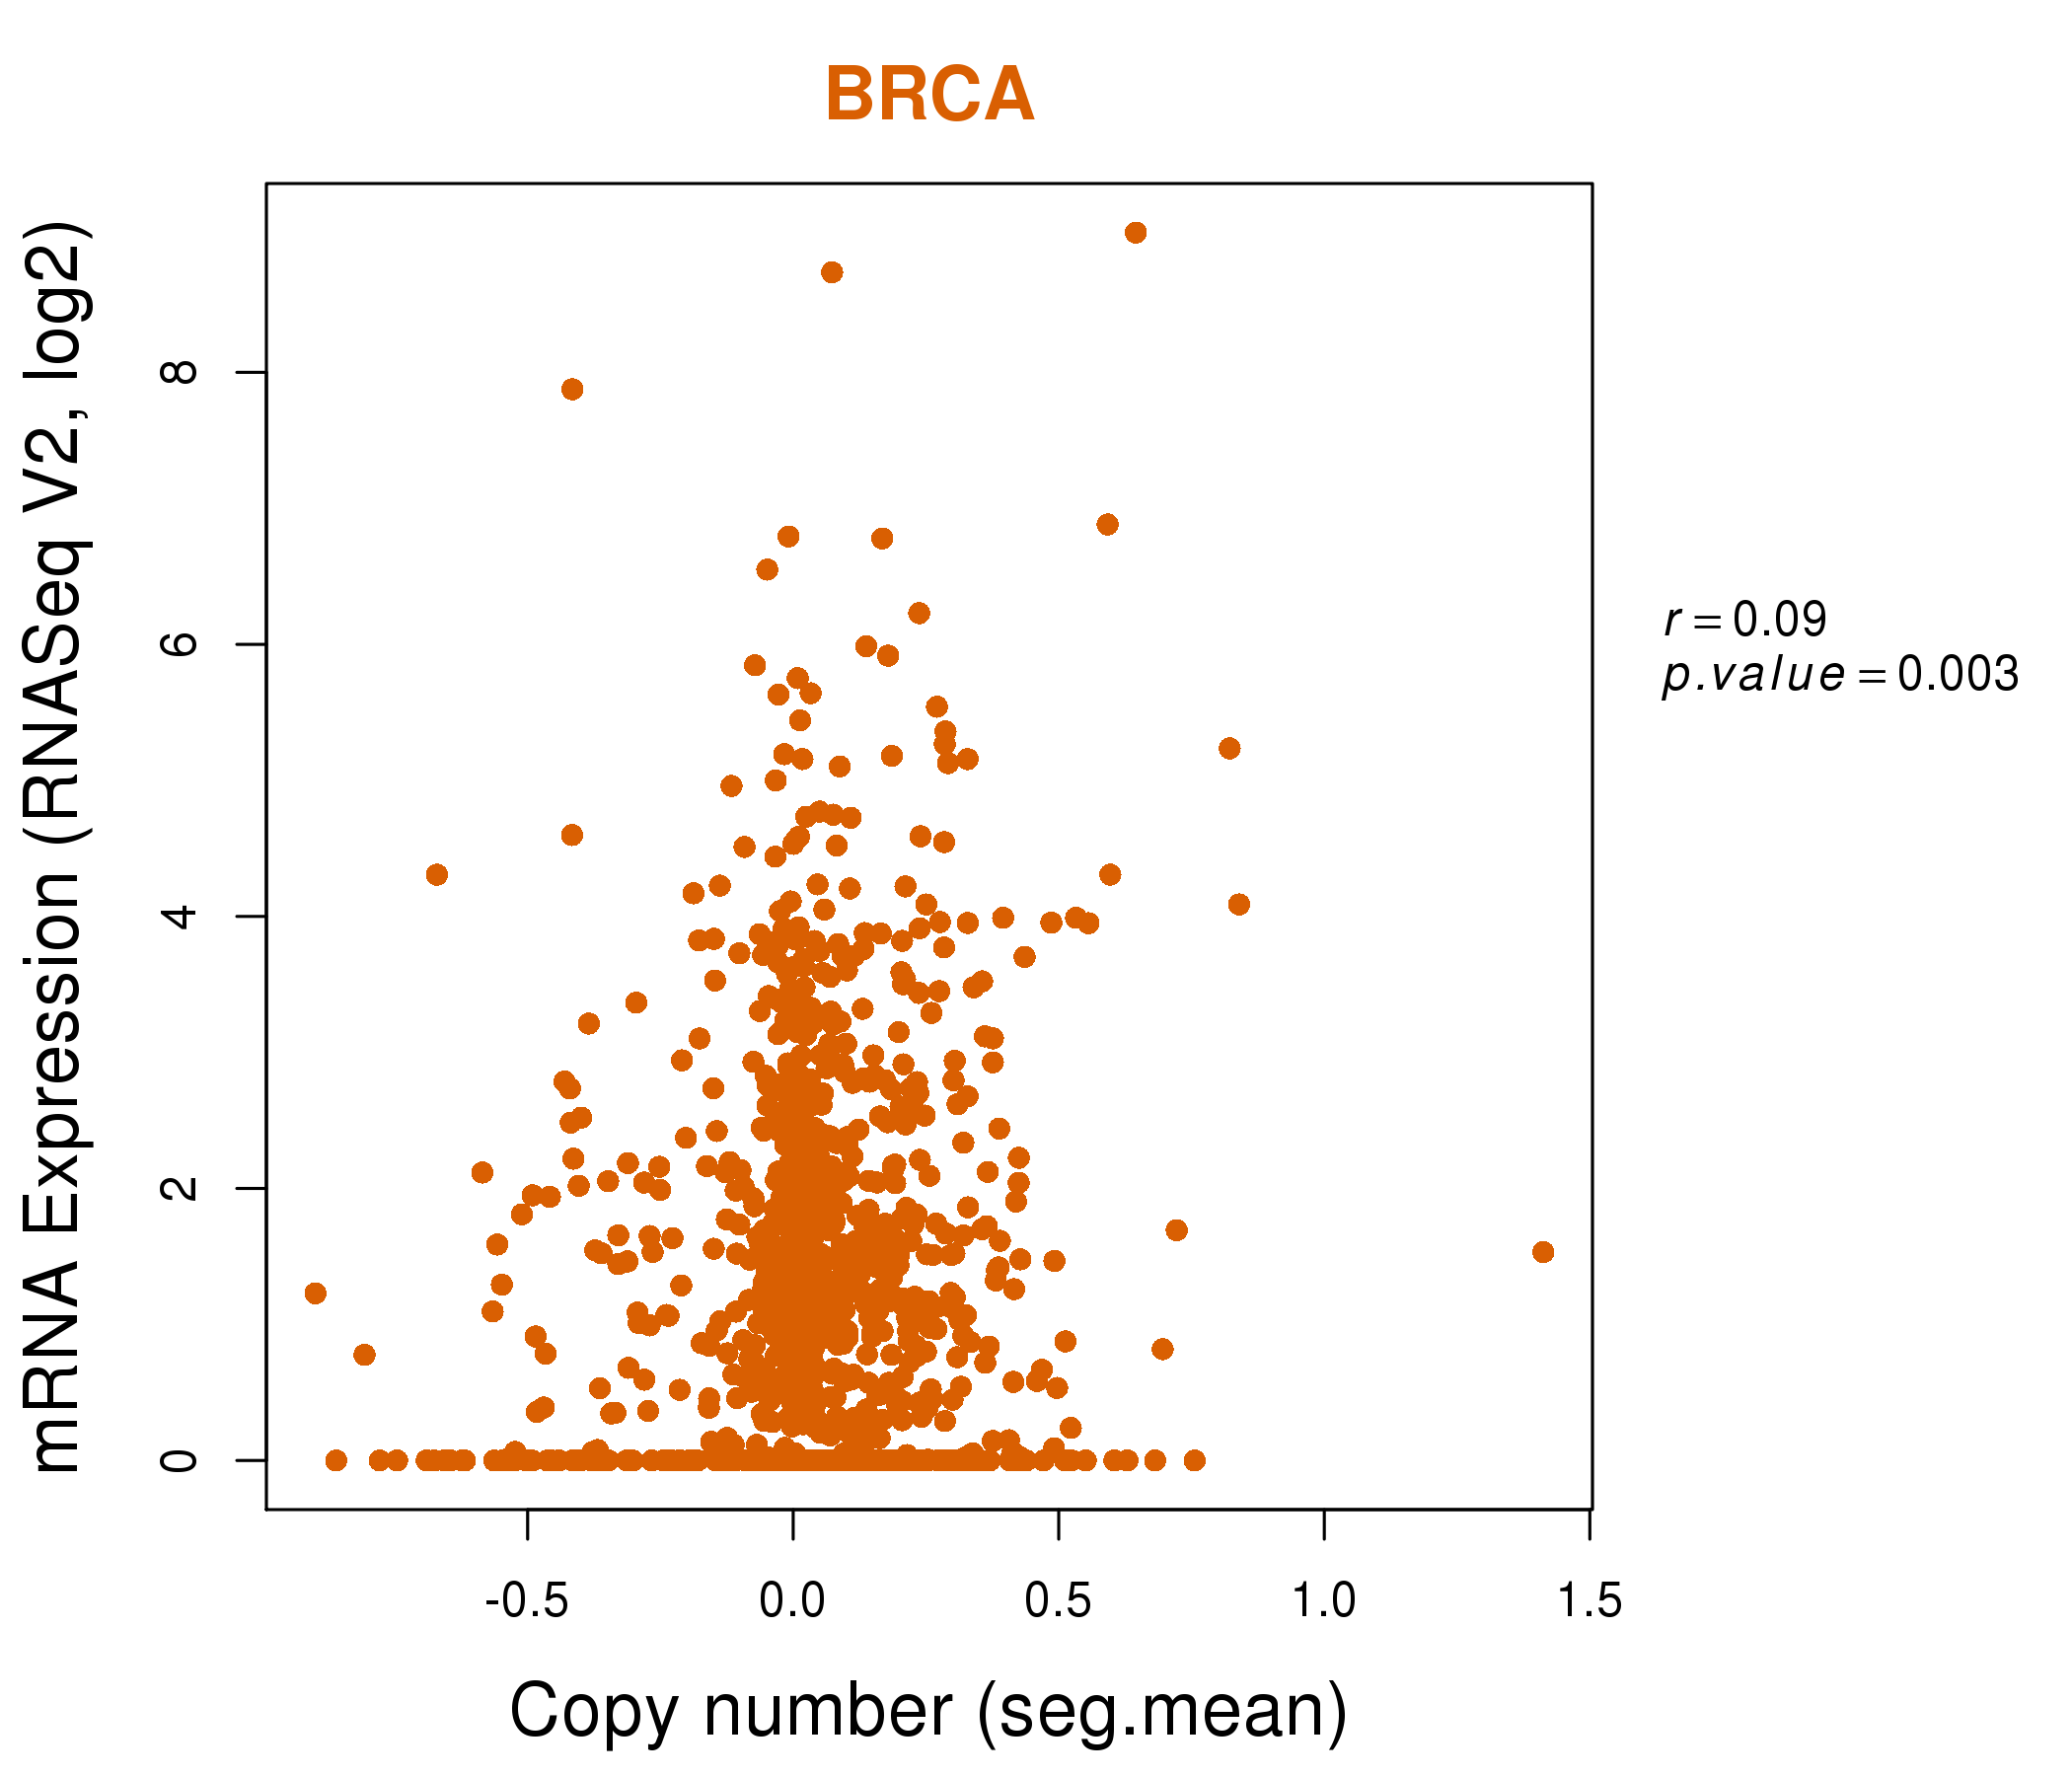
| * Copy number data were extracted from TCGA using R package TCGA-Assembler. The URLs of all public data files on TCGA DCC data server were gathered on Jan-05-2015. Function ProcessCNAData in TCGA-Assembler package was used to obtain gene-level copy number value which is calculated as the average copy number of the genomic region of a gene. |
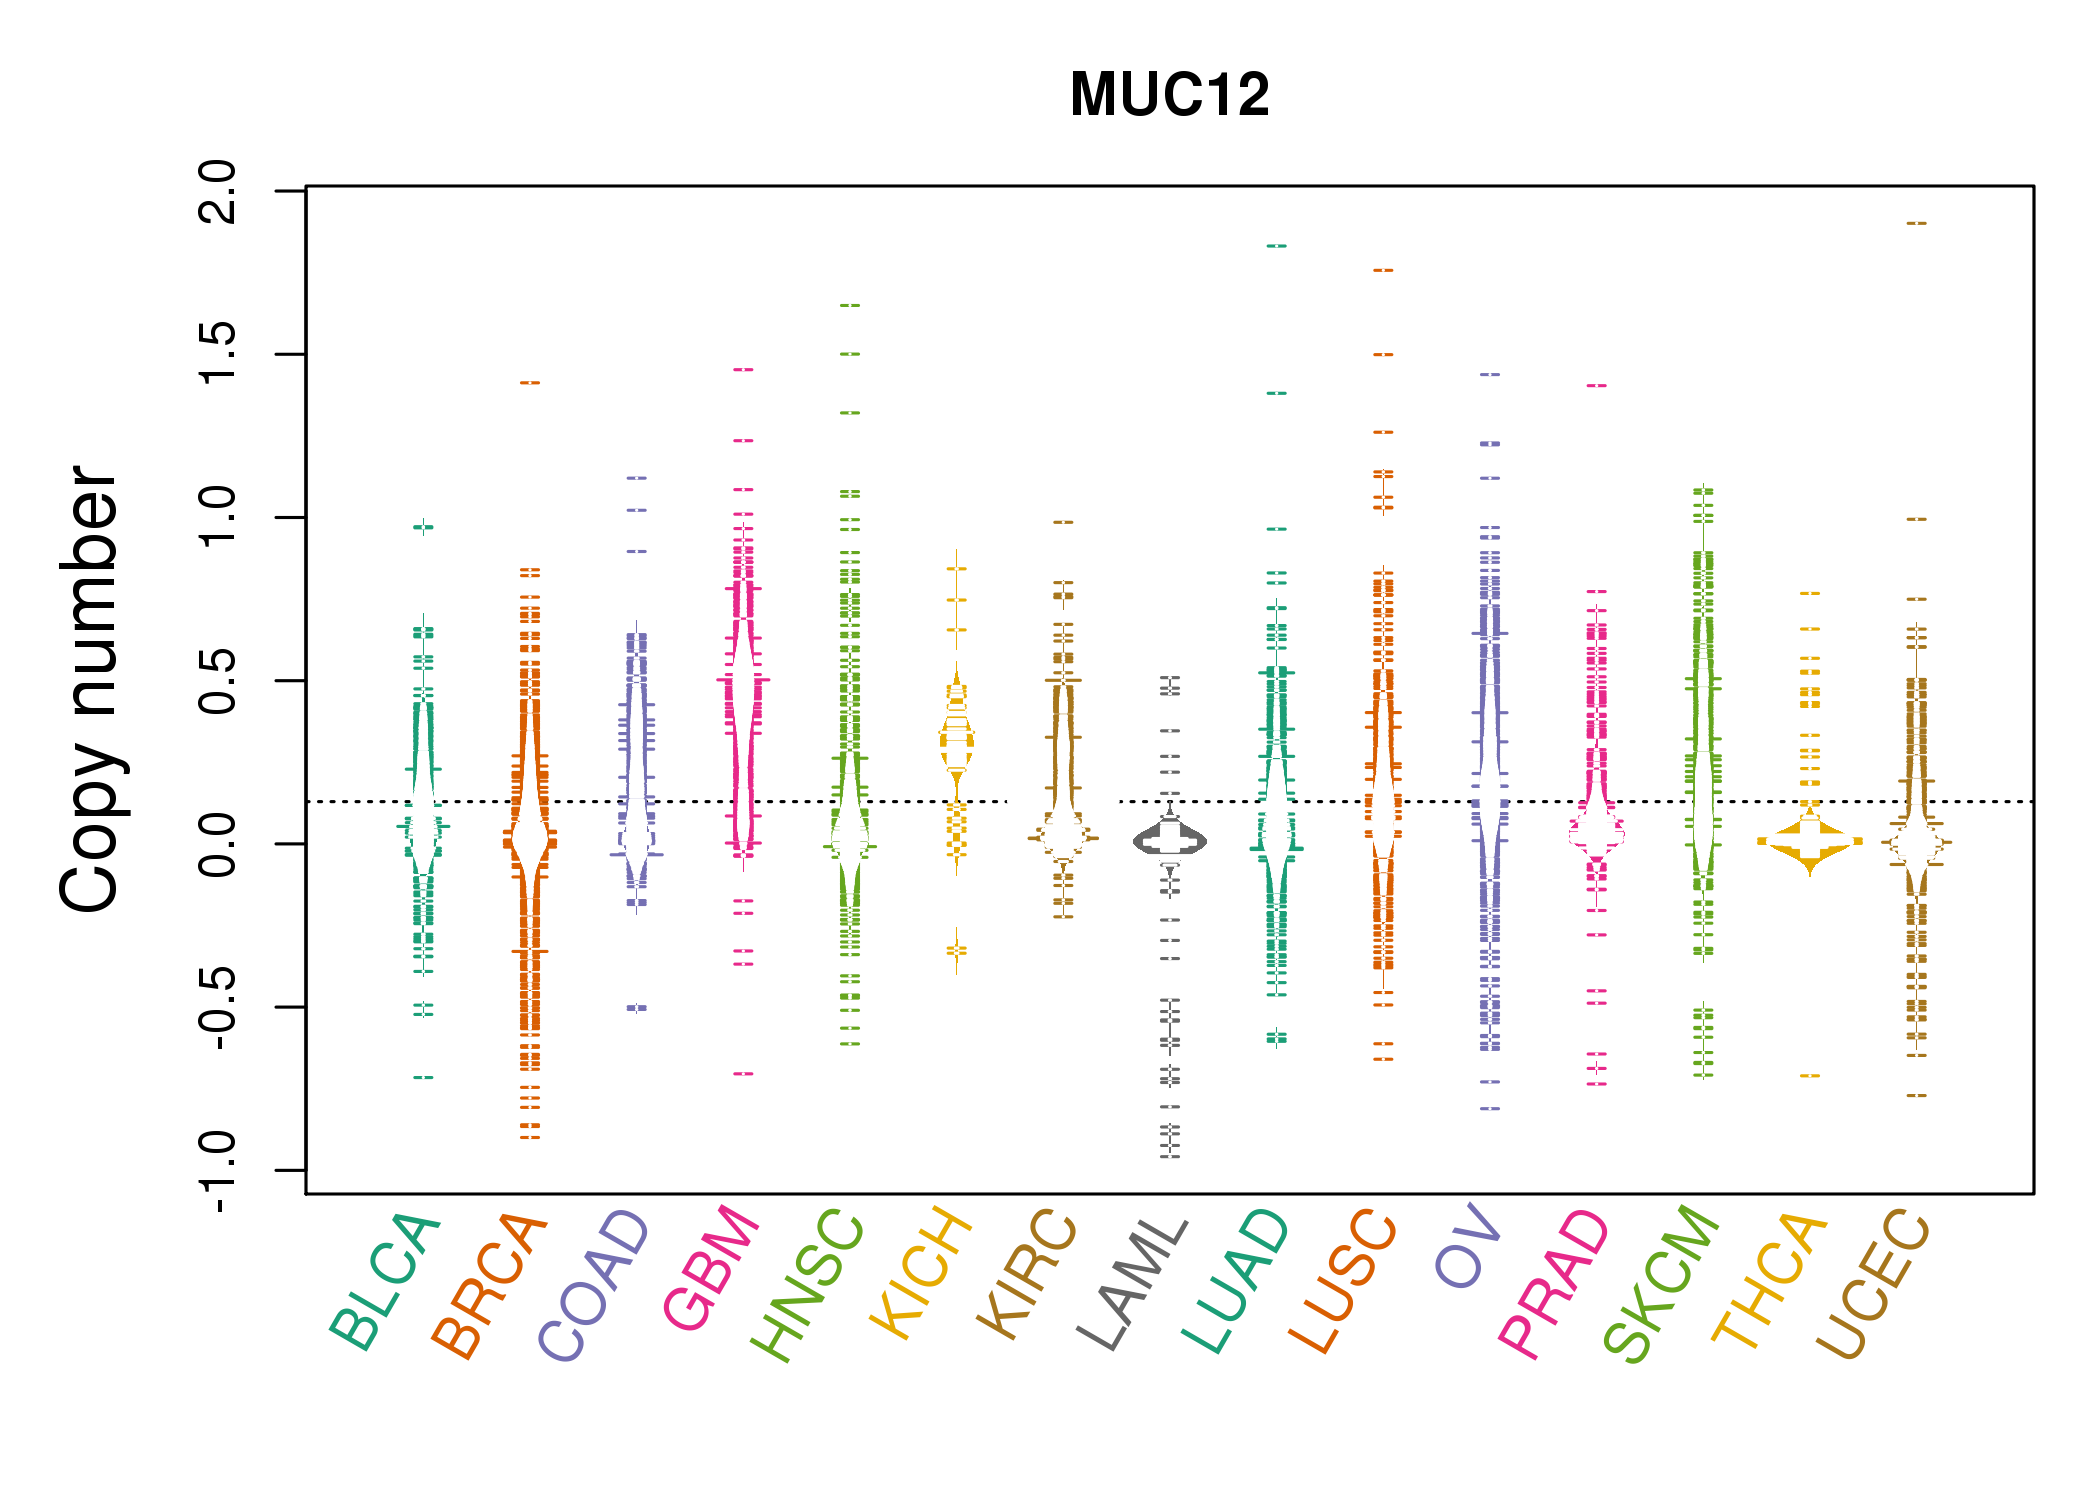 |
| cf) Tissue ID[Tissue type]: BLCA[Bladder Urothelial Carcinoma], BRCA[Breast invasive carcinoma], CESC[Cervical squamous cell carcinoma and endocervical adenocarcinoma], COAD[Colon adenocarcinoma], GBM[Glioblastoma multiforme], Glioma Low Grade, HNSC[Head and Neck squamous cell carcinoma], KICH[Kidney Chromophobe], KIRC[Kidney renal clear cell carcinoma], KIRP[Kidney renal papillary cell carcinoma], LAML[Acute Myeloid Leukemia], LUAD[Lung adenocarcinoma], LUSC[Lung squamous cell carcinoma], OV[Ovarian serous cystadenocarcinoma ], PAAD[Pancreatic adenocarcinoma], PRAD[Prostate adenocarcinoma], SKCM[Skin Cutaneous Melanoma], STAD[Stomach adenocarcinoma], THCA[Thyroid carcinoma], UCEC[Uterine Corpus Endometrial Carcinoma] |
| Top |
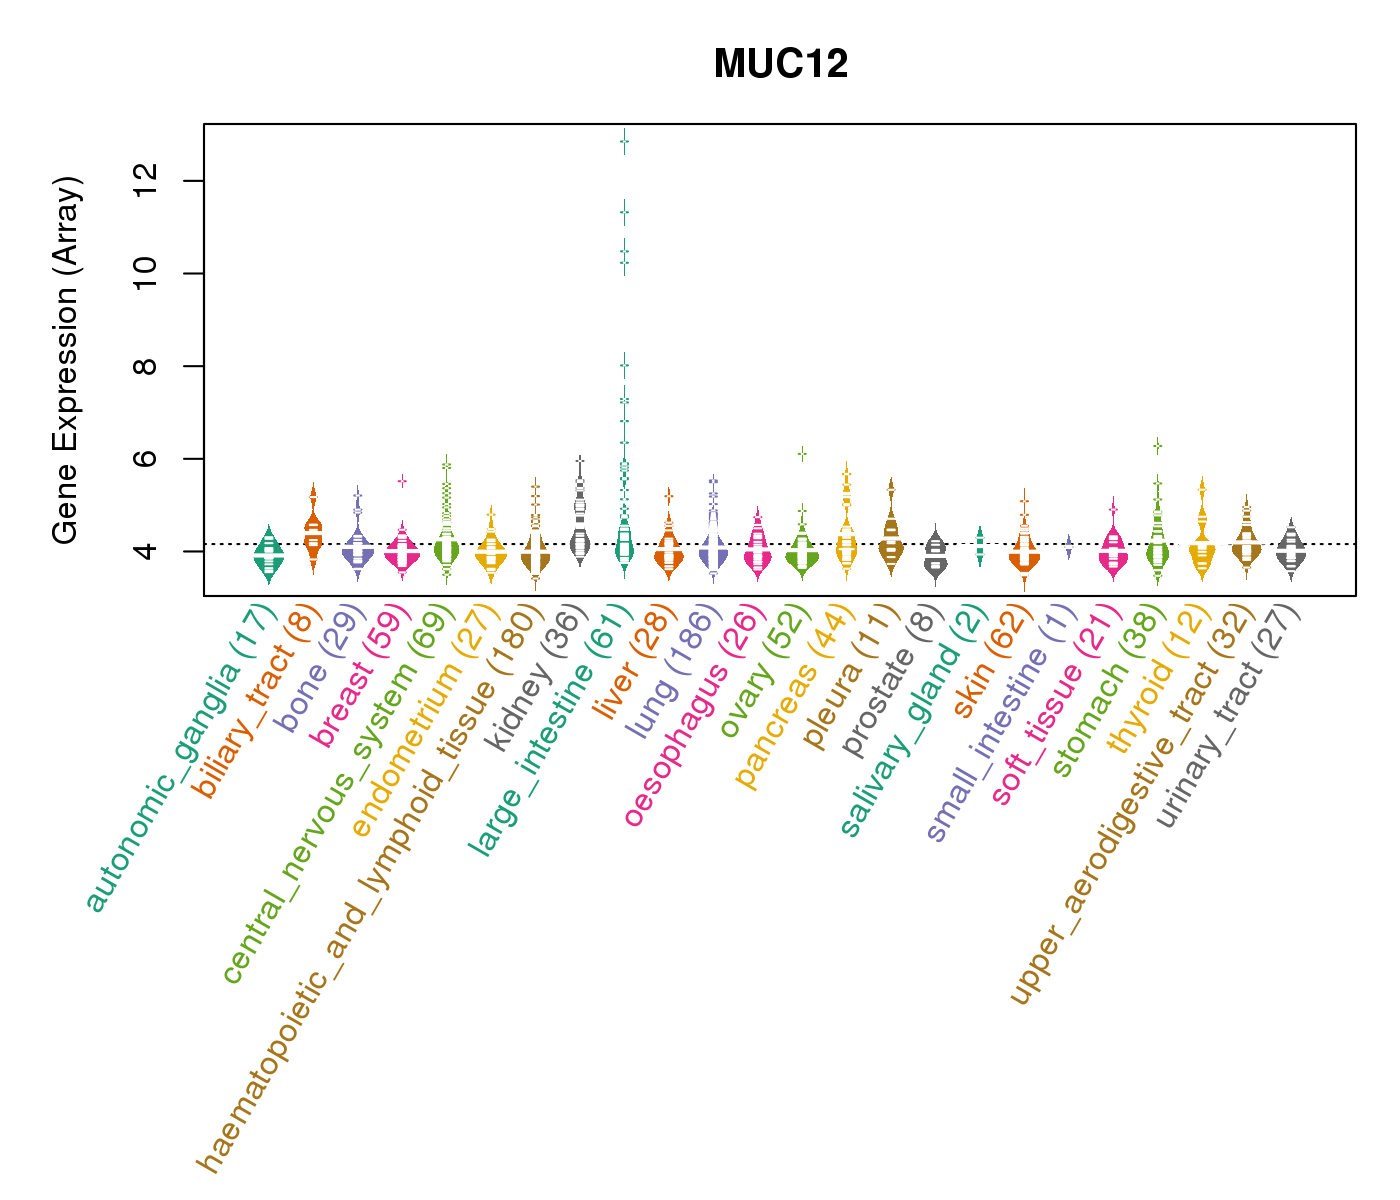
| Gene Expression for MUC12 |
| * CCLE gene expression data were extracted from CCLE_Expression_Entrez_2012-10-18.res: Gene-centric RMA-normalized mRNA expression data. |
 |
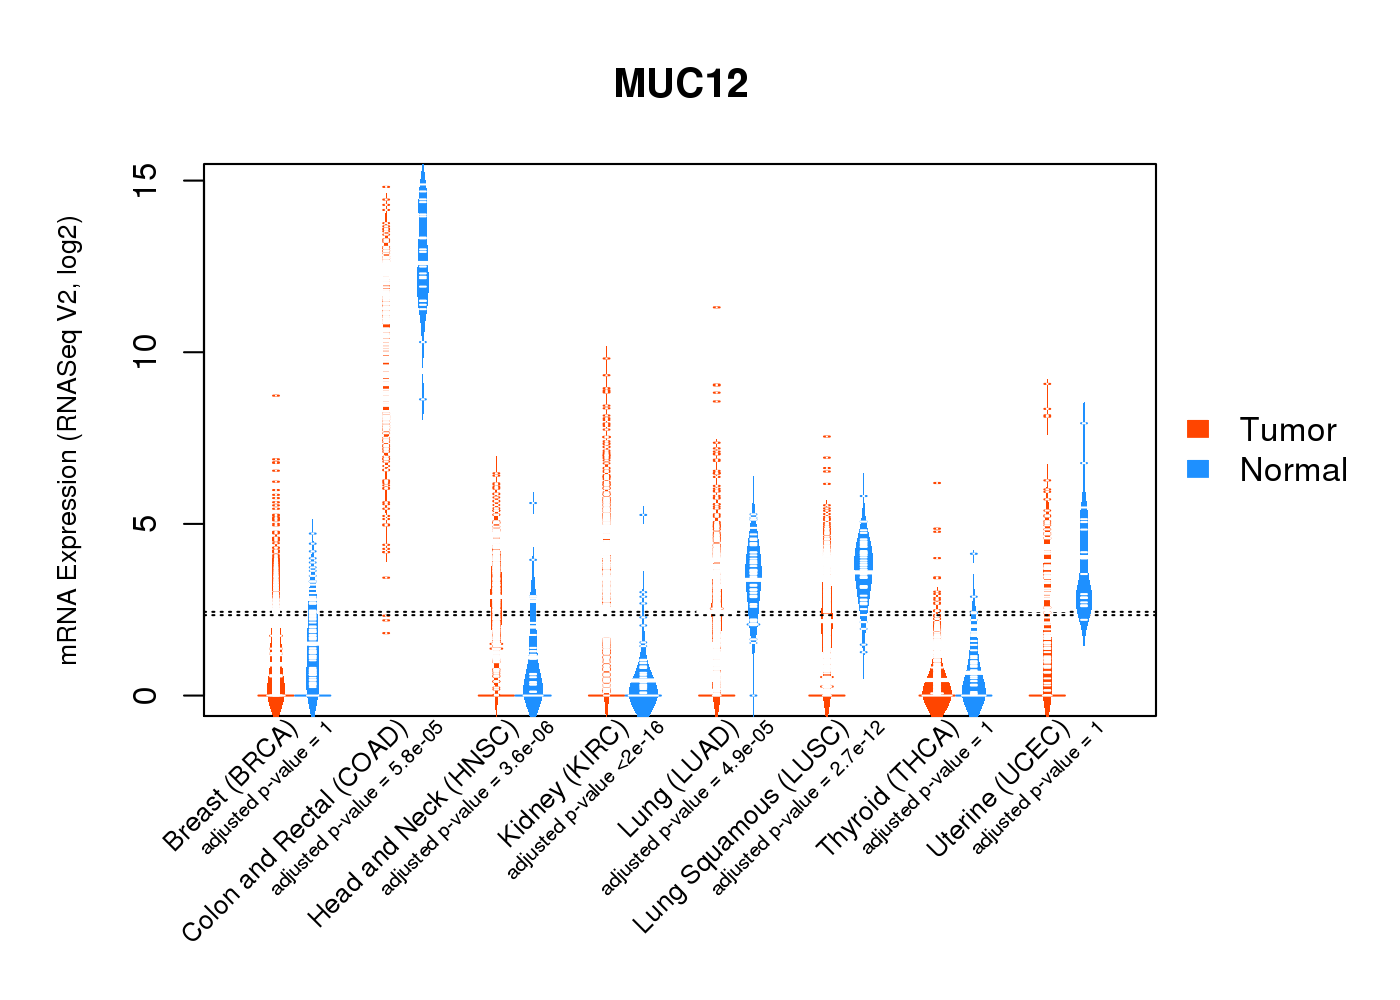
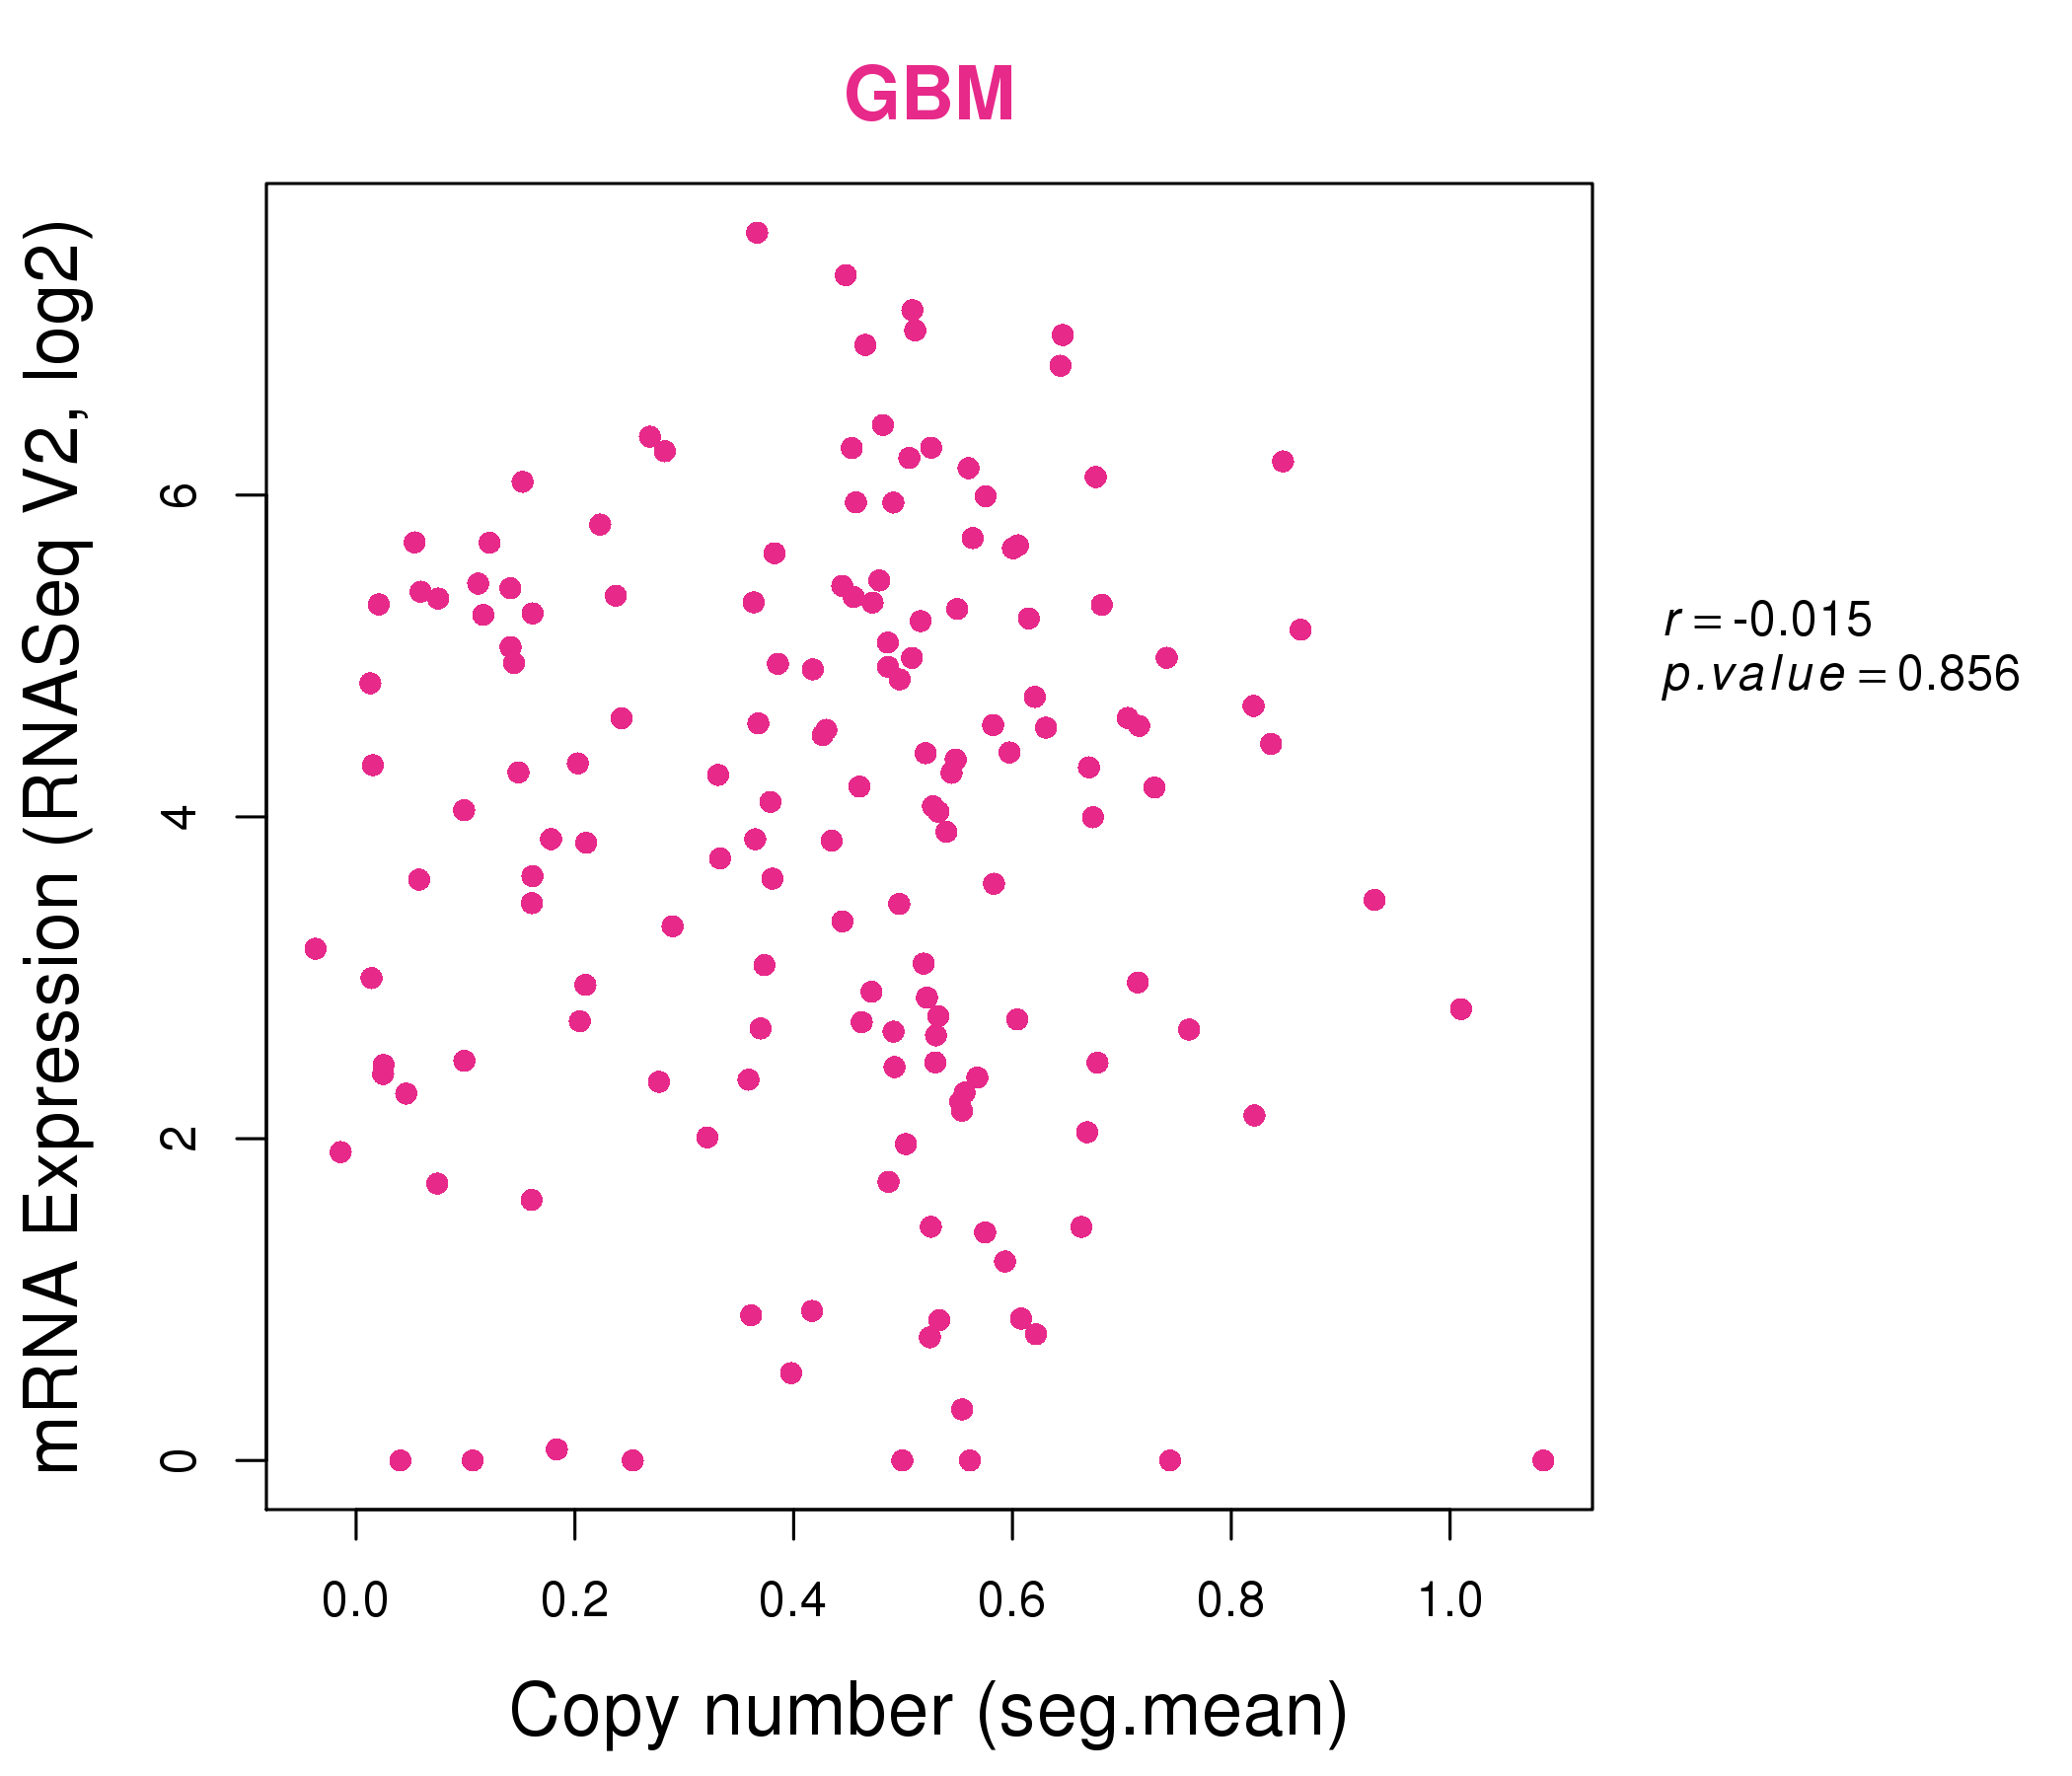
| * Normalized gene expression data of RNASeqV2 was extracted from TCGA using R package TCGA-Assembler. The URLs of all public data files on TCGA DCC data server were gathered at Jan-05-2015. Only eight cancer types have enough normal control samples for differential expression analysis. (t test, adjusted p<0.05 (using Benjamini-Hochberg FDR)) |
 |
| Top |
| * This plots show the correlation between CNV and gene expression. |
: Open all plots for all cancer types
 |
|
 |
|
| Top |
| Gene-Gene Network Information |
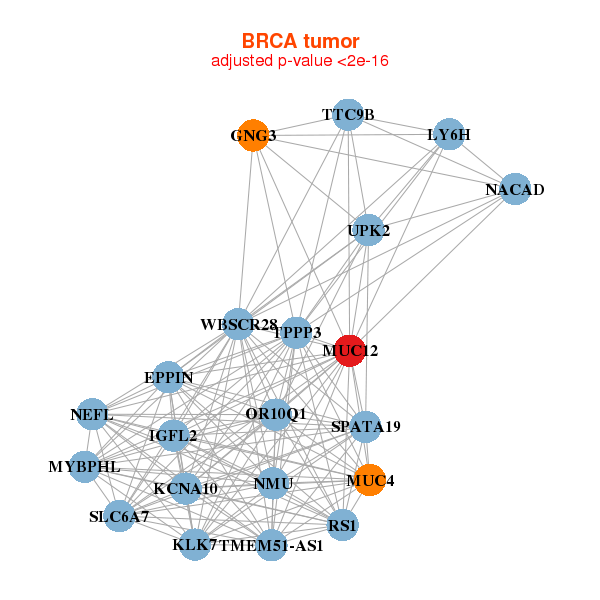
| * Co-Expression network figures were drawn using R package igraph. Only the top 20 genes with the highest correlations were shown. Red circle: input gene, orange circle: cell metabolism gene, sky circle: other gene |
: Open all plots for all cancer types
 |
|
| TMEM51-AS1,GNG3,IGFL2,KCNA10,KLK7,LY6H,MUC12, MUC4,MYBPHL,NACAD,NEFL,NMU,OR10Q1,RS1, SLC6A7,SPATA19,EPPIN,TPPP3,TTC9B,UPK2,WBSCR28 | BASP1,BATF3,MEDAG,CCDC109B,CCIN,CD70,CLEC3B, CMTM3,CRIP1,DBN1,EMP3,GLIPR2,LOXL1,METRNL, MFRP,MUC12,NCF4,SH3BGRL3,THBS3,TMSB4XP8,TPPP3 |
 |
|
| BTNL3,CEACAM5,CLDN23,CLDN3,DHRS11,TMEM236,NXPE4, FOXD2,LRRFIP2,MCOLN2,MUC12,MYO15B,PDE6A,PPP1R14C, RPL10L,SEPP1,TFCP2L1,TM9SF4,TMEM82,ZBTB7A,ZSWIM1 | ATP13A3,C2CD3,C3orf52,CLCN3,EPB41L4A,GALNT5,HIPK1, IWS1,JPH1,LMNA,LOC100129637,KMT2B___KMT2D,MUC12,MUC4, MYOF,PKD1L1,PVR,QSOX1,SETD8,TPD52L3,ZSCAN12P1 |

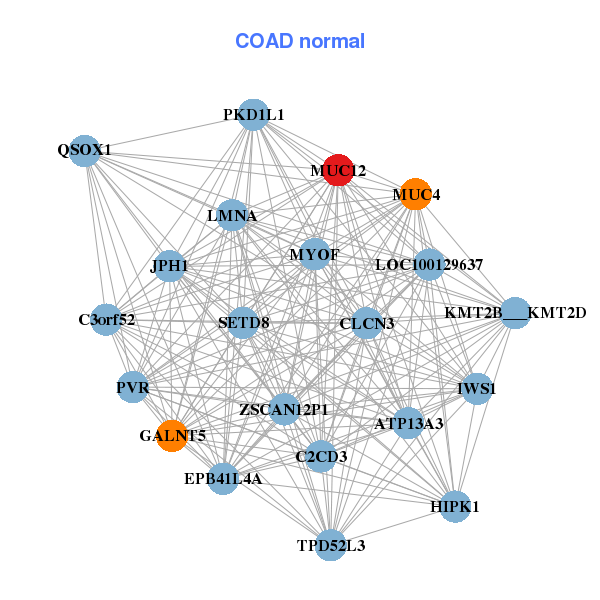
| * Co-Expression network figures were drawn using R package igraph. Only the top 20 genes with the highest correlations were shown. Red circle: input gene, orange circle: cell metabolism gene, sky circle: other gene |
: Open all plots for all cancer types
| Top |
: Open all interacting genes' information including KEGG pathway for all interacting genes from DAVID
| Top |
| Pharmacological Information for MUC12 |
| There's no related Drug. |
| Top |
| Cross referenced IDs for MUC12 |
| * We obtained these cross-references from Uniprot database. It covers 150 different DBs, 18 categories. http://www.uniprot.org/help/cross_references_section |
: Open all cross reference information
|
Copyright © 2016-Present - The Univsersity of Texas Health Science Center at Houston @ |