|
|||||||||||||||||||||||||||||||||||||||||||||||||||||||||||||||||||||||||||||||||||||||||||||||||||||||||||||||||||||||||||||||||||||||||||||||||||||||||||||||||||||||||||||||||||||||||||||||||||||||||||||||||||||||||||||||||||||||||||||||||||||||||||||||||||||||||||||||||||||||||||||||||||||||||||||||||||||||||||||||||||||||||||||||||||
| |
| Phenotypic Information (metabolism pathway, cancer, disease, phenome) |
| |
| |
| Gene-Gene Network Information: Co-Expression Network, Interacting Genes & KEGG |
| |
|


| Gene Summary for NAMPT |
| Top |
| Phenotypic Information for NAMPT(metabolism pathway, cancer, disease, phenome) |
| Cancer | CGAP: NAMPT |
| Familial Cancer Database: NAMPT | |
| * This gene is included in those cancer gene databases. |
|
|
|
|
|
| . | |||||||||||||||||||||||||||||||||||||||||||||||||||||||||||||||||||||||||||||||||||||||||||||||||||||||||||||||||||||||||||||||||||||||||||||||||||||||||||||||||||||||||||||||||||||||||||||||||||||||||||||||||||||||||||||||||||||||||||||||||||||||||||||||||||||||||||||||||||||||||||||||||||||||||||||||||||||||||||||||||||||||||||||
Oncogene 1 | Significant driver gene in | ||||||||||||||||||||||||||||||||||||||||||||||||||||||||||||||||||||||||||||||||||||||||||||||||||||||||||||||||||||||||||||||||||||||||||||||||||||||||||||||||||||||||||||||||||||||||||||||||||||||||||||||||||||||||||||||||||||||||||||||||||||||||||||||||||||||||||||||||||||||||||||||||||||||||||||||||||||||||||||||||||||||||||||||||||
| cf) number; DB name 1 Oncogene; http://nar.oxfordjournals.org/content/35/suppl_1/D721.long, 2 Tumor Suppressor gene; https://bioinfo.uth.edu/TSGene/, 3 Cancer Gene Census; http://www.nature.com/nrc/journal/v4/n3/abs/nrc1299.html, 4 CancerGenes; http://nar.oxfordjournals.org/content/35/suppl_1/D721.long, 5 Network of Cancer Gene; http://ncg.kcl.ac.uk/index.php, 1Therapeutic Vulnerabilities in Cancer; http://cbio.mskcc.org/cancergenomics/statius/ |
| KEGG_NICOTINATE_AND_NICOTINAMIDE_METABOLISM REACTOME_METABOLISM_OF_VITAMINS_AND_COFACTORS | |
| OMIM | |
| Orphanet | |
| Disease | KEGG Disease: NAMPT |
| MedGen: NAMPT (Human Medical Genetics with Condition) | |
| ClinVar: NAMPT | |
| Phenotype | MGI: NAMPT (International Mouse Phenotyping Consortium) |
| PhenomicDB: NAMPT | |
| Mutations for NAMPT |
| * Under tables are showing count per each tissue to give us broad intuition about tissue specific mutation patterns.You can go to the detailed page for each mutation database's web site. |
| - Statistics for Tissue and Mutation type | Top |
 |
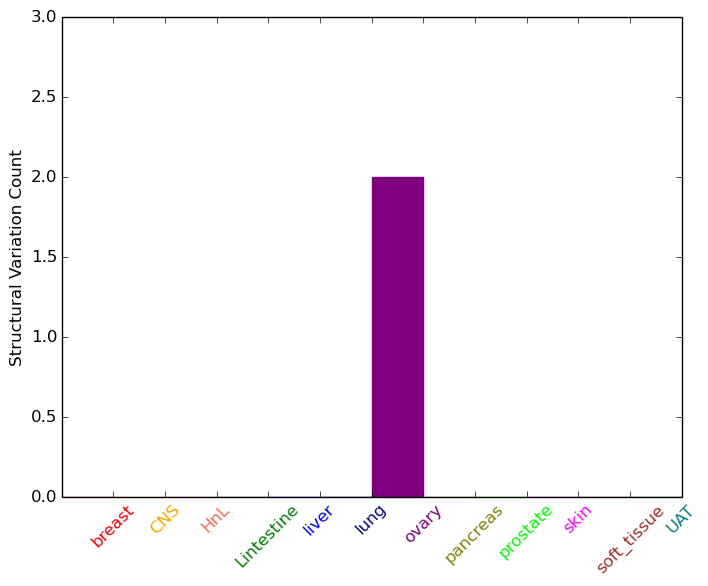
| - For Inter-chromosomal Variations |
| * Inter-chromosomal variantions includes 'interchromosomal amplicon to amplicon', 'interchromosomal amplicon to non-amplified dna', 'interchromosomal insertion', 'Interchromosomal unknown type'. |
 |
| - For Intra-chromosomal Variations |
| * Intra-chromosomal variantions includes 'intrachromosomal amplicon to amplicon', 'intrachromosomal amplicon to non-amplified dna', 'intrachromosomal deletion', 'intrachromosomal fold-back inversion', 'intrachromosomal inversion', 'intrachromosomal tandem duplication', 'Intrachromosomal unknown type', 'intrachromosomal with inverted orientation', 'intrachromosomal with non-inverted orientation'. |
 |
| Sample | Symbol_a | Chr_a | Start_a | End_a | Symbol_b | Chr_b | Start_b | End_b |
| ovary | NAMPT | chr7 | 105923276 | 105923296 | NAMPT | chr7 | 105923379 | 105923399 |
| cf) Tissue number; Tissue name (1;Breast, 2;Central_nervous_system, 3;Haematopoietic_and_lymphoid_tissue, 4;Large_intestine, 5;Liver, 6;Lung, 7;Ovary, 8;Pancreas, 9;Prostate, 10;Skin, 11;Soft_tissue, 12;Upper_aerodigestive_tract) |
| * From mRNA Sanger sequences, Chitars2.0 arranged chimeric transcripts. This table shows NAMPT related fusion information. |
| ID | Head Gene | Tail Gene | Accession | Gene_a | qStart_a | qEnd_a | Chromosome_a | tStart_a | tEnd_a | Gene_a | qStart_a | qEnd_a | Chromosome_a | tStart_a | tEnd_a |
| DA677790 | NOP58 | 1 | 66 | 2 | 203142842 | 203142907 | NAMPT | 67 | 577 | 7 | 105913009 | 105925426 | |
| BQ335321 | PLD5 | 250 | 274 | 1 | 242370111 | 242370136 | NAMPT | 263 | 468 | 7 | 105917540 | 105925393 | |
| DB135958 | NAMPT | 3 | 456 | 7 | 105913035 | 105925396 | CD69 | 445 | 550 | 12 | 9907664 | 9907769 | |
| BF874906 | NAMPT | 25 | 157 | 7 | 105906073 | 105906205 | UBE2H | 150 | 489 | 7 | 129554703 | 129555042 | |
| BE940024 | NAMPT | 21 | 276 | 7 | 105907376 | 105907632 | NAMPT | 274 | 476 | 7 | 105907180 | 105907382 | |
| BQ355873 | ZBTB20 | 280 | 300 | 3 | 114424119 | 114424139 | NAMPT | 282 | 613 | 7 | 105891622 | 105891952 | |
| Top |
| Mutation type/ Tissue ID | brca | cns | cerv | endome | haematopo | kidn | Lintest | liver | lung | ns | ovary | pancre | prost | skin | stoma | thyro | urina | |||
| Total # sample | 1 | 1 | 1 | |||||||||||||||||
| GAIN (# sample) | 1 | 1 | ||||||||||||||||||
| LOSS (# sample) | 1 |
| cf) Tissue ID; Tissue type (1; Breast, 2; Central_nervous_system, 3; Cervix, 4; Endometrium, 5; Haematopoietic_and_lymphoid_tissue, 6; Kidney, 7; Large_intestine, 8; Liver, 9; Lung, 10; NS, 11; Ovary, 12; Pancreas, 13; Prostate, 14; Skin, 15; Stomach, 16; Thyroid, 17; Urinary_tract) |
| Top |
|
 |
| Top |
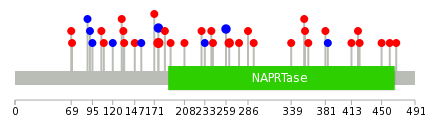
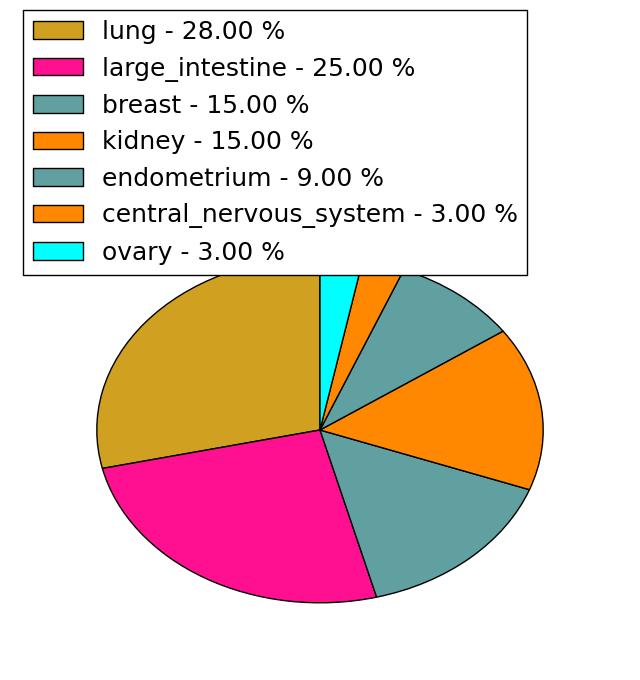
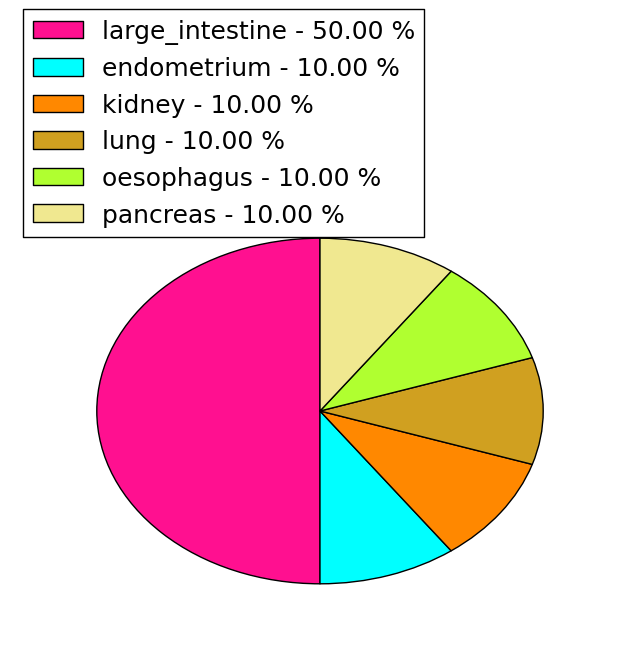
| Stat. for Non-Synonymous SNVs (# total SNVs=32) | (# total SNVs=10) |
 |  |
(# total SNVs=0) | (# total SNVs=0) |
| Top |
| * When you move the cursor on each content, you can see more deailed mutation information on the Tooltip. Those are primary_site,primary_histology,mutation(aa),pubmedID. |
| GRCh37 position | Mutation(aa) | Unique sampleID count |
| chr7:105909679-105909679 | p.L176S | 3 |
| chr7:105904020-105904020 | p.E263K | 2 |
| chr7:105909680-105909680 | p.L176L | 2 |
| chr7:105904030-105904030 | p.K259K | 2 |
| chr7:105894952-105894952 | p.? | 1 |
| chr7:105915425-105915425 | p.V95V | 1 |
| chr7:105904035-105904035 | p.E258* | 1 |
| chr7:105891602-105891602 | p.T468I | 1 |
| chr7:105909741-105909741 | p.S155S | 1 |
| chr7:105902044-105902044 | p.T360N | 1 |
| Top |
|
 |
| Point Mutation/ Tissue ID | 1 | 2 | 3 | 4 | 5 | 6 | 7 | 8 | 9 | 10 | 11 | 12 | 13 | 14 | 15 | 16 | 17 | 18 | 19 | 20 |
| # sample | 1 | 1 | 9 | 1 | 2 | 2 | 4 | 3 | 1 | 1 | 2 | 4 | ||||||||
| # mutation | 1 | 1 | 8 | 1 | 2 | 2 | 4 | 3 | 1 | 1 | 2 | 4 | ||||||||
| nonsynonymous SNV | 1 | 1 | 4 | 1 | 2 | 1 | 3 | 3 | 1 | 1 | 2 | 3 | ||||||||
| synonymous SNV | 4 | 1 | 1 | 1 |
| cf) Tissue ID; Tissue type (1; BLCA[Bladder Urothelial Carcinoma], 2; BRCA[Breast invasive carcinoma], 3; CESC[Cervical squamous cell carcinoma and endocervical adenocarcinoma], 4; COAD[Colon adenocarcinoma], 5; GBM[Glioblastoma multiforme], 6; Glioma Low Grade, 7; HNSC[Head and Neck squamous cell carcinoma], 8; KICH[Kidney Chromophobe], 9; KIRC[Kidney renal clear cell carcinoma], 10; KIRP[Kidney renal papillary cell carcinoma], 11; LAML[Acute Myeloid Leukemia], 12; LUAD[Lung adenocarcinoma], 13; LUSC[Lung squamous cell carcinoma], 14; OV[Ovarian serous cystadenocarcinoma ], 15; PAAD[Pancreatic adenocarcinoma], 16; PRAD[Prostate adenocarcinoma], 17; SKCM[Skin Cutaneous Melanoma], 18:STAD[Stomach adenocarcinoma], 19:THCA[Thyroid carcinoma], 20:UCEC[Uterine Corpus Endometrial Carcinoma]) |
| Top |
| * We represented just top 10 SNVs. When you move the cursor on each content, you can see more deailed mutation information on the Tooltip. Those are primary_site, primary_histology, mutation(aa), pubmedID. |
| Genomic Position | Mutation(aa) | Unique sampleID count |
| chr7:105903950 | p.L176S | 2 |
| chr7:105904030 | p.L176L | 2 |
| chr7:105909679 | p.A286V | 2 |
| chr7:105909680 | p.K259K | 2 |
| chr7:105909693 | p.T468I | 1 |
| chr7:105891602 | p.D192V | 1 |
| chr7:105903983 | p.T460A | 1 |
| chr7:105909741 | p.H191N | 1 |
| chr7:105891627 | p.L450I | 1 |
| chr7:105904020 | p.D184N | 1 |
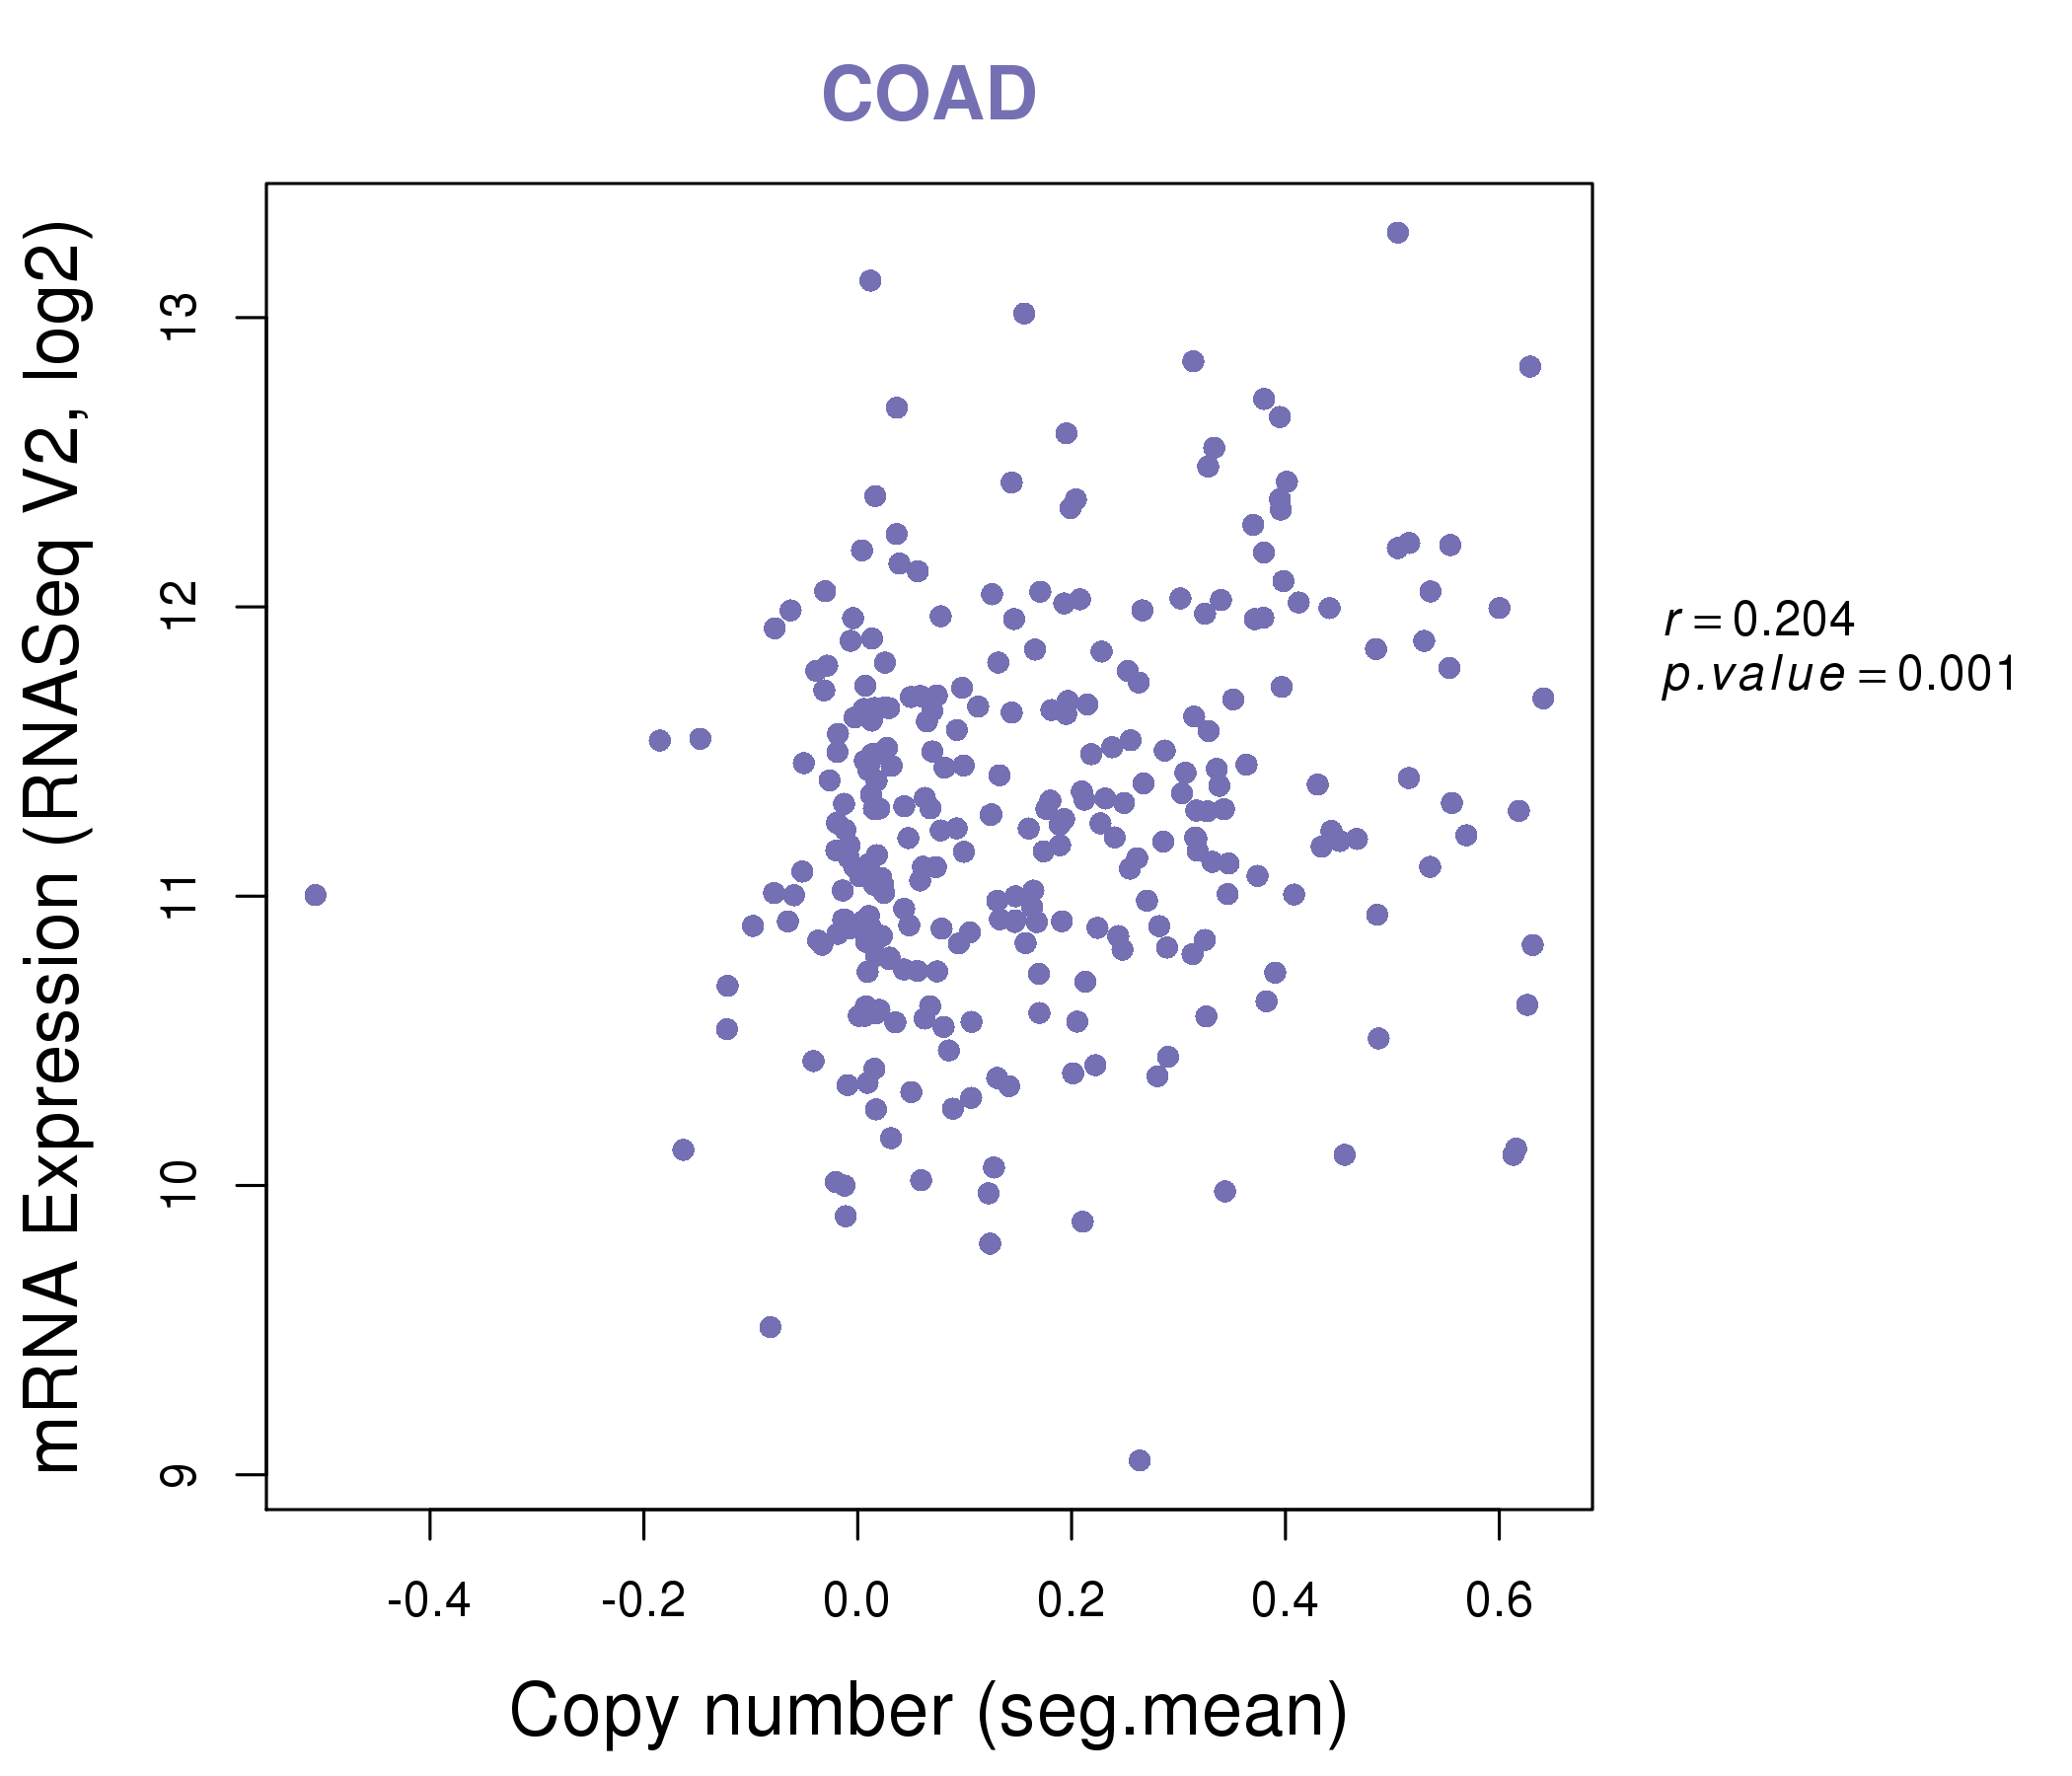
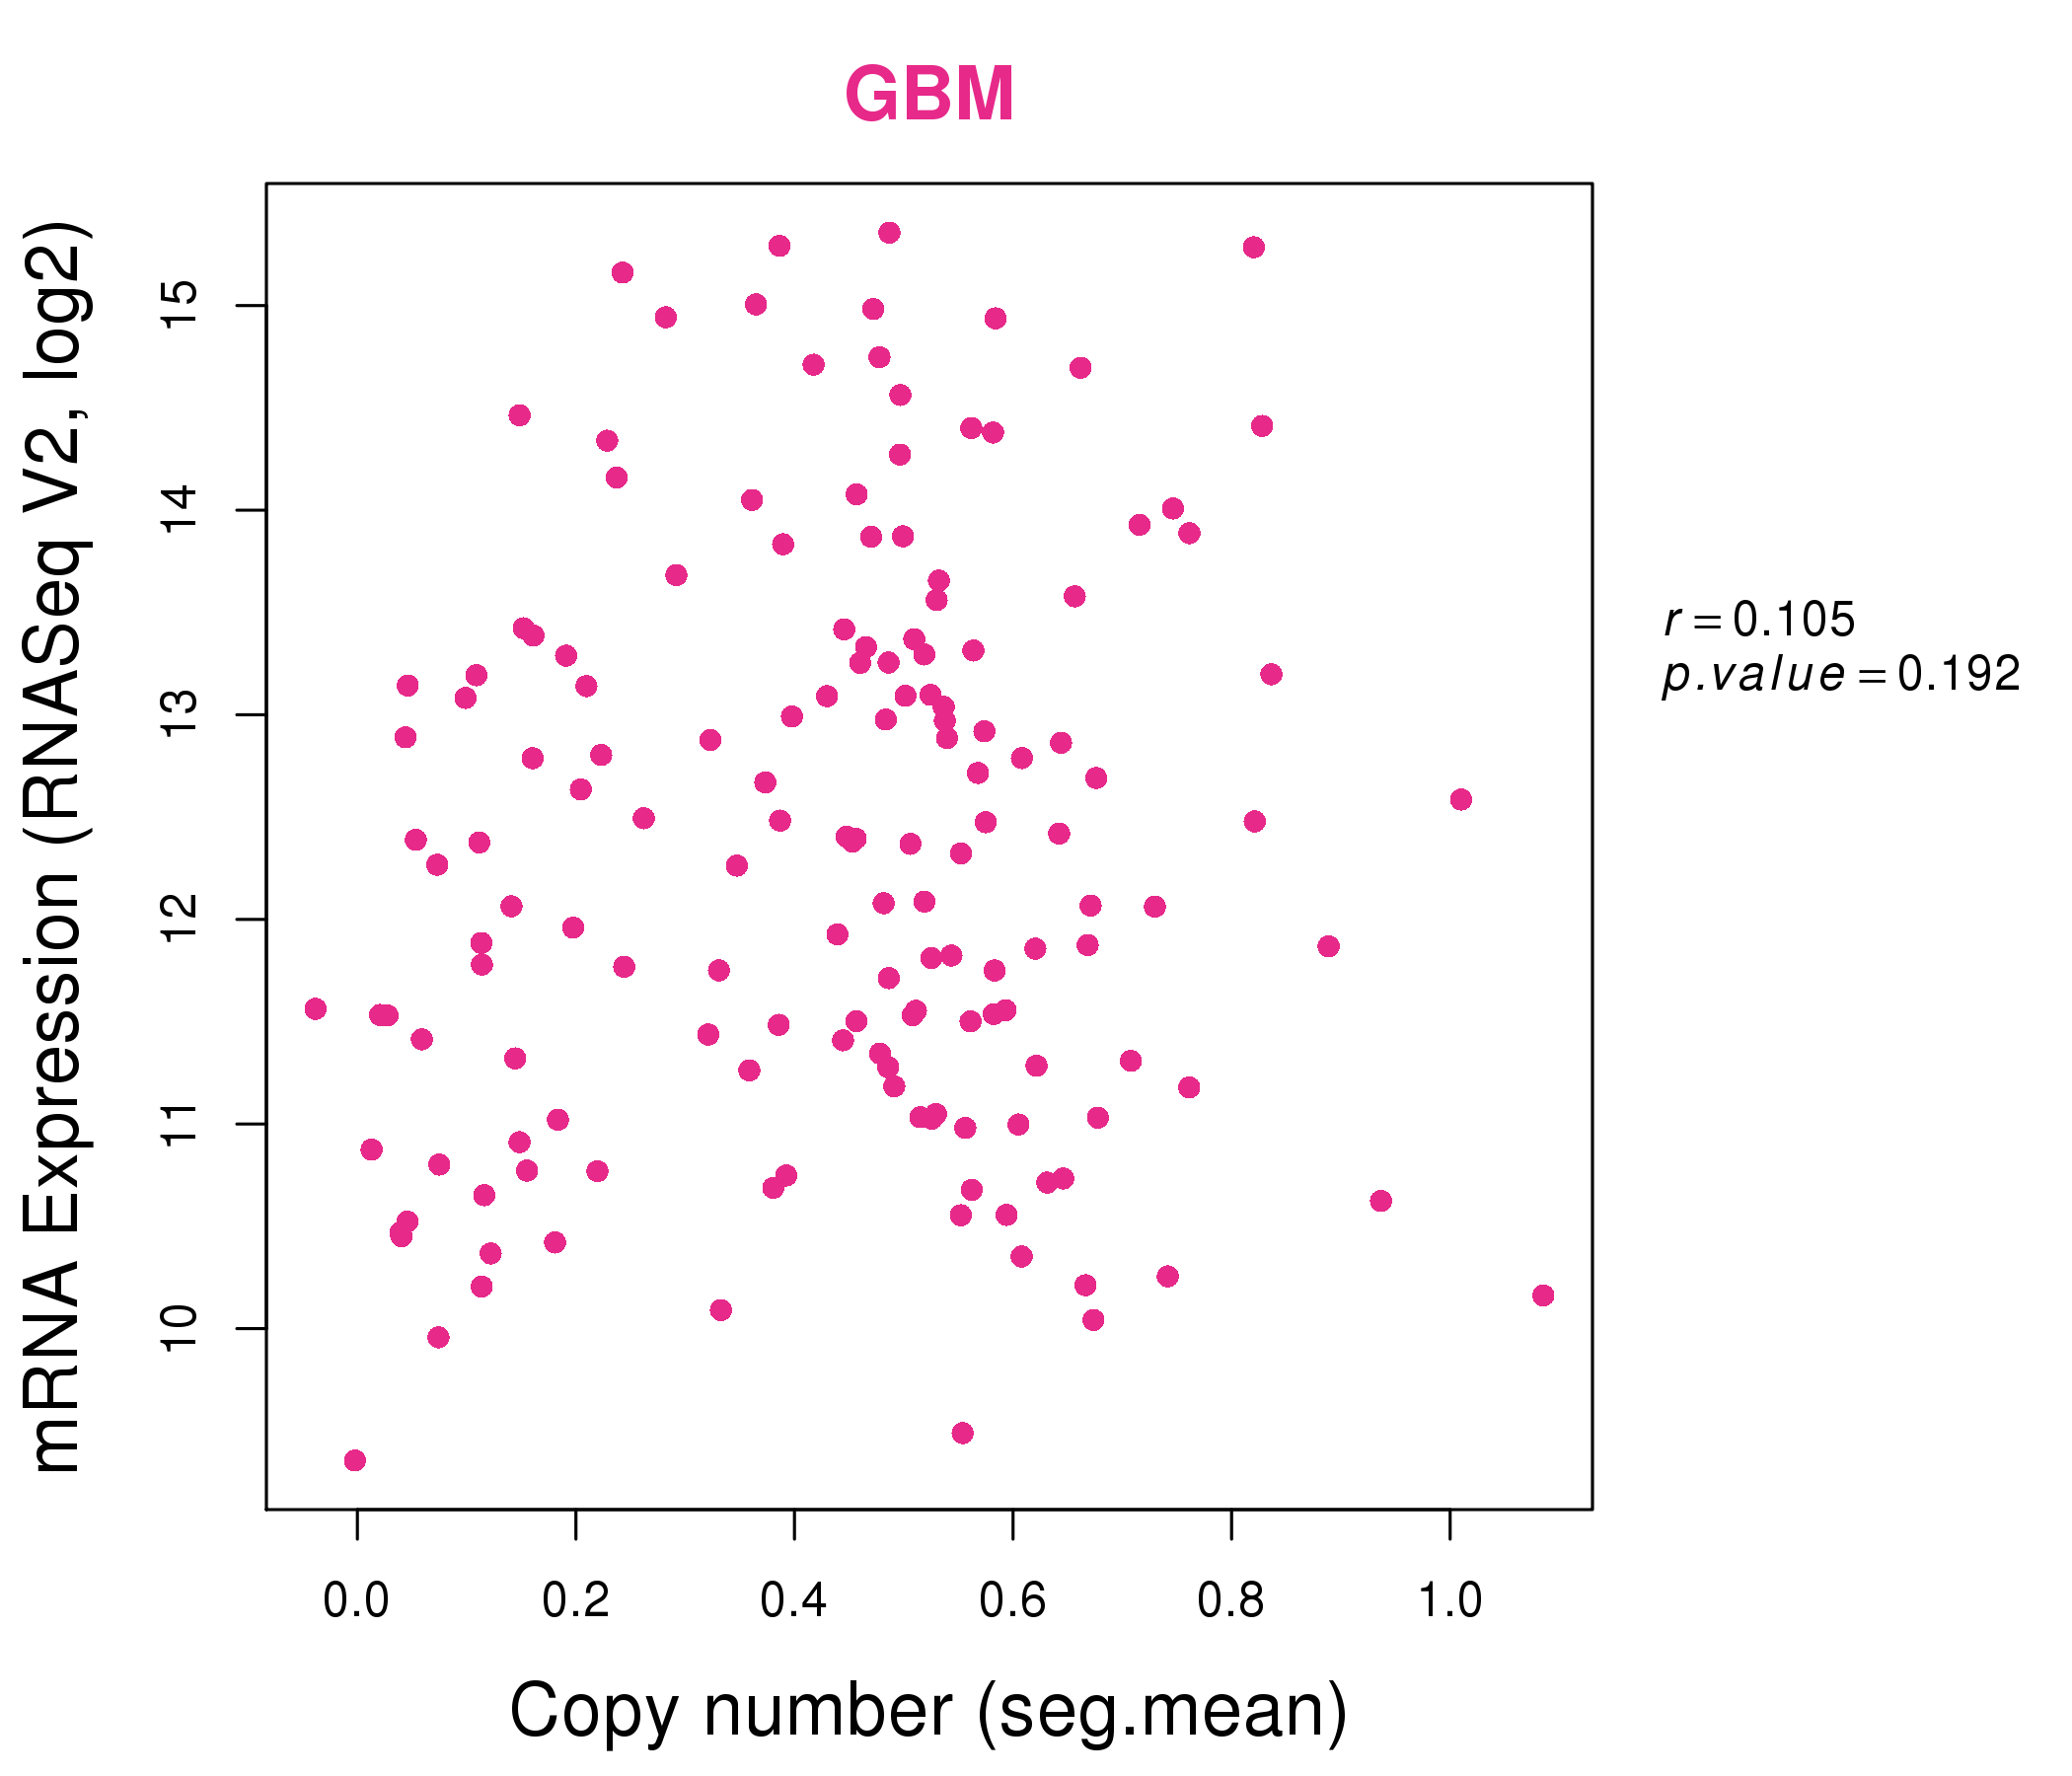
| * Copy number data were extracted from TCGA using R package TCGA-Assembler. The URLs of all public data files on TCGA DCC data server were gathered on Jan-05-2015. Function ProcessCNAData in TCGA-Assembler package was used to obtain gene-level copy number value which is calculated as the average copy number of the genomic region of a gene. |
 |
| cf) Tissue ID[Tissue type]: BLCA[Bladder Urothelial Carcinoma], BRCA[Breast invasive carcinoma], CESC[Cervical squamous cell carcinoma and endocervical adenocarcinoma], COAD[Colon adenocarcinoma], GBM[Glioblastoma multiforme], Glioma Low Grade, HNSC[Head and Neck squamous cell carcinoma], KICH[Kidney Chromophobe], KIRC[Kidney renal clear cell carcinoma], KIRP[Kidney renal papillary cell carcinoma], LAML[Acute Myeloid Leukemia], LUAD[Lung adenocarcinoma], LUSC[Lung squamous cell carcinoma], OV[Ovarian serous cystadenocarcinoma ], PAAD[Pancreatic adenocarcinoma], PRAD[Prostate adenocarcinoma], SKCM[Skin Cutaneous Melanoma], STAD[Stomach adenocarcinoma], THCA[Thyroid carcinoma], UCEC[Uterine Corpus Endometrial Carcinoma] |
| Top |
| Gene Expression for NAMPT |
| * CCLE gene expression data were extracted from CCLE_Expression_Entrez_2012-10-18.res: Gene-centric RMA-normalized mRNA expression data. |
 |
| * Normalized gene expression data of RNASeqV2 was extracted from TCGA using R package TCGA-Assembler. The URLs of all public data files on TCGA DCC data server were gathered at Jan-05-2015. Only eight cancer types have enough normal control samples for differential expression analysis. (t test, adjusted p<0.05 (using Benjamini-Hochberg FDR)) |
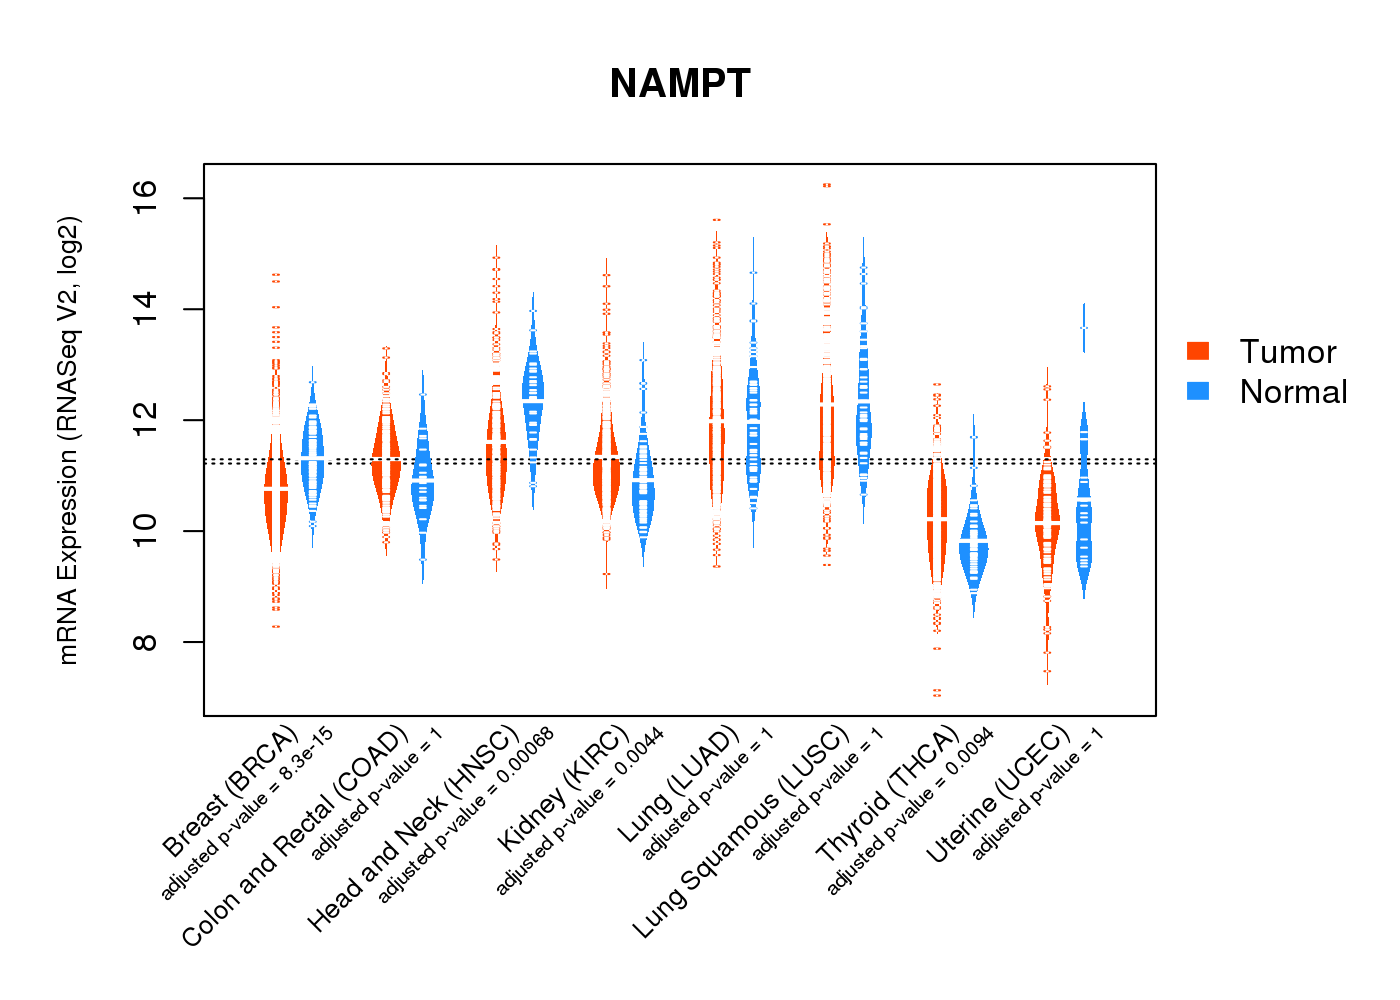 |
| Top |
| * This plots show the correlation between CNV and gene expression. |
: Open all plots for all cancer types
 |
|
 |
|

| Top |
| Gene-Gene Network Information |
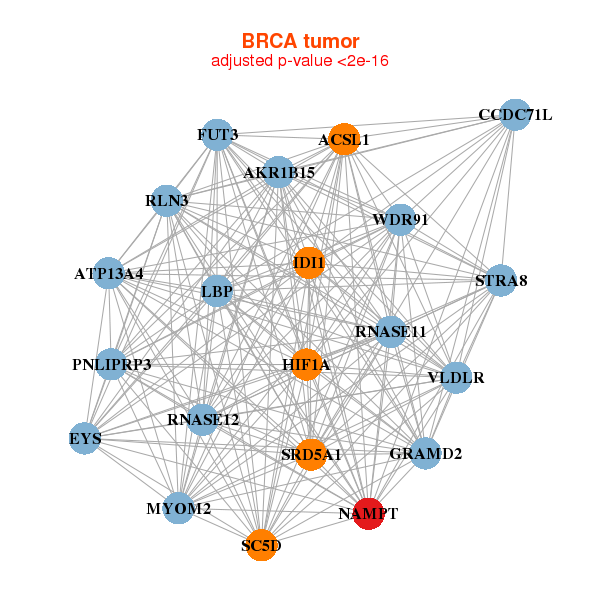
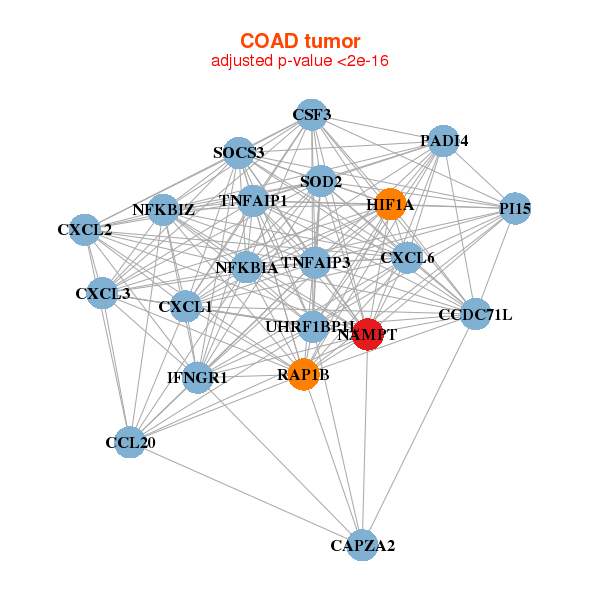
| * Co-Expression network figures were drawn using R package igraph. Only the top 20 genes with the highest correlations were shown. Red circle: input gene, orange circle: cell metabolism gene, sky circle: other gene |
: Open all plots for all cancer types
 |
| ||||
| ACSL1,AKR1B15,ATP13A4,EYS,CCDC71L,FUT3,GRAMD2, HIF1A,IDI1,LBP,MYOM2,NAMPT,PNLIPRP3,RLN3, RNASE11,RNASE12,SC5D,SRD5A1,STRA8,VLDLR,WDR91 | AKIRIN1,CLDN1,COQ10B,DDX3X,ELF1,ETS2,KLF6, LDLR,MAPK1IP1L,MCL1,NAMPT,PDE12,PER2,PIGA, PNPLA8,RNF19A,SERPINB8,SGMS2,SLC25A32,TSC22D2,ZBTB21 | ||||
 |
| ||||
| CAPZA2,CCL20,CSF3,CXCL1,CXCL2,CXCL3,CXCL6, CCDC71L,HIF1A,IFNGR1,NAMPT,NFKBIA,NFKBIZ,PADI4, PI15,RAP1B,SOCS3,SOD2,TNFAIP1,TNFAIP3,UHRF1BP1L | ANKRD22,DNAJB11,HNRNPF,IL13RA2,LILRA5,LSM12,NAMPT, NCOA7,NMI,NUS1,PDIA6,POMP,PPA1,PSMA1, PSMA3,PSMB2,RPN1,SOD2,TIMM17A,TMED7,TSPAN8 |
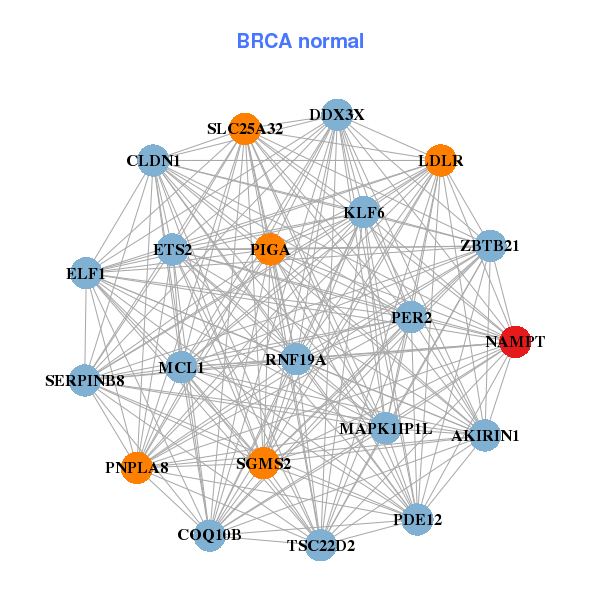

| * Co-Expression network figures were drawn using R package igraph. Only the top 20 genes with the highest correlations were shown. Red circle: input gene, orange circle: cell metabolism gene, sky circle: other gene |
: Open all plots for all cancer types
| Top |
: Open all interacting genes' information including KEGG pathway for all interacting genes from DAVID
| Top |
| Pharmacological Information for NAMPT |
| DB Category | DB Name | DB's ID and Url link |
| * Gene Centered Interaction Network. |
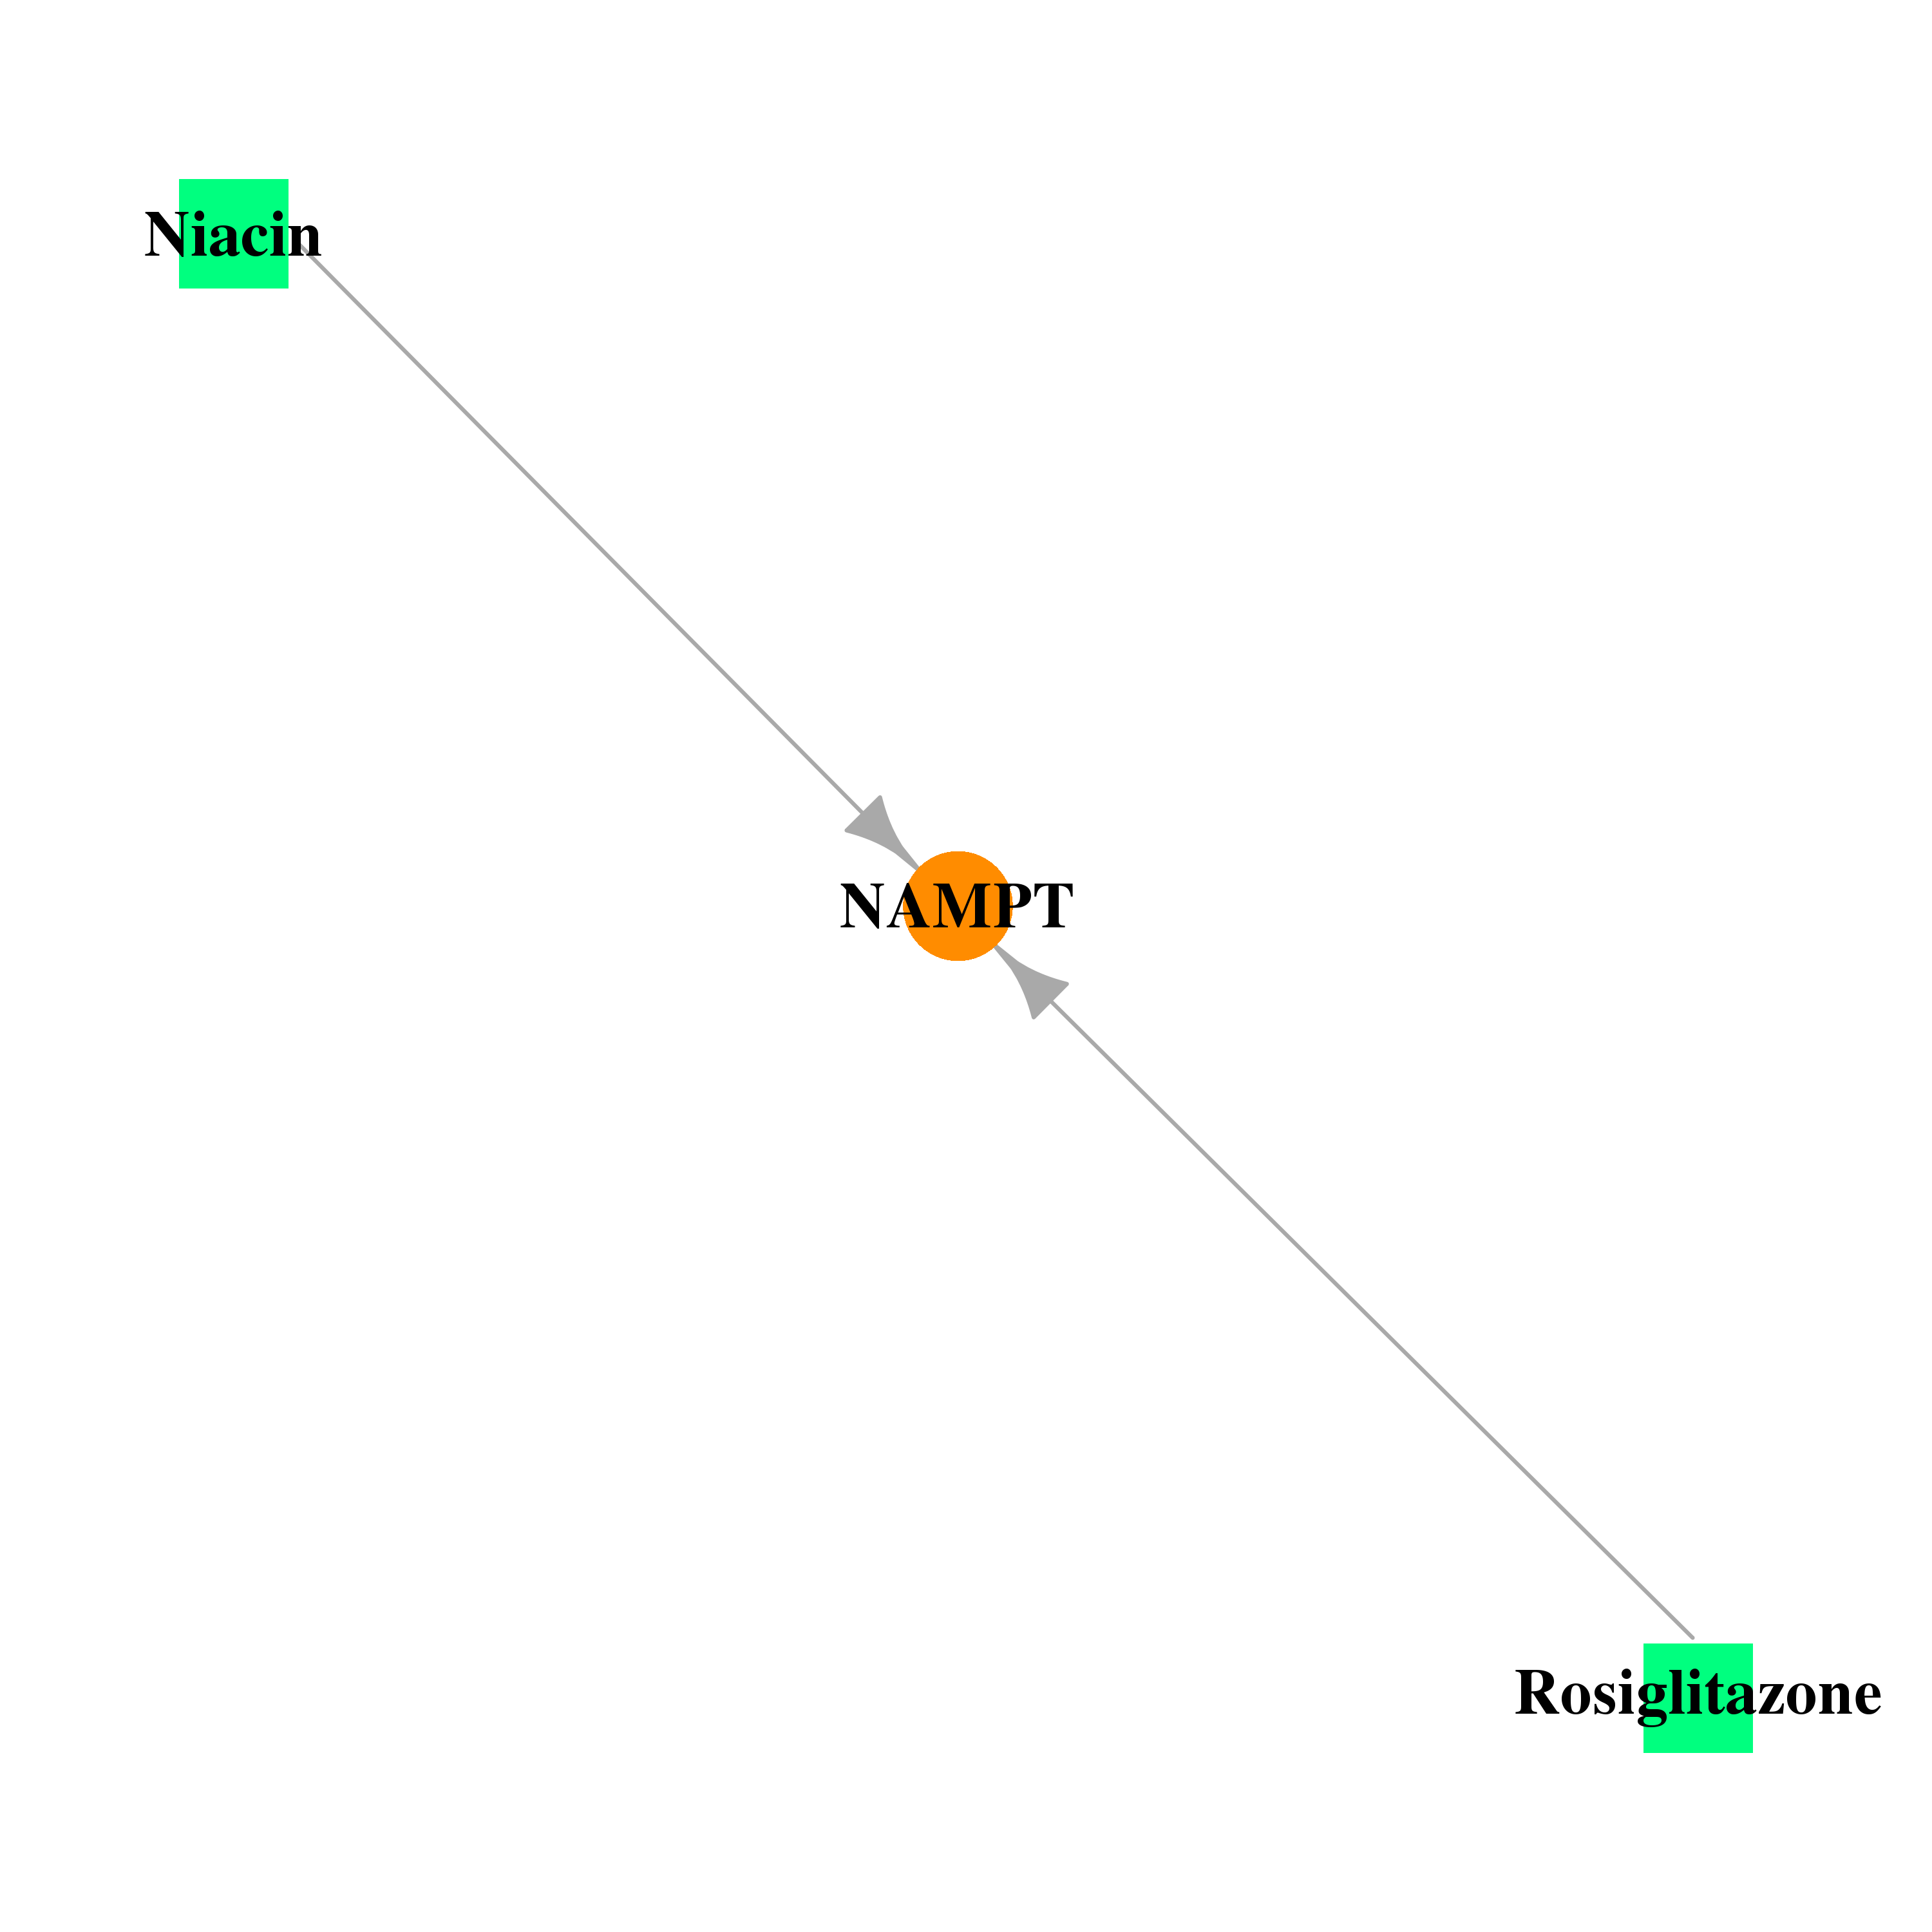 |
| * Drug Centered Interaction Network. |
| DrugBank ID | Target Name | Drug Groups | Generic Name | Drug Centered Network | Drug Structure |
| DB00627 | nicotinamide phosphoribosyltransferase | approved; nutraceutical; investigational | Niacin | 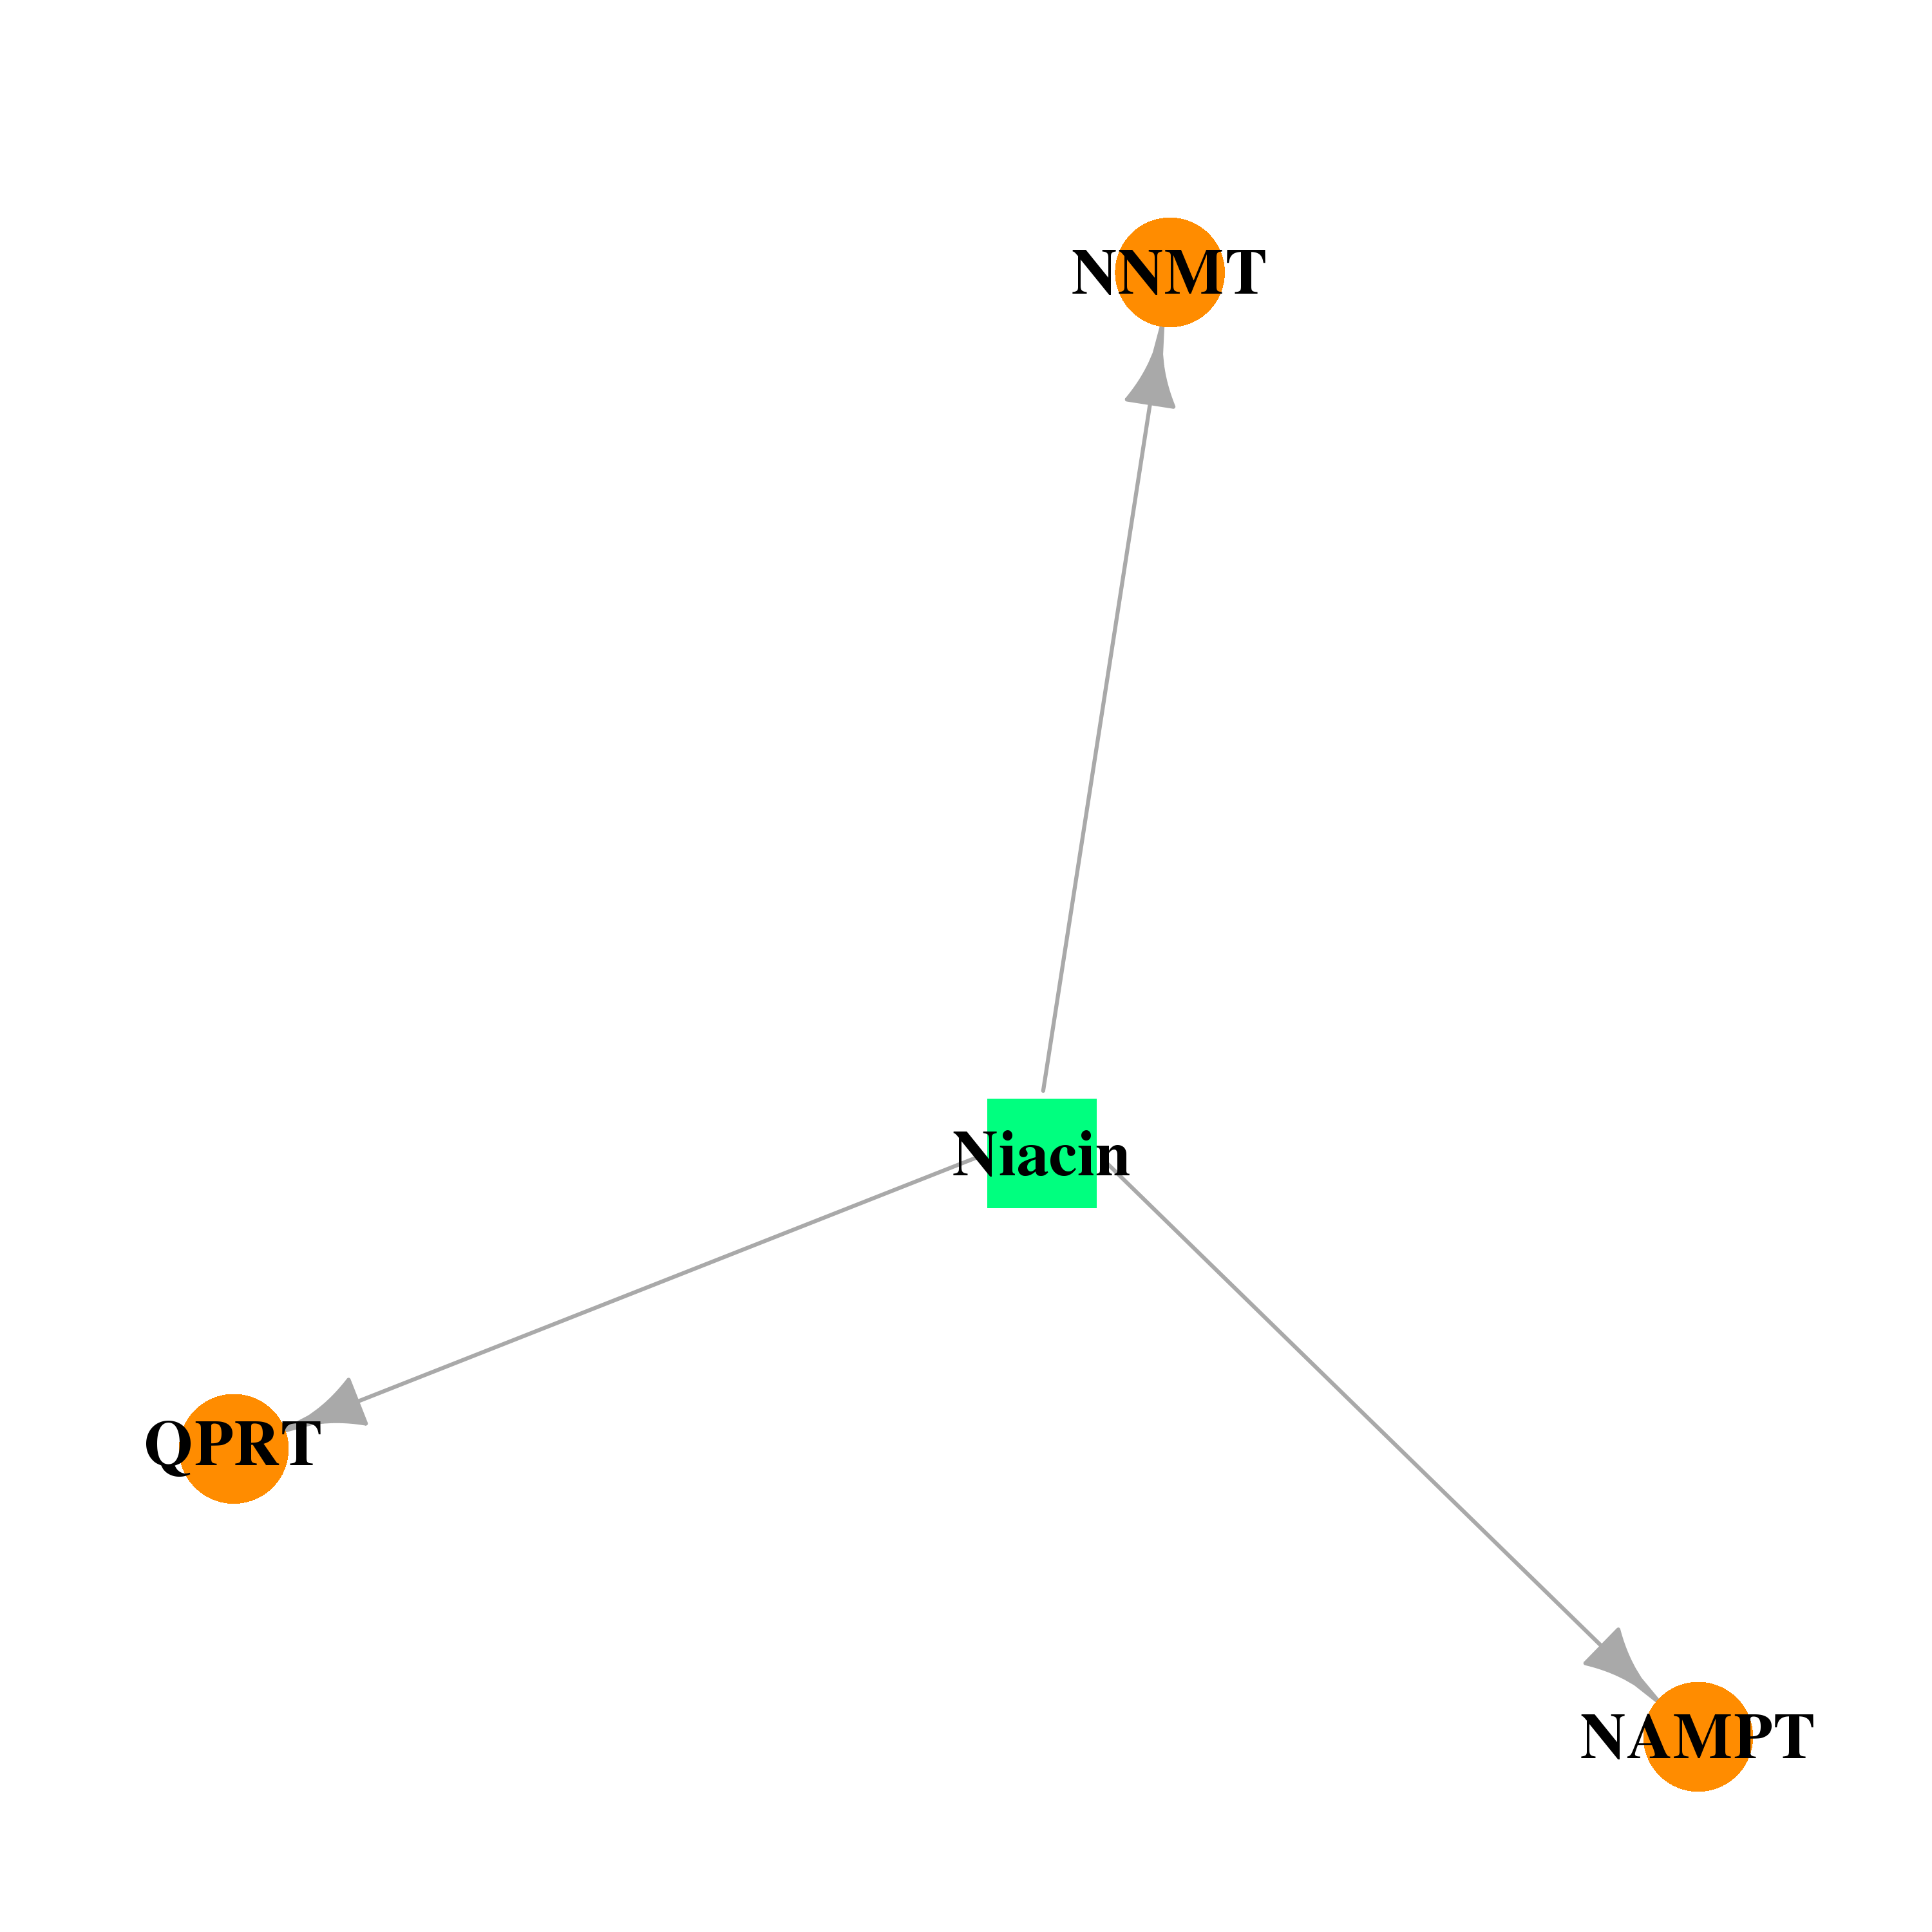 |  |
| DB00412 | nicotinamide phosphoribosyltransferase | approved; investigational | Rosiglitazone | 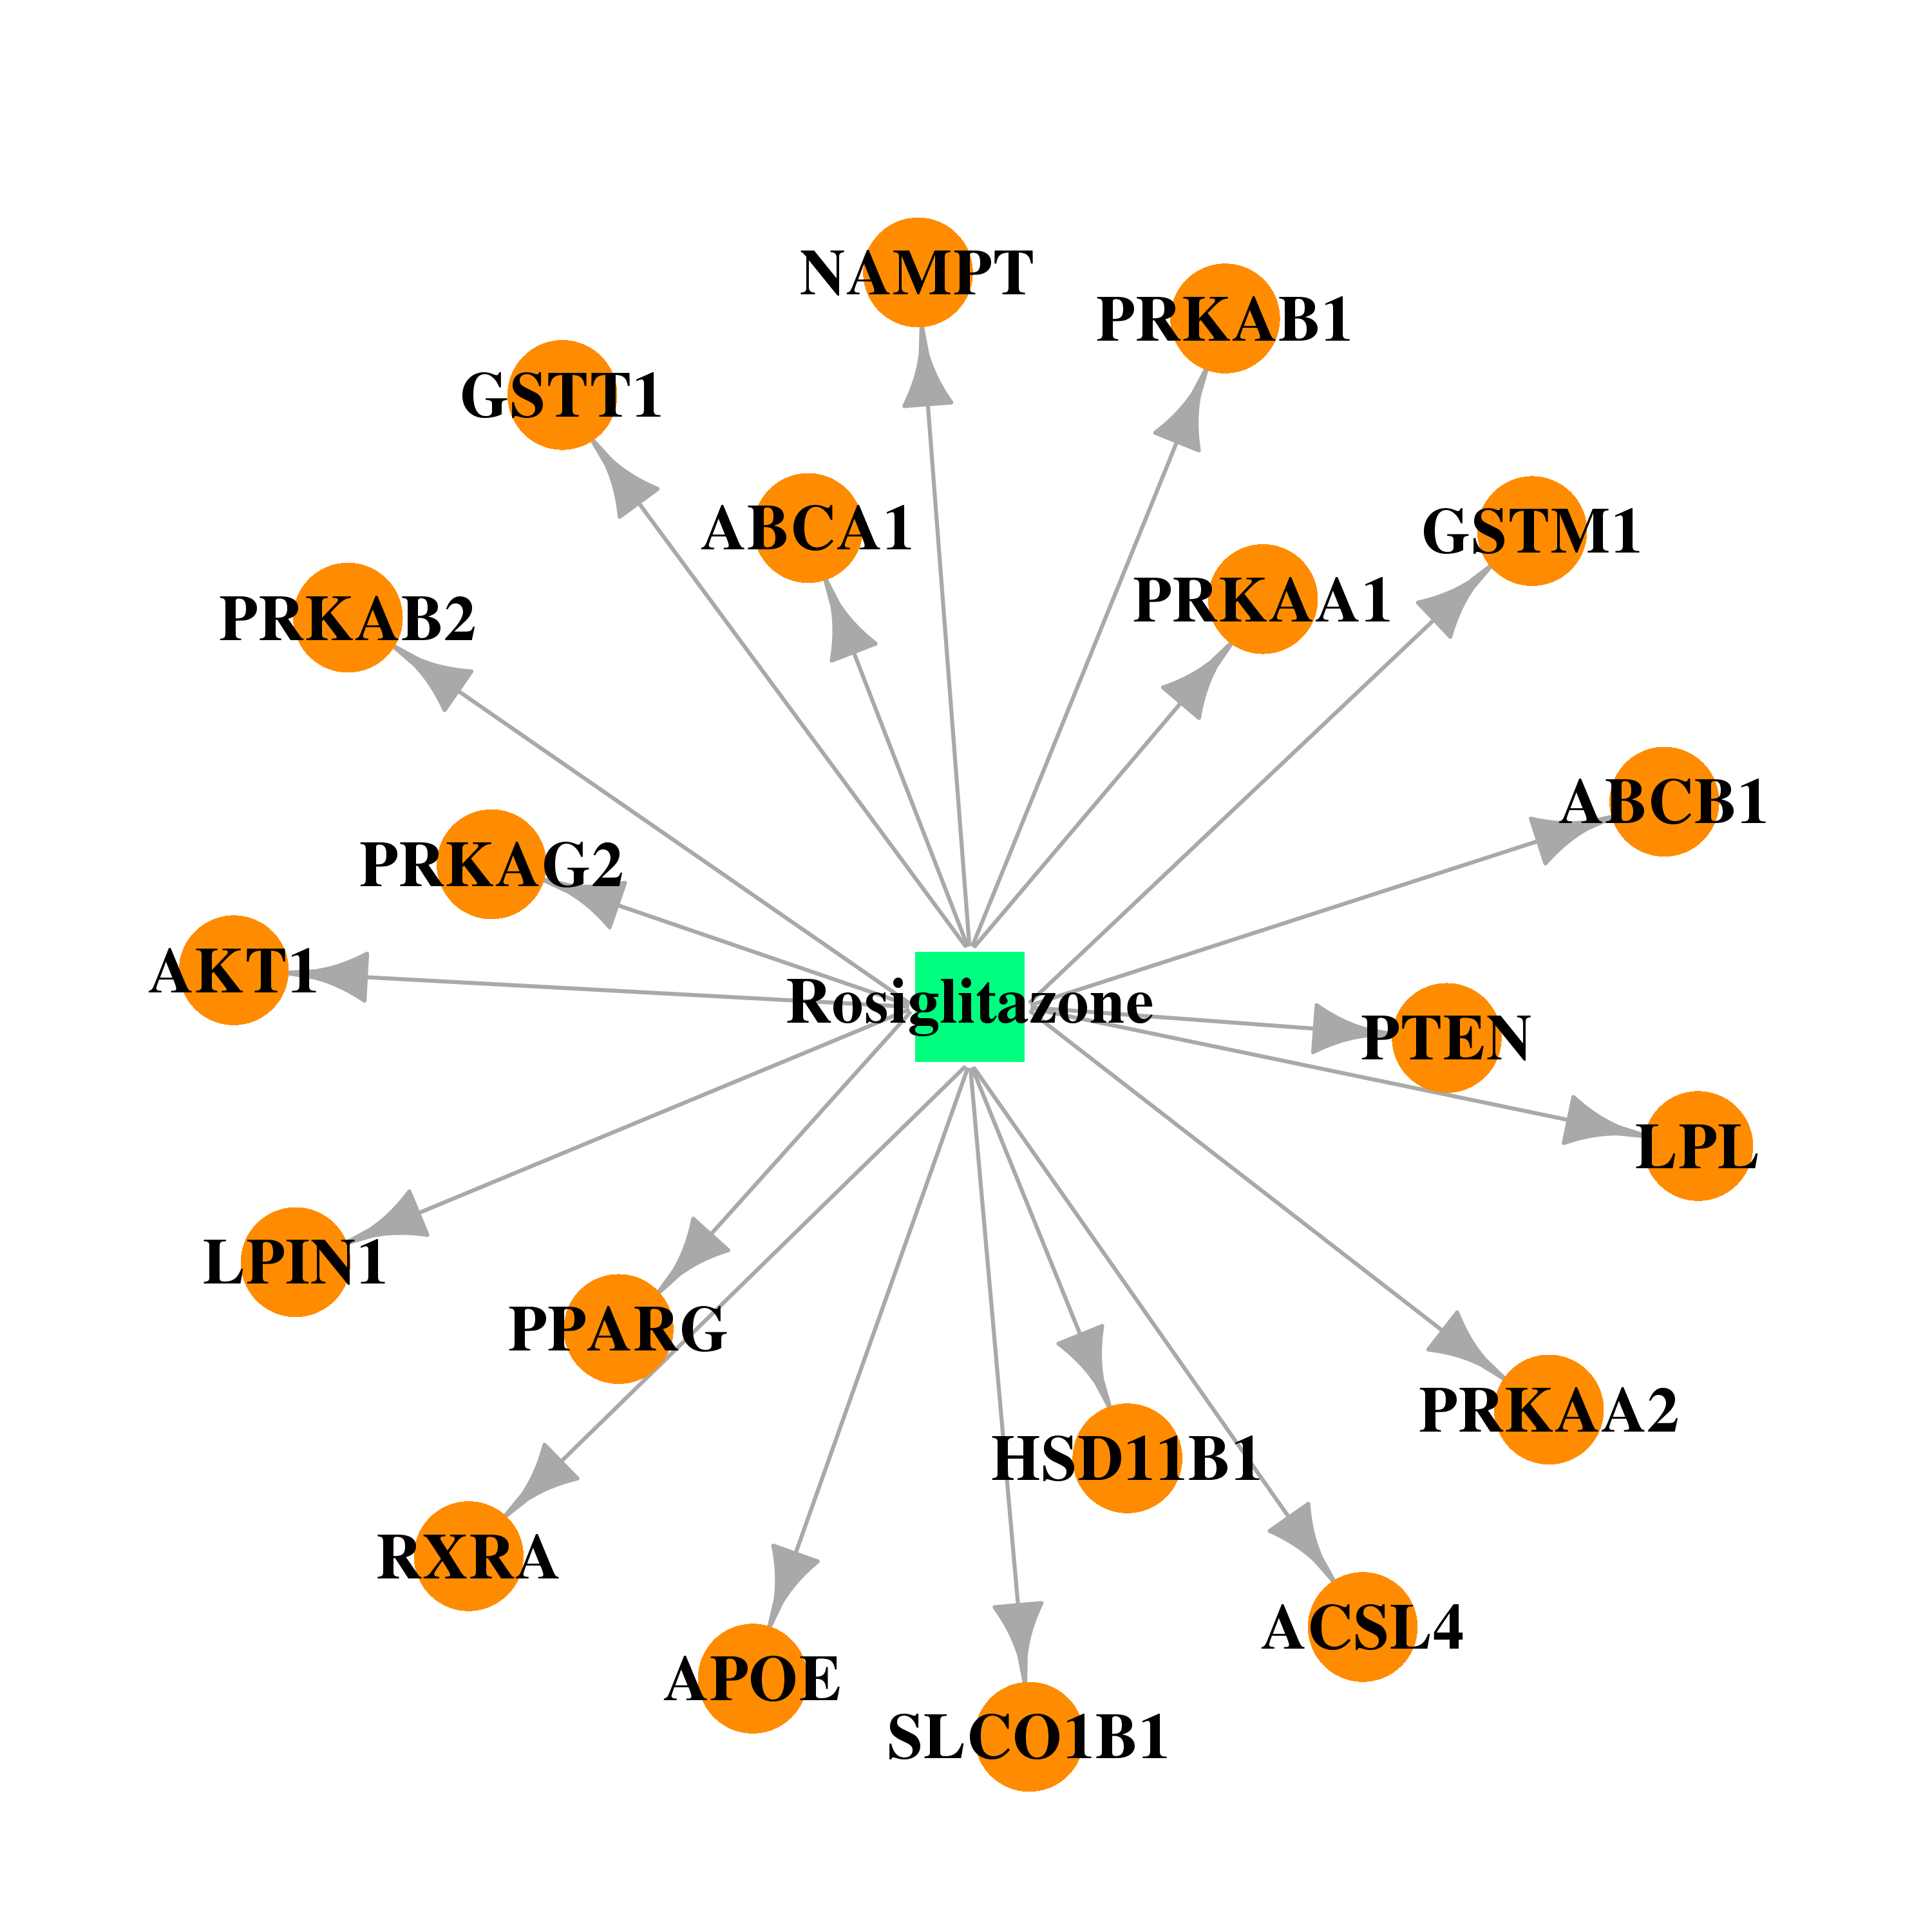 |  |
| Top |
| Cross referenced IDs for NAMPT |
| * We obtained these cross-references from Uniprot database. It covers 150 different DBs, 18 categories. http://www.uniprot.org/help/cross_references_section |
: Open all cross reference information
|
Copyright © 2016-Present - The Univsersity of Texas Health Science Center at Houston @ |