|
|||||||||||||||||||||||||||||||||||||||||||||||||||||||||||||||||||||||||||||||||||||||||||||||||||||||||||||||||||||||||||||||||||||||||||||||||||||||||||||||||||||||||||||||||||||||||||||||||||||||||||||||||||||||||||||||||||||||||||||||||||||||||||||||||||||||||||||||||||||||||||||||||||||||||||||||||||||||||||||||||||||||||||||
| |
| Phenotypic Information (metabolism pathway, cancer, disease, phenome) |
| |
| |
| Gene-Gene Network Information: Co-Expression Network, Interacting Genes & KEGG |
| |
|


| Gene Summary for SLC25A13 |
| Top |
| Phenotypic Information for SLC25A13(metabolism pathway, cancer, disease, phenome) |
| Cancer | CGAP: SLC25A13 |
| Familial Cancer Database: SLC25A13 | |
| * This gene is included in those cancer gene databases. |
|
|
|
|
|
|
| |||||||||||||||||||||||||||||||||||||||||||||||||||||||||||||||||||||||||||||||||||||||||||||||||||||||||||||||||||||||||||||||||||||||||||||||||||||||||||||||||||||||||||||||||||||||||||||||||||||||||||||||||||||||||||||||||||||||||||||||||||||||||||||||||||||||||||||||||||||||||||||||||||||||||||||||||||||||||||||||||||||||
Oncogene 1 | Significant driver gene in | ||||||||||||||||||||||||||||||||||||||||||||||||||||||||||||||||||||||||||||||||||||||||||||||||||||||||||||||||||||||||||||||||||||||||||||||||||||||||||||||||||||||||||||||||||||||||||||||||||||||||||||||||||||||||||||||||||||||||||||||||||||||||||||||||||||||||||||||||||||||||||||||||||||||||||||||||||||||||||||||||||||||||||||
| cf) number; DB name 1 Oncogene; http://nar.oxfordjournals.org/content/35/suppl_1/D721.long, 2 Tumor Suppressor gene; https://bioinfo.uth.edu/TSGene/, 3 Cancer Gene Census; http://www.nature.com/nrc/journal/v4/n3/abs/nrc1299.html, 4 CancerGenes; http://nar.oxfordjournals.org/content/35/suppl_1/D721.long, 5 Network of Cancer Gene; http://ncg.kcl.ac.uk/index.php, 1Therapeutic Vulnerabilities in Cancer; http://cbio.mskcc.org/cancergenomics/statius/ |
| REACTOME_METABOLISM_OF_PROTEINS REACTOME_METABOLISM_OF_CARBOHYDRATES REACTOME_GLUCOSE_METABOLISM | |
| Mutations for SLC25A13 |
| * Under tables are showing count per each tissue to give us broad intuition about tissue specific mutation patterns.You can go to the detailed page for each mutation database's web site. |
| - Statistics for Tissue and Mutation type | Top |
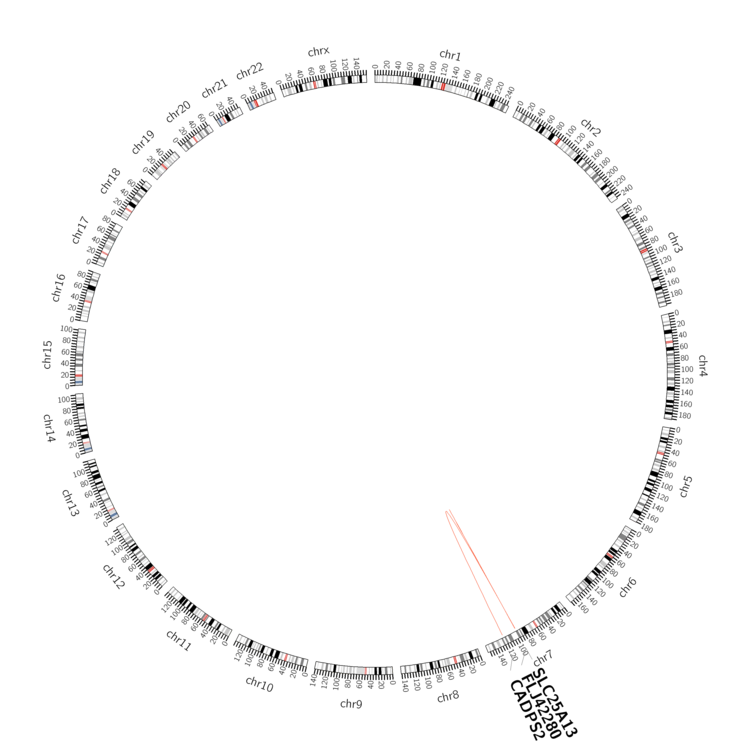 |
| - For Inter-chromosomal Variations |
| There's no inter-chromosomal structural variation. |
| - For Intra-chromosomal Variations |
| * Intra-chromosomal variantions includes 'intrachromosomal amplicon to amplicon', 'intrachromosomal amplicon to non-amplified dna', 'intrachromosomal deletion', 'intrachromosomal fold-back inversion', 'intrachromosomal inversion', 'intrachromosomal tandem duplication', 'Intrachromosomal unknown type', 'intrachromosomal with inverted orientation', 'intrachromosomal with non-inverted orientation'. |
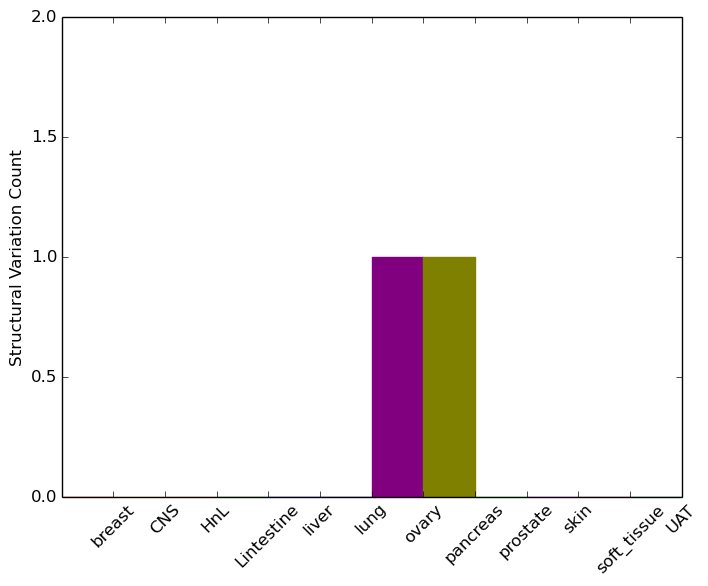 |
| Sample | Symbol_a | Chr_a | Start_a | End_a | Symbol_b | Chr_b | Start_b | End_b |
| ovary | SLC25A13 | chr7 | 95836073 | 95836093 | CADPS2 | chr7 | 122374949 | 122374969 |
| pancreas | SLC25A13 | chr7 | 95852908 | 95852928 | FLJ42280 | chr7 | 96126465 | 96126485 |
| cf) Tissue number; Tissue name (1;Breast, 2;Central_nervous_system, 3;Haematopoietic_and_lymphoid_tissue, 4;Large_intestine, 5;Liver, 6;Lung, 7;Ovary, 8;Pancreas, 9;Prostate, 10;Skin, 11;Soft_tissue, 12;Upper_aerodigestive_tract) |
| * From mRNA Sanger sequences, Chitars2.0 arranged chimeric transcripts. This table shows SLC25A13 related fusion information. |
| ID | Head Gene | Tail Gene | Accession | Gene_a | qStart_a | qEnd_a | Chromosome_a | tStart_a | tEnd_a | Gene_a | qStart_a | qEnd_a | Chromosome_a | tStart_a | tEnd_a |
| DA535064 | ZNF736 | 1 | 221 | 7 | 63774311 | 63774531 | SLC25A13 | 221 | 551 | 7 | 95820517 | 95838290 | |
| BE072029 | SLC25A13 | 1 | 132 | 7 | 95786736 | 95786868 | SLC25A13 | 127 | 311 | 7 | 95786152 | 95786336 | |
| BI480726 | CDK6 | 12 | 95 | 7 | 92352483 | 92352566 | SLC25A13 | 87 | 686 | 7 | 95766458 | 95767055 | |
| Top |
| Mutation type/ Tissue ID | brca | cns | cerv | endome | haematopo | kidn | Lintest | liver | lung | ns | ovary | pancre | prost | skin | stoma | thyro | urina | |||
| Total # sample | 1 | 3 | 1 | 3 | ||||||||||||||||
| GAIN (# sample) | 1 | 3 | 3 | |||||||||||||||||
| LOSS (# sample) | 1 |
| cf) Tissue ID; Tissue type (1; Breast, 2; Central_nervous_system, 3; Cervix, 4; Endometrium, 5; Haematopoietic_and_lymphoid_tissue, 6; Kidney, 7; Large_intestine, 8; Liver, 9; Lung, 10; NS, 11; Ovary, 12; Pancreas, 13; Prostate, 14; Skin, 15; Stomach, 16; Thyroid, 17; Urinary_tract) |
| Top |
|
 |
| Top |
| Stat. for Non-Synonymous SNVs (# total SNVs=72) | (# total SNVs=24) |
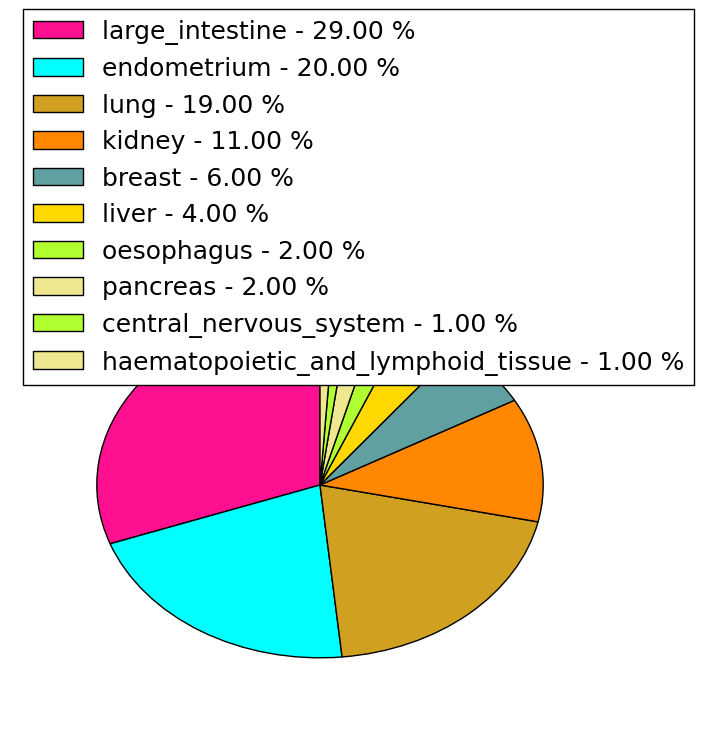 | 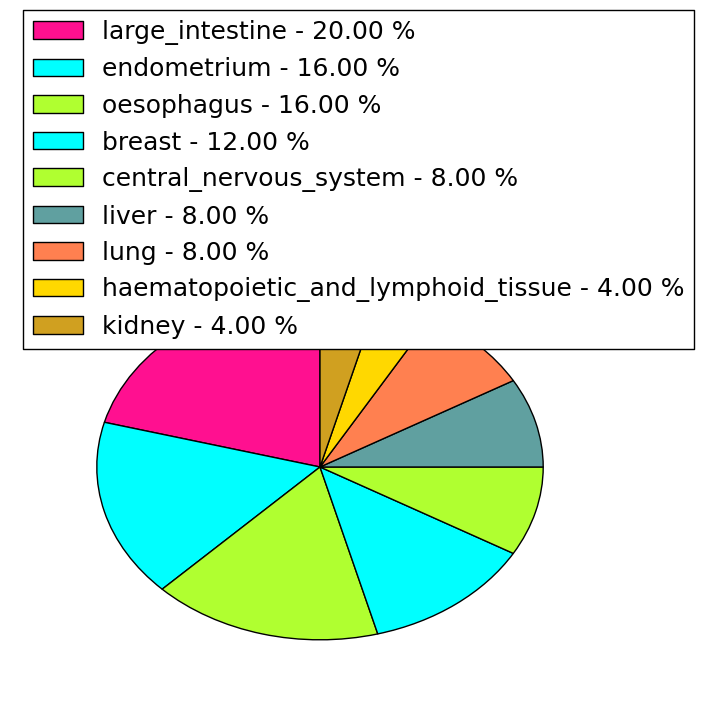 |
(# total SNVs=2) | (# total SNVs=3) |
 |  |
| Top |
| * When you move the cursor on each content, you can see more deailed mutation information on the Tooltip. Those are primary_site,primary_histology,mutation(aa),pubmedID. |
| GRCh37 position | Mutation(aa) | Unique sampleID count |
| chr7:95775866-95775866 | p.? | 32 |
| chr7:95799433-95799433 | p.N412S | 7 |
| chr7:95813609-95813609 | p.G386D | 2 |
| chr7:95838255-95838255 | p.I121I | 2 |
| chr7:95820501-95820501 | p.S225L | 2 |
| chr7:95926239-95926239 | p.P14S | 2 |
| chr7:95820524-95820524 | p.F217L | 2 |
| chr7:95799390-95799390 | p.V426V | 2 |
| chr7:95818905-95818905 | p.Y279C | 2 |
| chr7:95799394-95799394 | p.S425L | 2 |
| Top |
|
 |
| Point Mutation/ Tissue ID | 1 | 2 | 3 | 4 | 5 | 6 | 7 | 8 | 9 | 10 | 11 | 12 | 13 | 14 | 15 | 16 | 17 | 18 | 19 | 20 |
| # sample | 6 | 19 | 1 | 2 | 3 | 1 | 7 | 4 | 1 | 9 | 6 | 1 | 13 | |||||||
| # mutation | 6 | 13 | 1 | 2 | 3 | 1 | 8 | 4 | 1 | 9 | 9 | 1 | 16 | |||||||
| nonsynonymous SNV | 4 | 10 | 1 | 2 | 3 | 6 | 4 | 7 | 7 | 1 | 12 | |||||||||
| synonymous SNV | 2 | 3 | 1 | 2 | 1 | 2 | 2 | 4 |
| cf) Tissue ID; Tissue type (1; BLCA[Bladder Urothelial Carcinoma], 2; BRCA[Breast invasive carcinoma], 3; CESC[Cervical squamous cell carcinoma and endocervical adenocarcinoma], 4; COAD[Colon adenocarcinoma], 5; GBM[Glioblastoma multiforme], 6; Glioma Low Grade, 7; HNSC[Head and Neck squamous cell carcinoma], 8; KICH[Kidney Chromophobe], 9; KIRC[Kidney renal clear cell carcinoma], 10; KIRP[Kidney renal papillary cell carcinoma], 11; LAML[Acute Myeloid Leukemia], 12; LUAD[Lung adenocarcinoma], 13; LUSC[Lung squamous cell carcinoma], 14; OV[Ovarian serous cystadenocarcinoma ], 15; PAAD[Pancreatic adenocarcinoma], 16; PRAD[Prostate adenocarcinoma], 17; SKCM[Skin Cutaneous Melanoma], 18:STAD[Stomach adenocarcinoma], 19:THCA[Thyroid carcinoma], 20:UCEC[Uterine Corpus Endometrial Carcinoma]) |
| Top |
| * We represented just top 10 SNVs. When you move the cursor on each content, you can see more deailed mutation information on the Tooltip. Those are primary_site, primary_histology, mutation(aa), pubmedID. |
| Genomic Position | Mutation(aa) | Unique sampleID count |
| chr7:95799433 | p.N413S,SLC25A13 | 7 |
| chr7:95799394 | p.F217L,SLC25A13 | 2 |
| chr7:95820501 | p.S426L,SLC25A13 | 2 |
| chr7:95820524 | p.R284H,SLC25A13 | 2 |
| chr7:95818688 | p.G650G,SLC25A13 | 2 |
| chr7:95750584 | p.S225L,SLC25A13 | 2 |
| chr7:95775995 | p.T647I,SLC25A13 | 1 |
| chr7:95822393 | p.S470I,SLC25A13 | 1 |
| chr7:95750587 | p.V338V,SLC25A13 | 1 |
| chr7:95813738 | p.N30N,SLC25A13 | 1 |
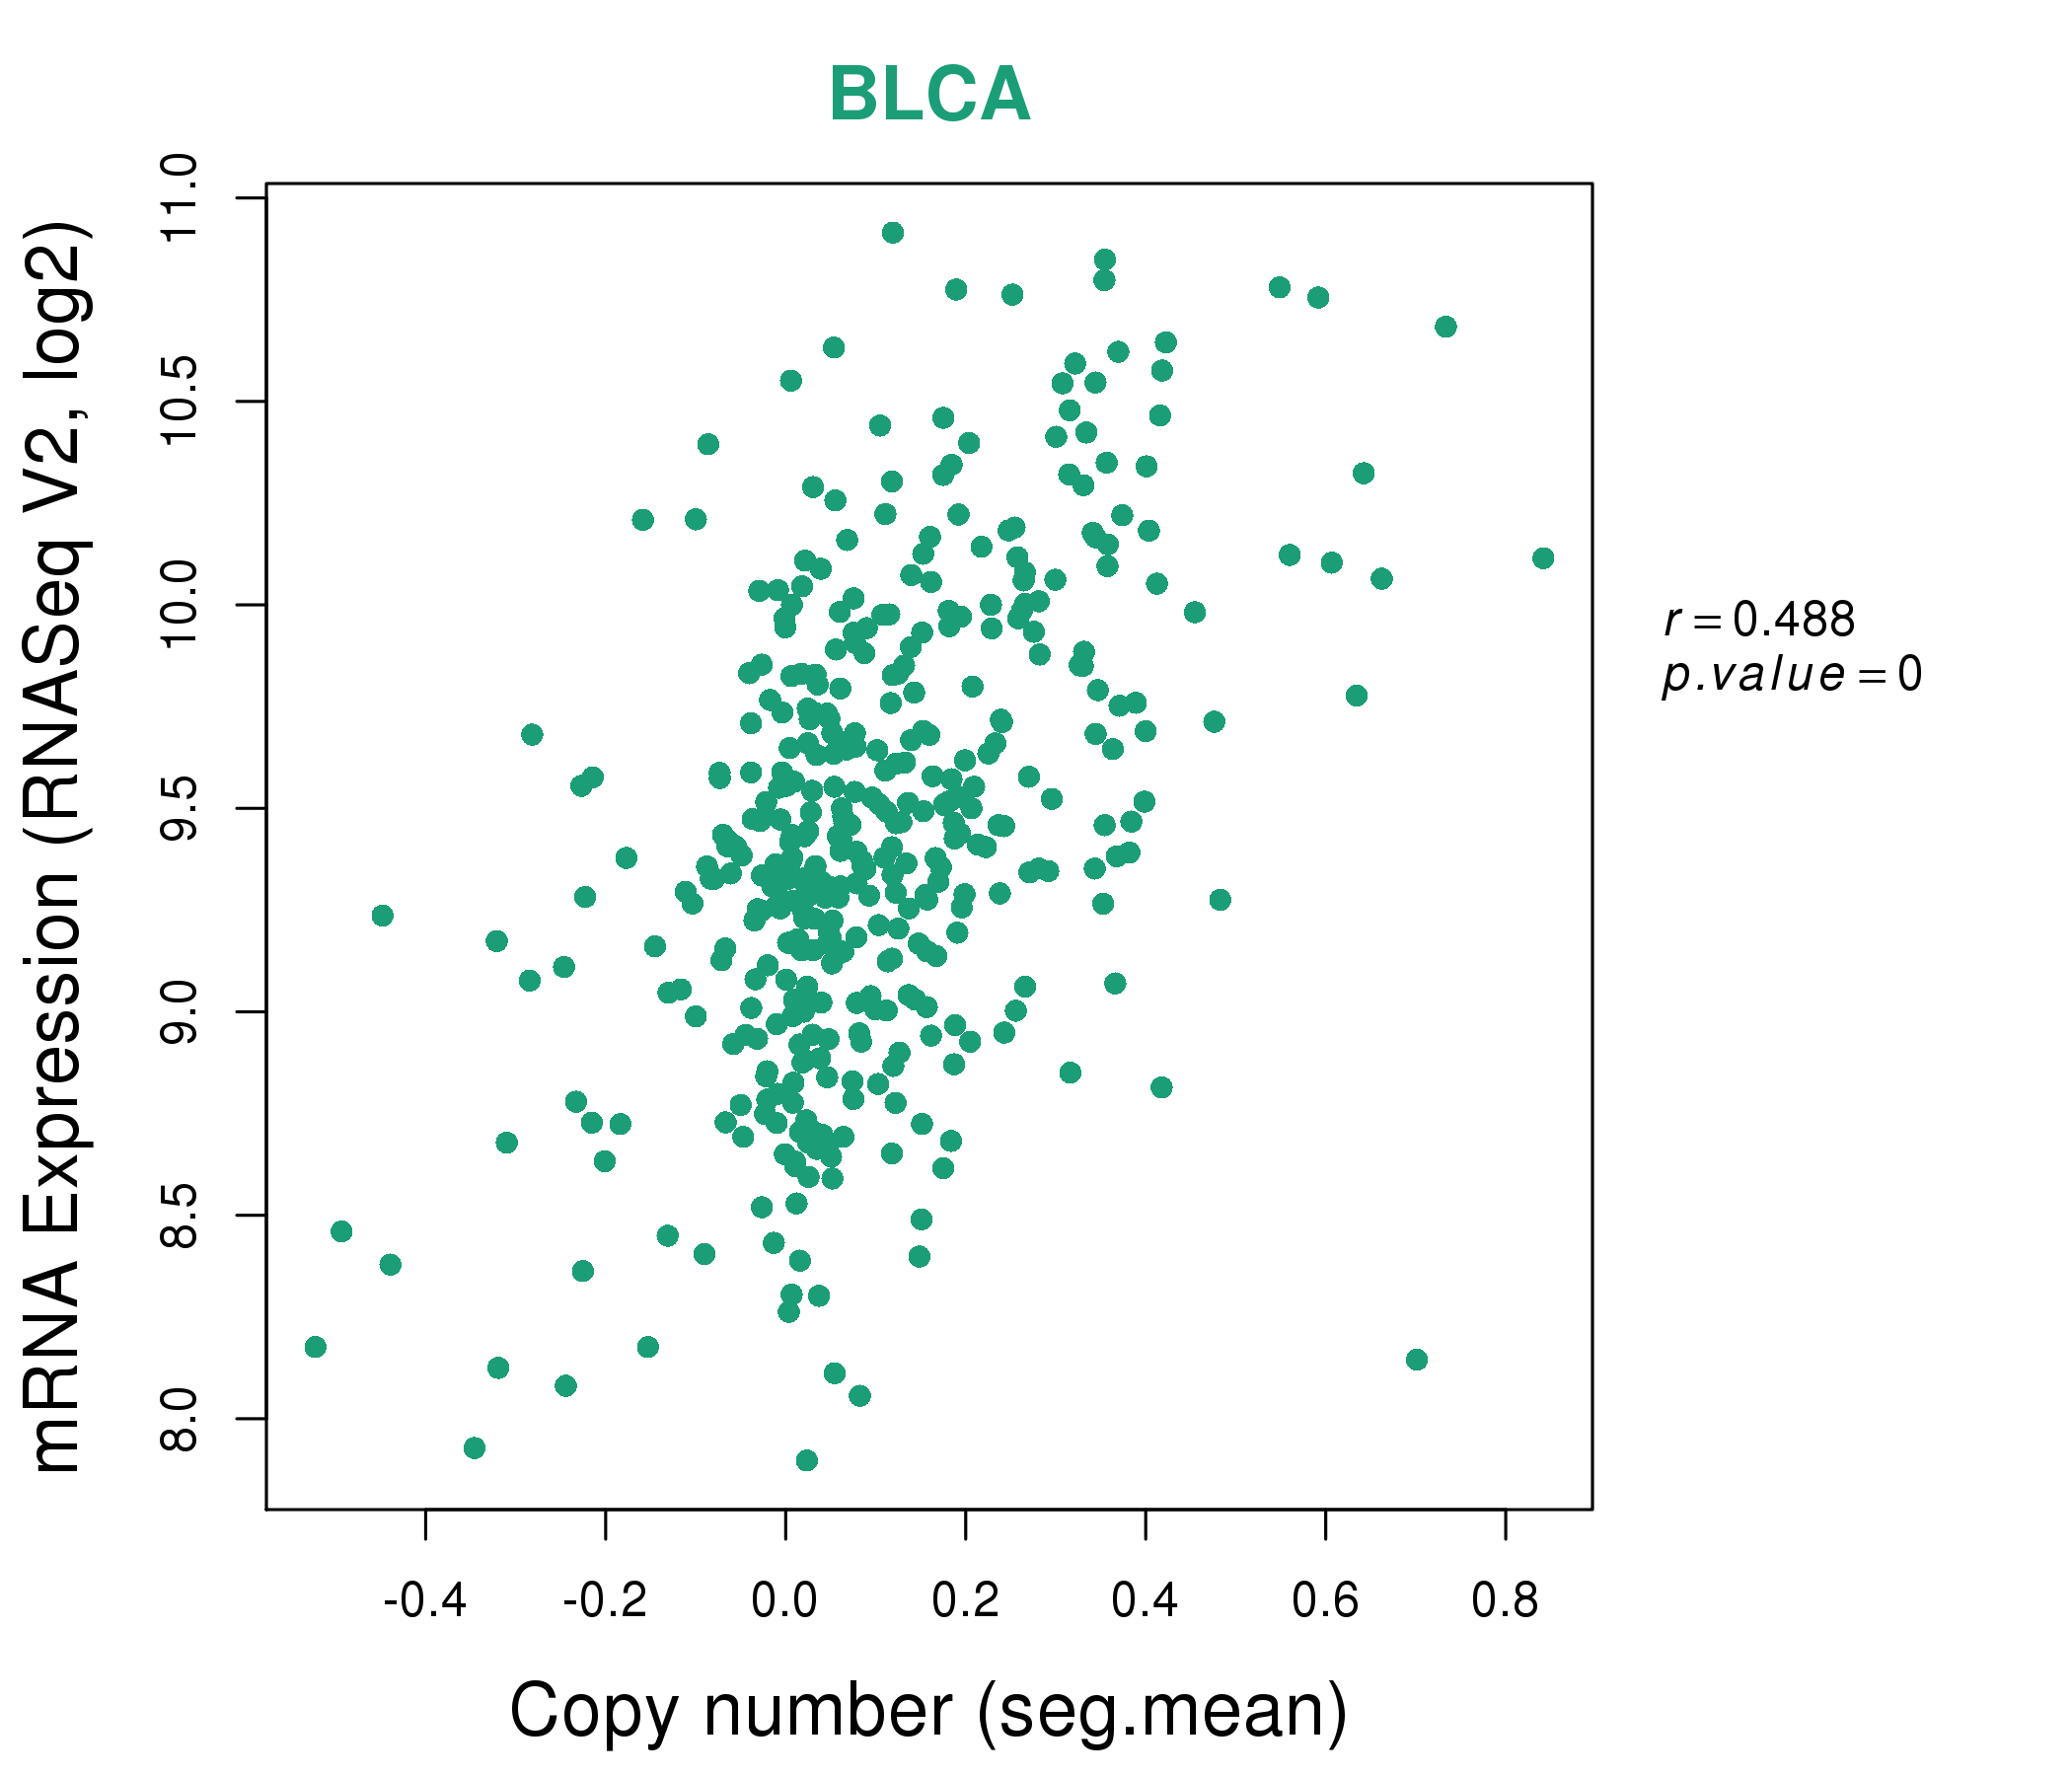
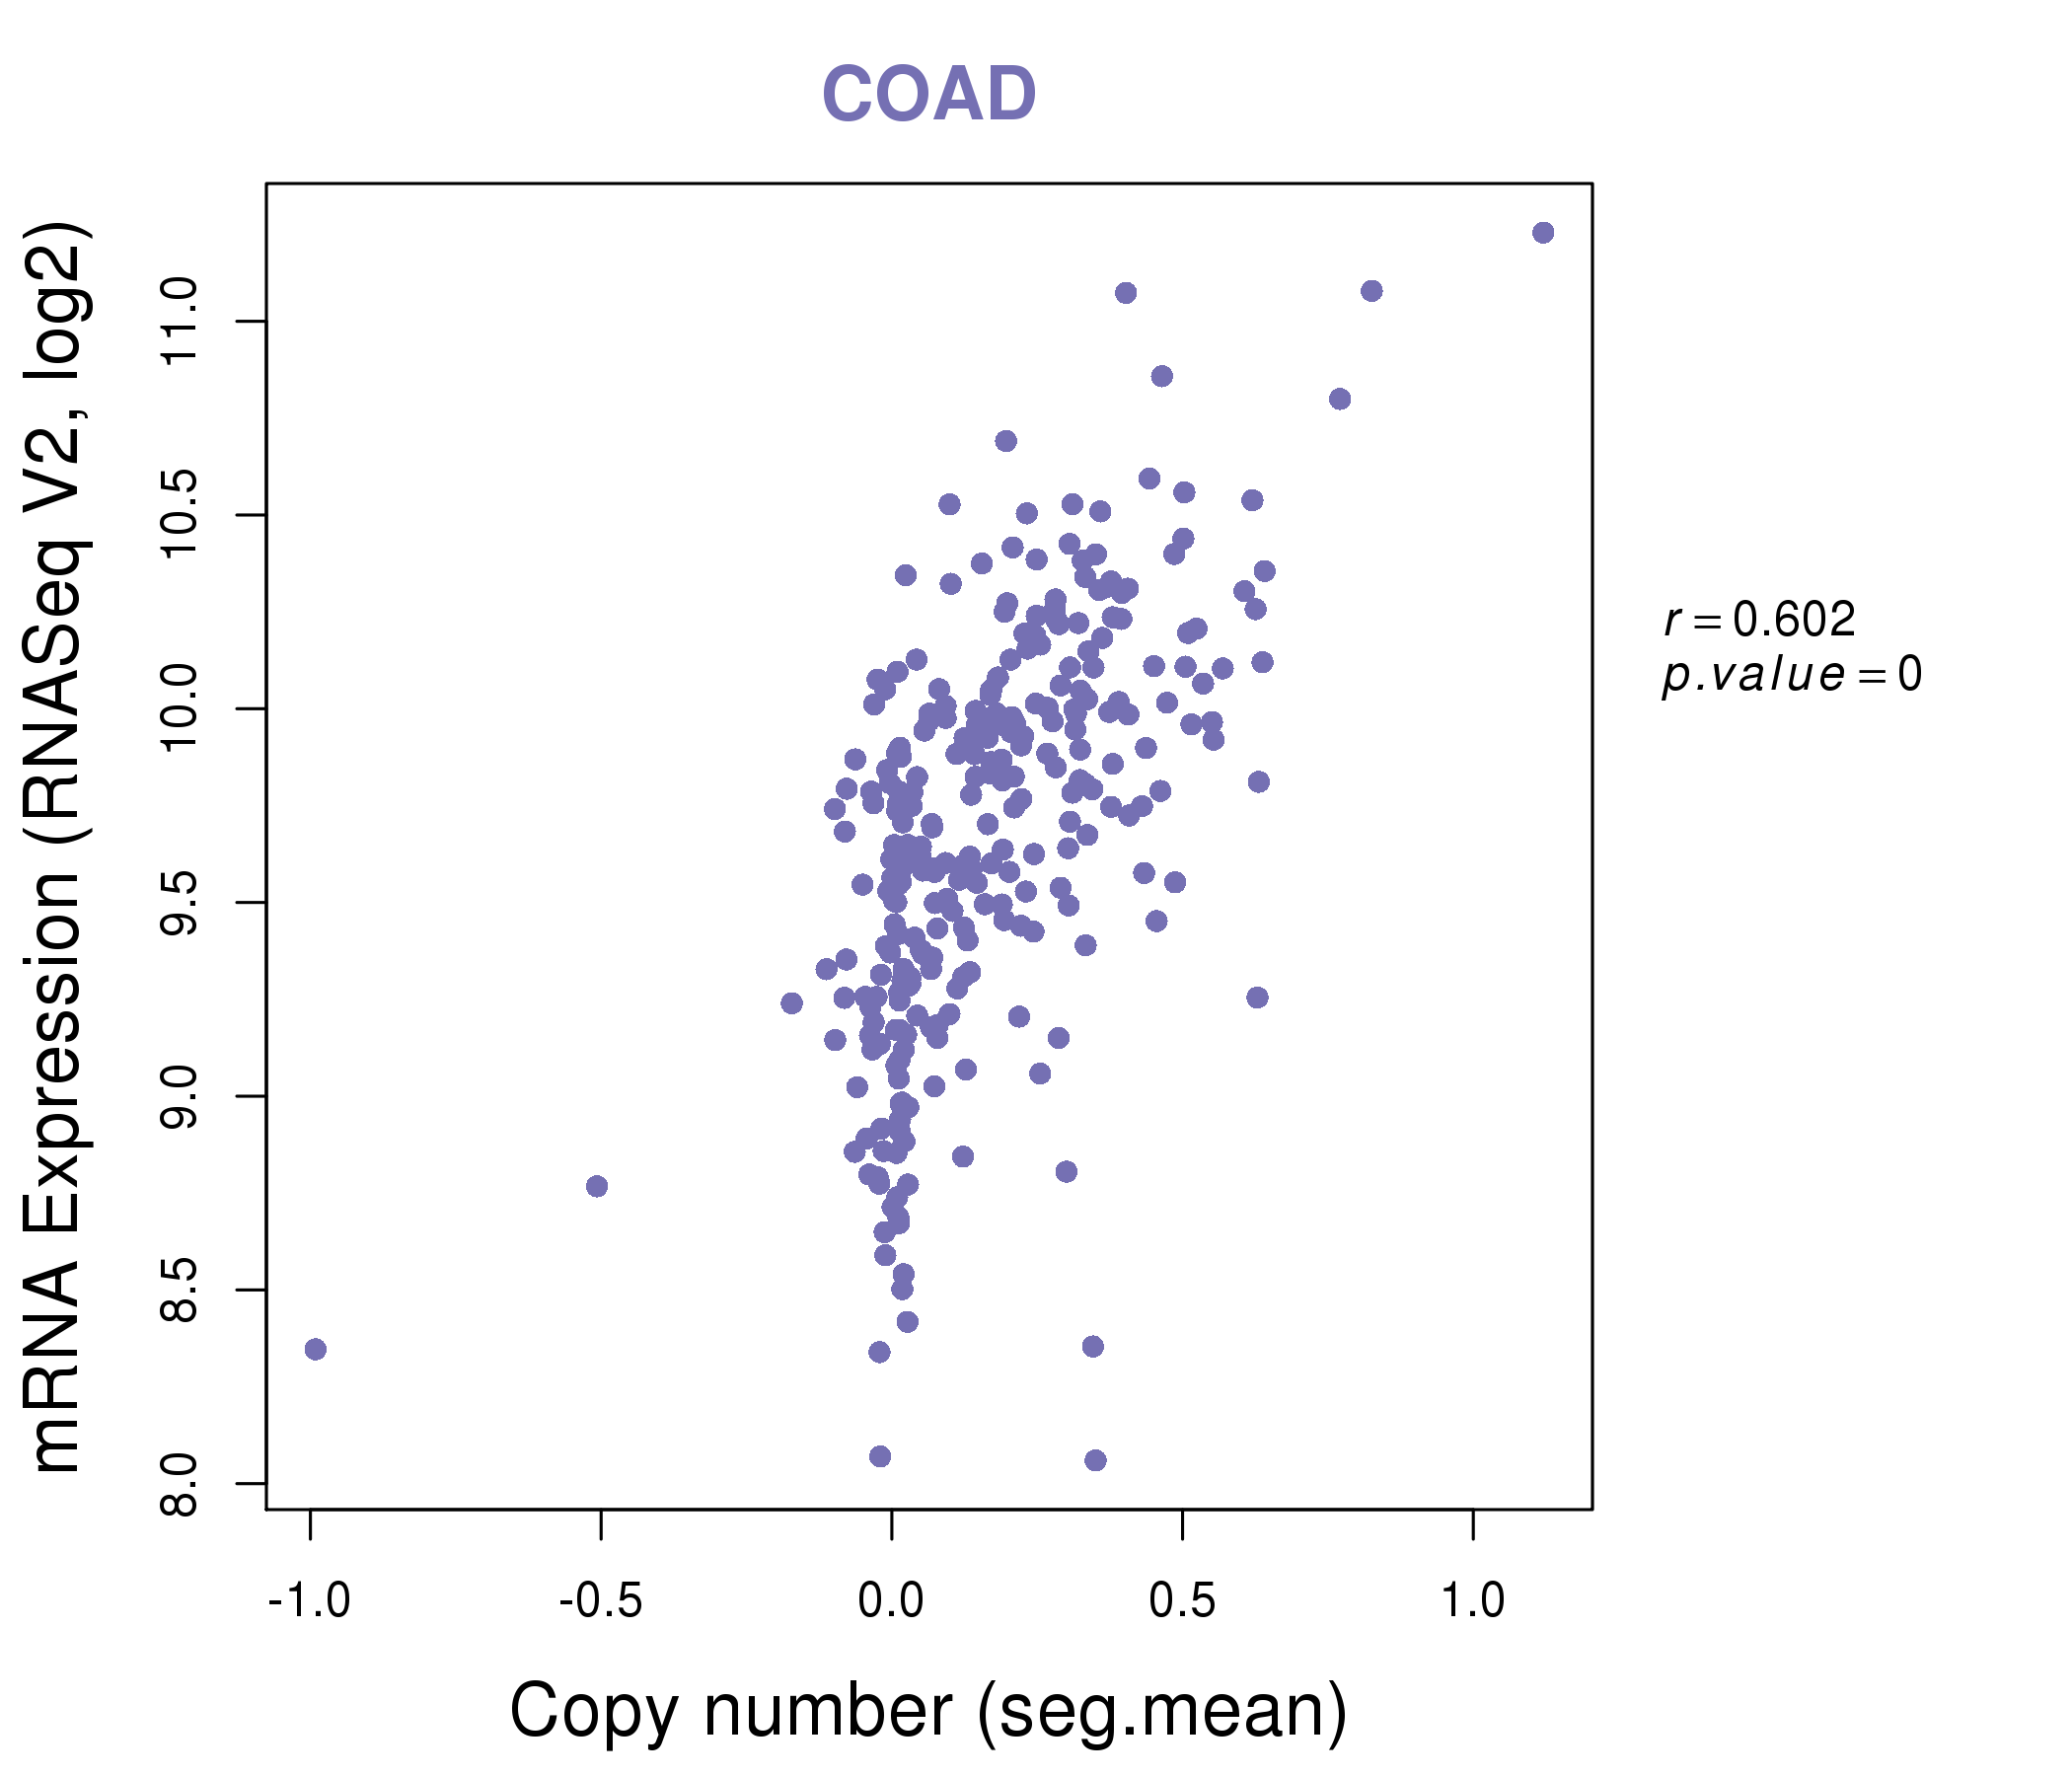
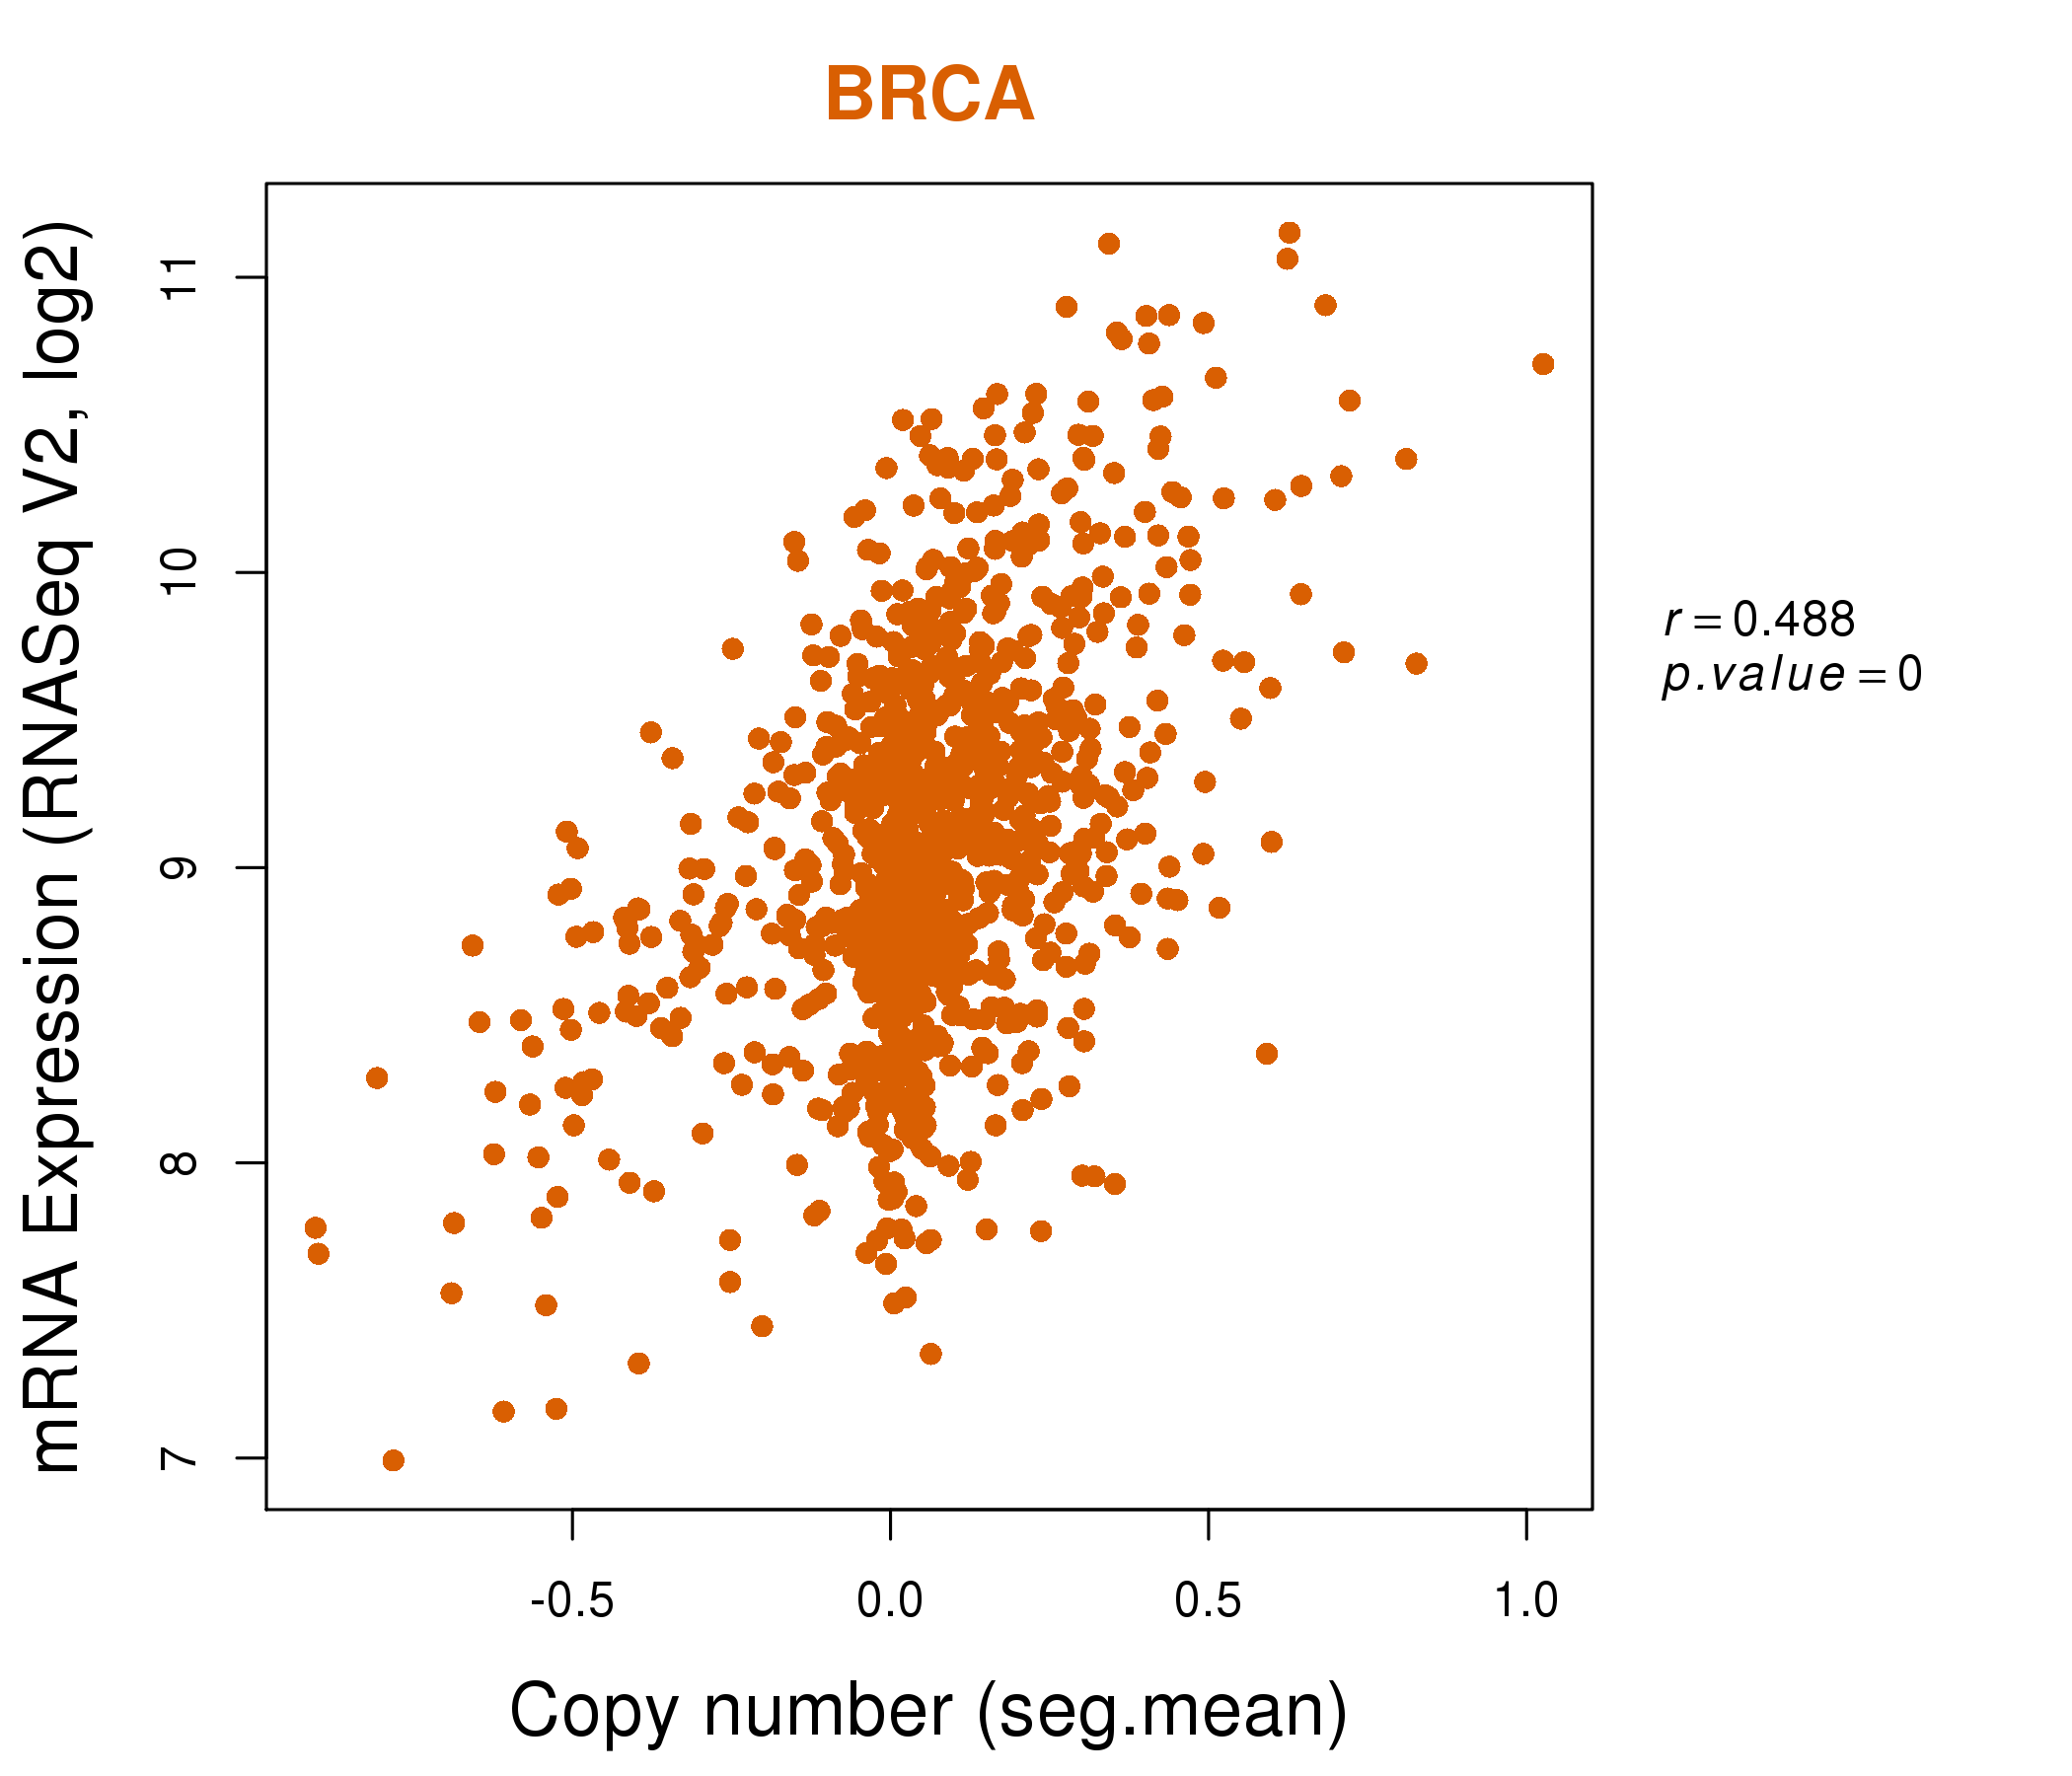
| * Copy number data were extracted from TCGA using R package TCGA-Assembler. The URLs of all public data files on TCGA DCC data server were gathered on Jan-05-2015. Function ProcessCNAData in TCGA-Assembler package was used to obtain gene-level copy number value which is calculated as the average copy number of the genomic region of a gene. |
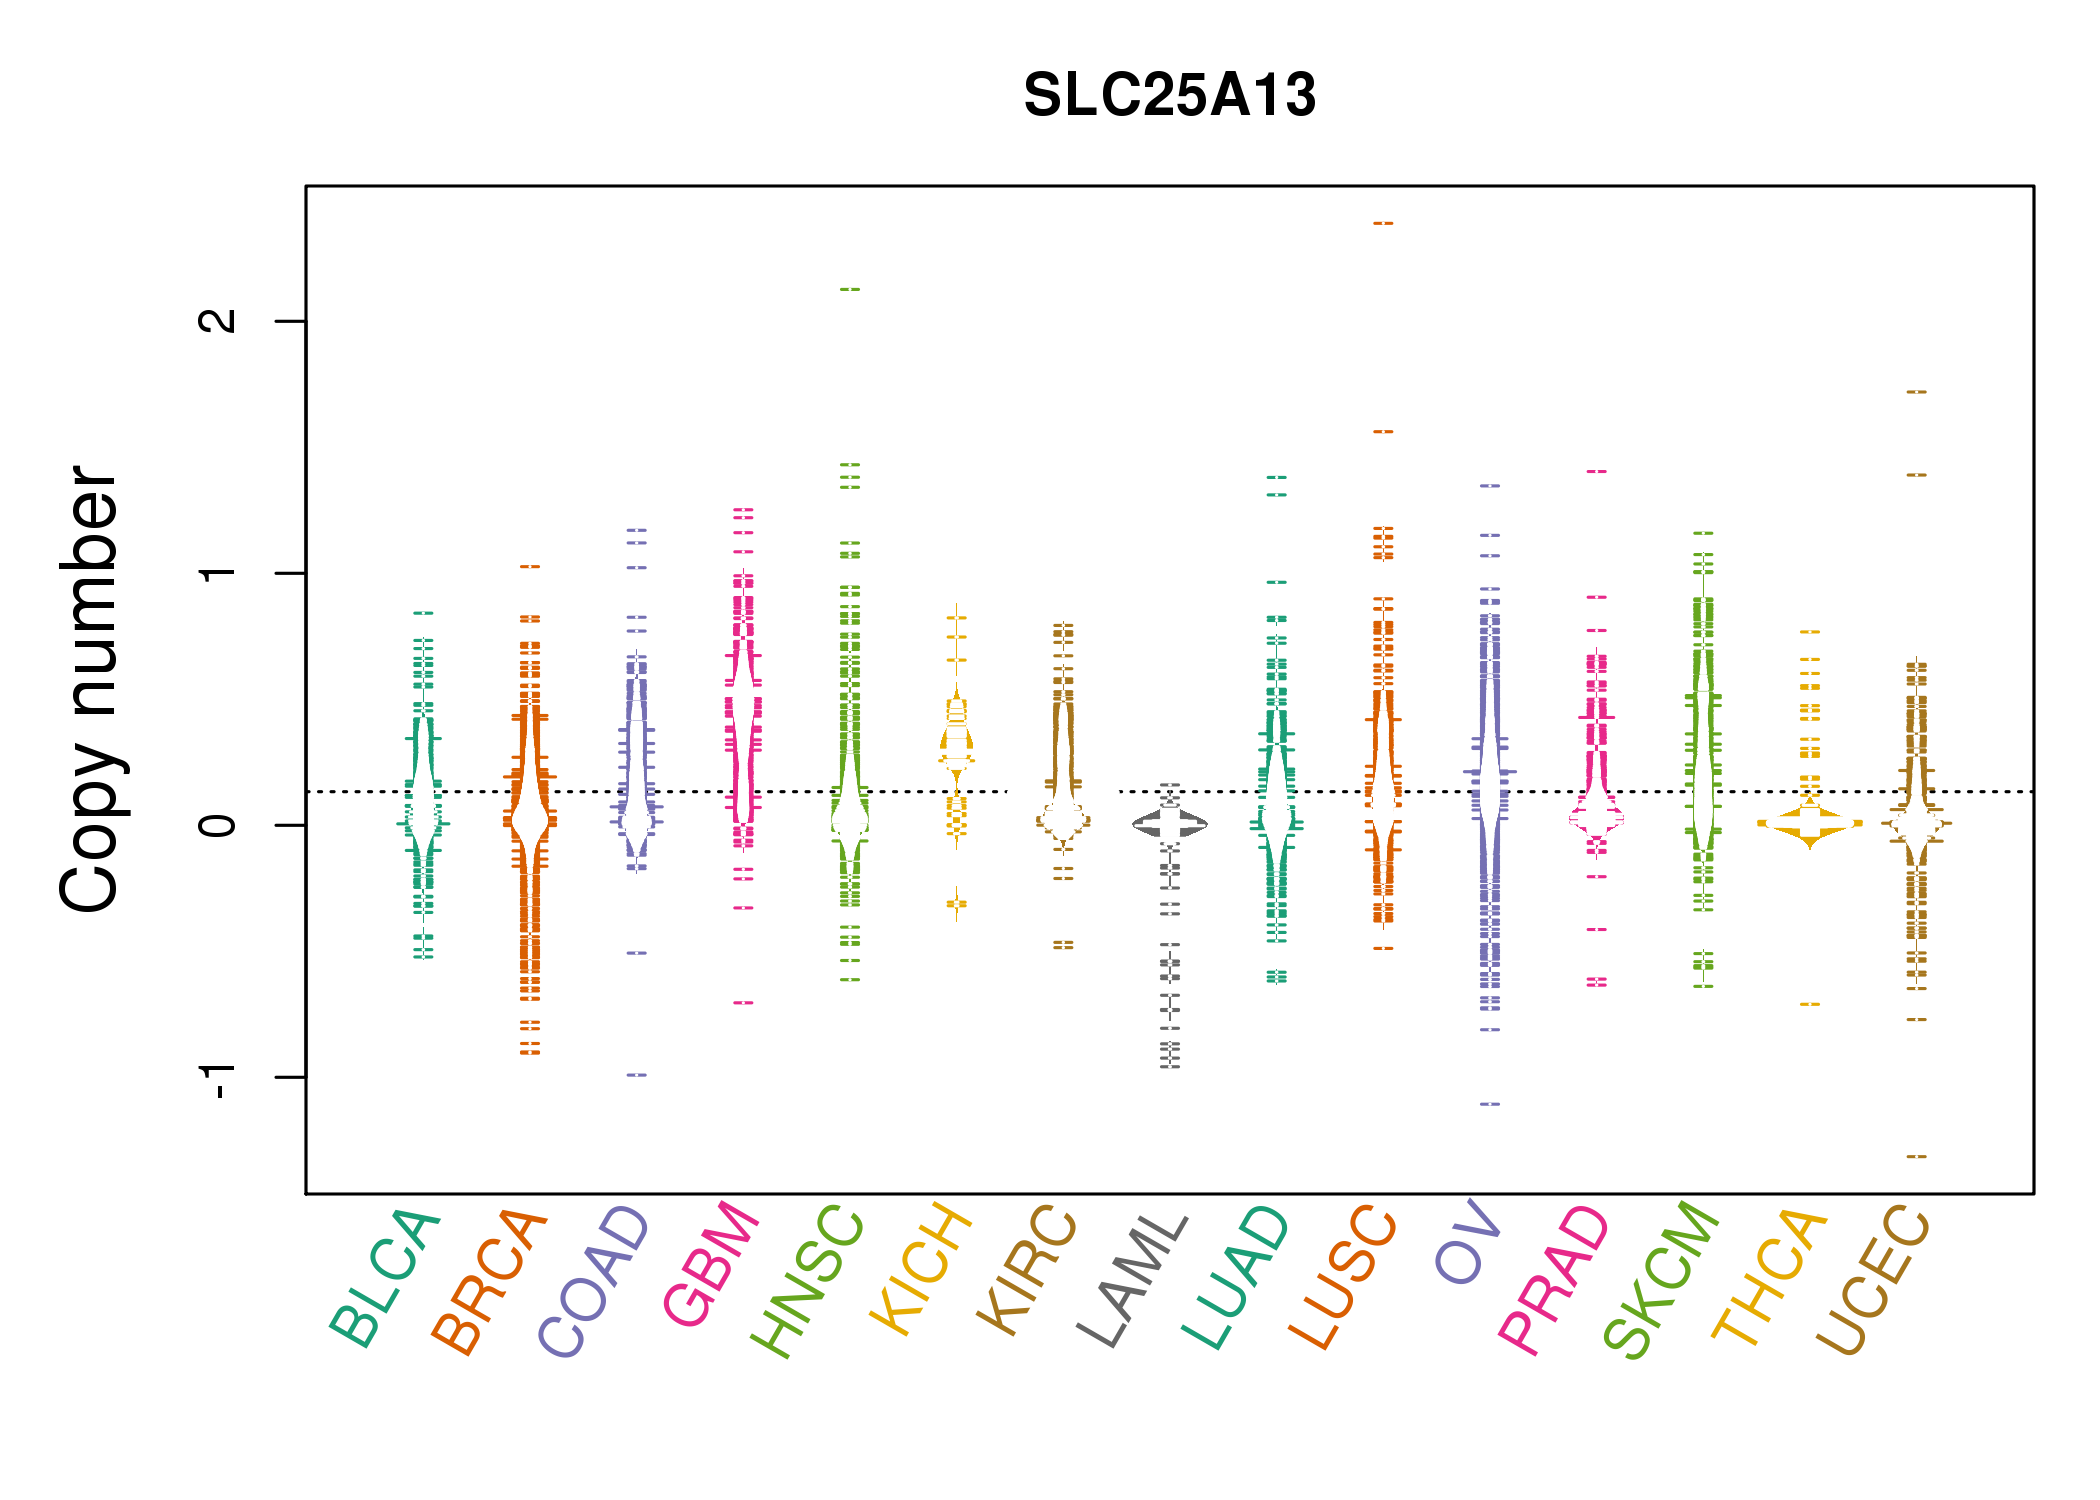 |
| cf) Tissue ID[Tissue type]: BLCA[Bladder Urothelial Carcinoma], BRCA[Breast invasive carcinoma], CESC[Cervical squamous cell carcinoma and endocervical adenocarcinoma], COAD[Colon adenocarcinoma], GBM[Glioblastoma multiforme], Glioma Low Grade, HNSC[Head and Neck squamous cell carcinoma], KICH[Kidney Chromophobe], KIRC[Kidney renal clear cell carcinoma], KIRP[Kidney renal papillary cell carcinoma], LAML[Acute Myeloid Leukemia], LUAD[Lung adenocarcinoma], LUSC[Lung squamous cell carcinoma], OV[Ovarian serous cystadenocarcinoma ], PAAD[Pancreatic adenocarcinoma], PRAD[Prostate adenocarcinoma], SKCM[Skin Cutaneous Melanoma], STAD[Stomach adenocarcinoma], THCA[Thyroid carcinoma], UCEC[Uterine Corpus Endometrial Carcinoma] |
| Top |
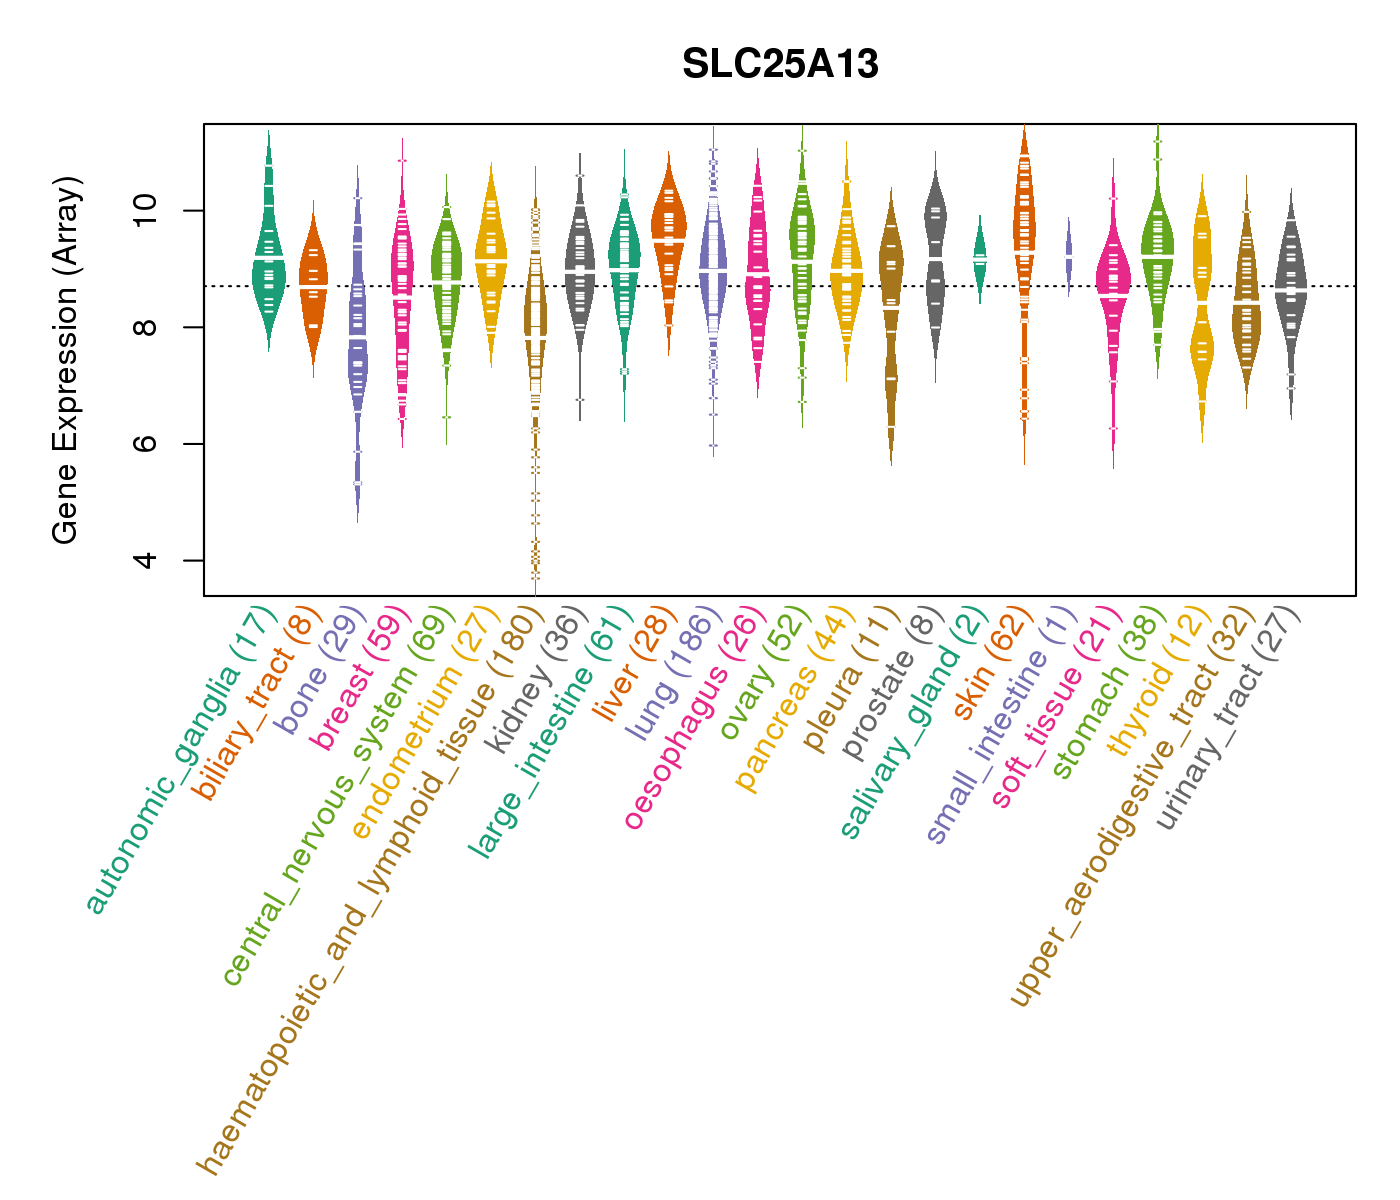
| Gene Expression for SLC25A13 |
| * CCLE gene expression data were extracted from CCLE_Expression_Entrez_2012-10-18.res: Gene-centric RMA-normalized mRNA expression data. |
 |
| * Normalized gene expression data of RNASeqV2 was extracted from TCGA using R package TCGA-Assembler. The URLs of all public data files on TCGA DCC data server were gathered at Jan-05-2015. Only eight cancer types have enough normal control samples for differential expression analysis. (t test, adjusted p<0.05 (using Benjamini-Hochberg FDR)) |
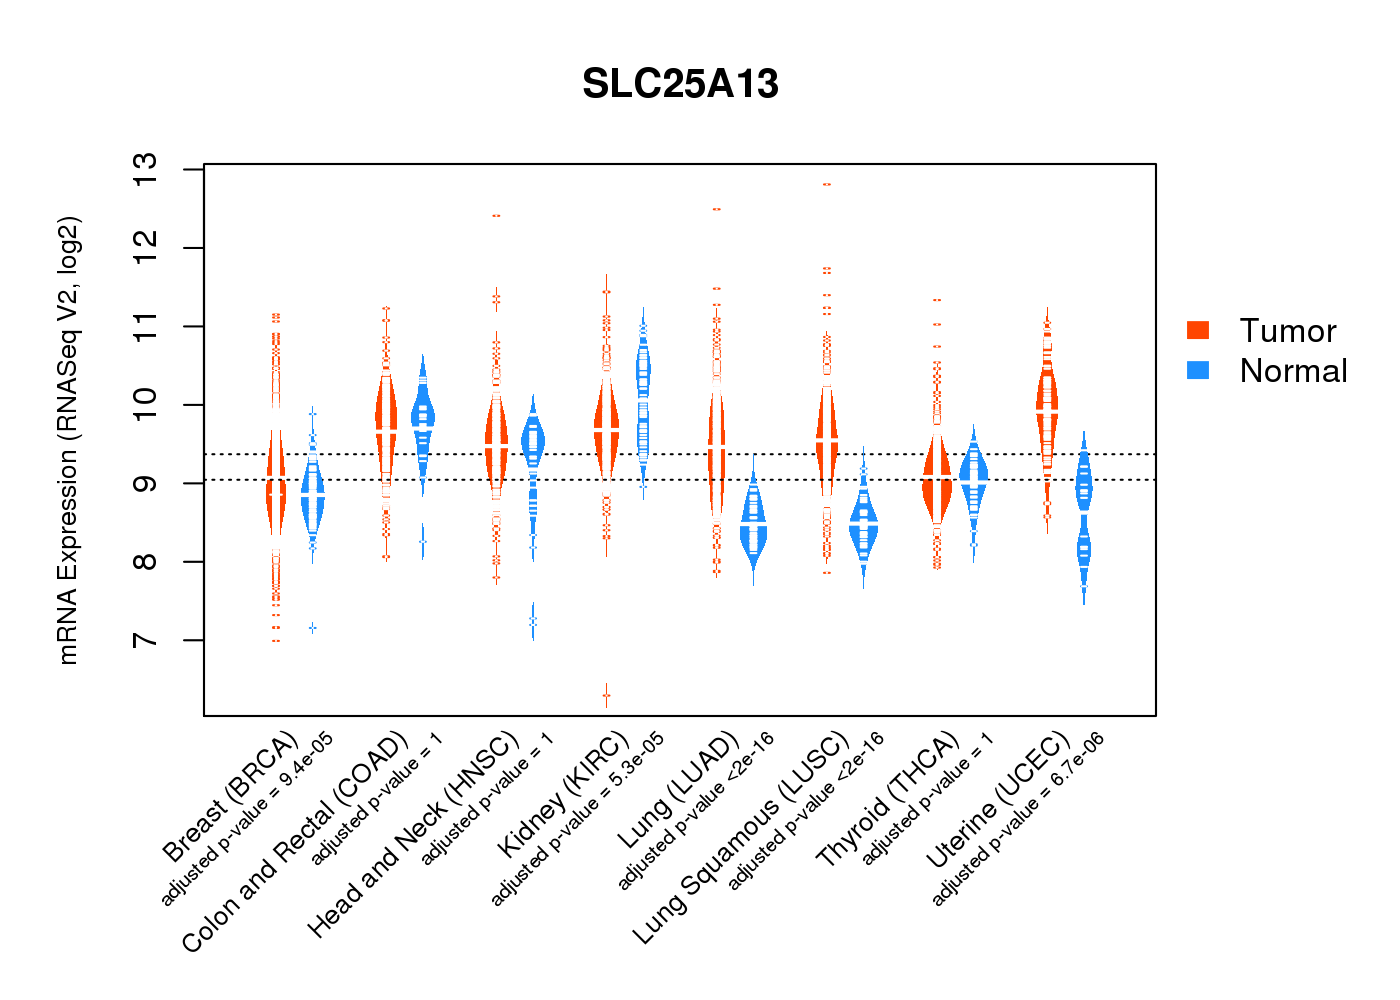 |
| Top |
| * This plots show the correlation between CNV and gene expression. |
: Open all plots for all cancer types
 |
|
 |
|

| Top |
| Gene-Gene Network Information |
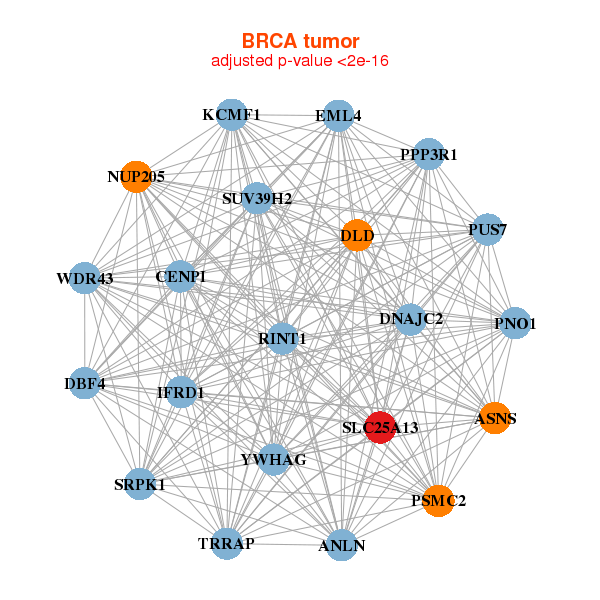
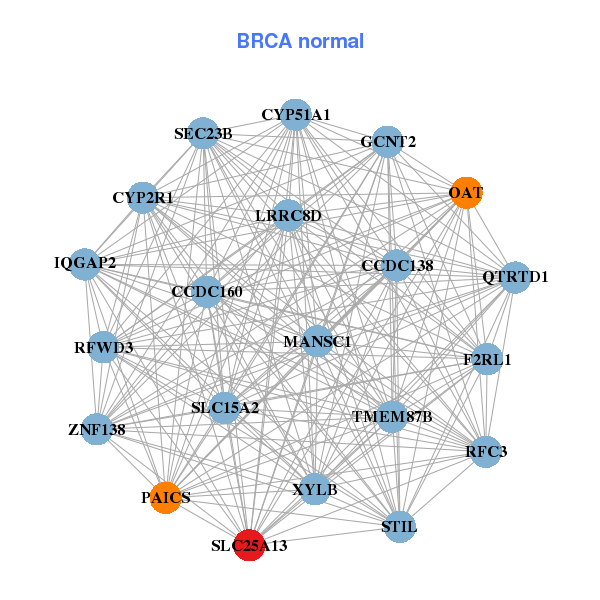
| * Co-Expression network figures were drawn using R package igraph. Only the top 20 genes with the highest correlations were shown. Red circle: input gene, orange circle: cell metabolism gene, sky circle: other gene |
: Open all plots for all cancer types
 |
| ||||
| ANLN,ASNS,CENPI,DBF4,DLD,DNAJC2,EML4, IFRD1,KCMF1,NUP205,PNO1,PPP3R1,PSMC2,PUS7, RINT1,SLC25A13,SRPK1,SUV39H2,TRRAP,WDR43,YWHAG | CCDC138,CCDC160,CYP2R1,CYP51A1,F2RL1,GCNT2,IQGAP2, LRRC8D,MANSC1,OAT,PAICS,QTRTD1,RFC3,RFWD3, SEC23B,SLC15A2,SLC25A13,STIL,TMEM87B,XYLB,ZNF138 | ||||
 |
| ||||
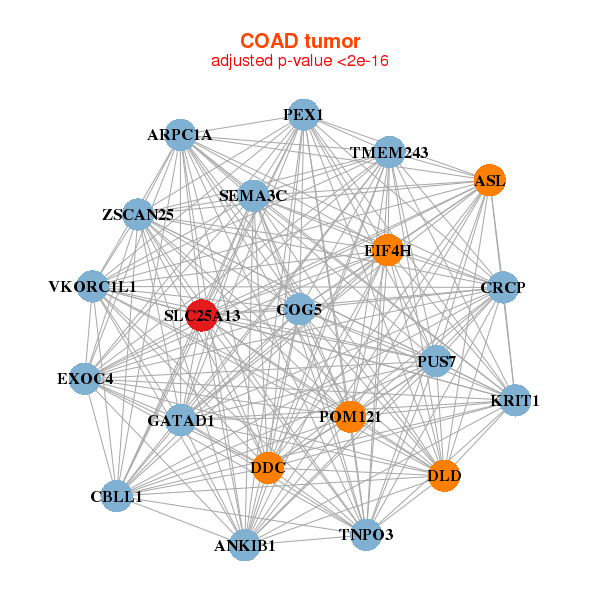
| ANKIB1,ARPC1A,ASL,TMEM243,CBLL1,COG5,CRCP, DDC,DLD,EIF4H,EXOC4,GATAD1,KRIT1,PEX1, POM121,PUS7,SEMA3C,SLC25A13,TNPO3,VKORC1L1,ZSCAN25 | ABCD3,ACTR2,MCU,FAR2,GJB2,IQGAP2,ITGB6, LETM1,NDUFS2,NIPA2,PAPSS2,PDCD6IP,PGGT1B,PRSS12, PTBP3,SLC25A13,SLC44A1,TGFA,UGDH,UGT1A10,UGT1A8 |
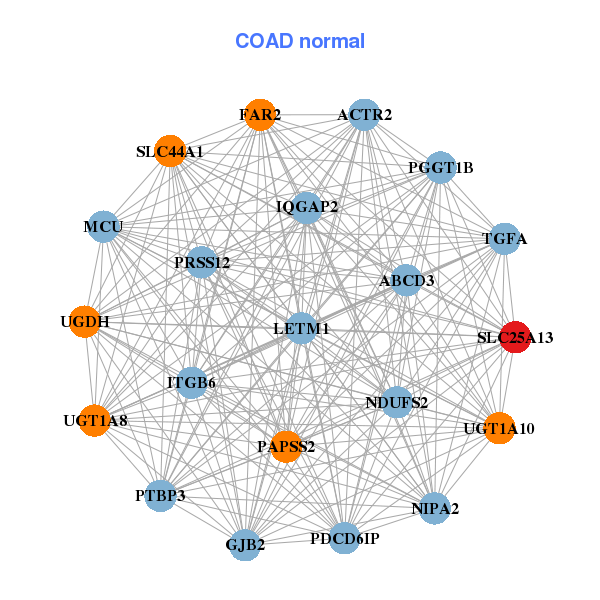
| * Co-Expression network figures were drawn using R package igraph. Only the top 20 genes with the highest correlations were shown. Red circle: input gene, orange circle: cell metabolism gene, sky circle: other gene |
: Open all plots for all cancer types
| Top |
: Open all interacting genes' information including KEGG pathway for all interacting genes from DAVID
| Top |
| Pharmacological Information for SLC25A13 |
| DB Category | DB Name | DB's ID and Url link |
| * Gene Centered Interaction Network. |
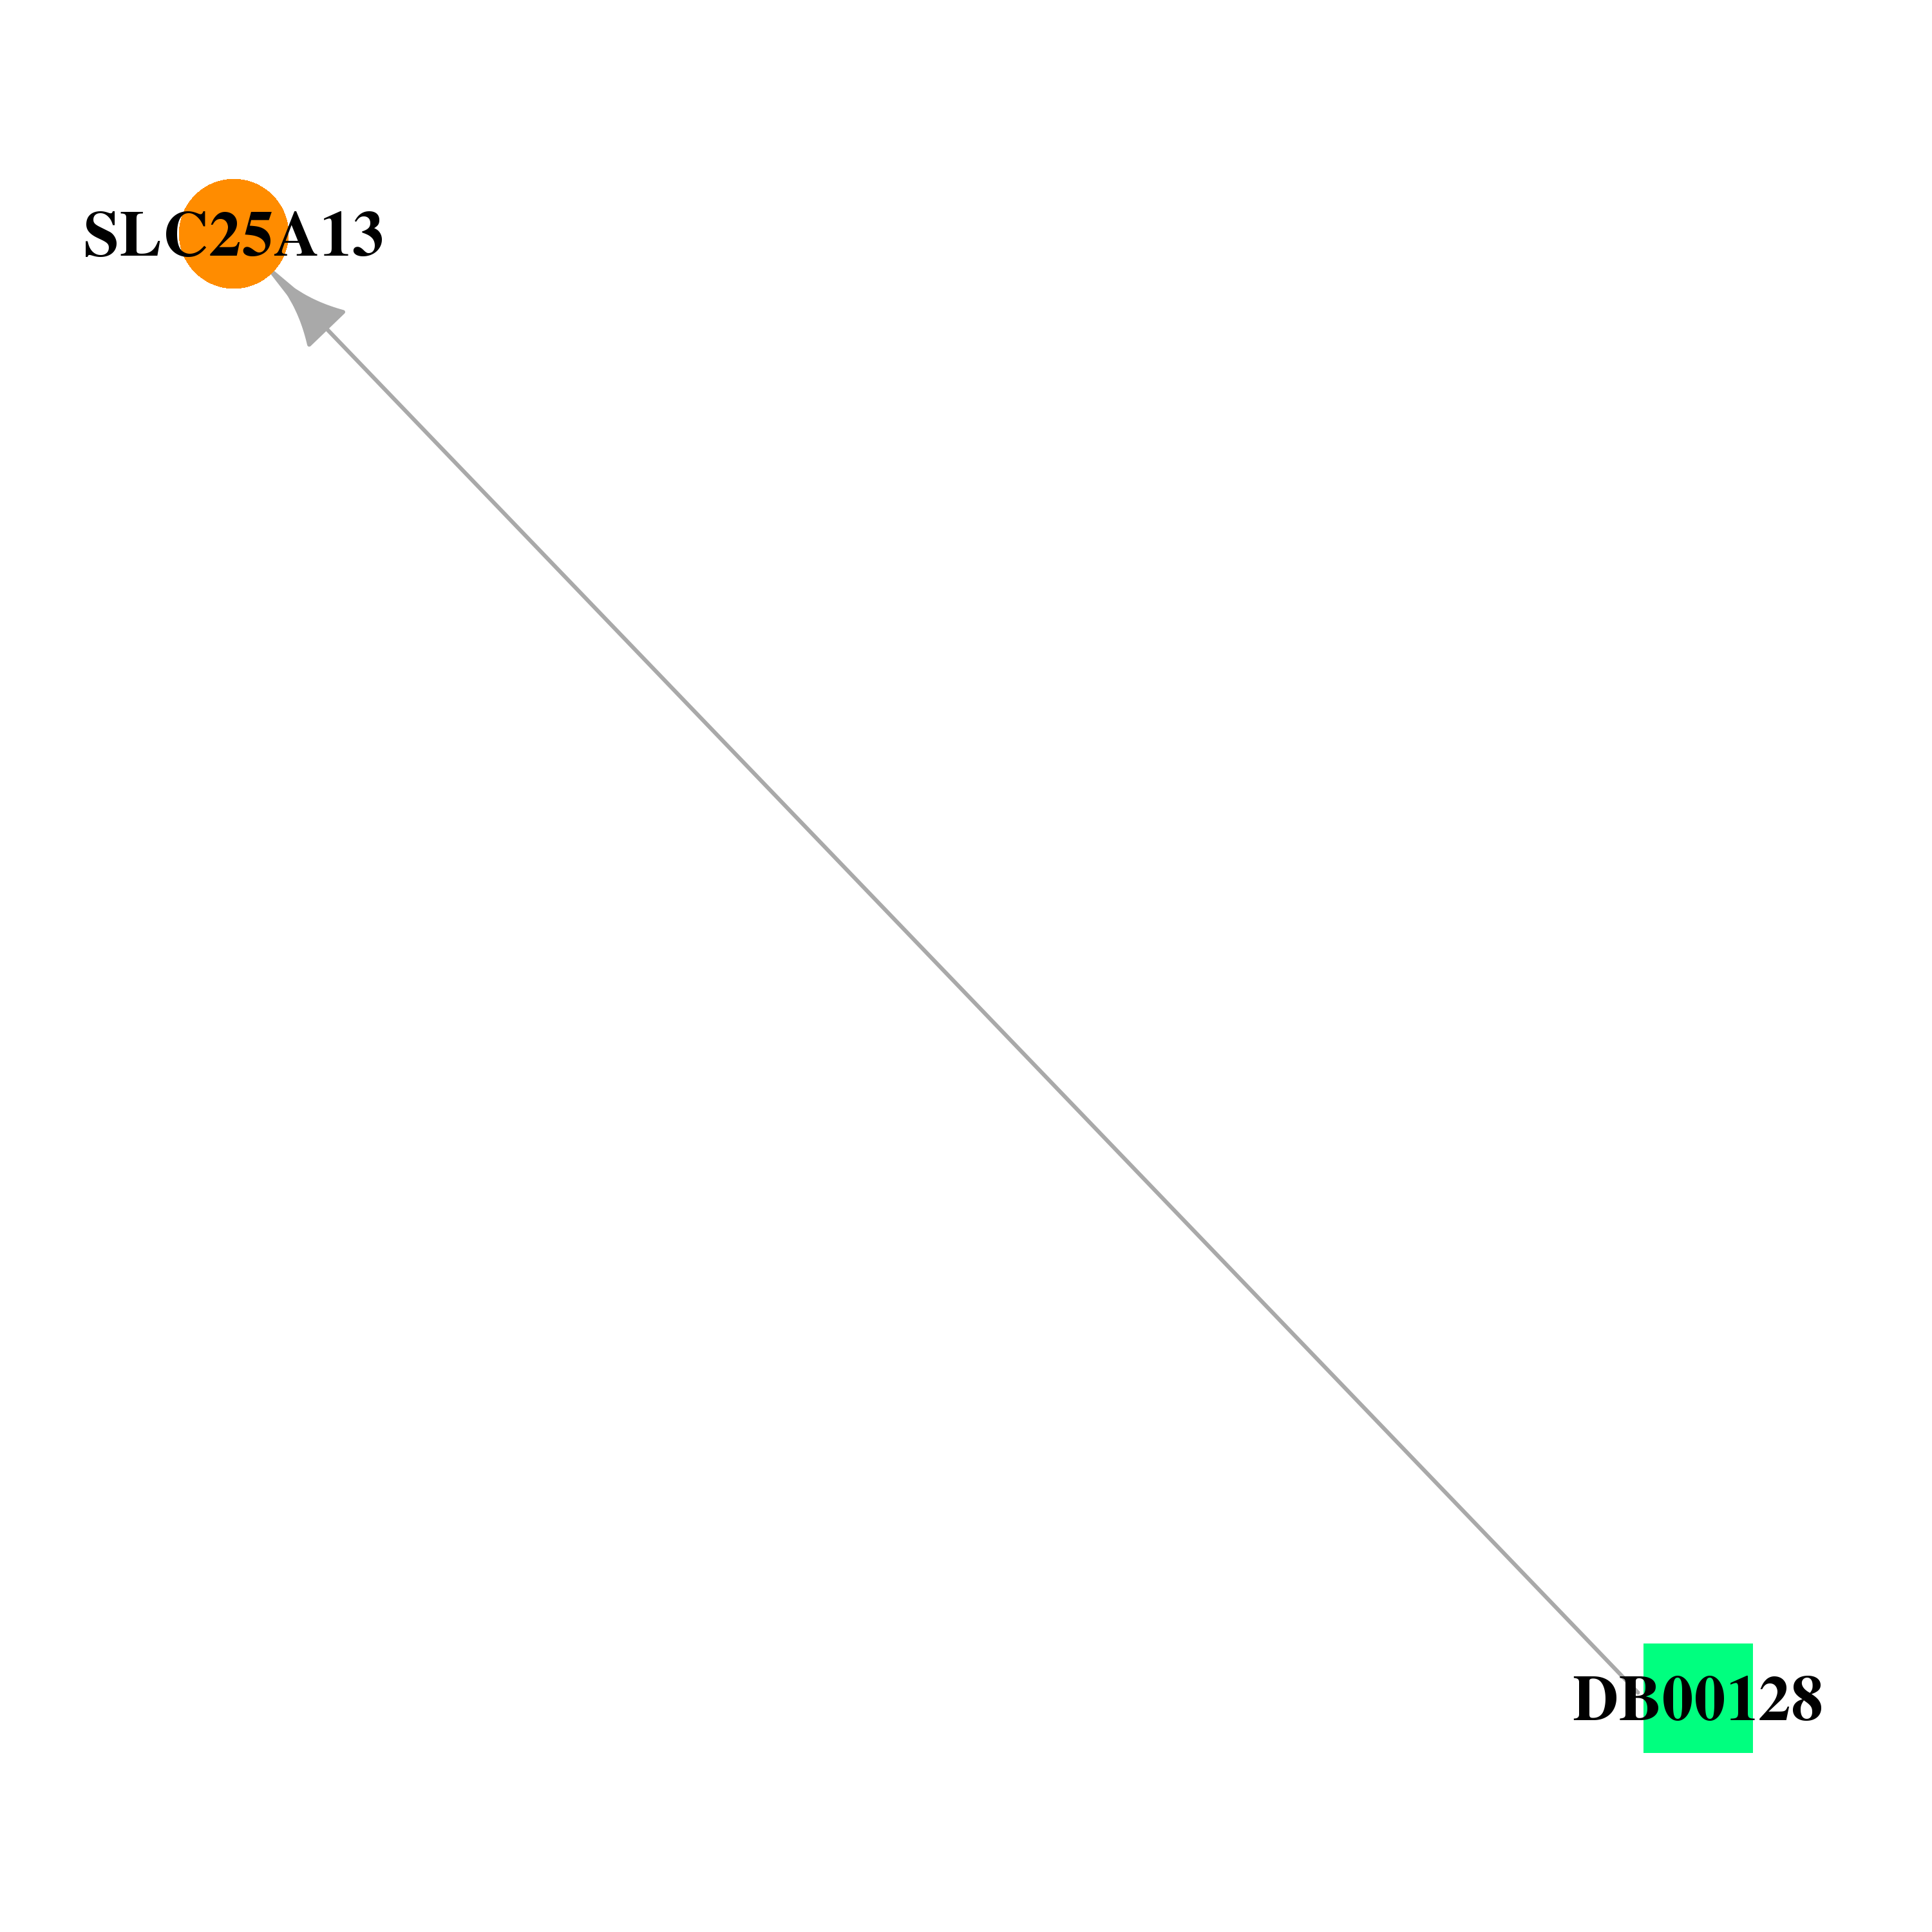 |
| * Drug Centered Interaction Network. |
| DrugBank ID | Target Name | Drug Groups | Generic Name | Drug Centered Network | Drug Structure |
| DB00128 | solute carrier family 25 (aspartate/glutamate carrier), member 13 | approved; nutraceutical | L-Aspartic Acid | 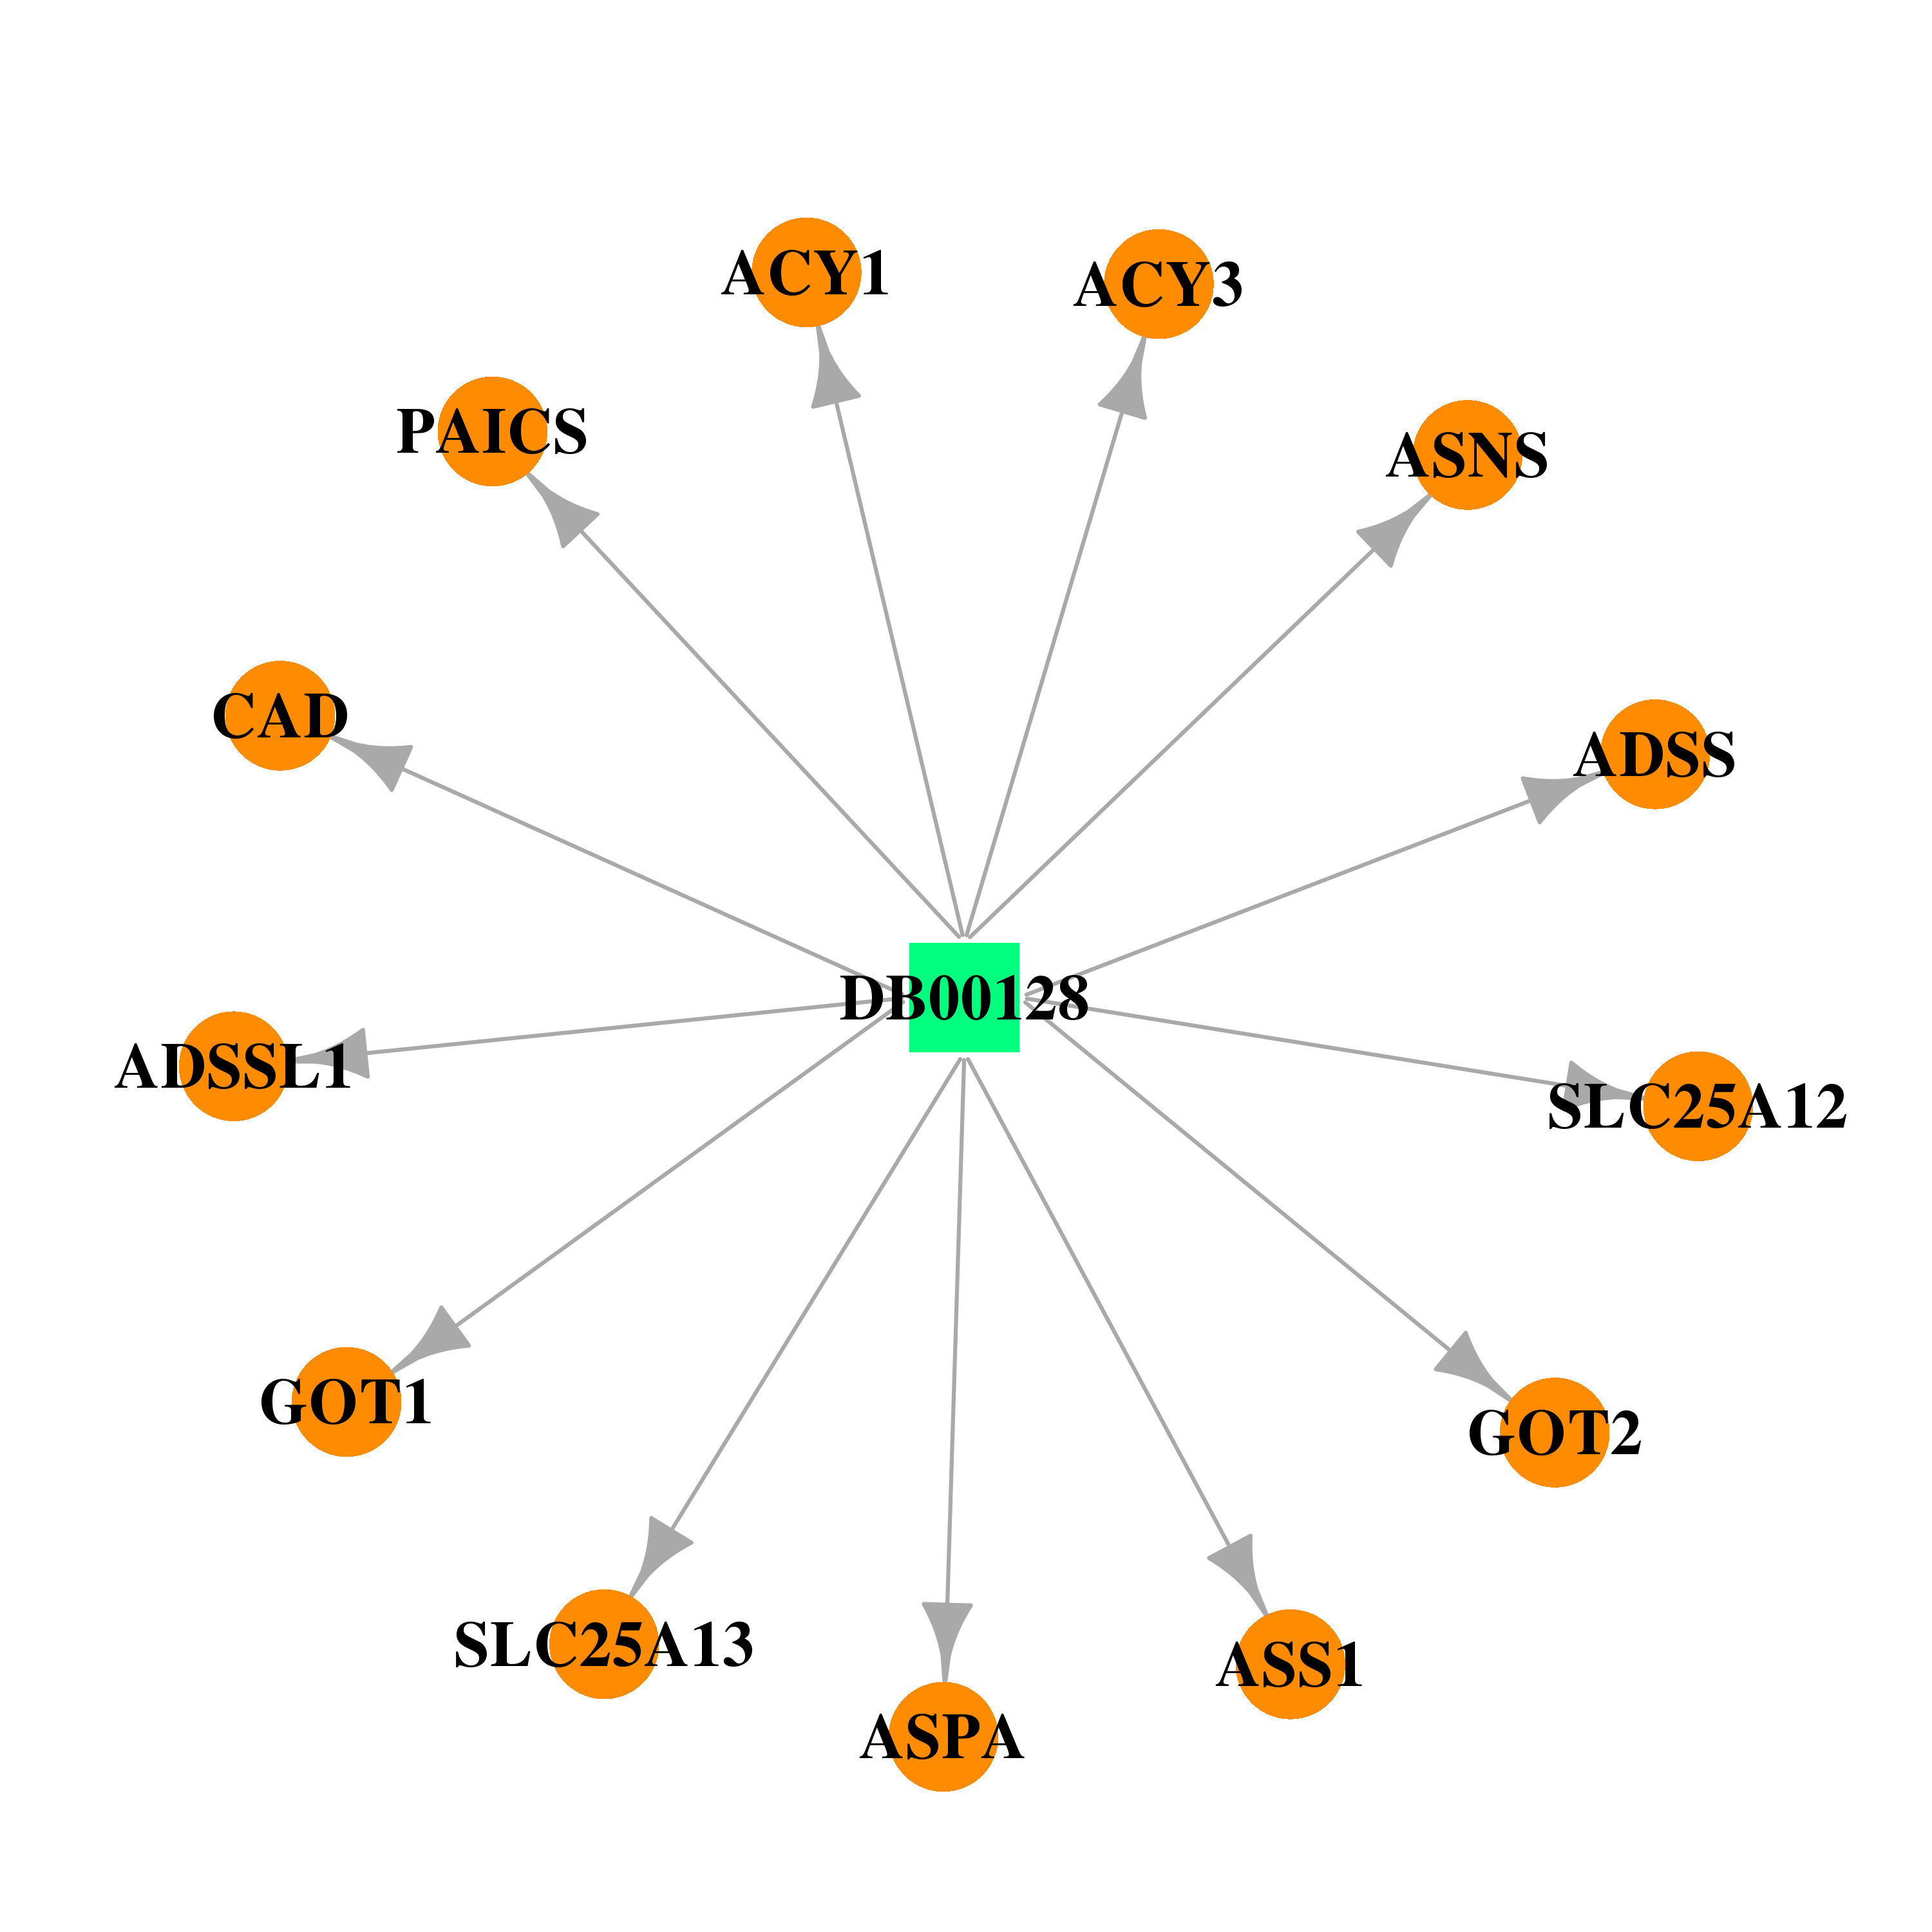 | 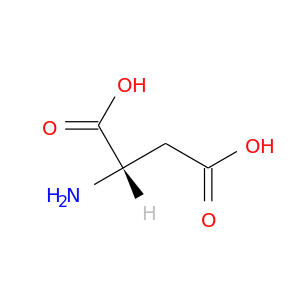 |
| Top |
| Cross referenced IDs for SLC25A13 |
| * We obtained these cross-references from Uniprot database. It covers 150 different DBs, 18 categories. http://www.uniprot.org/help/cross_references_section |
: Open all cross reference information
|
Copyright © 2016-Present - The Univsersity of Texas Health Science Center at Houston @ |