|
||||||||||||||||||||
| |
| Phenotypic Information (metabolism pathway, cancer, disease, phenome) |
| |
| |
| Gene-Gene Network Information: Co-Expression Network, Interacting Genes & KEGG |
| |
|


| Gene Summary for DHRS9 |
| Basic gene info. | Gene symbol | DHRS9 |
| Gene name | dehydrogenase/reductase (SDR family) member 9 | |
| Synonyms | 3-alpha-HSD|3ALPHA-HSD|RDH-E2|RDH-TBE|RDH15|RDHL|RDHTBE|RETSDR8|SDR9C4 | |
| Cytomap | UCSC genome browser: 2q31.1 | |
| Genomic location | chr2 :169929084-169952677 | |
| Type of gene | protein-coding | |
| RefGenes | NM_001142270.1, NM_001142271.1,NM_001289763.1,NM_199204.1,NM_005771.4, | |
| Ensembl id | ENSG00000073737 | |
| Description | 3-alpha hydroxysteroid dehydrogenaseNADP-dependent retinol dehydrogenase/reductasedehydrogenase/reductase SDR family member 9retinol dehydrogenase homologshort chain dehydrogenase/reductase family 9C, member 4short-chain dehydrogenase/reductase retSD | |
| Modification date | 20141207 | |
| dbXrefs | MIM : 612131 | |
| HGNC : HGNC | ||
| Ensembl : ENSG00000073737 | ||
| HPRD : 09916 | ||
| Vega : OTTHUMG00000132180 | ||
| Protein | UniProt: go to UniProt's Cross Reference DB Table | |
| Expression | CleanEX: HS_DHRS9 | |
| BioGPS: 10170 | ||
| Gene Expression Atlas: ENSG00000073737 | ||
| The Human Protein Atlas: ENSG00000073737 | ||
| Pathway | NCI Pathway Interaction Database: DHRS9 | |
| KEGG: DHRS9 | ||
| REACTOME: DHRS9 | ||
| ConsensusPathDB | ||
| Pathway Commons: DHRS9 | ||
| Metabolism | MetaCyc: DHRS9 | |
| HUMANCyc: DHRS9 | ||
| Regulation | Ensembl's Regulation: ENSG00000073737 | |
| miRBase: chr2 :169,929,084-169,952,677 | ||
| TargetScan: NM_001142270 | ||
| cisRED: ENSG00000073737 | ||
| Context | iHOP: DHRS9 | |
| cancer metabolism search in PubMed: DHRS9 | ||
| UCL Cancer Institute: DHRS9 | ||
| Assigned class in ccmGDB | C | |
| Top |
| Phenotypic Information for DHRS9(metabolism pathway, cancer, disease, phenome) |
| Cancer | CGAP: DHRS9 |
| Familial Cancer Database: DHRS9 | |
| * This gene is included in those cancer gene databases. |
|
|
|
|
|
| . | ||||||||||||||
Oncogene 1 | Significant driver gene in | |||||||||||||||||||
| cf) number; DB name 1 Oncogene; http://nar.oxfordjournals.org/content/35/suppl_1/D721.long, 2 Tumor Suppressor gene; https://bioinfo.uth.edu/TSGene/, 3 Cancer Gene Census; http://www.nature.com/nrc/journal/v4/n3/abs/nrc1299.html, 4 CancerGenes; http://nar.oxfordjournals.org/content/35/suppl_1/D721.long, 5 Network of Cancer Gene; http://ncg.kcl.ac.uk/index.php, 1Therapeutic Vulnerabilities in Cancer; http://cbio.mskcc.org/cancergenomics/statius/ |
| KEGG_RETINOL_METABOLISM | |
| OMIM | |
| Orphanet | |
| Disease | KEGG Disease: DHRS9 |
| MedGen: DHRS9 (Human Medical Genetics with Condition) | |
| ClinVar: DHRS9 | |
| Phenotype | MGI: DHRS9 (International Mouse Phenotyping Consortium) |
| PhenomicDB: DHRS9 | |
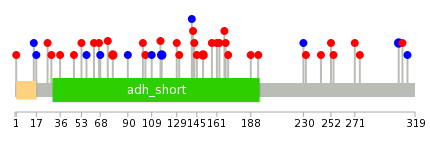
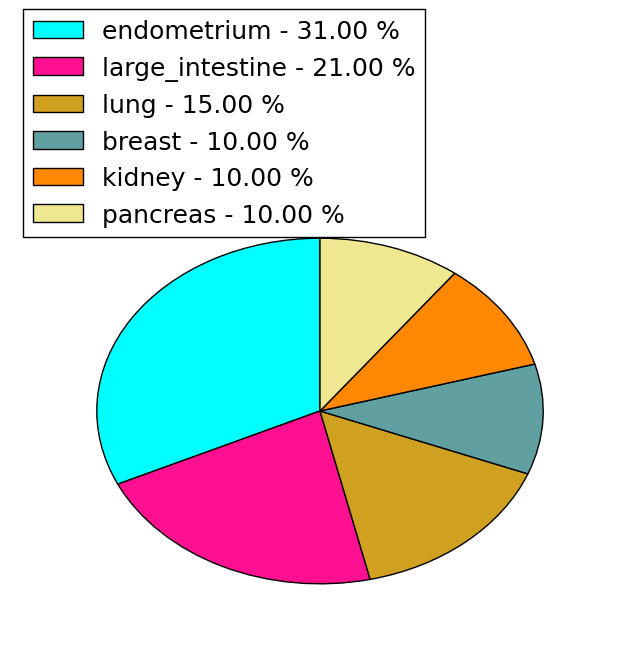
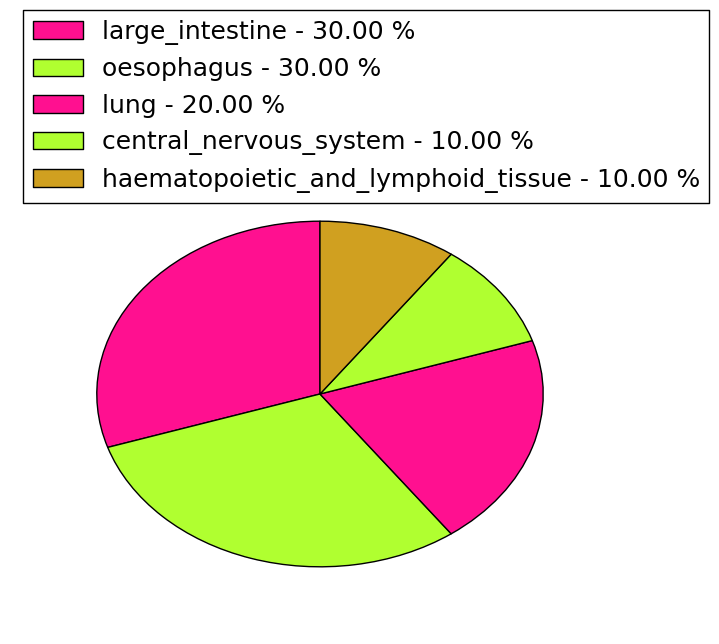
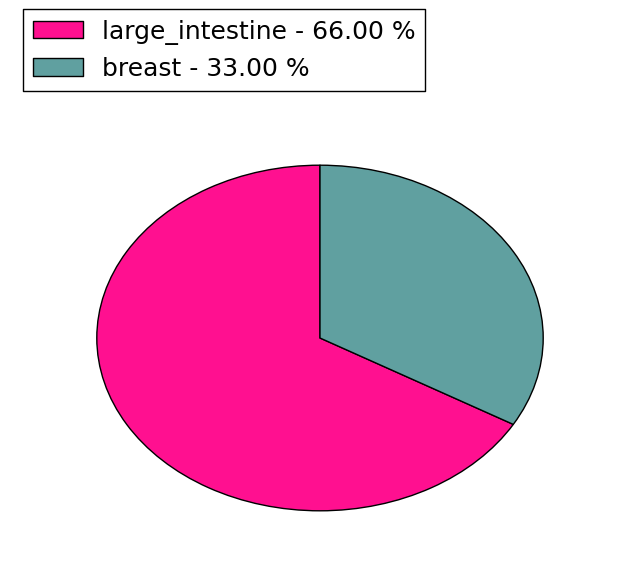
| Mutations for DHRS9 |
| * Under tables are showing count per each tissue to give us broad intuition about tissue specific mutation patterns.You can go to the detailed page for each mutation database's web site. |
| There's no structural variation information in COSMIC data for this gene. |
| * From mRNA Sanger sequences, Chitars2.0 arranged chimeric transcripts. This table shows DHRS9 related fusion information. |
| ID | Head Gene | Tail Gene | Accession | Gene_a | qStart_a | qEnd_a | Chromosome_a | tStart_a | tEnd_a | Gene_a | qStart_a | qEnd_a | Chromosome_a | tStart_a | tEnd_a |
| Top |
| There's no copy number variation information in COSMIC data for this gene. |
| Top |
|
 |
| Top |
| Stat. for Non-Synonymous SNVs (# total SNVs=19) | (# total SNVs=10) |
 |  |
(# total SNVs=3) | (# total SNVs=1) |
 |  |
| Top |
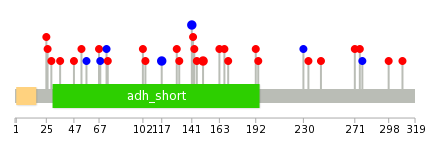
| * When you move the cursor on each content, you can see more deailed mutation information on the Tooltip. Those are primary_site,primary_histology,mutation(aa),pubmedID. |
| GRCh37 position | Mutation(aa) | Unique sampleID count |
| chr2:169948389-169948389 | p.K223fs*25 | 3 |
| chr2:169939876-169939876 | p.G117G | 2 |
| chr2:169938324-169938324 | p.R78H | 2 |
| chr2:169952233-169952233 | p.L306L | 2 |
| chr2:169939973-169939973 | p.P150S | 2 |
| chr2:169940013-169940013 | p.S163F | 1 |
| chr2:169938262-169938262 | p.I57I | 1 |
| chr2:169948457-169948457 | p.E244K | 1 |
| chr2:169940025-169940025 | p.G167D | 1 |
| chr2:169938278-169938278 | p.E63Q | 1 |
| Top |
|
 |
| Point Mutation/ Tissue ID | 1 | 2 | 3 | 4 | 5 | 6 | 7 | 8 | 9 | 10 | 11 | 12 | 13 | 14 | 15 | 16 | 17 | 18 | 19 | 20 |
| # sample | 3 | 1 | 4 | 1 | 2 | 1 | 5 | 8 | 4 | 4 | ||||||||||
| # mutation | 3 | 1 | 4 | 1 | 2 | 1 | 6 | 8 | 5 | 5 | ||||||||||
| nonsynonymous SNV | 2 | 1 | 2 | 2 | 1 | 2 | 8 | 4 | 5 | |||||||||||
| synonymous SNV | 1 | 2 | 1 | 4 | 1 |
| cf) Tissue ID; Tissue type (1; BLCA[Bladder Urothelial Carcinoma], 2; BRCA[Breast invasive carcinoma], 3; CESC[Cervical squamous cell carcinoma and endocervical adenocarcinoma], 4; COAD[Colon adenocarcinoma], 5; GBM[Glioblastoma multiforme], 6; Glioma Low Grade, 7; HNSC[Head and Neck squamous cell carcinoma], 8; KICH[Kidney Chromophobe], 9; KIRC[Kidney renal clear cell carcinoma], 10; KIRP[Kidney renal papillary cell carcinoma], 11; LAML[Acute Myeloid Leukemia], 12; LUAD[Lung adenocarcinoma], 13; LUSC[Lung squamous cell carcinoma], 14; OV[Ovarian serous cystadenocarcinoma ], 15; PAAD[Pancreatic adenocarcinoma], 16; PRAD[Prostate adenocarcinoma], 17; SKCM[Skin Cutaneous Melanoma], 18:STAD[Stomach adenocarcinoma], 19:THCA[Thyroid carcinoma], 20:UCEC[Uterine Corpus Endometrial Carcinoma]) |
| Top |
| * We represented just top 10 SNVs. When you move the cursor on each content, you can see more deailed mutation information on the Tooltip. Those are primary_site, primary_histology, mutation(aa), pubmedID. |
| Genomic Position | Mutation(aa) | Unique sampleID count |
| chr2:169939973 | p.L141L,DHRS9 | 2 |
| chr2:169939876 | p.P150S,DHRS9 | 2 |
| chr2:169939948 | p.G117G,DHRS9 | 2 |
| chr2:169952140 | p.D129N,DHRS9 | 1 |
| chr2:169938310 | p.L275I,DHRS9 | 1 |
| chr2:169952148 | p.R131K,DHRS9 | 1 |
| chr2:169938312 | p.P277P,DHRS9 | 1 |
| chr2:169940013 | p.E25K,DHRS9 | 1 |
| chr2:169938164 | p.P298S,DHRS9 | 1 |
| chr2:169952209 | p.D26Y,DHRS9 | 1 |
| * Copy number data were extracted from TCGA using R package TCGA-Assembler. The URLs of all public data files on TCGA DCC data server were gathered on Jan-05-2015. Function ProcessCNAData in TCGA-Assembler package was used to obtain gene-level copy number value which is calculated as the average copy number of the genomic region of a gene. |
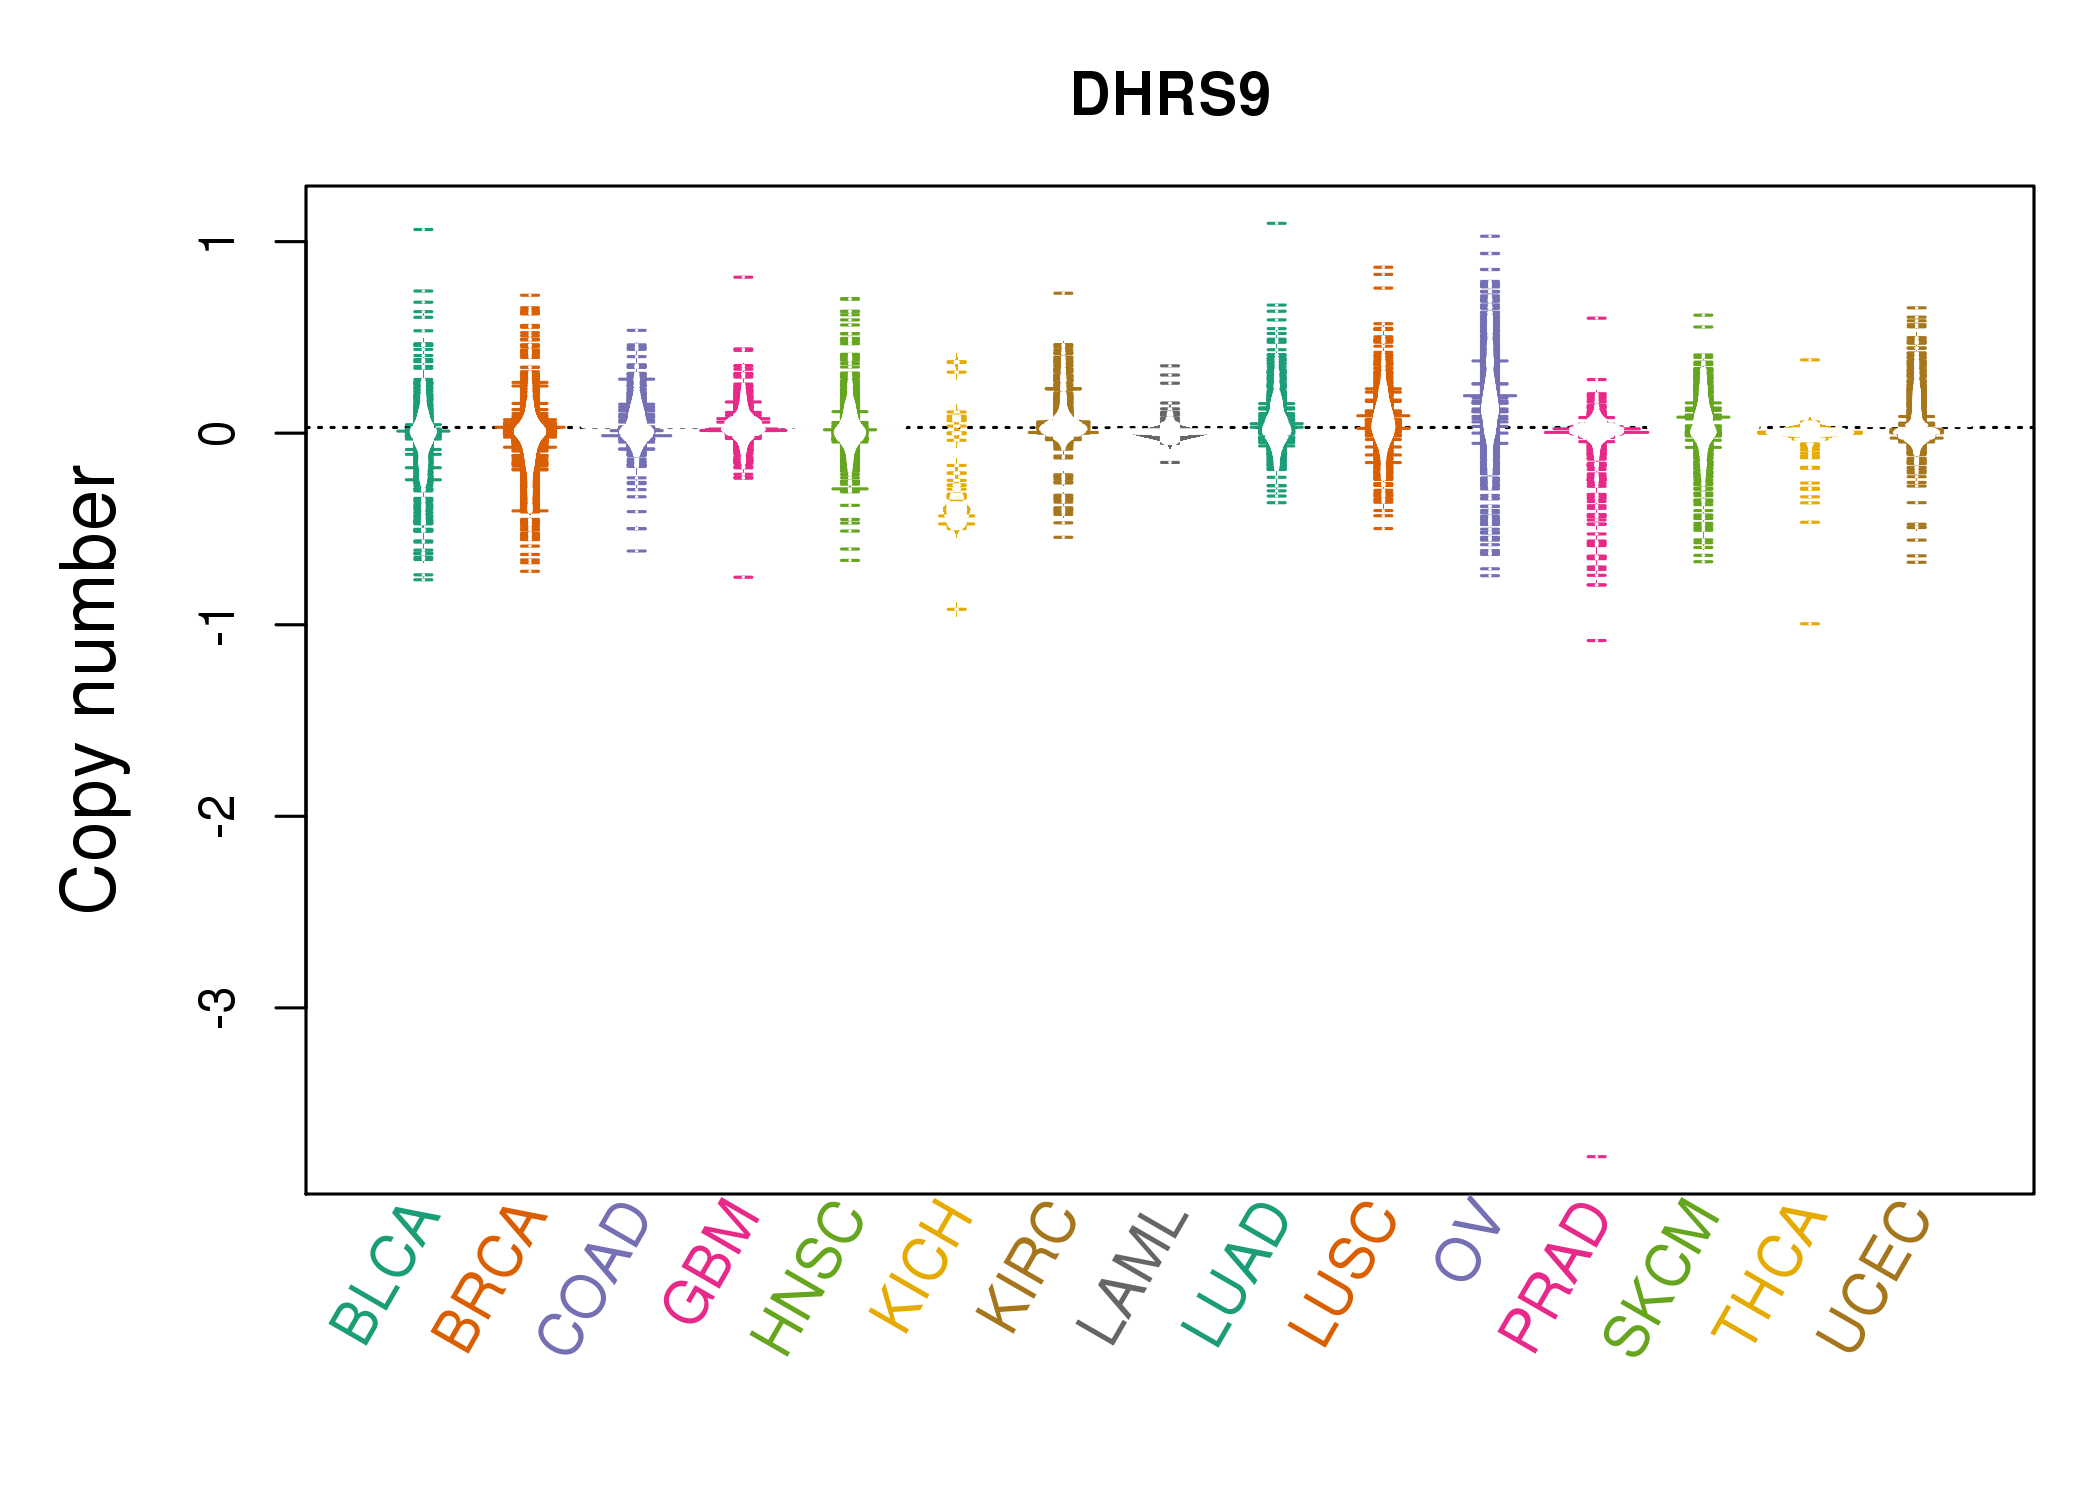 |
| cf) Tissue ID[Tissue type]: BLCA[Bladder Urothelial Carcinoma], BRCA[Breast invasive carcinoma], CESC[Cervical squamous cell carcinoma and endocervical adenocarcinoma], COAD[Colon adenocarcinoma], GBM[Glioblastoma multiforme], Glioma Low Grade, HNSC[Head and Neck squamous cell carcinoma], KICH[Kidney Chromophobe], KIRC[Kidney renal clear cell carcinoma], KIRP[Kidney renal papillary cell carcinoma], LAML[Acute Myeloid Leukemia], LUAD[Lung adenocarcinoma], LUSC[Lung squamous cell carcinoma], OV[Ovarian serous cystadenocarcinoma ], PAAD[Pancreatic adenocarcinoma], PRAD[Prostate adenocarcinoma], SKCM[Skin Cutaneous Melanoma], STAD[Stomach adenocarcinoma], THCA[Thyroid carcinoma], UCEC[Uterine Corpus Endometrial Carcinoma] |
| Top |
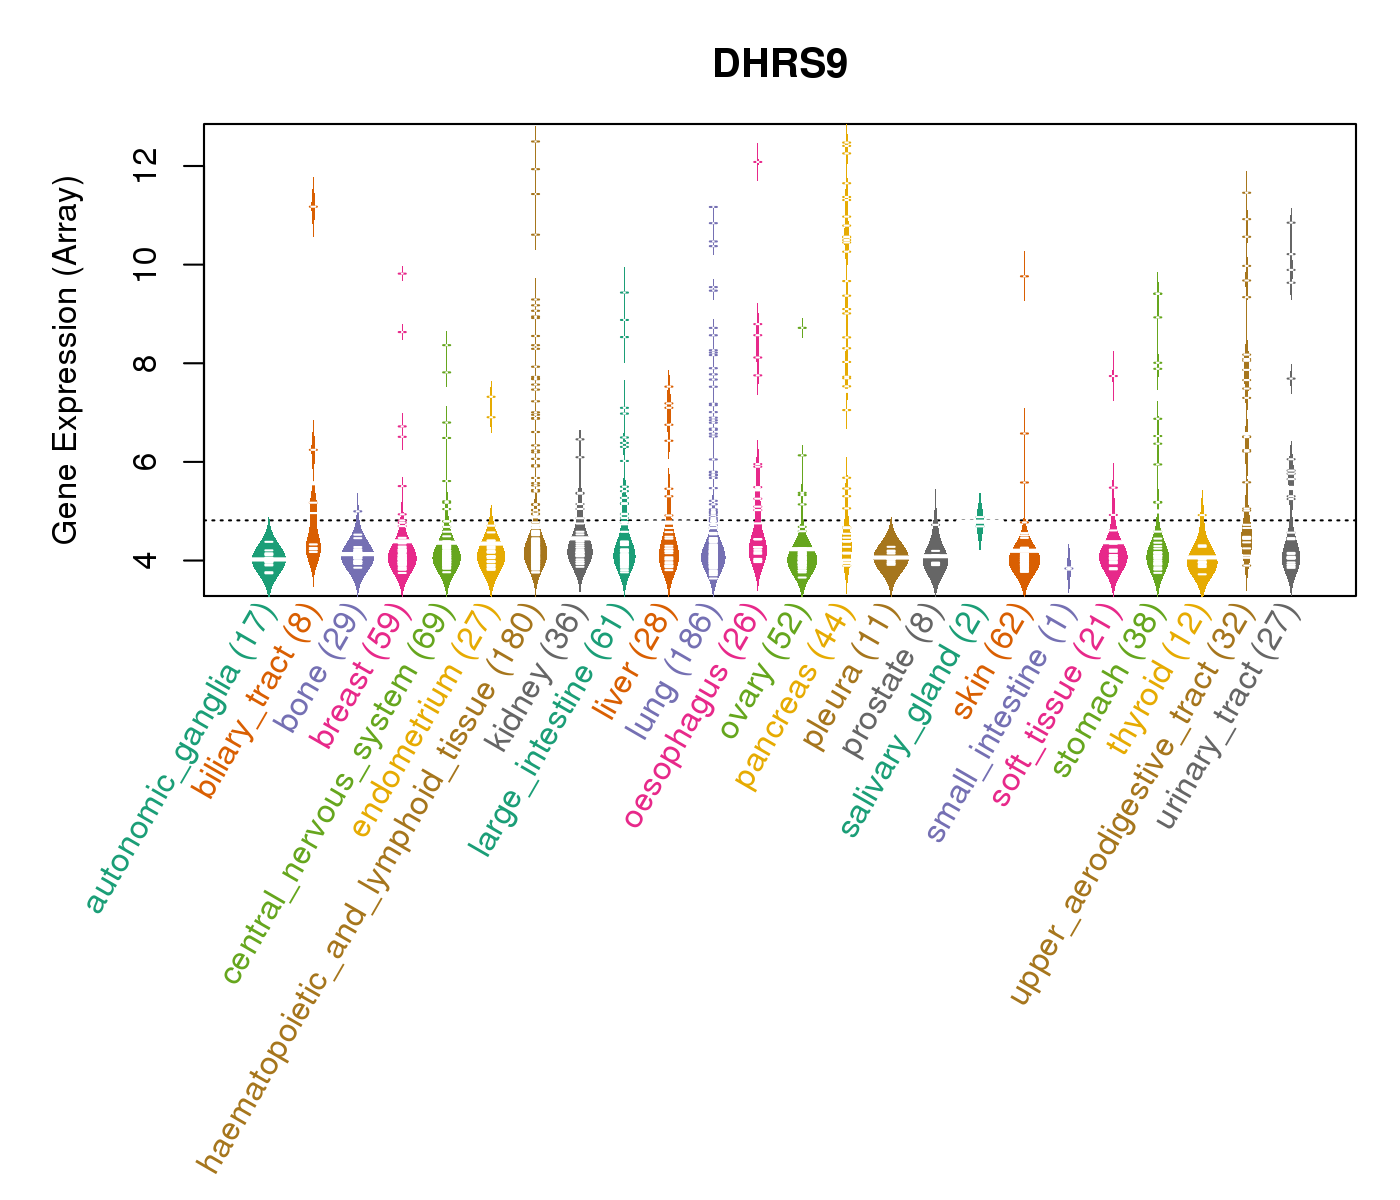
| Gene Expression for DHRS9 |
| * CCLE gene expression data were extracted from CCLE_Expression_Entrez_2012-10-18.res: Gene-centric RMA-normalized mRNA expression data. |
 |
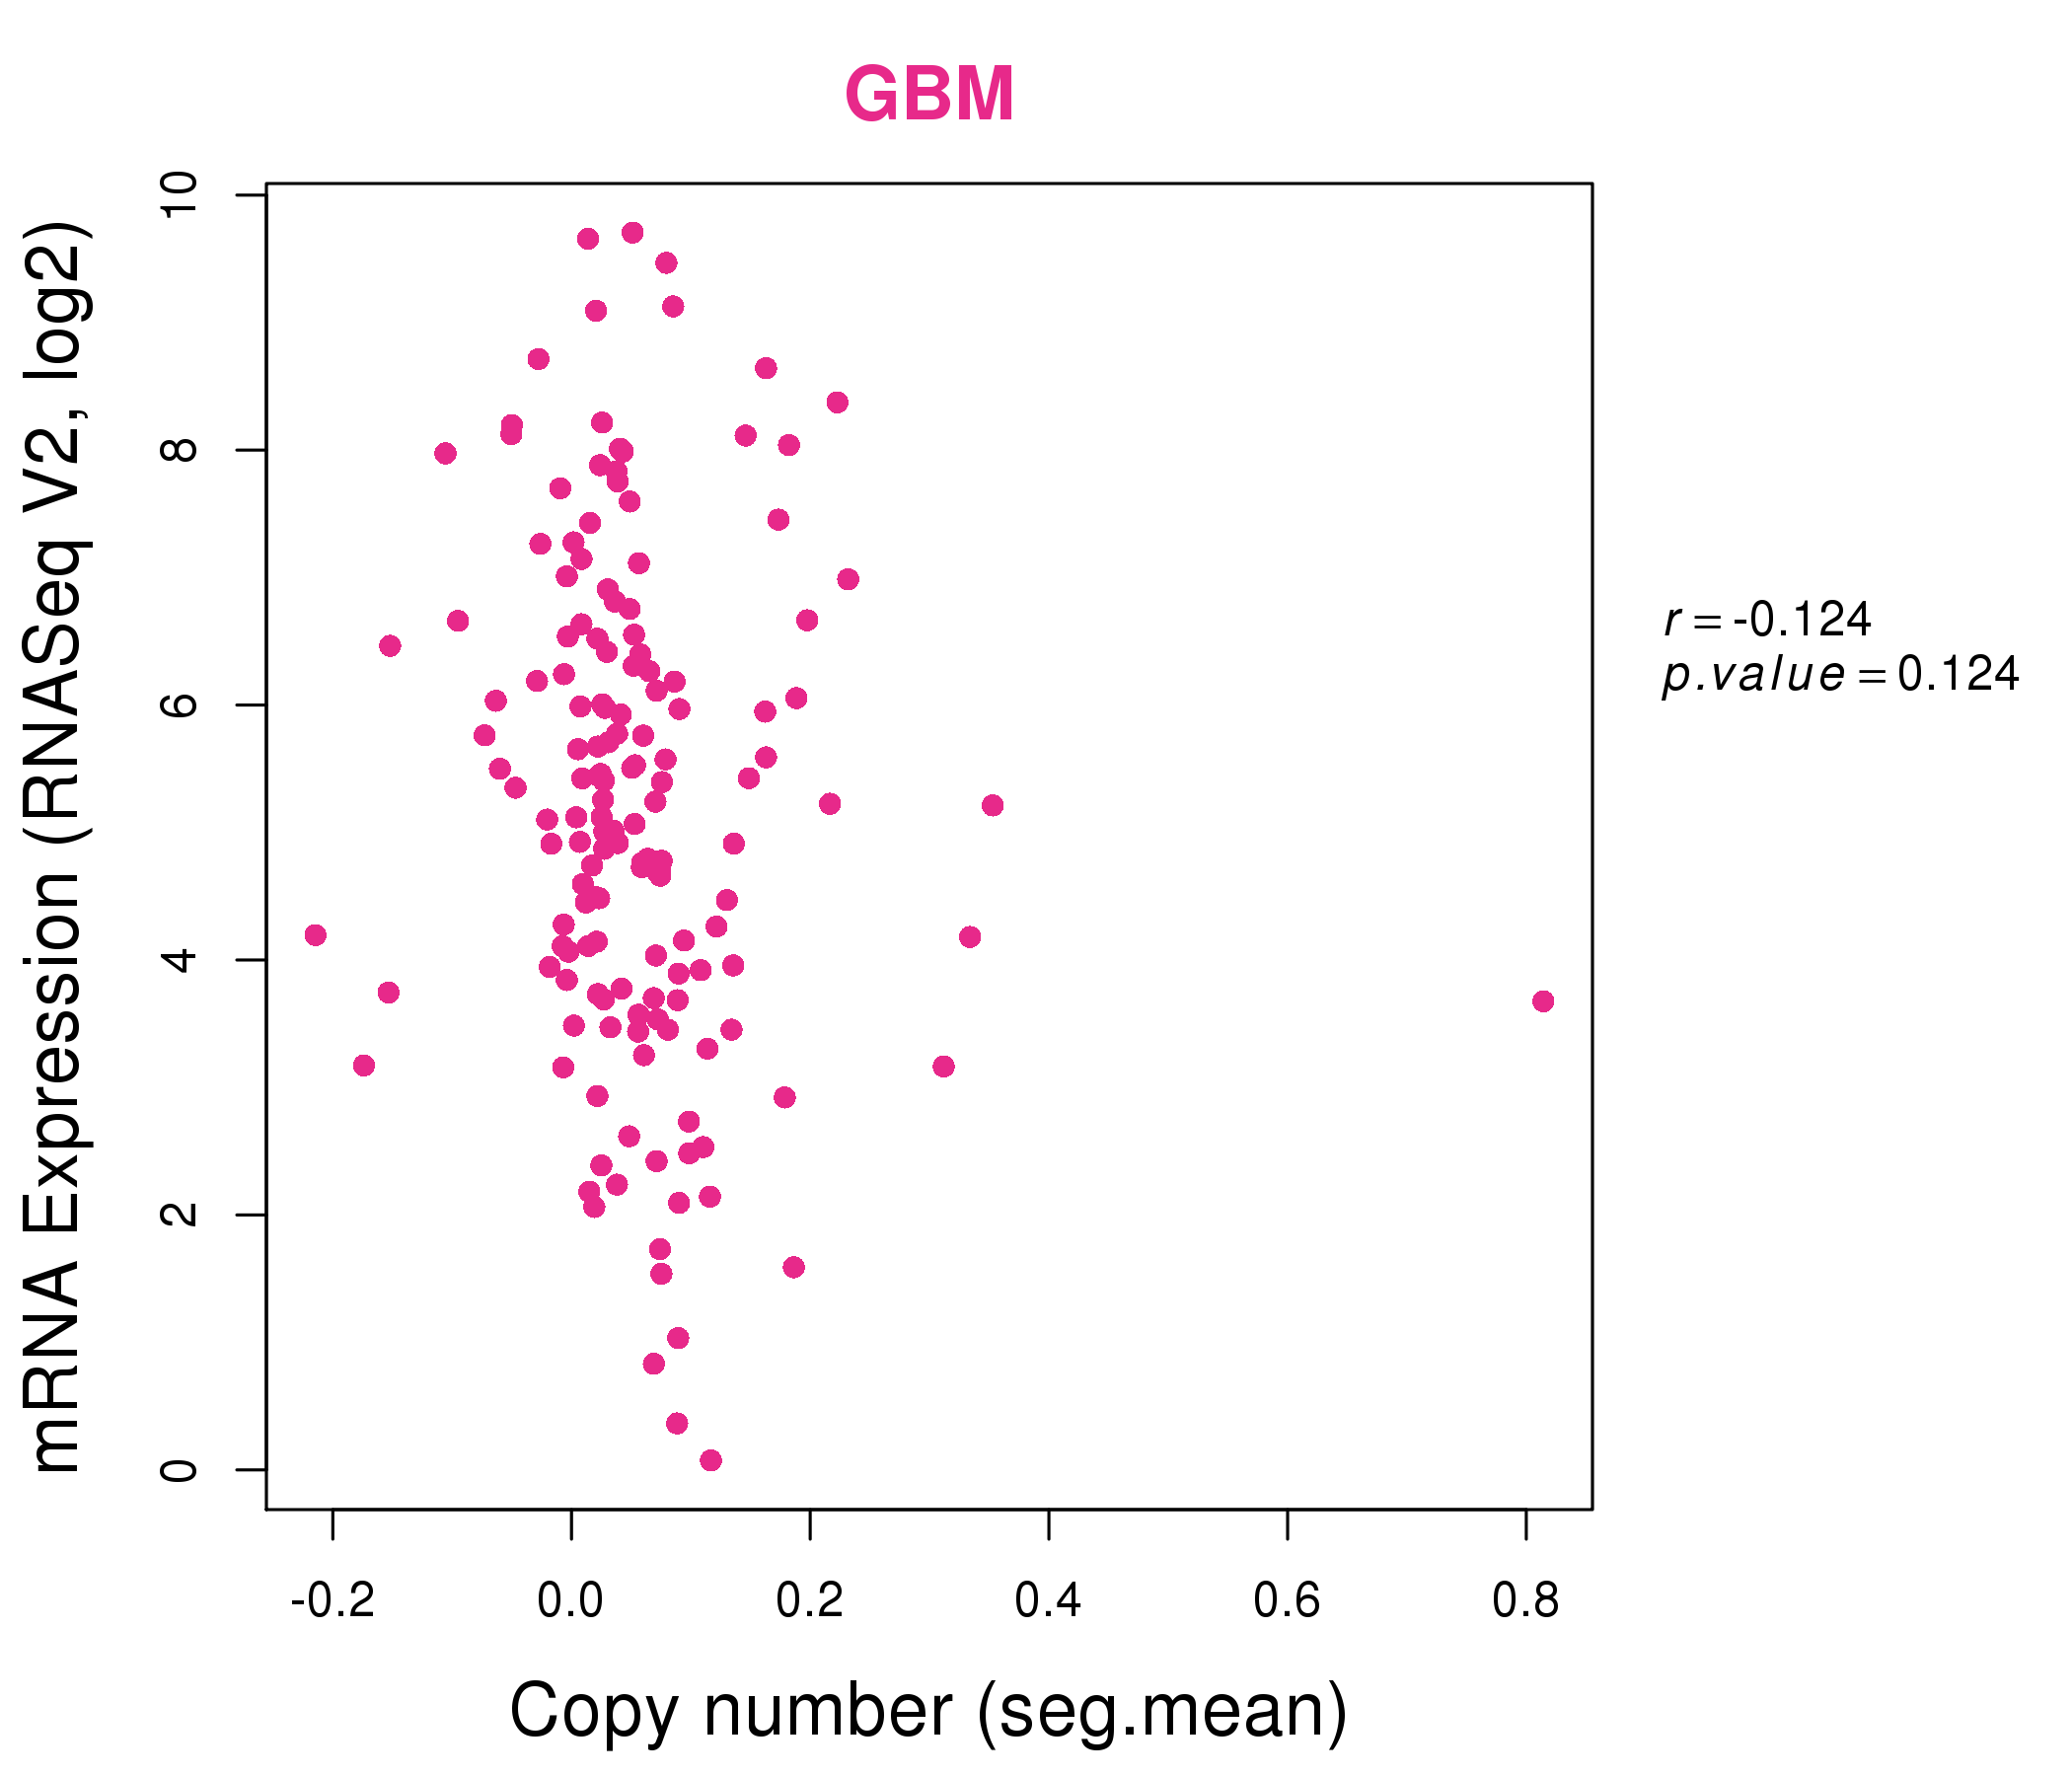
| * Normalized gene expression data of RNASeqV2 was extracted from TCGA using R package TCGA-Assembler. The URLs of all public data files on TCGA DCC data server were gathered at Jan-05-2015. Only eight cancer types have enough normal control samples for differential expression analysis. (t test, adjusted p<0.05 (using Benjamini-Hochberg FDR)) |
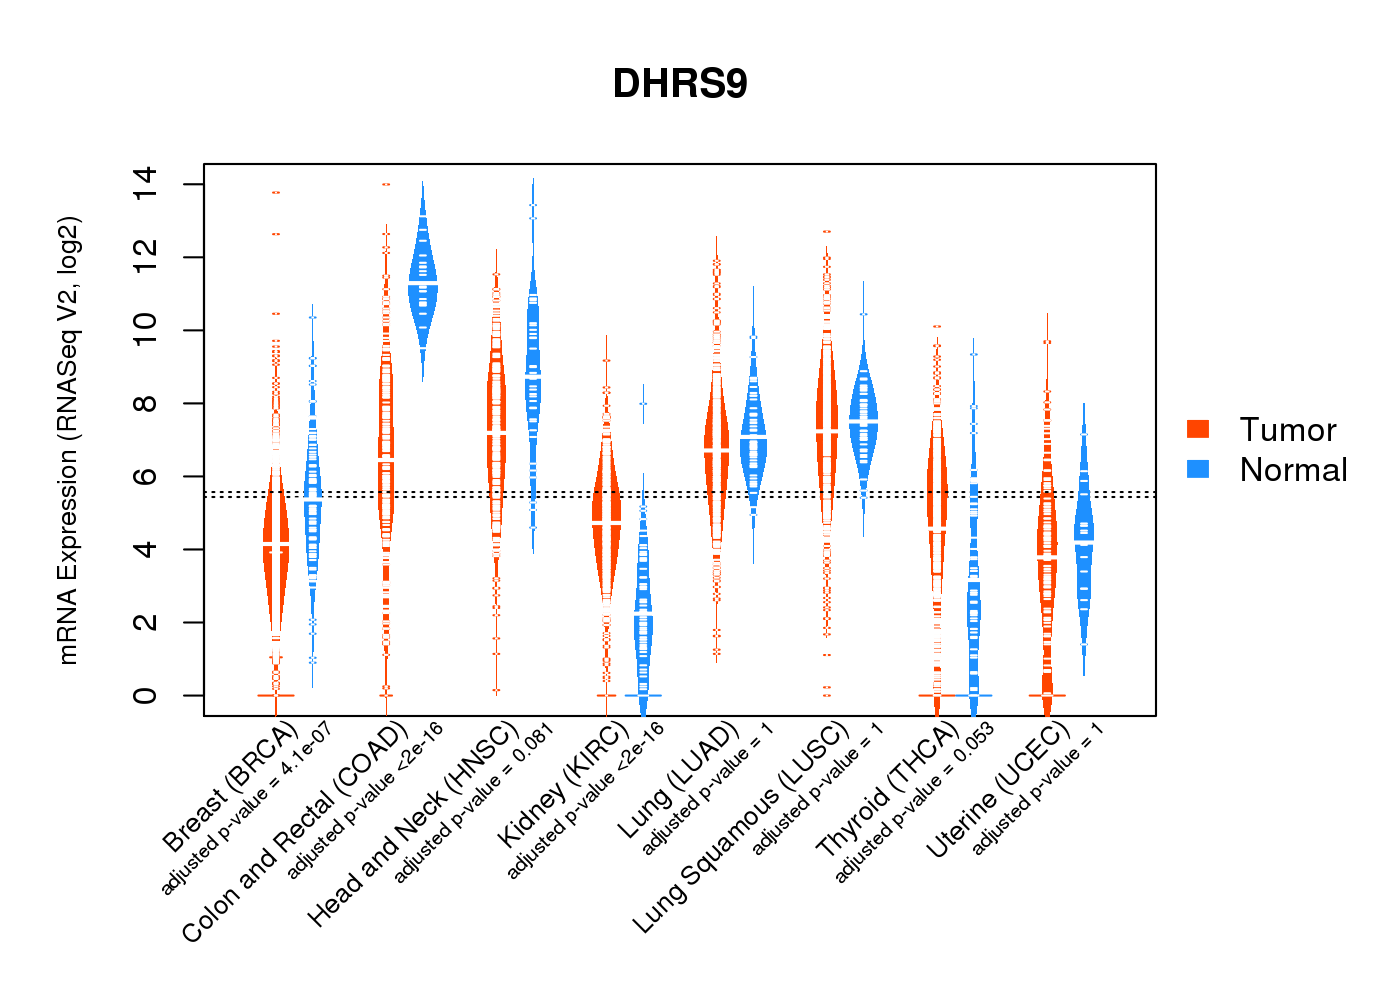 |
| Top |
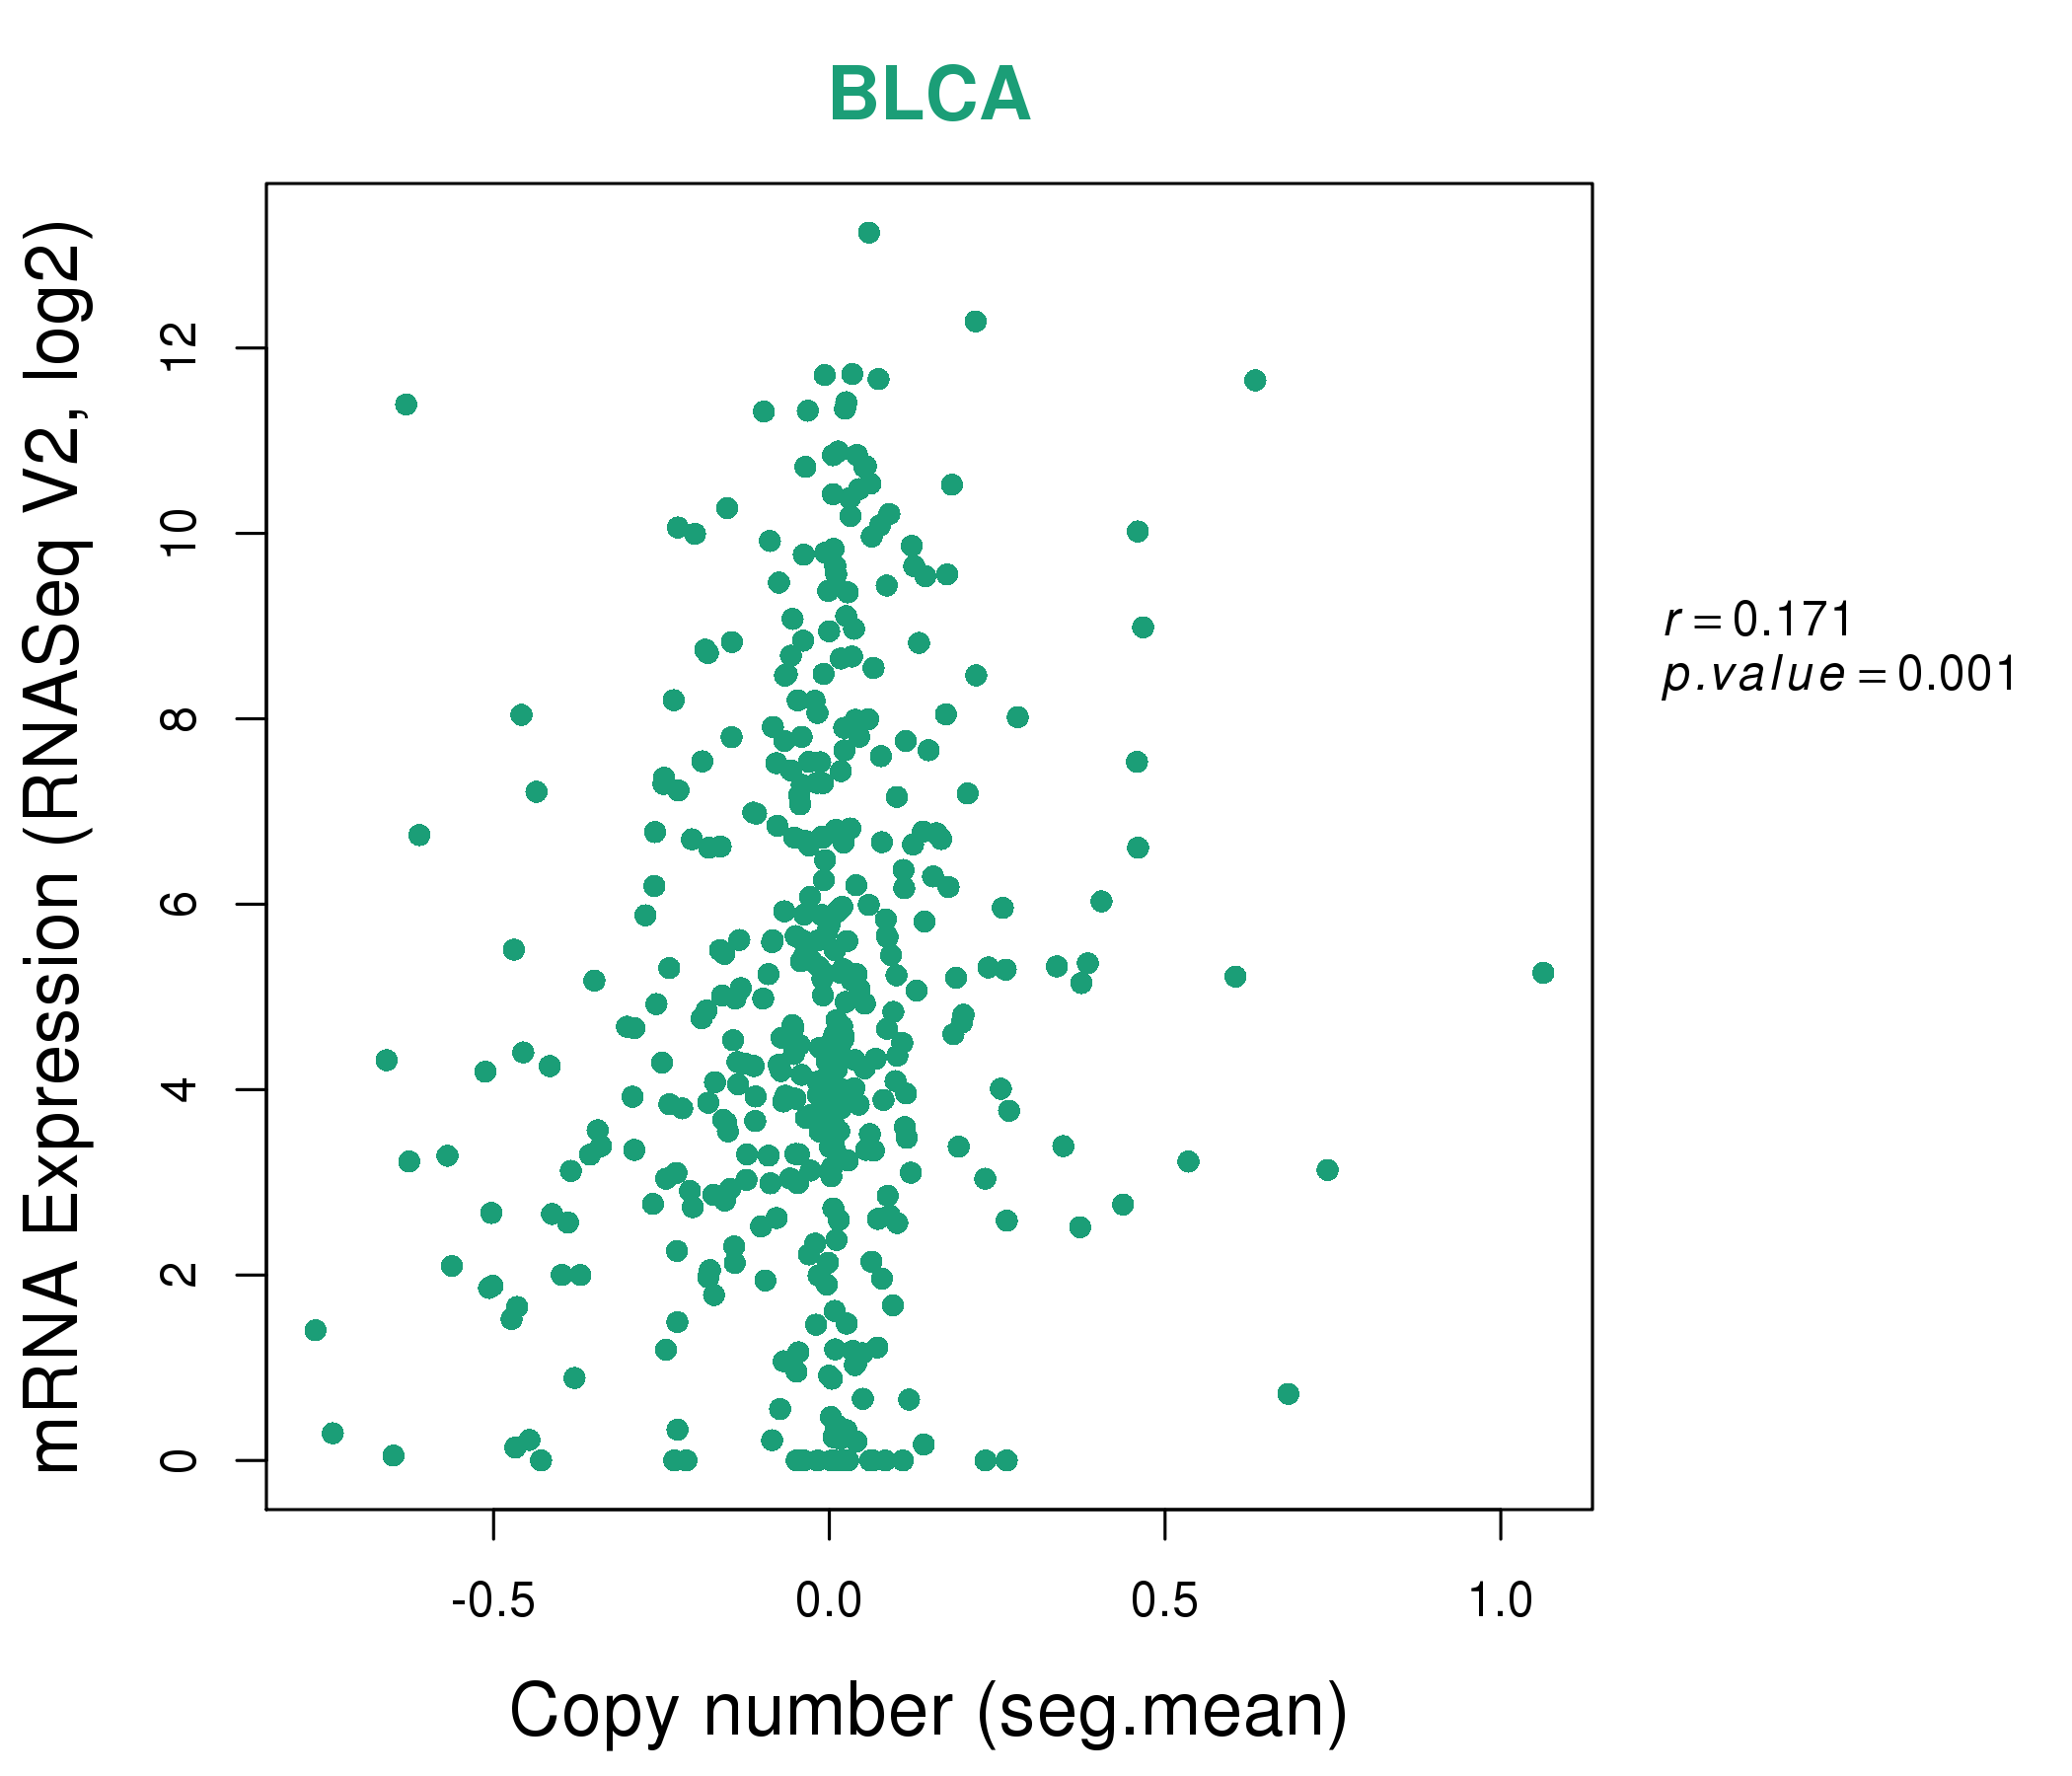
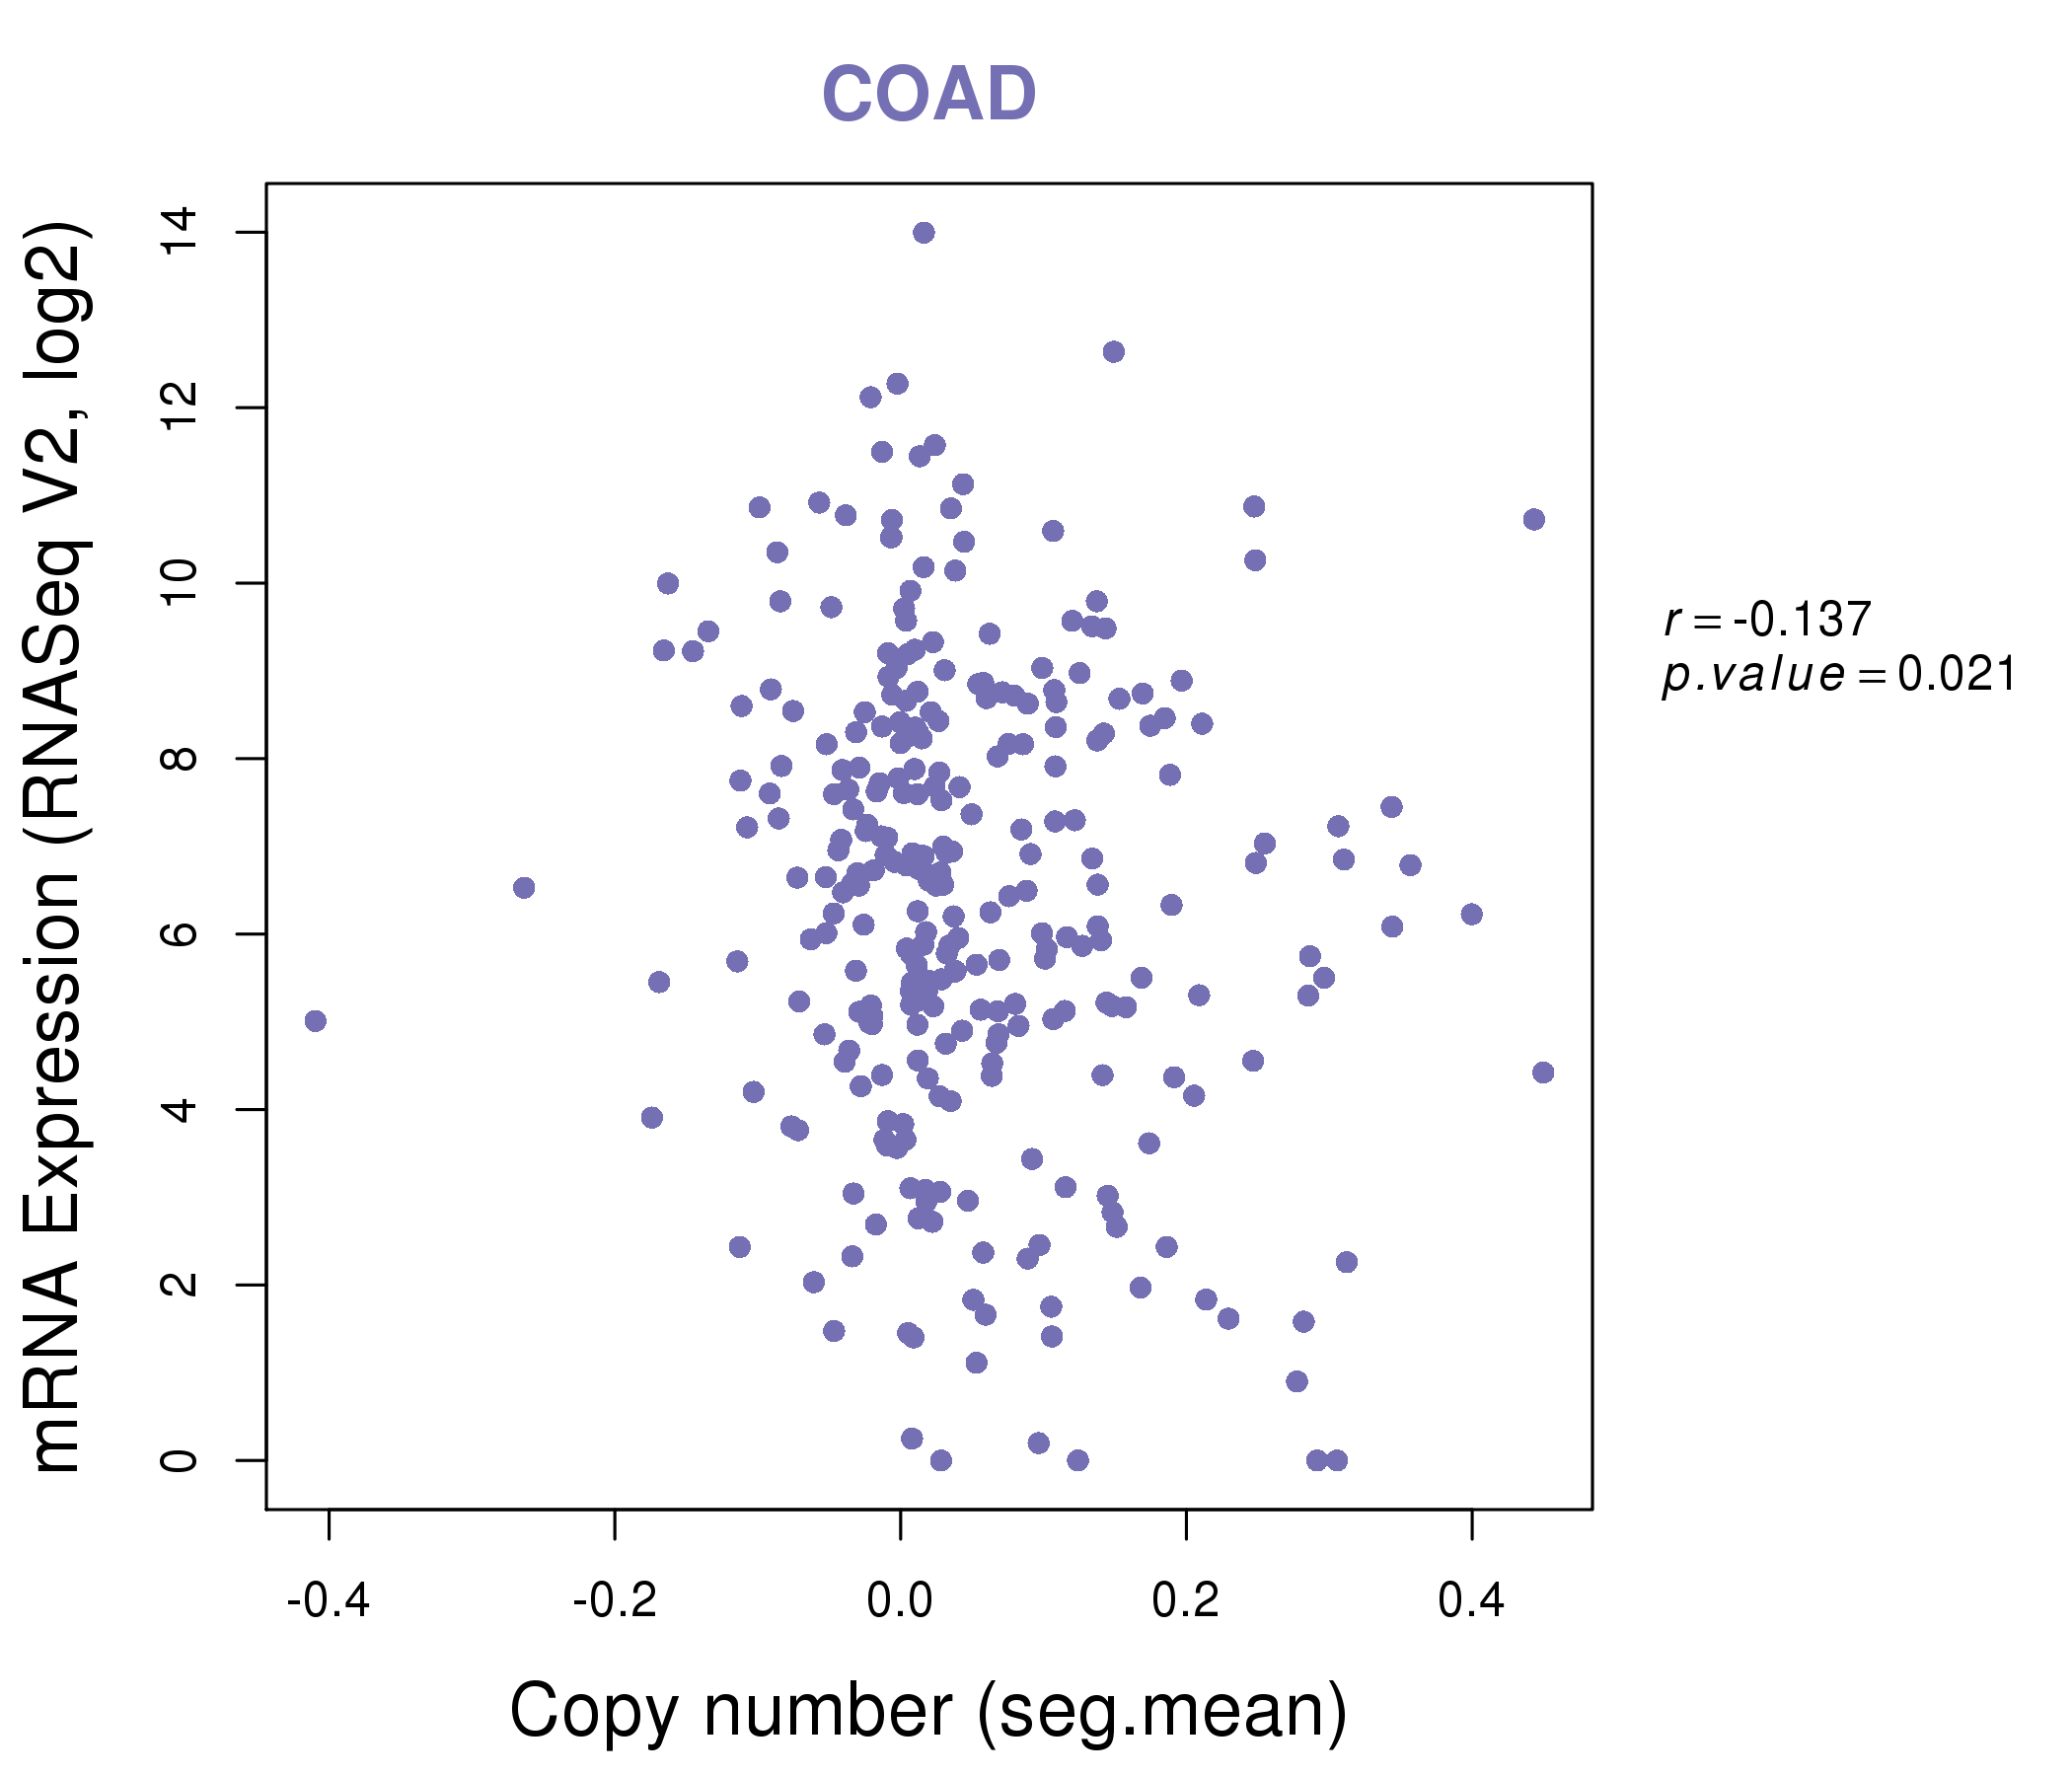
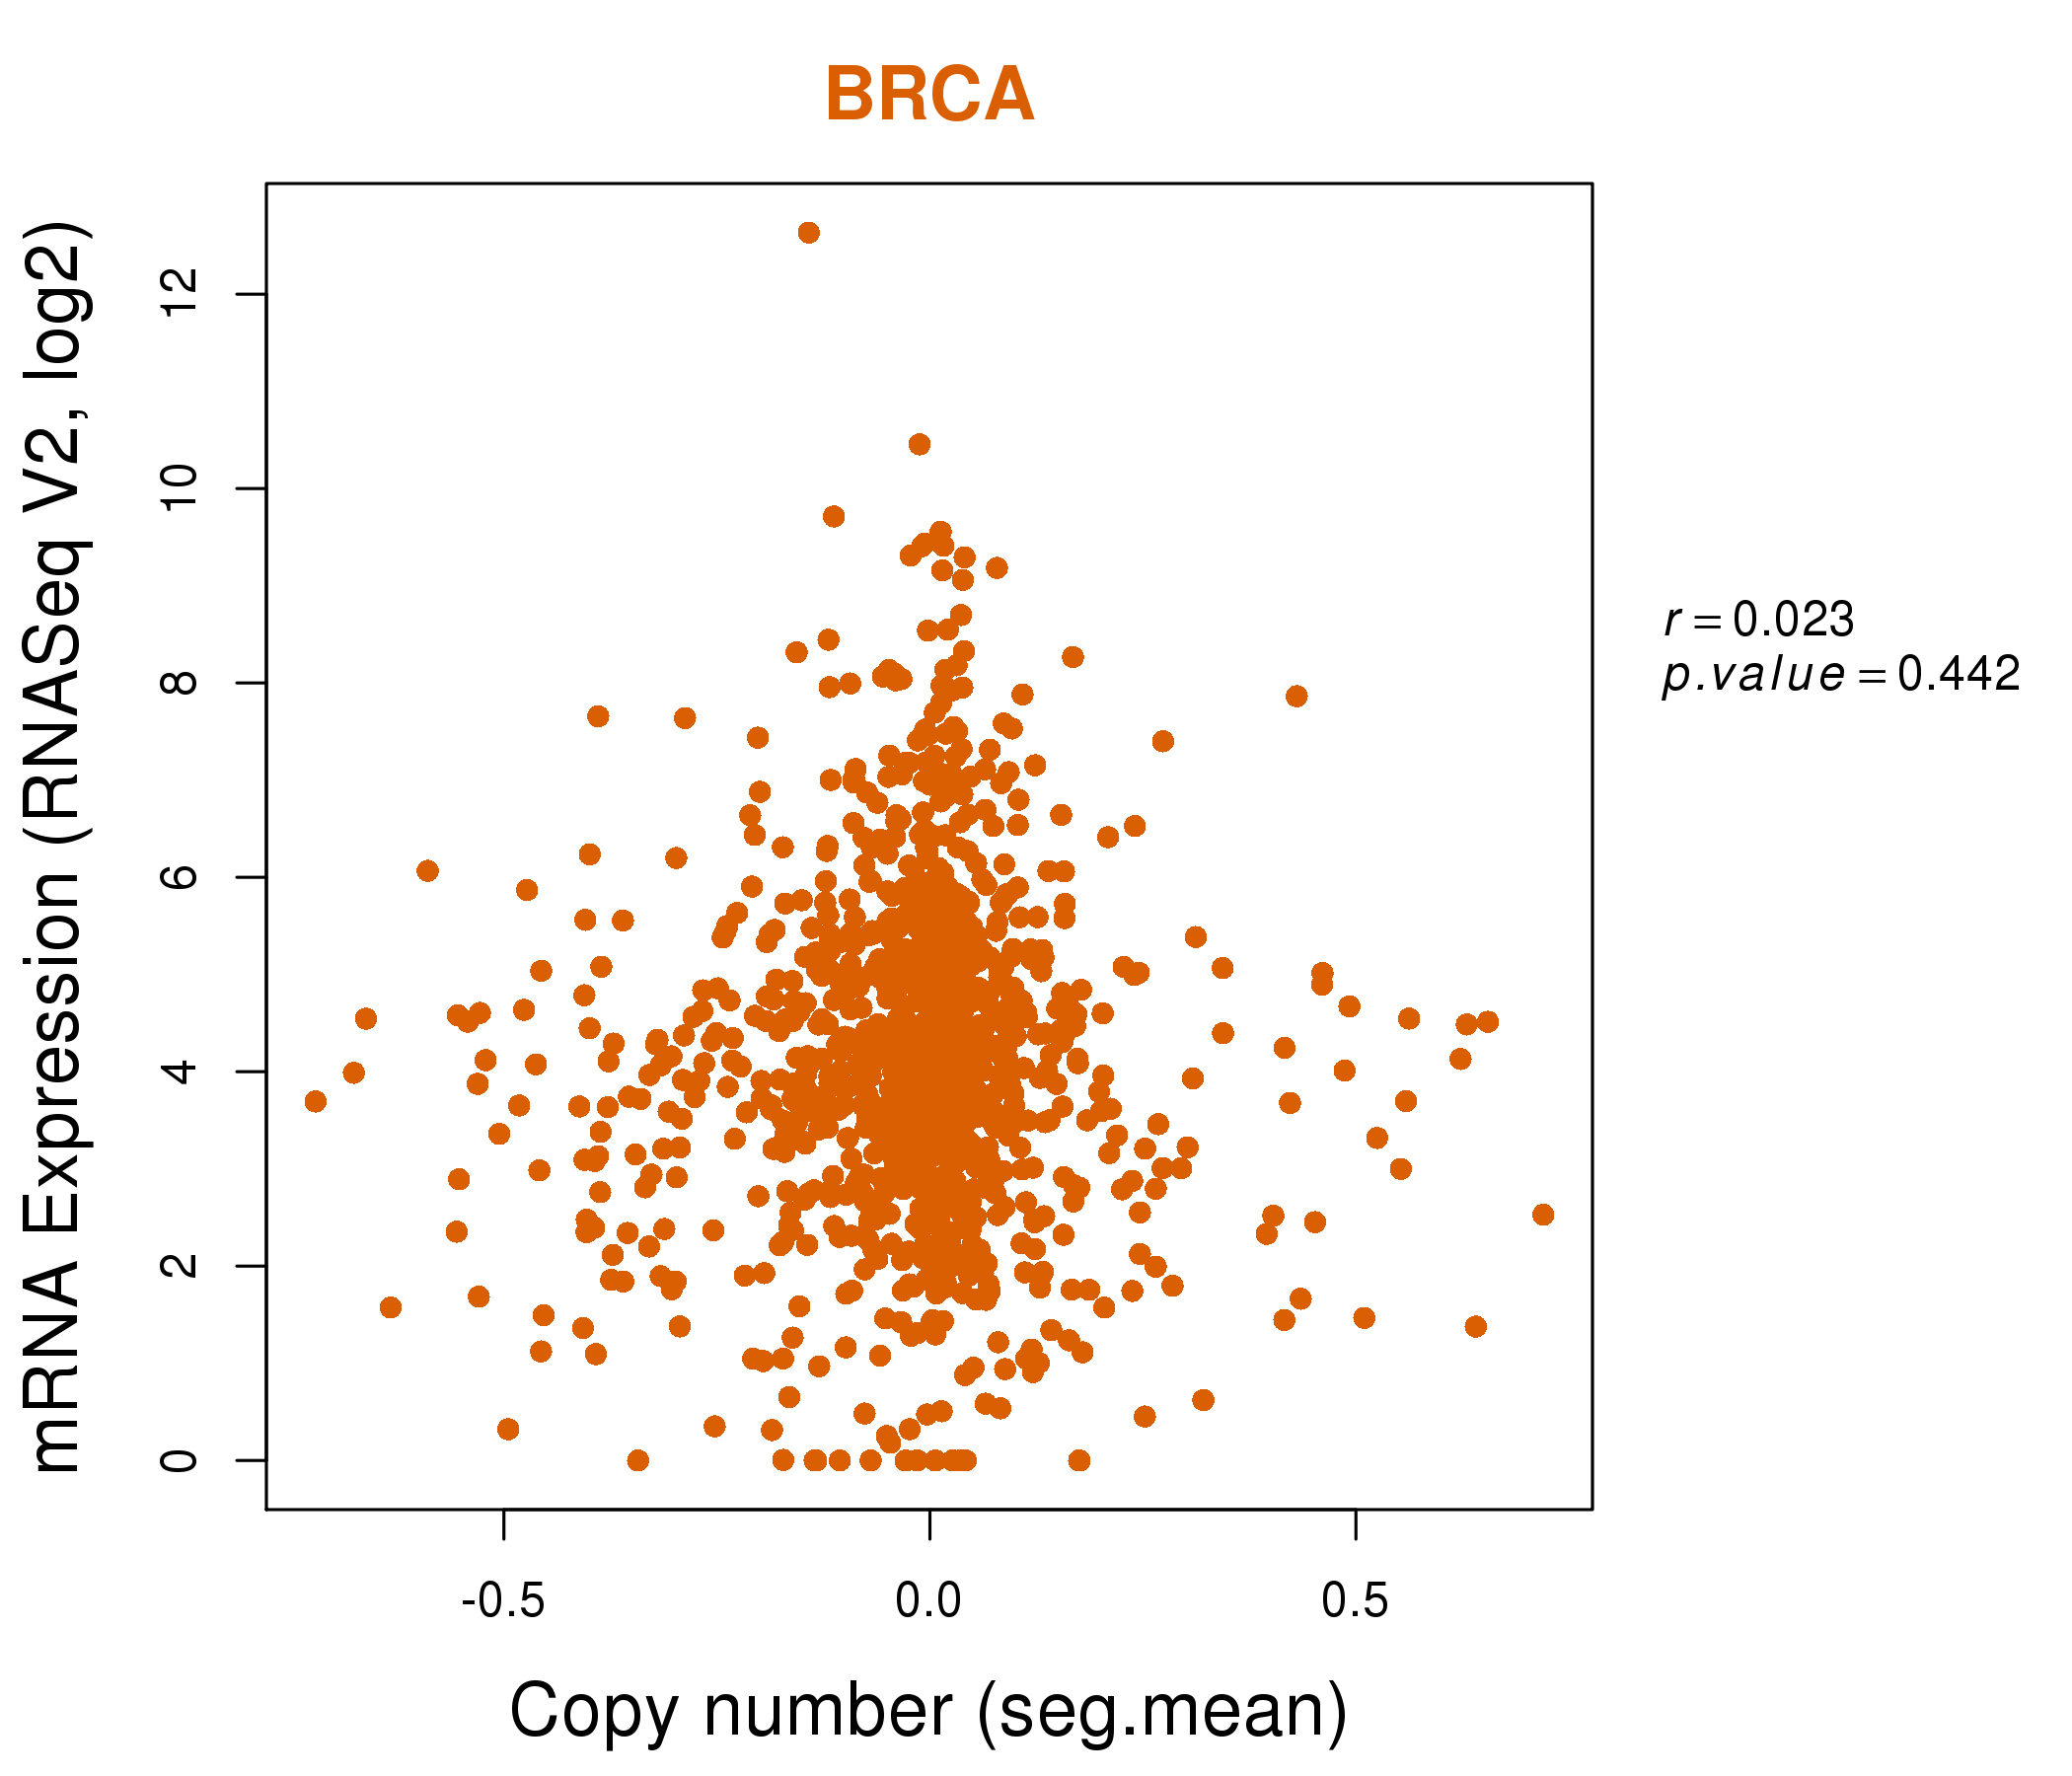
| * This plots show the correlation between CNV and gene expression. |
: Open all plots for all cancer types
 |
|
 |
|
| Top |
| Gene-Gene Network Information |
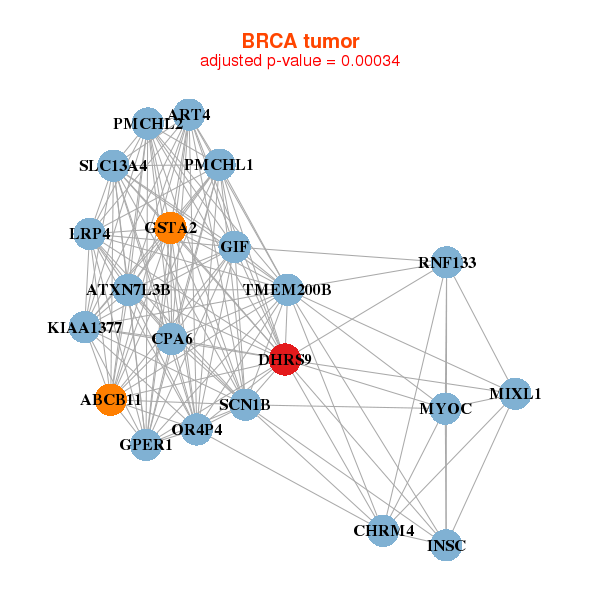
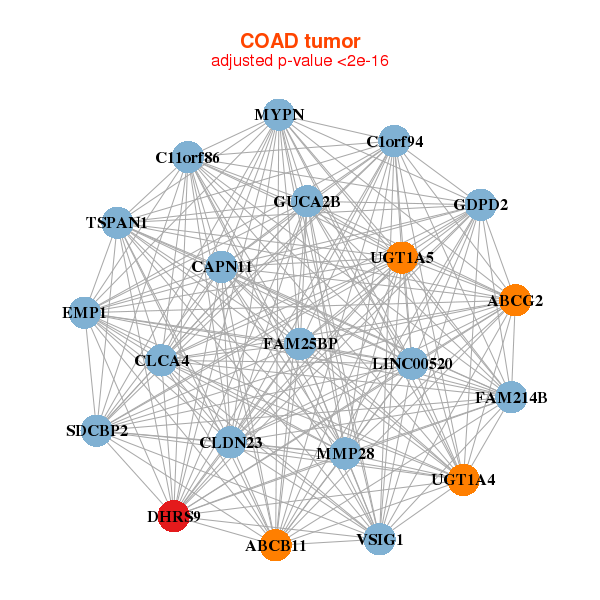
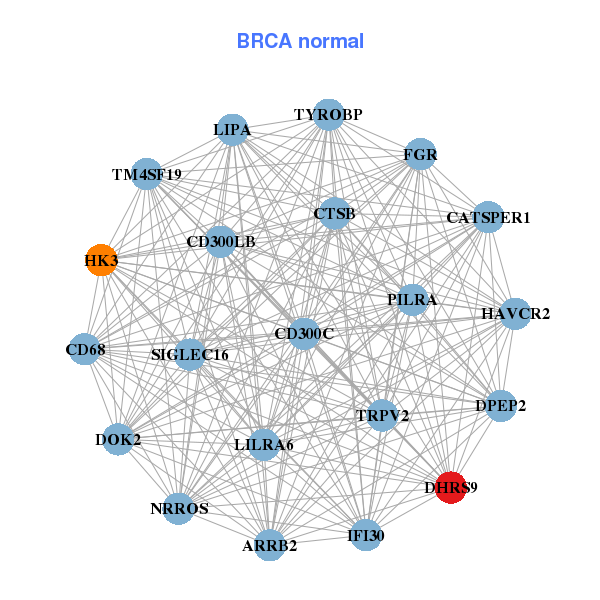
| * Co-Expression network figures were drawn using R package igraph. Only the top 20 genes with the highest correlations were shown. Red circle: input gene, orange circle: cell metabolism gene, sky circle: other gene |
: Open all plots for all cancer types
 |
|
| ABCB11,ART4,ATXN7L3B,CHRM4,CPA6,DHRS9,GIF, GPER1,GSTA2,INSC,KIAA1377,LRP4,MIXL1,MYOC, OR4P4,PMCHL1,PMCHL2,RNF133,SCN1B,SLC13A4,TMEM200B | ARRB2,CATSPER1,CD300C,CD300LB,CD68,CTSB,DHRS9, DOK2,DPEP2,FGR,HAVCR2,HK3,IFI30,LILRA6, LIPA,NRROS,PILRA,SIGLEC16,TM4SF19,TRPV2,TYROBP |
 |
|
| ABCB11,ABCG2,C11orf86,LINC00520,C1orf94,CAPN11,CLCA4, CLDN23,DHRS9,EMP1,FAM25BP,GDPD2,GUCA2B,FAM214B, MMP28,MYPN,SDCBP2,TSPAN1,UGT1A4,UGT1A5,VSIG1 | ABHD5,ADORA2B,B4GALT1,CAP1,CEACAM1,CXorf56,DHRS9, FABP1,GCNT3,GDPD3,HUS1,ITCH,MAPRE3,MIER3, NT5C2,PKIB,PSMD11,TPMT,UBE2A,UGP2,YWHAB |
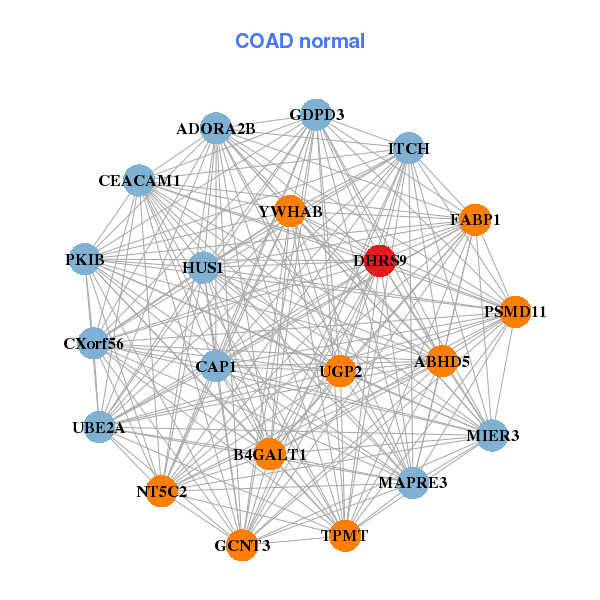
| * Co-Expression network figures were drawn using R package igraph. Only the top 20 genes with the highest correlations were shown. Red circle: input gene, orange circle: cell metabolism gene, sky circle: other gene |
: Open all plots for all cancer types
| Top |
: Open all interacting genes' information including KEGG pathway for all interacting genes from DAVID
| Top |
| Pharmacological Information for DHRS9 |
| There's no related Drug. |
| Top |
| Cross referenced IDs for DHRS9 |
| * We obtained these cross-references from Uniprot database. It covers 150 different DBs, 18 categories. http://www.uniprot.org/help/cross_references_section |
: Open all cross reference information
|
Copyright © 2016-Present - The Univsersity of Texas Health Science Center at Houston @ |