|
|||||||||||||||||||||||||||||||||||||||||||||||||||||||||||||||||||||||||||||||||||||||||||||||||||||||||||||||||||||||||||||||||||||||||||||||||||||||||||||||||||||||||||||||||||||||||||||||||||||||||||||||||||||||||||||||||||||||||||||||||||||||||||||||||||||||||||||||||||||||||||||||||||||||||||||||||||||||||||||||||||||||||||||||||||
| |
| Phenotypic Information (metabolism pathway, cancer, disease, phenome) |
| |
| |
| Gene-Gene Network Information: Co-Expression Network, Interacting Genes & KEGG |
| |
|


| Gene Summary for CDO1 |
| Basic gene info. | Gene symbol | CDO1 |
| Gene name | cysteine dioxygenase type 1 | |
| Synonyms | - | |
| Cytomap | UCSC genome browser: 5q23.2 | |
| Genomic location | chr5 :115140429-115152405 | |
| Type of gene | protein-coding | |
| RefGenes | NM_001801.2, | |
| Ensembl id | ENSG00000129596 | |
| Description | CDOCDO-Icysteine dioxygenase, type I | |
| Modification date | 20141207 | |
| dbXrefs | MIM : 603943 | |
| HGNC : HGNC | ||
| Ensembl : ENSG00000129596 | ||
| HPRD : 06806 | ||
| Vega : OTTHUMG00000128891 | ||
| Protein | UniProt: go to UniProt's Cross Reference DB Table | |
| Expression | CleanEX: HS_CDO1 | |
| BioGPS: 1036 | ||
| Gene Expression Atlas: ENSG00000129596 | ||
| The Human Protein Atlas: ENSG00000129596 | ||
| Pathway | NCI Pathway Interaction Database: CDO1 | |
| KEGG: CDO1 | ||
| REACTOME: CDO1 | ||
| ConsensusPathDB | ||
| Pathway Commons: CDO1 | ||
| Metabolism | MetaCyc: CDO1 | |
| HUMANCyc: CDO1 | ||
| Regulation | Ensembl's Regulation: ENSG00000129596 | |
| miRBase: chr5 :115,140,429-115,152,405 | ||
| TargetScan: NM_001801 | ||
| cisRED: ENSG00000129596 | ||
| Context | iHOP: CDO1 | |
| cancer metabolism search in PubMed: CDO1 | ||
| UCL Cancer Institute: CDO1 | ||
| Assigned class in ccmGDB | C | |
| Top |
| Phenotypic Information for CDO1(metabolism pathway, cancer, disease, phenome) |
| Cancer | CGAP: CDO1 |
| Familial Cancer Database: CDO1 | |
| * This gene is included in those cancer gene databases. |
|
|
|
|
|
| . | |||||||||||||||||||||||||||||||||||||||||||||||||||||||||||||||||||||||||||||||||||||||||||||||||||||||||||||||||||||||||||||||||||||||||||||||||||||||||||||||||||||||||||||||||||||||||||||||||||||||||||||||||||||||||||||||||||||||||||||||||||||||||||||||||||||||||||||||||||||||||||||||||||||||||||||||||||||||||||||||||||||||||||||
Oncogene 1 | Significant driver gene in | ||||||||||||||||||||||||||||||||||||||||||||||||||||||||||||||||||||||||||||||||||||||||||||||||||||||||||||||||||||||||||||||||||||||||||||||||||||||||||||||||||||||||||||||||||||||||||||||||||||||||||||||||||||||||||||||||||||||||||||||||||||||||||||||||||||||||||||||||||||||||||||||||||||||||||||||||||||||||||||||||||||||||||||||||||
| cf) number; DB name 1 Oncogene; http://nar.oxfordjournals.org/content/35/suppl_1/D721.long, 2 Tumor Suppressor gene; https://bioinfo.uth.edu/TSGene/, 3 Cancer Gene Census; http://www.nature.com/nrc/journal/v4/n3/abs/nrc1299.html, 4 CancerGenes; http://nar.oxfordjournals.org/content/35/suppl_1/D721.long, 5 Network of Cancer Gene; http://ncg.kcl.ac.uk/index.php, 1Therapeutic Vulnerabilities in Cancer; http://cbio.mskcc.org/cancergenomics/statius/ |
| KEGG_CYSTEINE_AND_METHIONINE_METABOLISM KEGG_TAURINE_AND_HYPOTAURINE_METABOLISM REACTOME_SULFUR_AMINO_ACID_METABOLISM REACTOME_METABOLISM_OF_AMINO_ACIDS_AND_DERIVATIVES | |
| OMIM | |
| Orphanet | |
| Disease | KEGG Disease: CDO1 |
| MedGen: CDO1 (Human Medical Genetics with Condition) | |
| ClinVar: CDO1 | |
| Phenotype | MGI: CDO1 (International Mouse Phenotyping Consortium) |
| PhenomicDB: CDO1 | |
| Mutations for CDO1 |
| * Under tables are showing count per each tissue to give us broad intuition about tissue specific mutation patterns.You can go to the detailed page for each mutation database's web site. |
| - Statistics for Tissue and Mutation type | Top |
 |
| - For Inter-chromosomal Variations |
| There's no inter-chromosomal structural variation. |
| - For Intra-chromosomal Variations |
| There's no intra-chromosomal structural variation. |
| Sample | Symbol_a | Chr_a | Start_a | End_a | Symbol_b | Chr_b | Start_b | End_b |
| breast | CDO1 | chr5 | 115150014 | 115150014 | chr8 | 129210269 | 129210269 | |
| breast | CDO1 | chr5 | 115150023 | 115150111 | chr5 | 129210109 | 129210221 |
| cf) Tissue number; Tissue name (1;Breast, 2;Central_nervous_system, 3;Haematopoietic_and_lymphoid_tissue, 4;Large_intestine, 5;Liver, 6;Lung, 7;Ovary, 8;Pancreas, 9;Prostate, 10;Skin, 11;Soft_tissue, 12;Upper_aerodigestive_tract) |
| * From mRNA Sanger sequences, Chitars2.0 arranged chimeric transcripts. This table shows CDO1 related fusion information. |
| ID | Head Gene | Tail Gene | Accession | Gene_a | qStart_a | qEnd_a | Chromosome_a | tStart_a | tEnd_a | Gene_a | qStart_a | qEnd_a | Chromosome_a | tStart_a | tEnd_a |
| Top |
| Mutation type/ Tissue ID | brca | cns | cerv | endome | haematopo | kidn | Lintest | liver | lung | ns | ovary | pancre | prost | skin | stoma | thyro | urina | |||
| Total # sample | 1 | |||||||||||||||||||
| GAIN (# sample) | ||||||||||||||||||||
| LOSS (# sample) | 1 |
| cf) Tissue ID; Tissue type (1; Breast, 2; Central_nervous_system, 3; Cervix, 4; Endometrium, 5; Haematopoietic_and_lymphoid_tissue, 6; Kidney, 7; Large_intestine, 8; Liver, 9; Lung, 10; NS, 11; Ovary, 12; Pancreas, 13; Prostate, 14; Skin, 15; Stomach, 16; Thyroid, 17; Urinary_tract) |
| Top |
|
 |
| Top |
| Stat. for Non-Synonymous SNVs (# total SNVs=23) | (# total SNVs=5) |
 |  |
(# total SNVs=0) | (# total SNVs=0) |
| Top |
| * When you move the cursor on each content, you can see more deailed mutation information on the Tooltip. Those are primary_site,primary_histology,mutation(aa),pubmedID. |
| GRCh37 position | Mutation(aa) | Unique sampleID count |
| chr5:115142176-115142176 | p.T148M | 3 |
| chr5:115152019-115152019 | p.D26N | 3 |
| chr5:115148929-115148929 | p.G66E | 2 |
| chr5:115148935-115148935 | p.D64G | 2 |
| chr5:115148957-115148957 | p.? | 2 |
| chr5:115142133-115142133 | p.D162D | 1 |
| chr5:115152031-115152031 | p.L22F | 1 |
| chr5:115146946-115146946 | p.T105T | 1 |
| chr5:115151936-115151936 | p.F53F | 1 |
| chr5:115142135-115142135 | p.D162H | 1 |
| Top |
|
 |
| Point Mutation/ Tissue ID | 1 | 2 | 3 | 4 | 5 | 6 | 7 | 8 | 9 | 10 | 11 | 12 | 13 | 14 | 15 | 16 | 17 | 18 | 19 | 20 |
| # sample | 1 | 4 | 1 | 7 | 1 | 7 | ||||||||||||||
| # mutation | 1 | 4 | 1 | 7 | 1 | 7 | ||||||||||||||
| nonsynonymous SNV | 1 | 3 | 5 | 1 | 4 | |||||||||||||||
| synonymous SNV | 1 | 1 | 2 | 3 |
| cf) Tissue ID; Tissue type (1; BLCA[Bladder Urothelial Carcinoma], 2; BRCA[Breast invasive carcinoma], 3; CESC[Cervical squamous cell carcinoma and endocervical adenocarcinoma], 4; COAD[Colon adenocarcinoma], 5; GBM[Glioblastoma multiforme], 6; Glioma Low Grade, 7; HNSC[Head and Neck squamous cell carcinoma], 8; KICH[Kidney Chromophobe], 9; KIRC[Kidney renal clear cell carcinoma], 10; KIRP[Kidney renal papillary cell carcinoma], 11; LAML[Acute Myeloid Leukemia], 12; LUAD[Lung adenocarcinoma], 13; LUSC[Lung squamous cell carcinoma], 14; OV[Ovarian serous cystadenocarcinoma ], 15; PAAD[Pancreatic adenocarcinoma], 16; PRAD[Prostate adenocarcinoma], 17; SKCM[Skin Cutaneous Melanoma], 18:STAD[Stomach adenocarcinoma], 19:THCA[Thyroid carcinoma], 20:UCEC[Uterine Corpus Endometrial Carcinoma]) |
| Top |
| * We represented just top 10 SNVs. When you move the cursor on each content, you can see more deailed mutation information on the Tooltip. Those are primary_site, primary_histology, mutation(aa), pubmedID. |
| Genomic Position | Mutation(aa) | Unique sampleID count |
| chr5:115152019 | p.D26N | 2 |
| chr5:115146889 | p.N115S | 1 |
| chr5:115152014 | p.S114S | 1 |
| chr5:115146915 | p.T105T | 1 |
| chr5:115146917 | p.G100E | 1 |
| chr5:115152029 | p.F53F | 1 |
| chr5:115146919 | p.Y50Y | 1 |
| chr5:115152030 | p.A39S | 1 |
| chr5:115146946 | p.E38K | 1 |
| chr5:115152060 | p.E31Q | 1 |
| * Copy number data were extracted from TCGA using R package TCGA-Assembler. The URLs of all public data files on TCGA DCC data server were gathered on Jan-05-2015. Function ProcessCNAData in TCGA-Assembler package was used to obtain gene-level copy number value which is calculated as the average copy number of the genomic region of a gene. |
 |
| cf) Tissue ID[Tissue type]: BLCA[Bladder Urothelial Carcinoma], BRCA[Breast invasive carcinoma], CESC[Cervical squamous cell carcinoma and endocervical adenocarcinoma], COAD[Colon adenocarcinoma], GBM[Glioblastoma multiforme], Glioma Low Grade, HNSC[Head and Neck squamous cell carcinoma], KICH[Kidney Chromophobe], KIRC[Kidney renal clear cell carcinoma], KIRP[Kidney renal papillary cell carcinoma], LAML[Acute Myeloid Leukemia], LUAD[Lung adenocarcinoma], LUSC[Lung squamous cell carcinoma], OV[Ovarian serous cystadenocarcinoma ], PAAD[Pancreatic adenocarcinoma], PRAD[Prostate adenocarcinoma], SKCM[Skin Cutaneous Melanoma], STAD[Stomach adenocarcinoma], THCA[Thyroid carcinoma], UCEC[Uterine Corpus Endometrial Carcinoma] |
| Top |
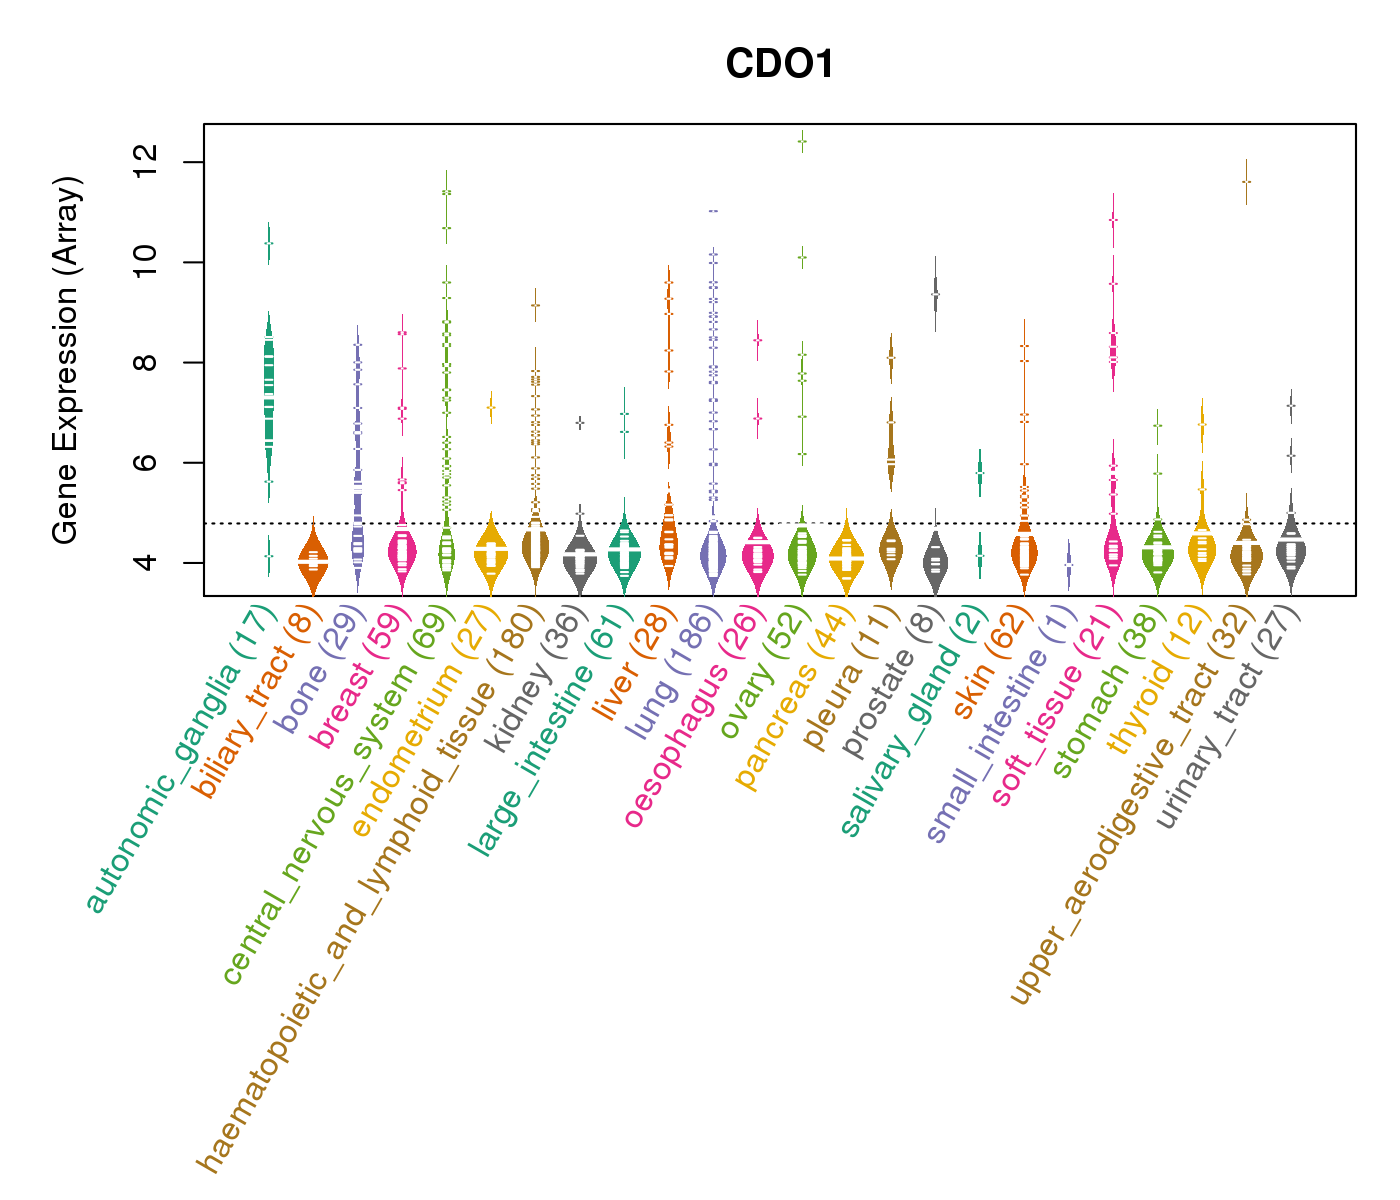
| Gene Expression for CDO1 |
| * CCLE gene expression data were extracted from CCLE_Expression_Entrez_2012-10-18.res: Gene-centric RMA-normalized mRNA expression data. |
 |
| * Normalized gene expression data of RNASeqV2 was extracted from TCGA using R package TCGA-Assembler. The URLs of all public data files on TCGA DCC data server were gathered at Jan-05-2015. Only eight cancer types have enough normal control samples for differential expression analysis. (t test, adjusted p<0.05 (using Benjamini-Hochberg FDR)) |
 |
| Top |
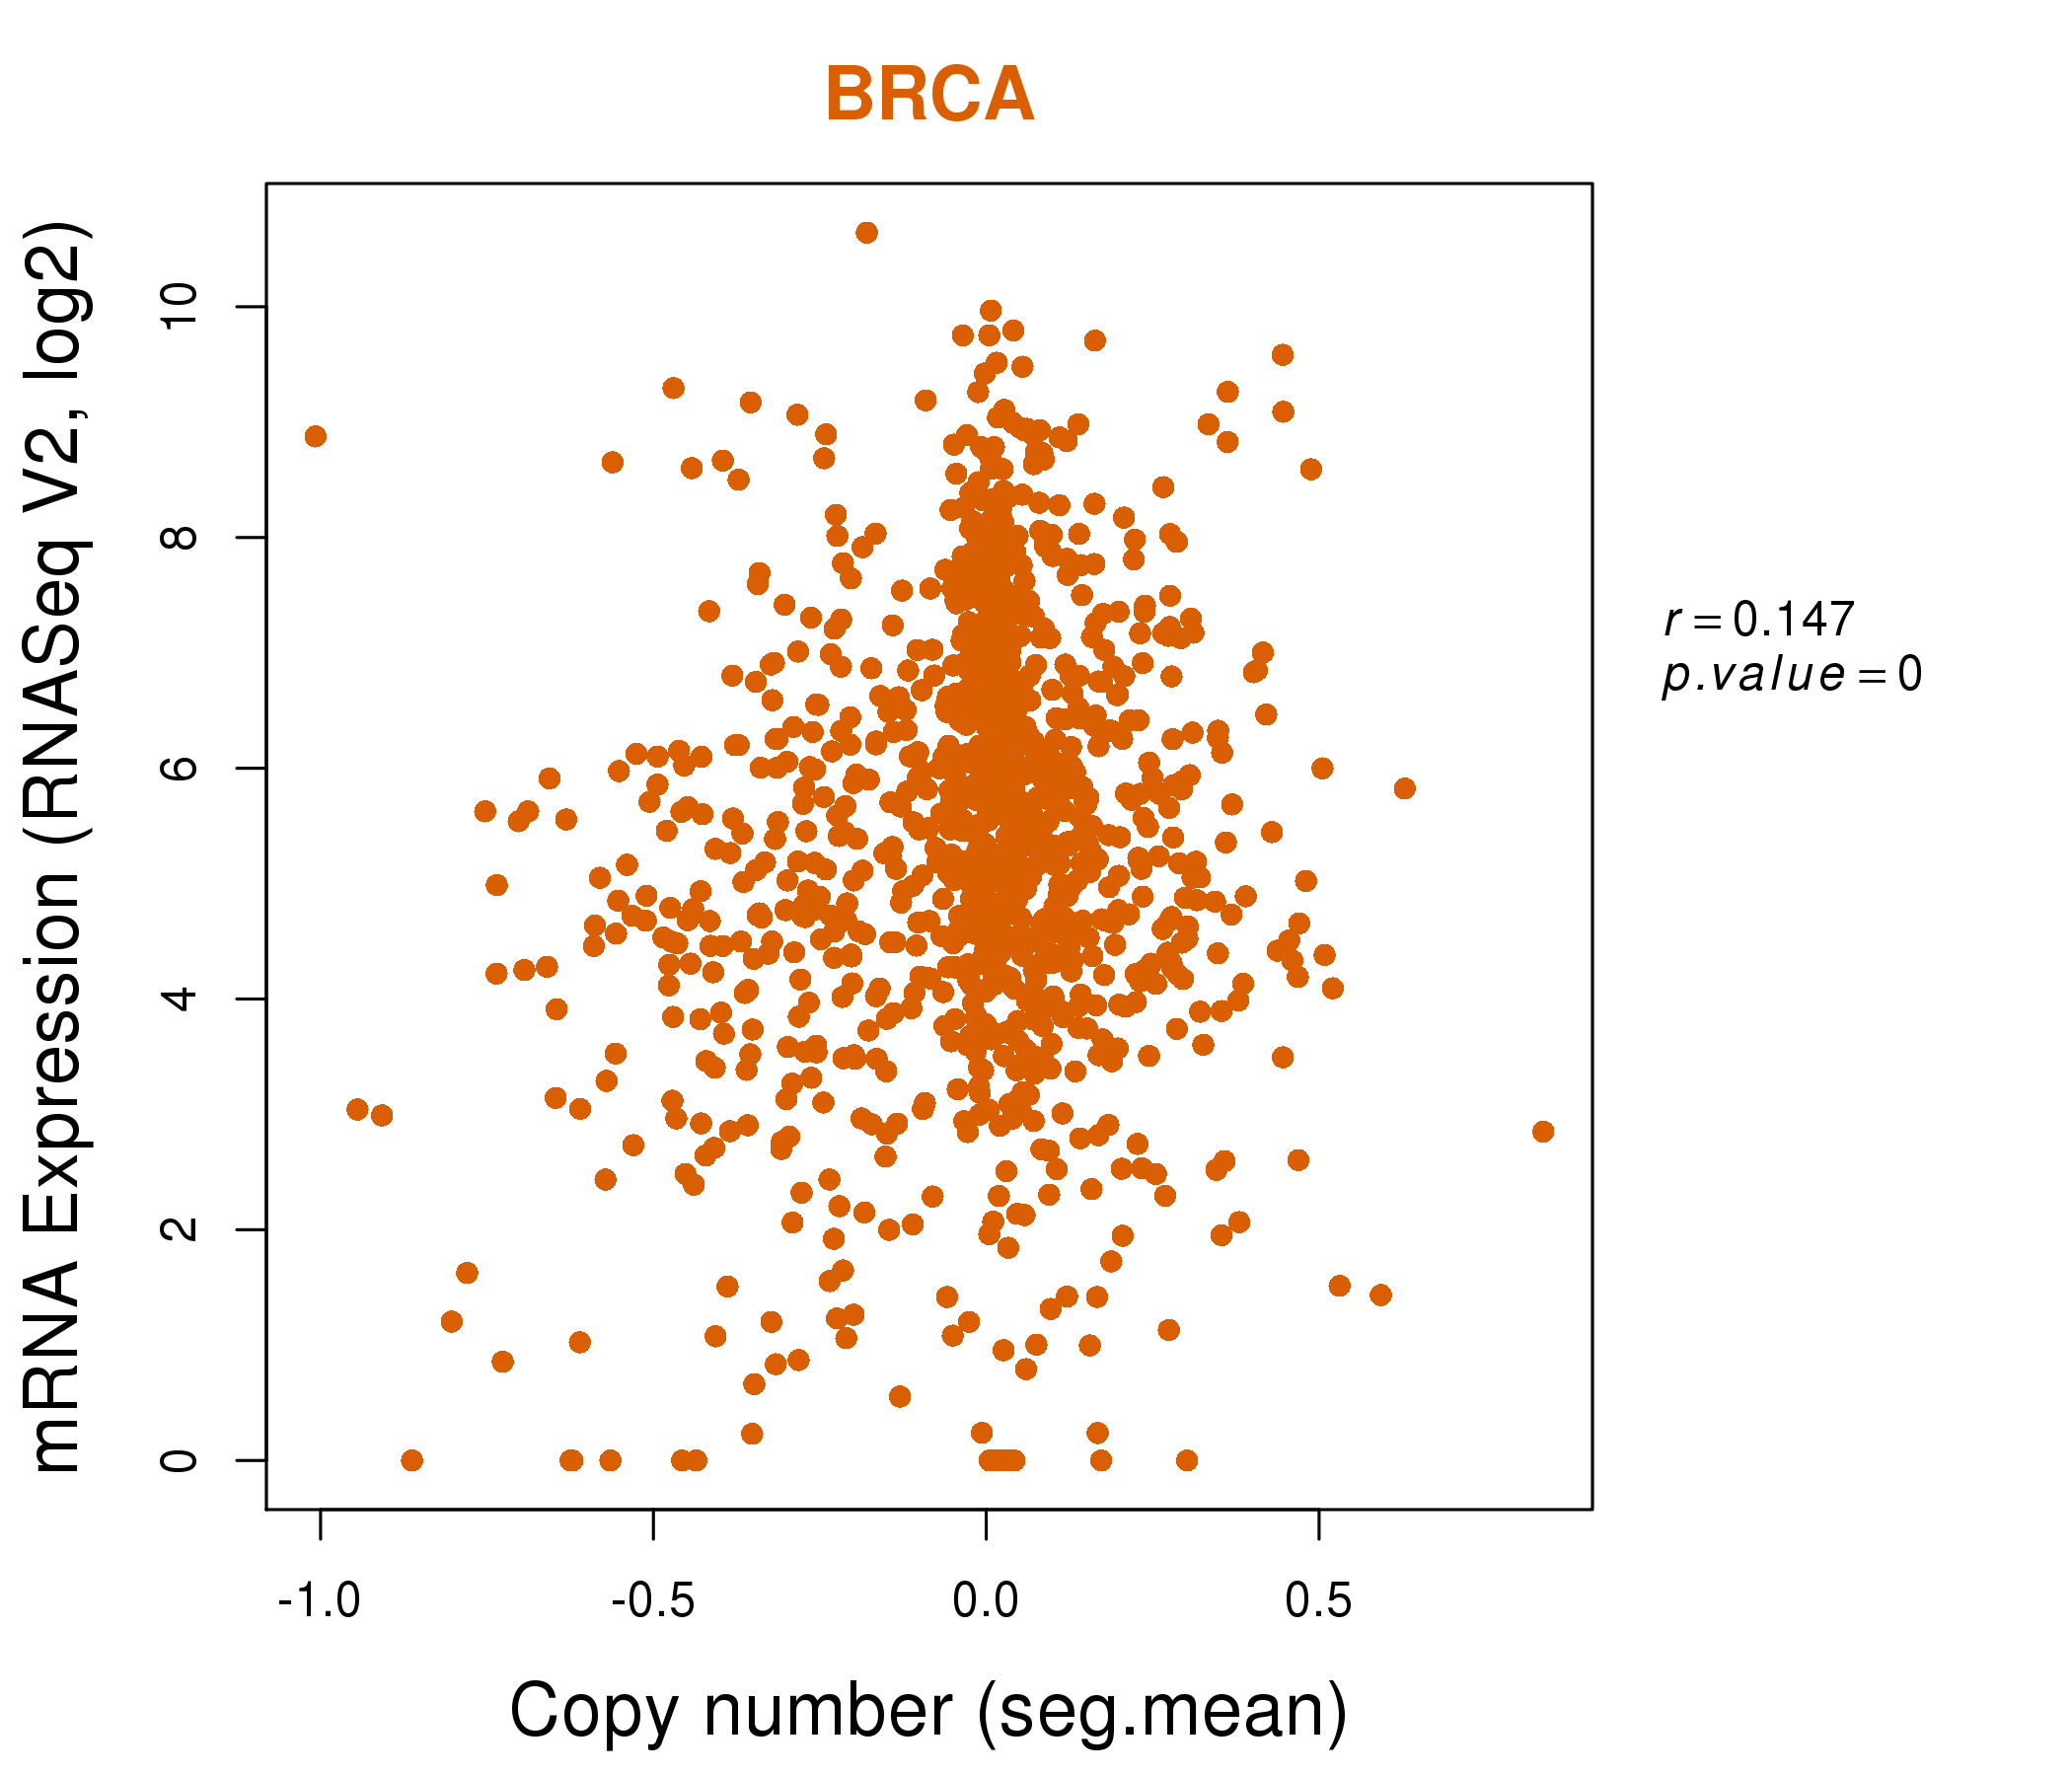
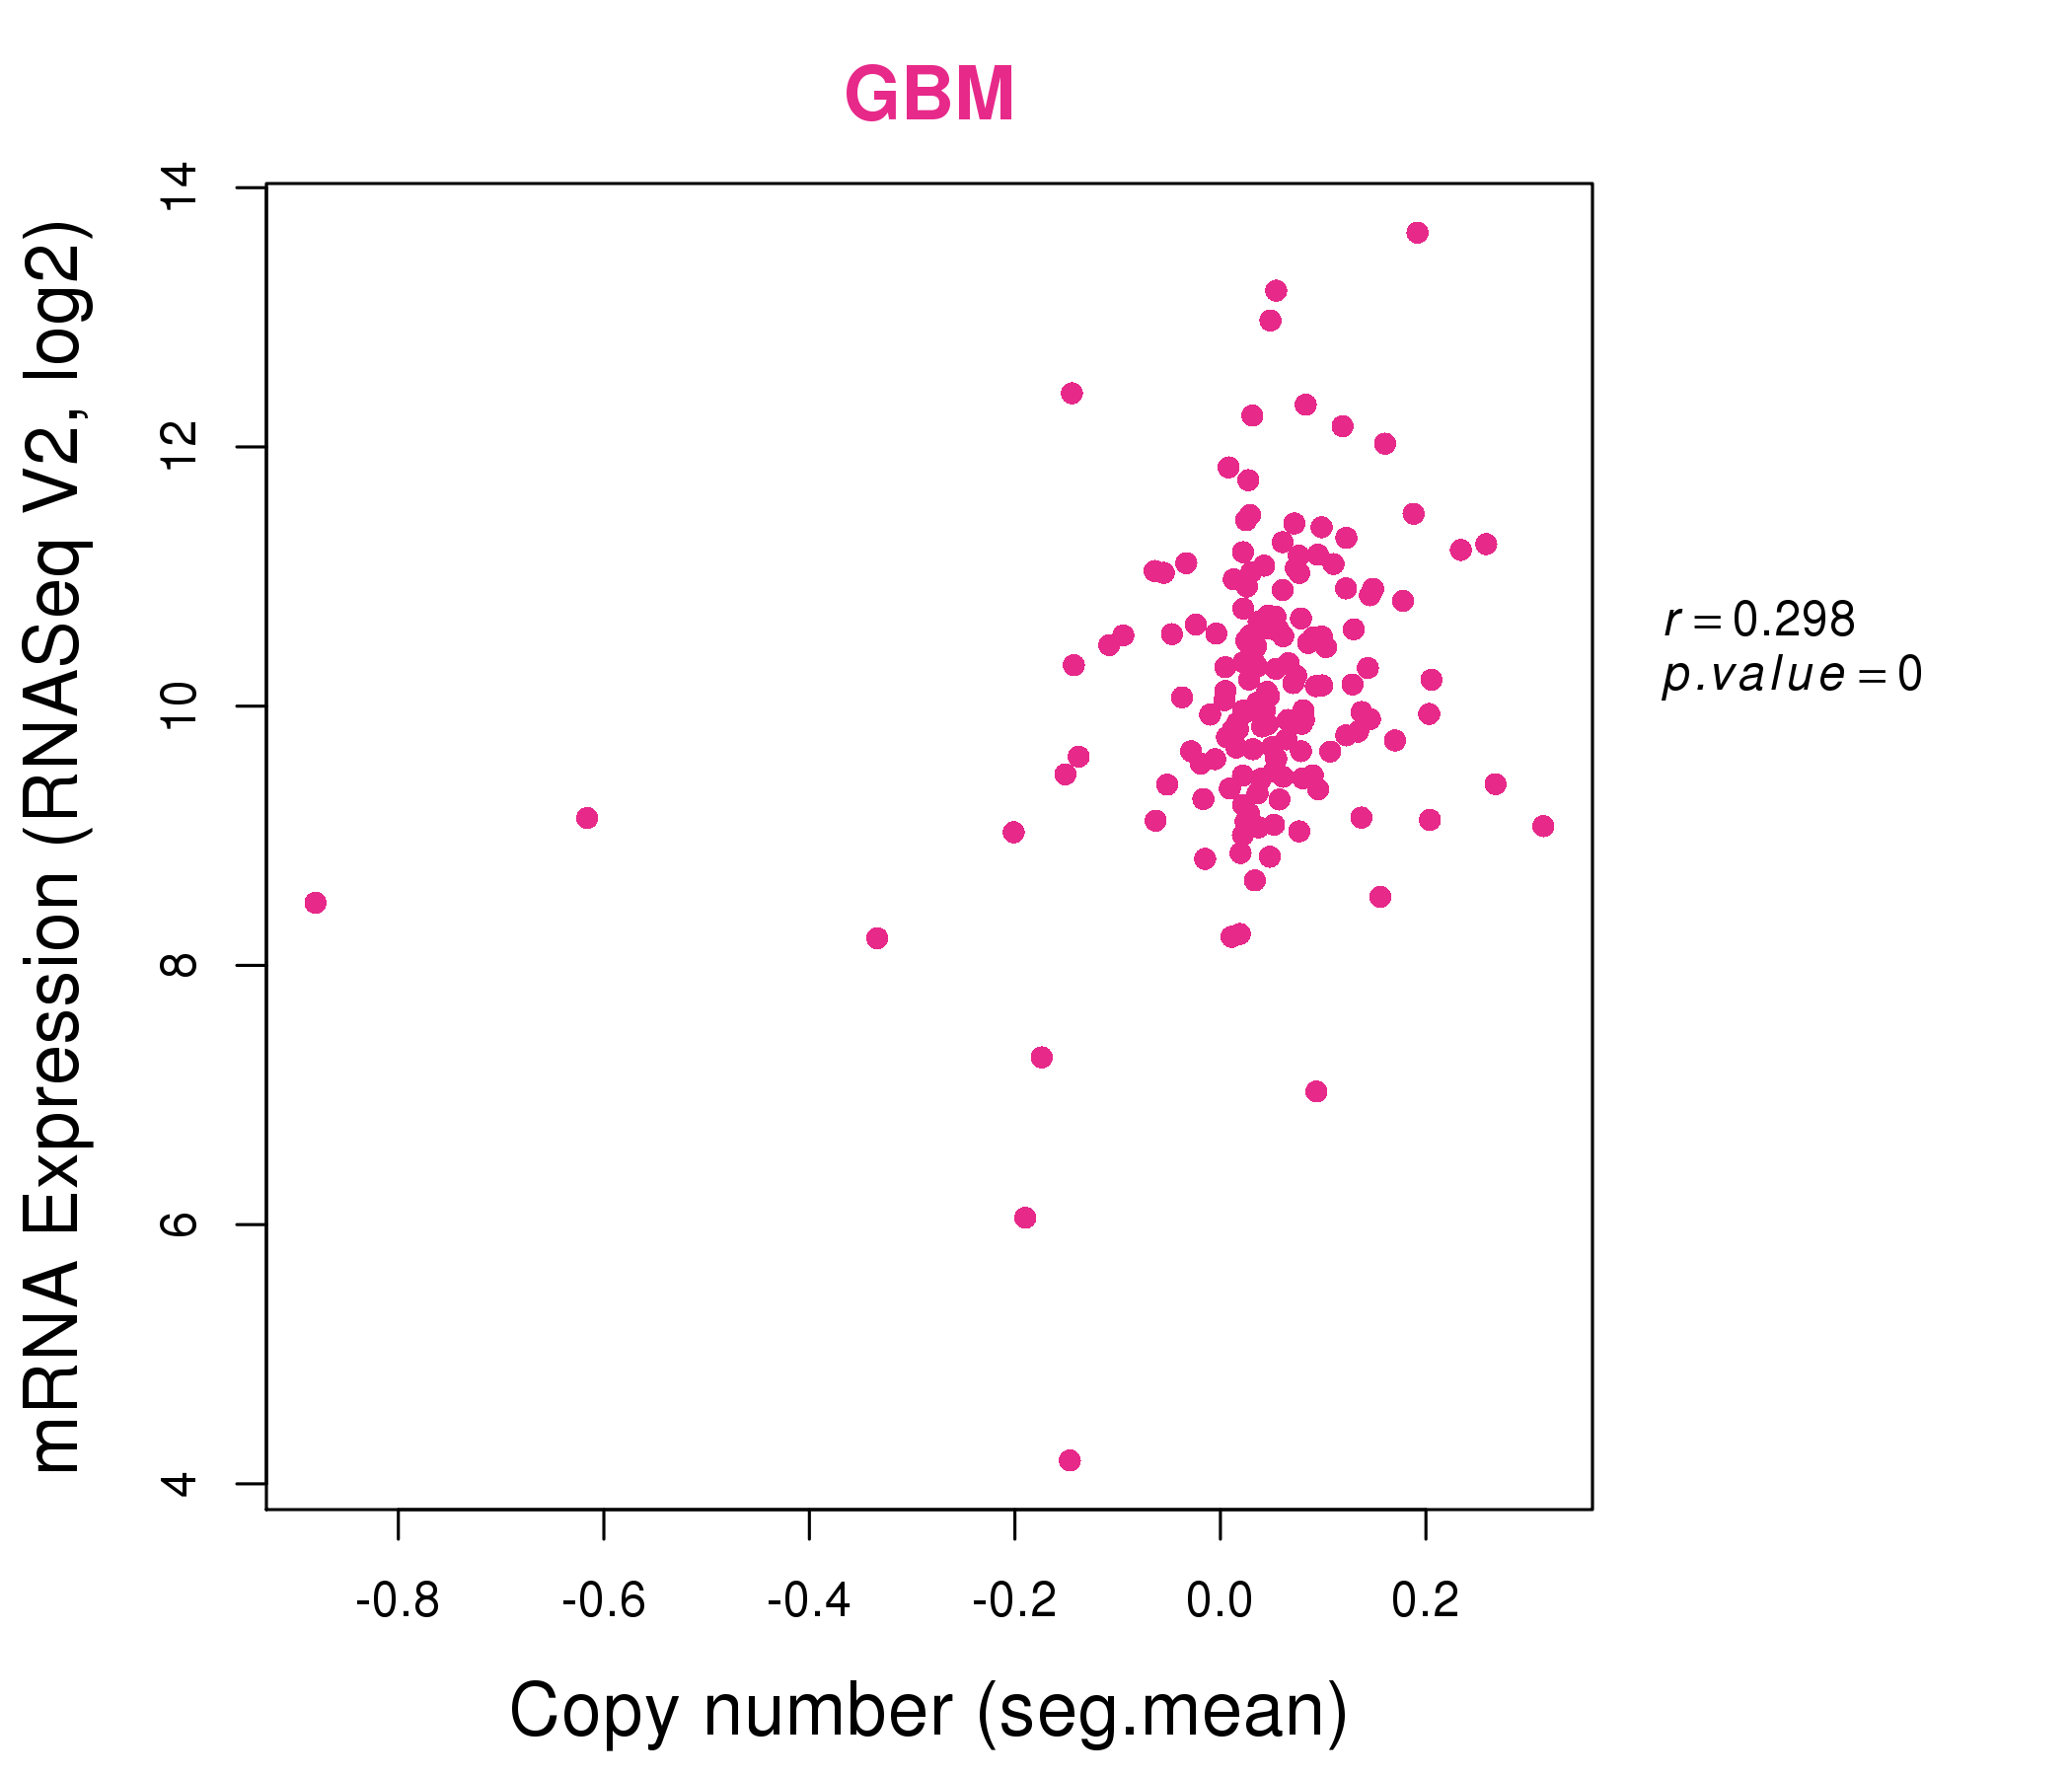
| * This plots show the correlation between CNV and gene expression. |
: Open all plots for all cancer types
 |
|
 |
|
| Top |
| Gene-Gene Network Information |
| * Co-Expression network figures were drawn using R package igraph. Only the top 20 genes with the highest correlations were shown. Red circle: input gene, orange circle: cell metabolism gene, sky circle: other gene |
: Open all plots for all cancer types
 |
| ||||
| ADH1B,ADIPOQ,AOC3,AQP7,AQP7P1,CDO1,CHRDL1, CIDEC,EBF1,FABP4,GLYAT,GPD1,HEPACAM,ITIH5, KCNIP2,LIPE,NPR1,PLIN1,RDH5,TMEM132C,TUSC5 | ABHD15,ACO1,ADIPOQ,ANO6,AQPEP,FAM213A,PQLC2L, CD36,CDO1,CIDEC,CPM,FBXO27,GHR,GNAI1, GYG2,KCNIP2,MARC1,PEX19,PLIN1,PPARG,TYRO3 | ||||
 |
| ||||
| ABCA6,ABCA8,ABCA9,ADH1B,CCDC80,CDO1,CLDN11, CYP1B1,EFEMP1,IGF1,LHFP,LOC339524,MFAP5,NGFR, PDE1B,PLAC9,PRICKLE1,SEMA3G,SFRP1,SLIT3,WISP2 | ALDH1A3,C2orf74,C7,CDH19,CDO1,ELOVL2,FGF1, FNDC4,GPX8,IL33,ISM1,LOC400043,MRAS,NGF, NRN1,RANBP3L,SEPT4,SNCA,SNCG,TMEM88,WDR86 |


| * Co-Expression network figures were drawn using R package igraph. Only the top 20 genes with the highest correlations were shown. Red circle: input gene, orange circle: cell metabolism gene, sky circle: other gene |
: Open all plots for all cancer types
| Top |
: Open all interacting genes' information including KEGG pathway for all interacting genes from DAVID
| Top |
| Pharmacological Information for CDO1 |
| DB Category | DB Name | DB's ID and Url link |
| * Gene Centered Interaction Network. |
 |
| * Drug Centered Interaction Network. |
| DrugBank ID | Target Name | Drug Groups | Generic Name | Drug Centered Network | Drug Structure |
| DB00151 | cysteine dioxygenase type 1 | approved; nutraceutical | L-Cysteine | 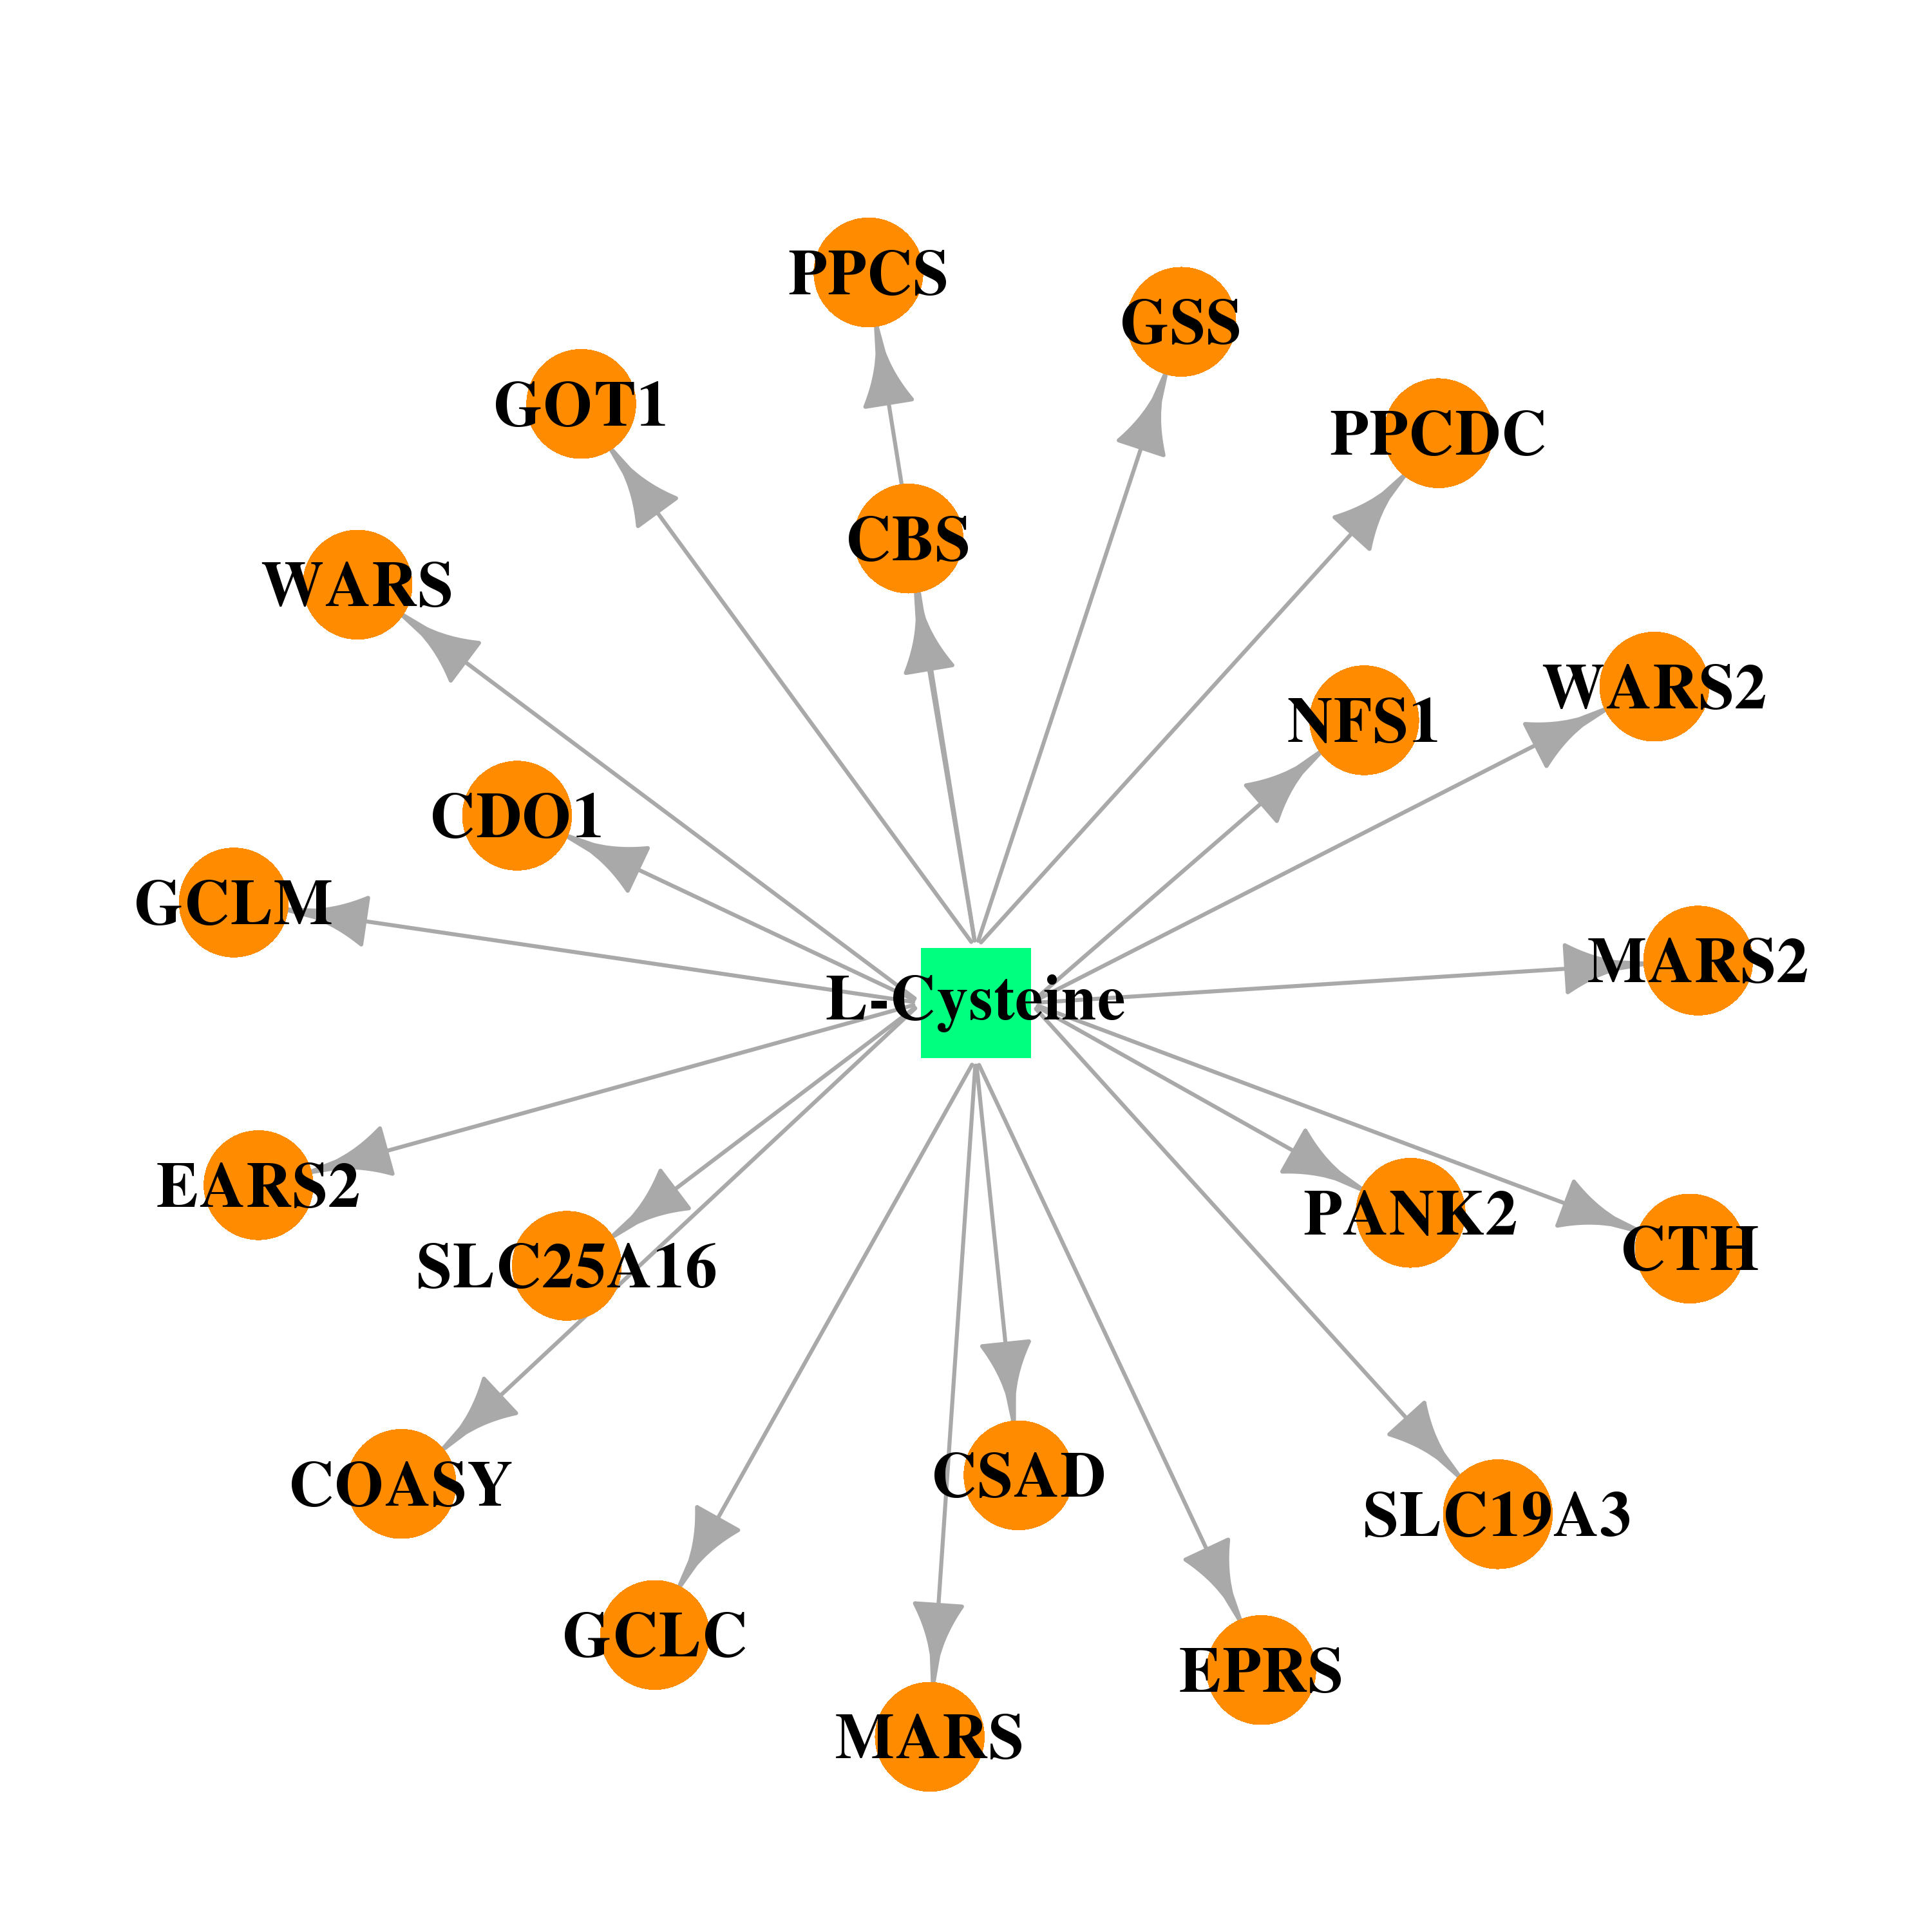 |  |
| DB00157 | cysteine dioxygenase type 1 | approved; nutraceutical | NADH |  |  |
| Top |
| Cross referenced IDs for CDO1 |
| * We obtained these cross-references from Uniprot database. It covers 150 different DBs, 18 categories. http://www.uniprot.org/help/cross_references_section |
: Open all cross reference information
|
Copyright © 2016-Present - The Univsersity of Texas Health Science Center at Houston @ |