|
||||||||||||||||||||
| |
| Phenotypic Information (metabolism pathway, cancer, disease, phenome) |
| |
| |
| Gene-Gene Network Information: Co-Expression Network, Interacting Genes & KEGG |
| |
|


| Gene Summary for TUBA1B |
| Top |
| Phenotypic Information for TUBA1B(metabolism pathway, cancer, disease, phenome) |
| Cancer | CGAP: TUBA1B |
| Familial Cancer Database: TUBA1B | |
| * This gene is included in those cancer gene databases. |
|
|
|
|
|
| . | ||||||||||||||
Oncogene 1 | Significant driver gene in | |||||||||||||||||||
| cf) number; DB name 1 Oncogene; http://nar.oxfordjournals.org/content/35/suppl_1/D721.long, 2 Tumor Suppressor gene; https://bioinfo.uth.edu/TSGene/, 3 Cancer Gene Census; http://www.nature.com/nrc/journal/v4/n3/abs/nrc1299.html, 4 CancerGenes; http://nar.oxfordjournals.org/content/35/suppl_1/D721.long, 5 Network of Cancer Gene; http://ncg.kcl.ac.uk/index.php, 1Therapeutic Vulnerabilities in Cancer; http://cbio.mskcc.org/cancergenomics/statius/ |
| REACTOME_METABOLISM_OF_PROTEINS | |
| OMIM | |
| Orphanet | |
| Disease | KEGG Disease: TUBA1B |
| MedGen: TUBA1B (Human Medical Genetics with Condition) | |
| ClinVar: TUBA1B | |
| Phenotype | MGI: TUBA1B (International Mouse Phenotyping Consortium) |
| PhenomicDB: TUBA1B | |
| Mutations for TUBA1B |
| * Under tables are showing count per each tissue to give us broad intuition about tissue specific mutation patterns.You can go to the detailed page for each mutation database's web site. |
| There's no structural variation information in COSMIC data for this gene. |
| * From mRNA Sanger sequences, Chitars2.0 arranged chimeric transcripts. This table shows TUBA1B related fusion information. |
| ID | Head Gene | Tail Gene | Accession | Gene_a | qStart_a | qEnd_a | Chromosome_a | tStart_a | tEnd_a | Gene_a | qStart_a | qEnd_a | Chromosome_a | tStart_a | tEnd_a |
| BE143246 | PTPN18 | 7 | 83 | 2 | 131132487 | 131132563 | TUBA1B | 77 | 178 | 12 | 49521691 | 49521792 | |
| DA127449 | TUBA1B | 1 | 100 | 12 | 49525079 | 49525178 | GRM4 | 98 | 584 | 6 | 34101152 | 34101637 | |
| CN426333 | TUBA1B | 1 | 515 | 12 | 49522507 | 49523433 | ZSCAN29 | 510 | 628 | 15 | 43651109 | 43651227 | |
| CD621808 | NPTXR | 1 | 201 | 22 | 39215153 | 39215353 | TUBA1B | 201 | 504 | 12 | 49523142 | 49525129 | |
| H93515 | FTL | 1 | 199 | 19 | 49468581 | 49468779 | TUBA1B | 192 | 377 | 12 | 49522392 | 49522573 | |
| BE960893 | TUBA1B | 1 | 130 | 12 | 49521750 | 49521880 | F8A3 | 124 | 559 | X | 154686903 | 154687339 | |
| CD621809 | NPTXR | 1 | 201 | 22 | 39215153 | 39215353 | TUBA1B | 201 | 504 | 12 | 49523142 | 49525129 | |
| DA368267 | SNRPN | 1 | 91 | 15 | 25336937 | 25337026 | TUBA1B | 90 | 581 | 12 | 49522701 | 49525178 | |
| AV718300 | KIF1B | 1 | 130 | 1 | 10401387 | 10401516 | TUBA1B | 124 | 157 | 12 | 49521741 | 49521774 | |
| DA077791 | TUBA1B | 1 | 99 | 12 | 49525080 | 49525178 | PFKM | 98 | 502 | 12 | 48531503 | 48534653 | |
| AI880459 | TUBA1B | 1 | 72 | 12 | 49521577 | 49521648 | RNU5F-1 | 71 | 155 | 1 | 220160714 | 220161983 | |
| BC001209 | TMEM246 | 44 | 1985 | 9 | 104237608 | 104249328 | TUBA1B | 1986 | 3598 | 12 | 49521565 | 49525164 | |
| DB368876 | TUBA1B | 1 | 131 | 12 | 49521569 | 49521699 | CNOT7 | 132 | 523 | 8 | 17087282 | 17087676 | |
| Top |
| There's no copy number variation information in COSMIC data for this gene. |
| Top |
|
 |
| Top |
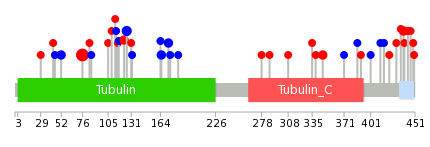
| Stat. for Non-Synonymous SNVs (# total SNVs=32) | (# total SNVs=9) |
 |  |
(# total SNVs=0) | (# total SNVs=0) |
| Top |
| * When you move the cursor on each content, you can see more deailed mutation information on the Tooltip. Those are primary_site,primary_histology,mutation(aa),pubmedID. |
| GRCh37 position | Mutation(aa) | Unique sampleID count |
| chr12:49523173-49523173 | p.D76A | 11 |
| chr12:49522719-49522719 | p.A126A | 3 |
| chr12:49522578-49522578 | p.P173P | 2 |
| chr12:49522602-49522602 | p.S165S | 2 |
| chr12:49522057-49522057 | p.C347F | 2 |
| chr12:49521785-49521785 | p.D438Y | 2 |
| chr12:49523033-49523033 | p.R123C | 2 |
| chr12:49523353-49523353 | p.F52F | 2 |
| chr12:49522264-49522264 | p.A278V | 1 |
| chr12:49523054-49523054 | p.D116H | 1 |
| Top |
|
 |
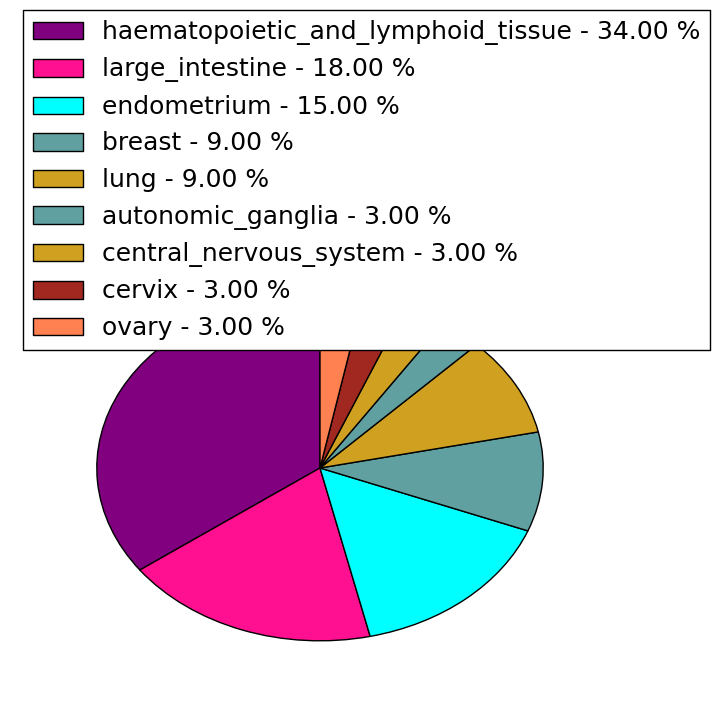
| Point Mutation/ Tissue ID | 1 | 2 | 3 | 4 | 5 | 6 | 7 | 8 | 9 | 10 | 11 | 12 | 13 | 14 | 15 | 16 | 17 | 18 | 19 | 20 |
| # sample | 2 | 1 | 6 | 1 | 3 | 2 | 2 | 7 | 3 | 5 | ||||||||||
| # mutation | 2 | 1 | 5 | 1 | 3 | 2 | 2 | 6 | 3 | 5 | ||||||||||
| nonsynonymous SNV | 2 | 1 | 5 | 1 | 2 | 1 | 2 | 4 | 1 | 5 | ||||||||||
| synonymous SNV | 1 | 1 | 2 | 2 |
| cf) Tissue ID; Tissue type (1; BLCA[Bladder Urothelial Carcinoma], 2; BRCA[Breast invasive carcinoma], 3; CESC[Cervical squamous cell carcinoma and endocervical adenocarcinoma], 4; COAD[Colon adenocarcinoma], 5; GBM[Glioblastoma multiforme], 6; Glioma Low Grade, 7; HNSC[Head and Neck squamous cell carcinoma], 8; KICH[Kidney Chromophobe], 9; KIRC[Kidney renal clear cell carcinoma], 10; KIRP[Kidney renal papillary cell carcinoma], 11; LAML[Acute Myeloid Leukemia], 12; LUAD[Lung adenocarcinoma], 13; LUSC[Lung squamous cell carcinoma], 14; OV[Ovarian serous cystadenocarcinoma ], 15; PAAD[Pancreatic adenocarcinoma], 16; PRAD[Prostate adenocarcinoma], 17; SKCM[Skin Cutaneous Melanoma], 18:STAD[Stomach adenocarcinoma], 19:THCA[Thyroid carcinoma], 20:UCEC[Uterine Corpus Endometrial Carcinoma]) |
| Top |
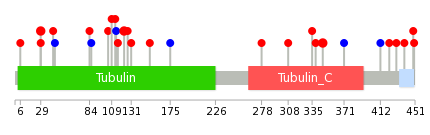
| * We represented just top 10 SNVs. When you move the cursor on each content, you can see more deailed mutation information on the Tooltip. Those are primary_site, primary_histology, mutation(aa), pubmedID. |
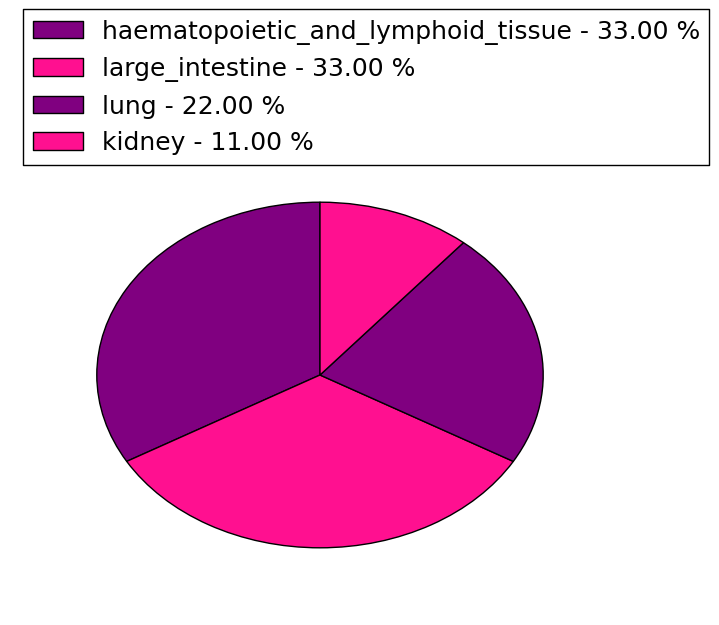
| Genomic Position | Mutation(aa) | Unique sampleID count |
| chr12:49523423 | p.R123C | 2 |
| chr12:49523033 | p.C347F | 2 |
| chr12:49522057 | p.G29D | 2 |
| chr12:49523074 | p.G131S | 1 |
| chr12:49522175 | p.D127N | 1 |
| chr12:49523086 | p.E450K | 1 |
| chr12:49521749 | p.E449Q | 1 |
| chr12:49522264 | p.D116H | 1 |
| chr12:49523142 | p.S439Y | 1 |
| chr12:49521752 | p.I114I | 1 |
| * Copy number data were extracted from TCGA using R package TCGA-Assembler. The URLs of all public data files on TCGA DCC data server were gathered on Jan-05-2015. Function ProcessCNAData in TCGA-Assembler package was used to obtain gene-level copy number value which is calculated as the average copy number of the genomic region of a gene. |
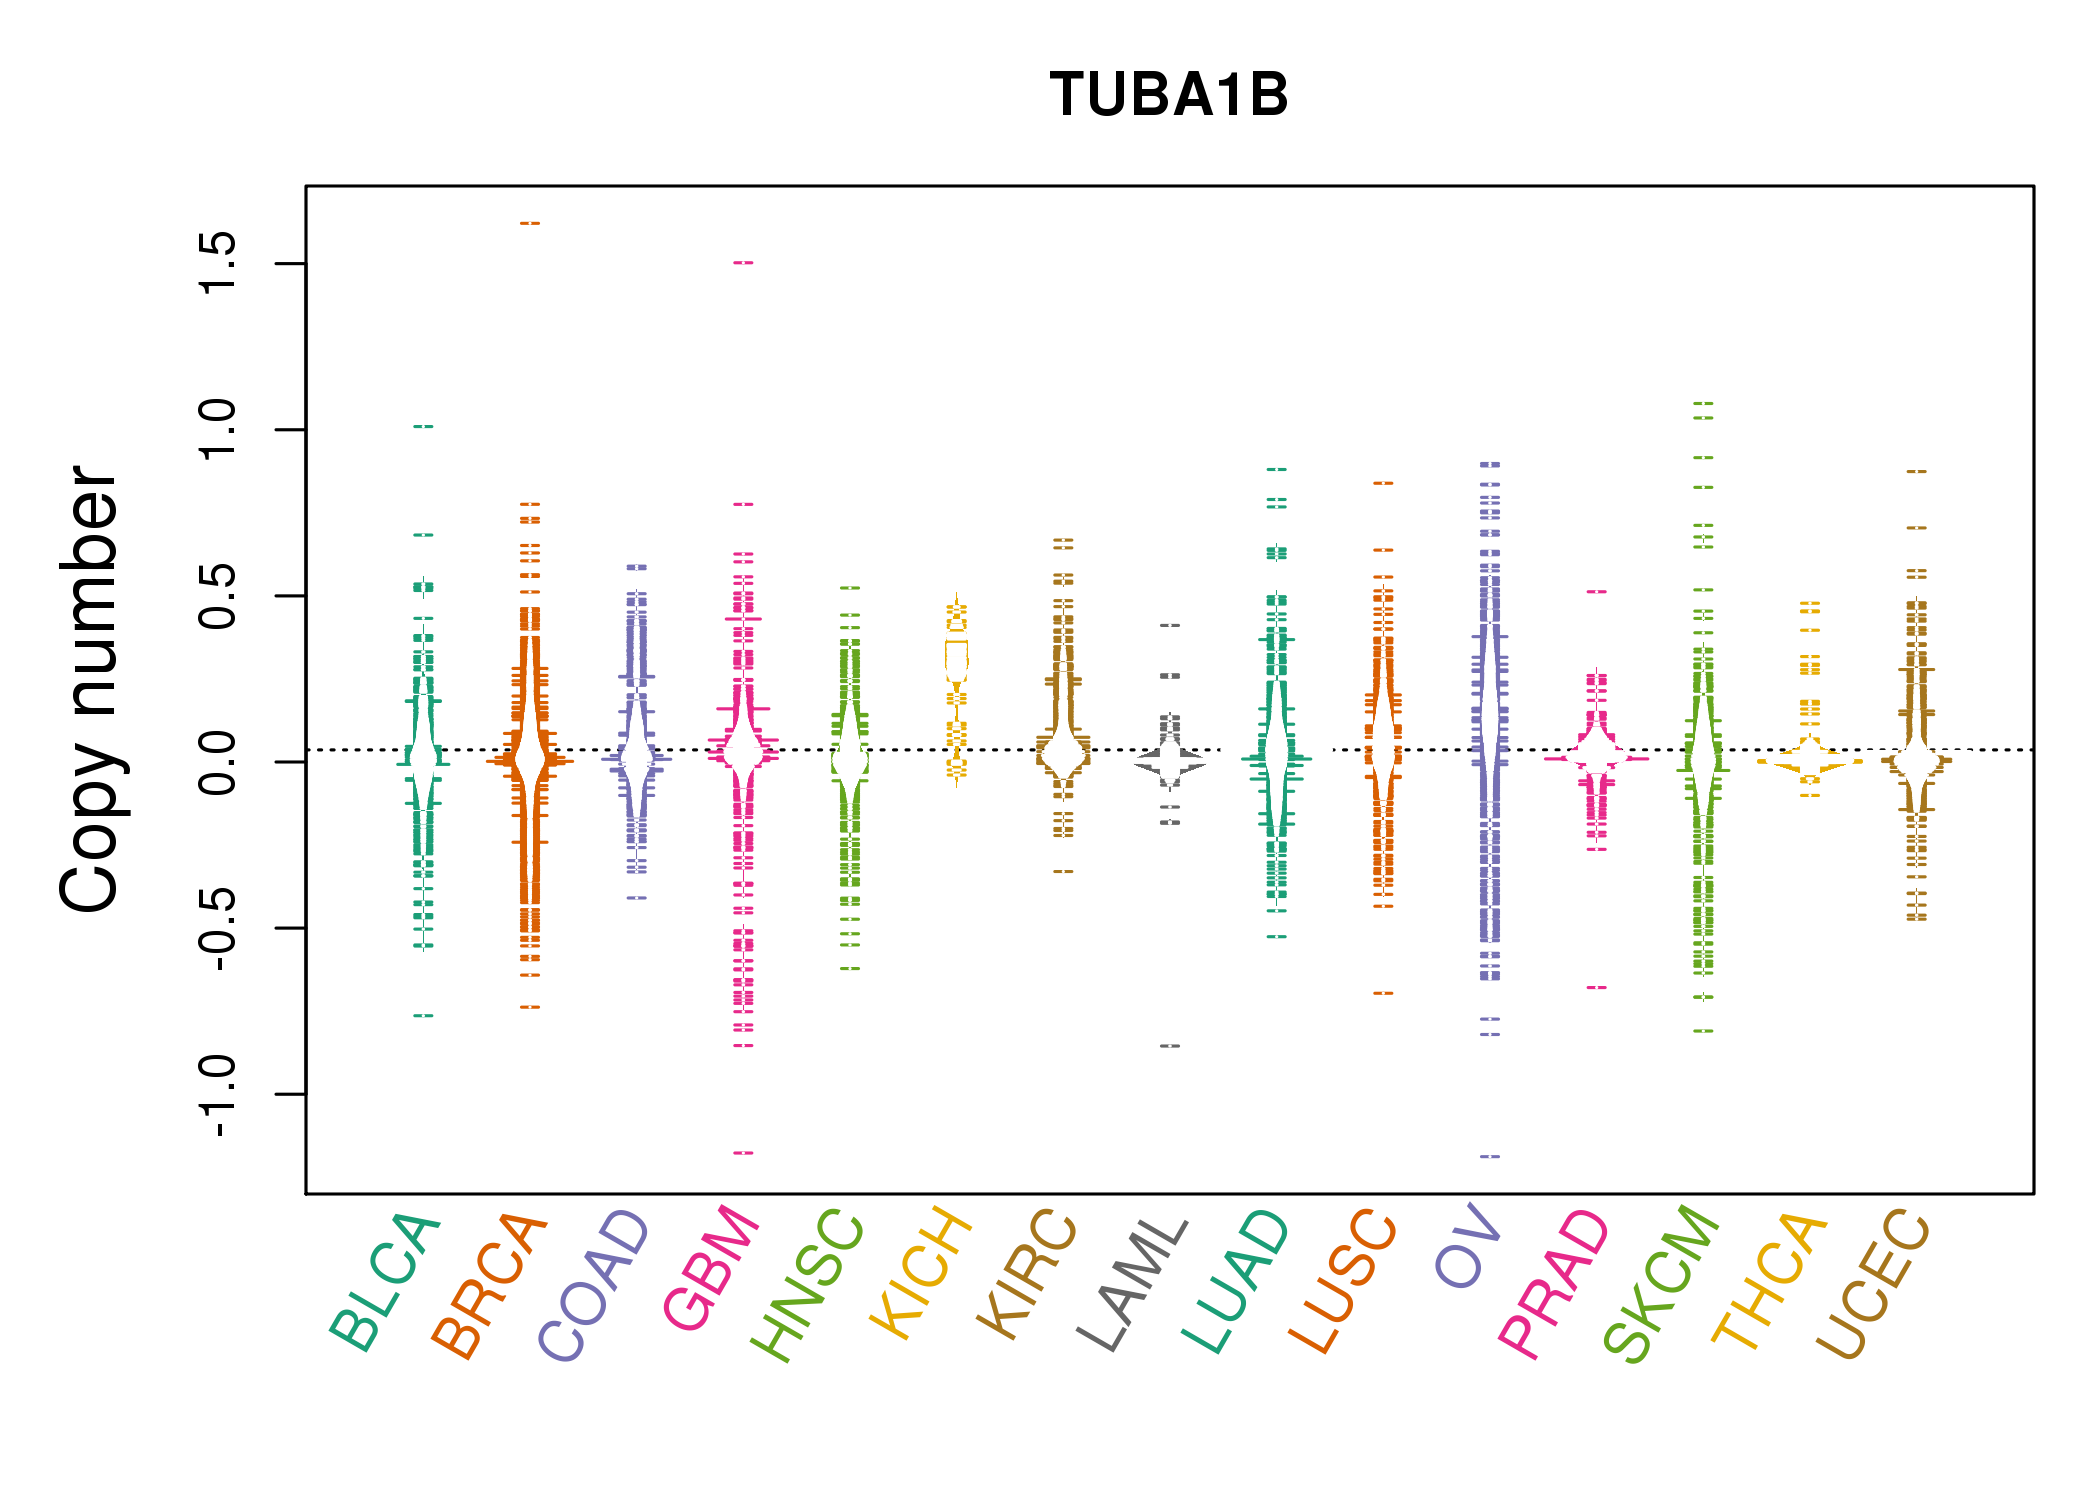 |
| cf) Tissue ID[Tissue type]: BLCA[Bladder Urothelial Carcinoma], BRCA[Breast invasive carcinoma], CESC[Cervical squamous cell carcinoma and endocervical adenocarcinoma], COAD[Colon adenocarcinoma], GBM[Glioblastoma multiforme], Glioma Low Grade, HNSC[Head and Neck squamous cell carcinoma], KICH[Kidney Chromophobe], KIRC[Kidney renal clear cell carcinoma], KIRP[Kidney renal papillary cell carcinoma], LAML[Acute Myeloid Leukemia], LUAD[Lung adenocarcinoma], LUSC[Lung squamous cell carcinoma], OV[Ovarian serous cystadenocarcinoma ], PAAD[Pancreatic adenocarcinoma], PRAD[Prostate adenocarcinoma], SKCM[Skin Cutaneous Melanoma], STAD[Stomach adenocarcinoma], THCA[Thyroid carcinoma], UCEC[Uterine Corpus Endometrial Carcinoma] |
| Top |
| Gene Expression for TUBA1B |
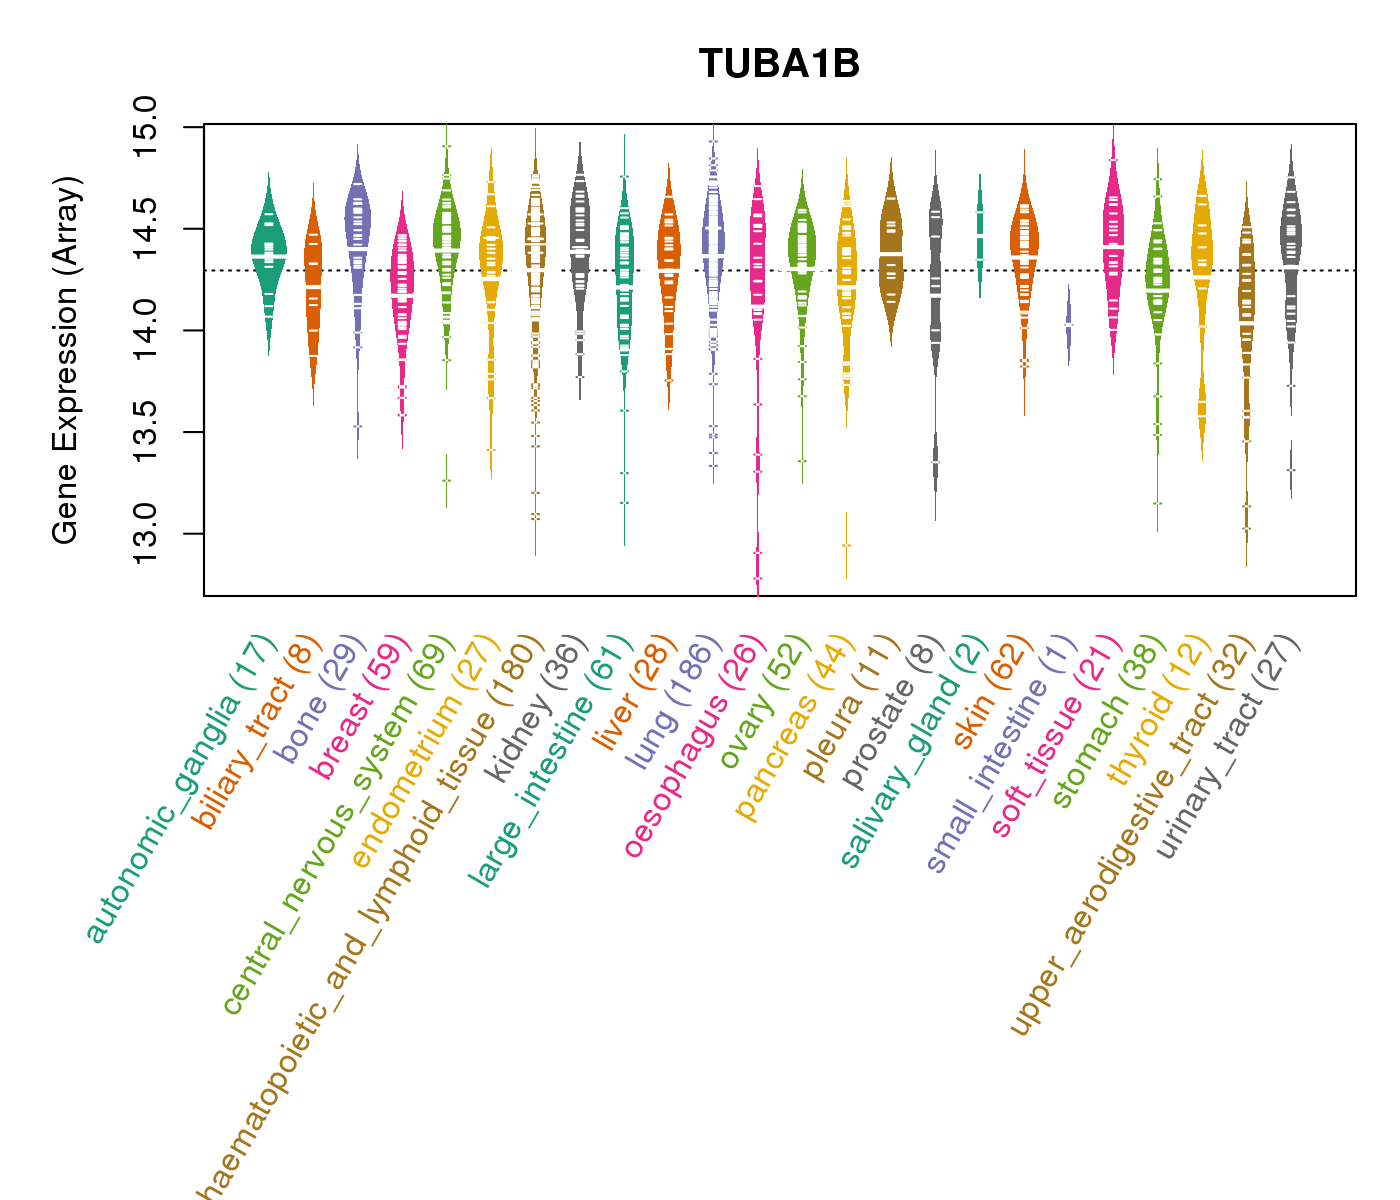
| * CCLE gene expression data were extracted from CCLE_Expression_Entrez_2012-10-18.res: Gene-centric RMA-normalized mRNA expression data. |
 |
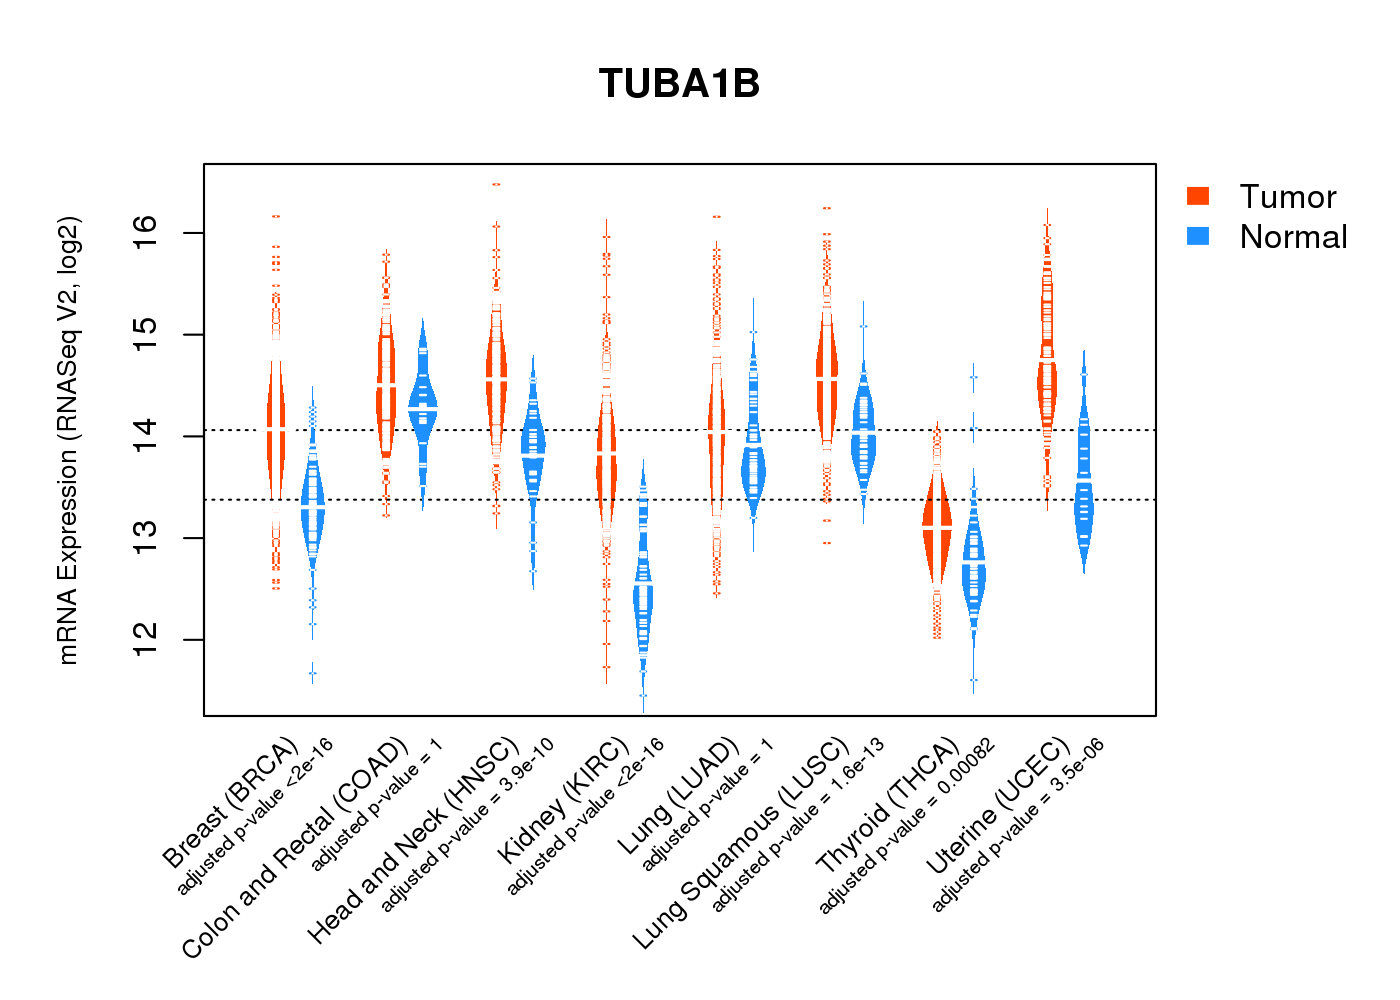
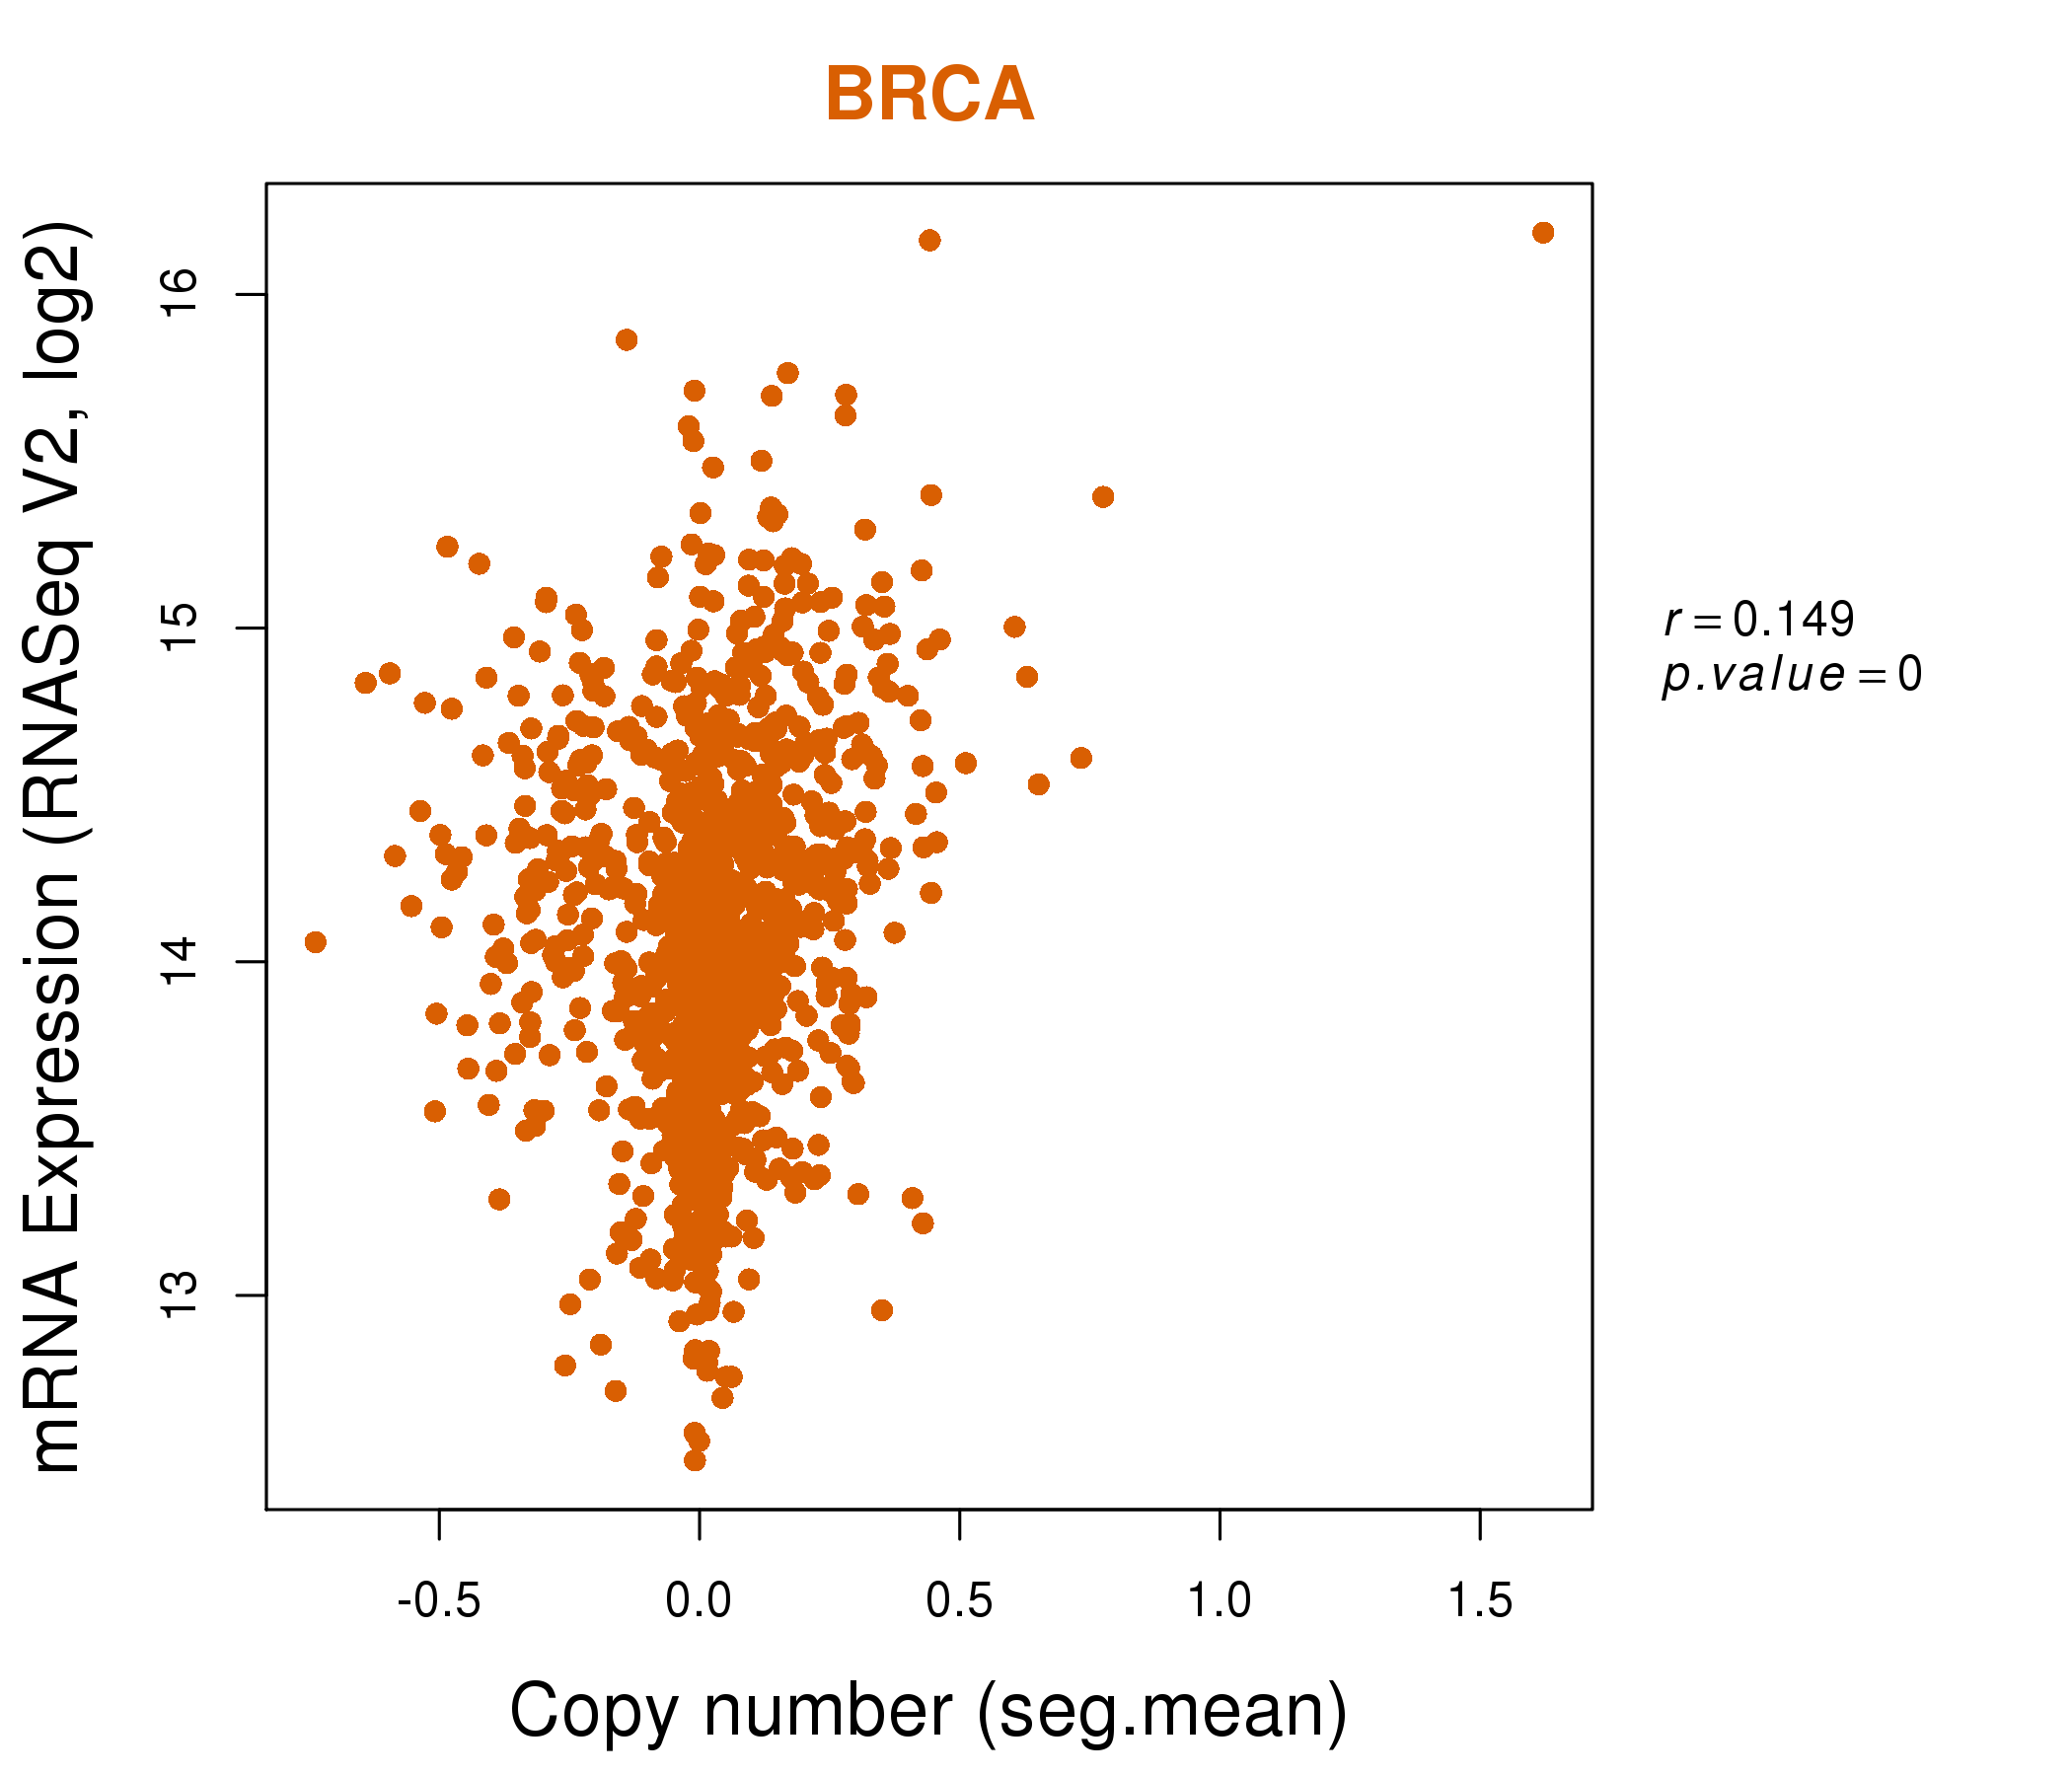
| * Normalized gene expression data of RNASeqV2 was extracted from TCGA using R package TCGA-Assembler. The URLs of all public data files on TCGA DCC data server were gathered at Jan-05-2015. Only eight cancer types have enough normal control samples for differential expression analysis. (t test, adjusted p<0.05 (using Benjamini-Hochberg FDR)) |
 |
| Top |
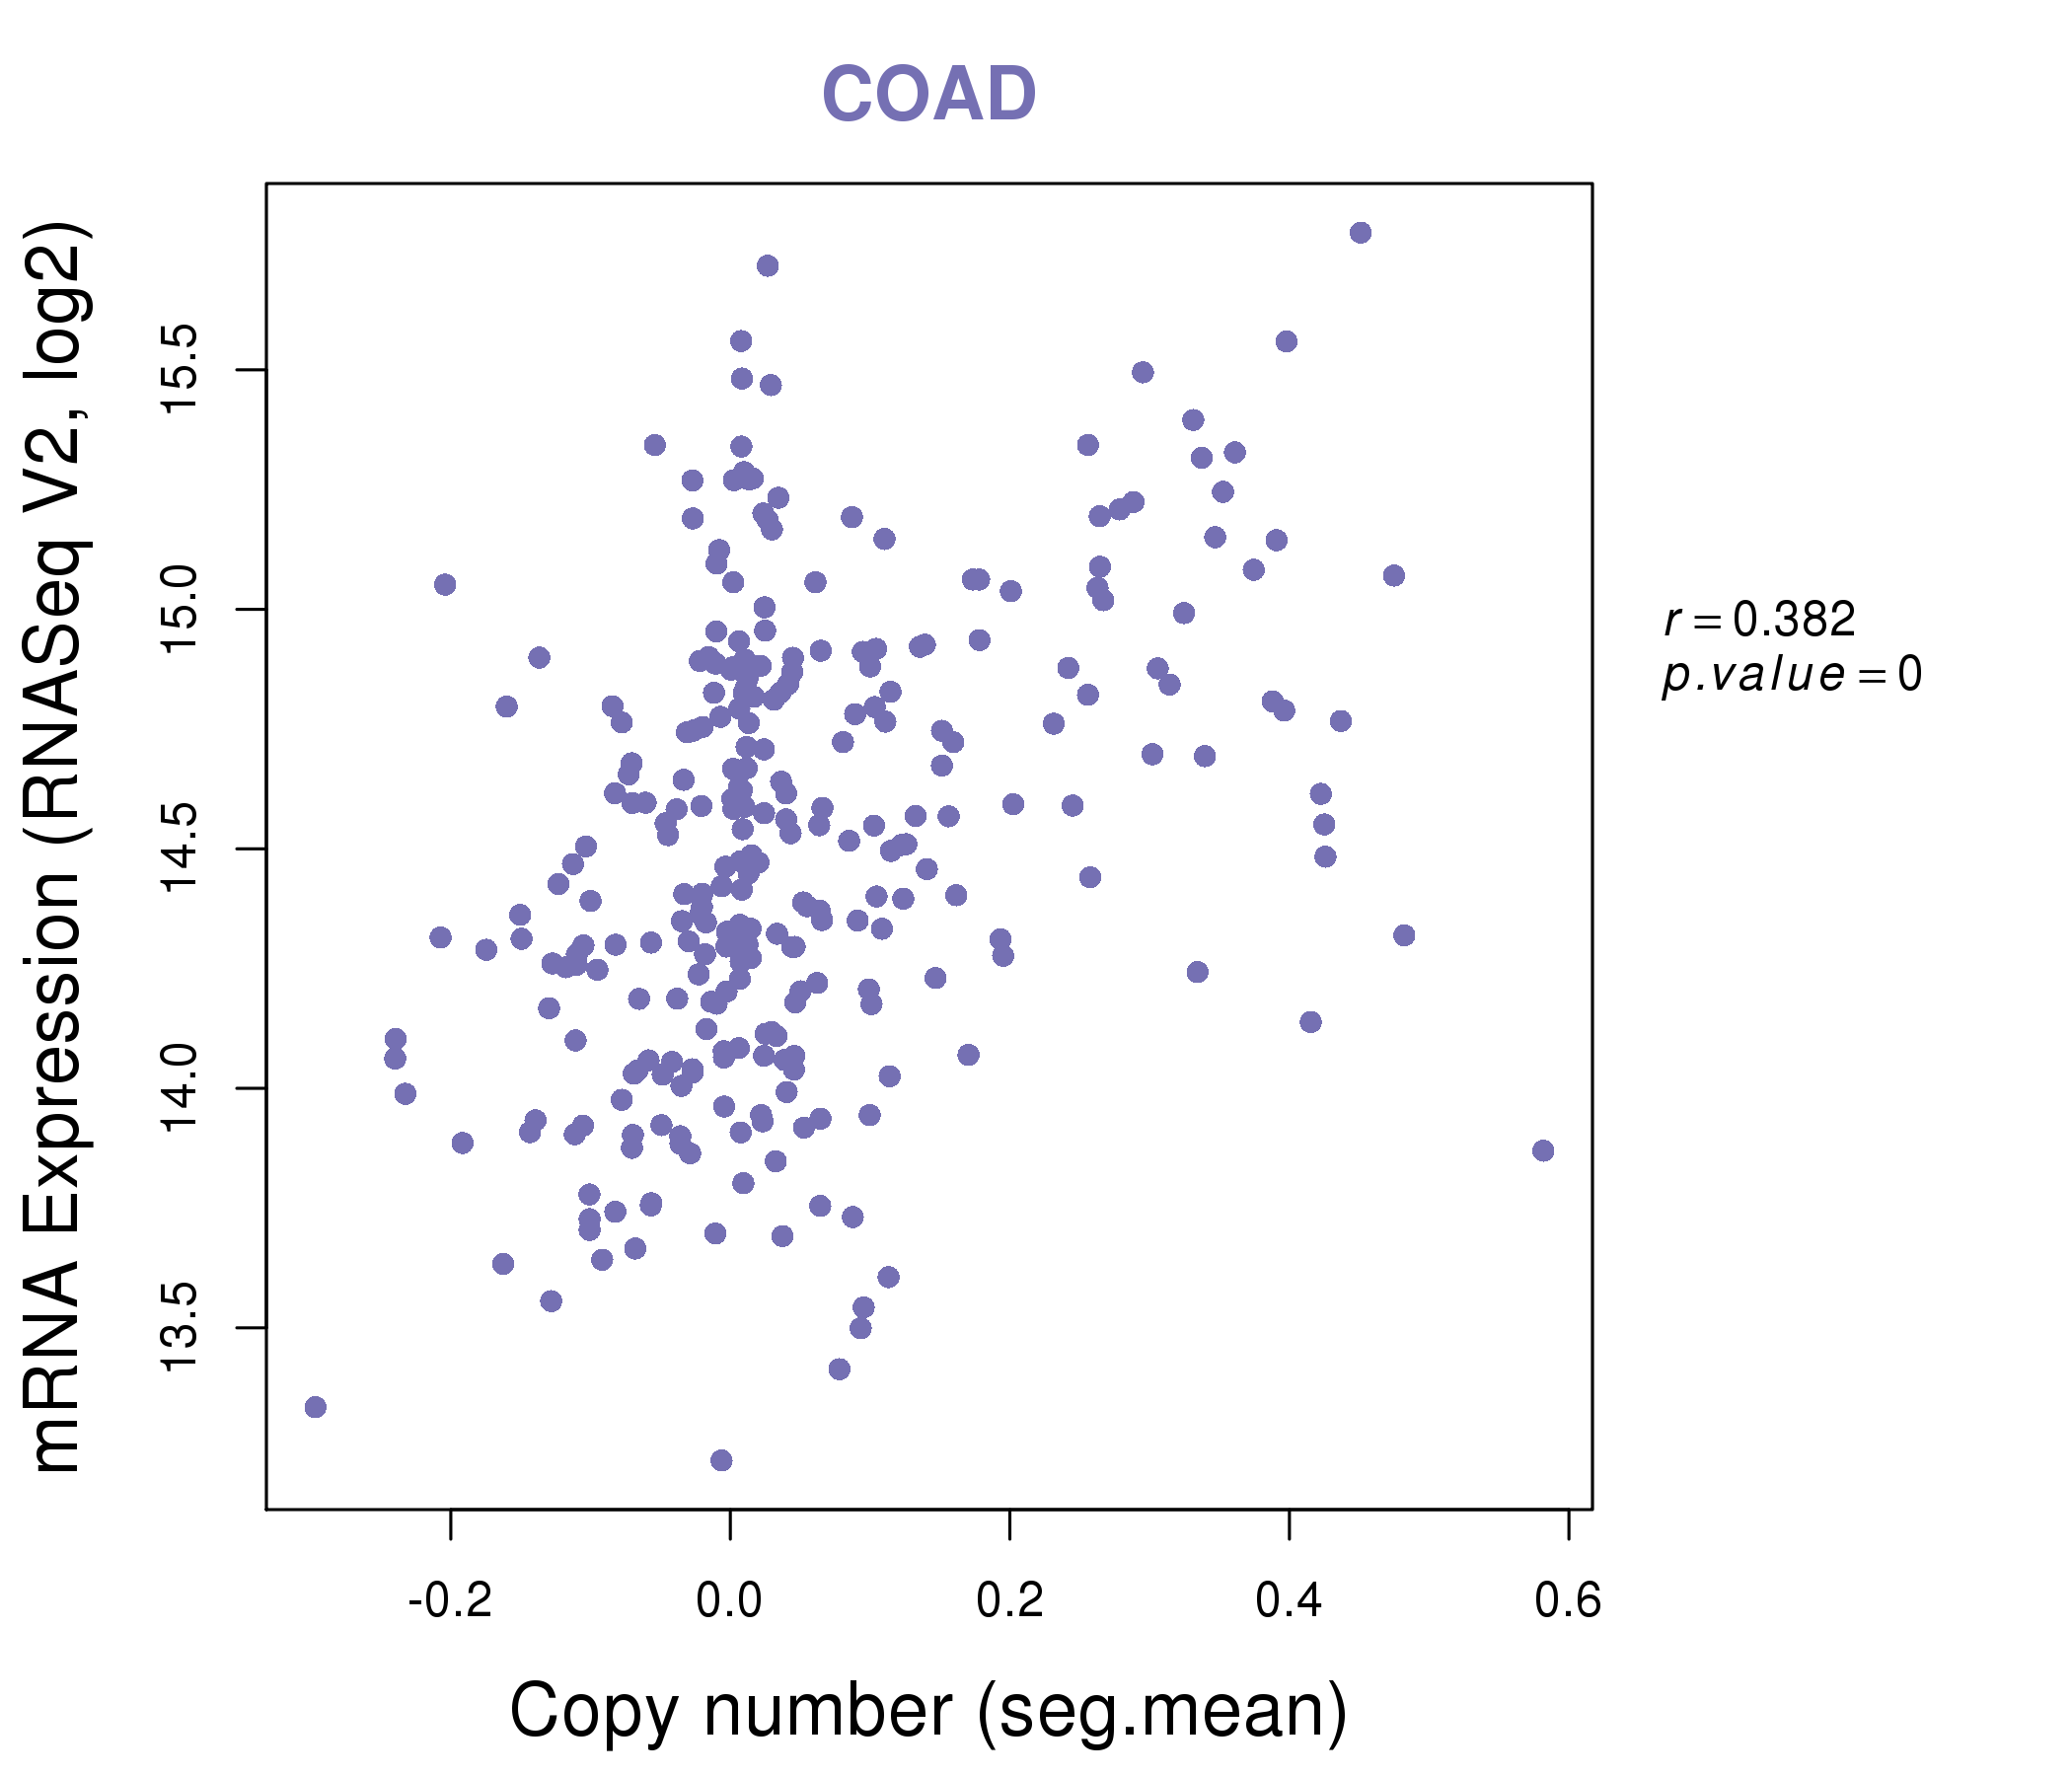
| * This plots show the correlation between CNV and gene expression. |
: Open all plots for all cancer types
 |
|
 |
|

| Top |
| Gene-Gene Network Information |
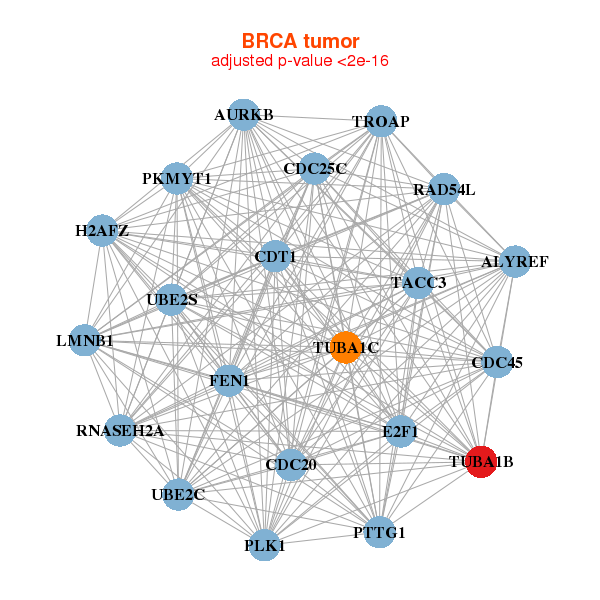
| * Co-Expression network figures were drawn using R package igraph. Only the top 20 genes with the highest correlations were shown. Red circle: input gene, orange circle: cell metabolism gene, sky circle: other gene |
: Open all plots for all cancer types
 |
| ||||
| AURKB,CDC20,CDC25C,CDC45,CDT1,E2F1,FEN1, H2AFZ,LMNB1,PKMYT1,PLK1,PTTG1,RAD54L,RNASEH2A, TACC3,ALYREF,TROAP,TUBA1B,TUBA1C,UBE2C,UBE2S | AP2M1,ARPC1B,ARPC4,CFL1,EFHD2,FAM109B,IFI27L2, NECAP2,PFN1,PLOD3,PLSCR3,RGS19,RHOG,SHISA5, SHKBP1,TAGLN2,TAX1BP3,TIMP1,TMSB10,TUBA1B,TUBA1C | ||||
 |
| ||||
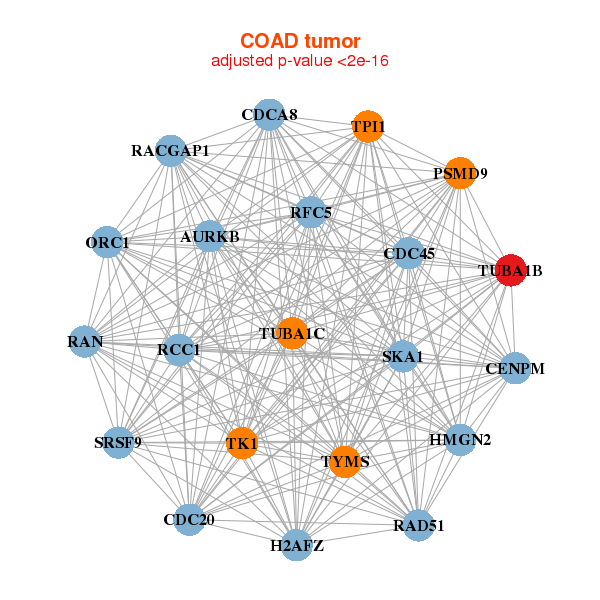
| AURKB,CDC20,CDC45,CDCA8,CENPM,H2AFZ,HMGN2, ORC1,PSMD9,RACGAP1,RAD51,RAN,RCC1,RFC5, SRSF9,SKA1,TK1,TPI1,TUBA1B,TUBA1C,TYMS | ATXN10,CMSS1,CCT7,CENPW,CSE1L,GSTCD,HAUS7, IARS,LDHB,MLH1,NUP93,PA2G4,POLA2,PSMC3, RANBP1,RUVBL1,S100A11,TCF19,TIPIN,TUBA1B,TUBG1 |
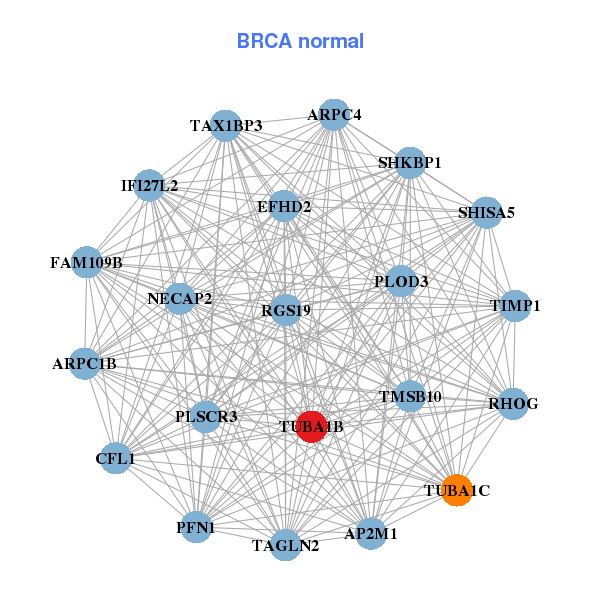
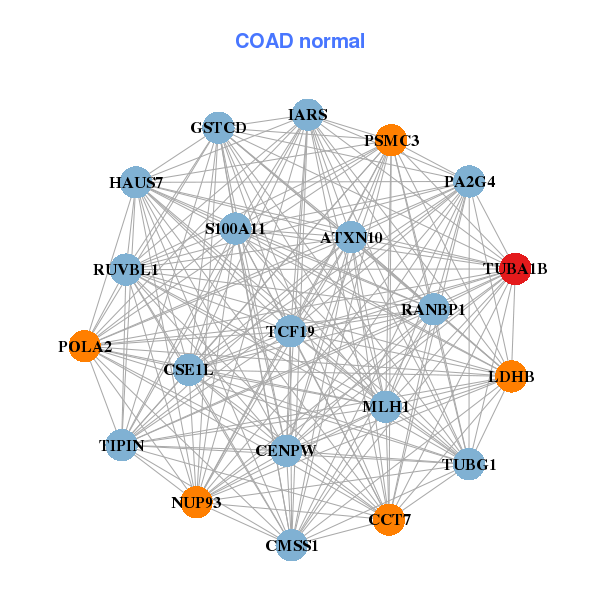
| * Co-Expression network figures were drawn using R package igraph. Only the top 20 genes with the highest correlations were shown. Red circle: input gene, orange circle: cell metabolism gene, sky circle: other gene |
: Open all plots for all cancer types
| Top |
: Open all interacting genes' information including KEGG pathway for all interacting genes from DAVID
| Top |
| Pharmacological Information for TUBA1B |
| DB Category | DB Name | DB's ID and Url link |
| * Gene Centered Interaction Network. |
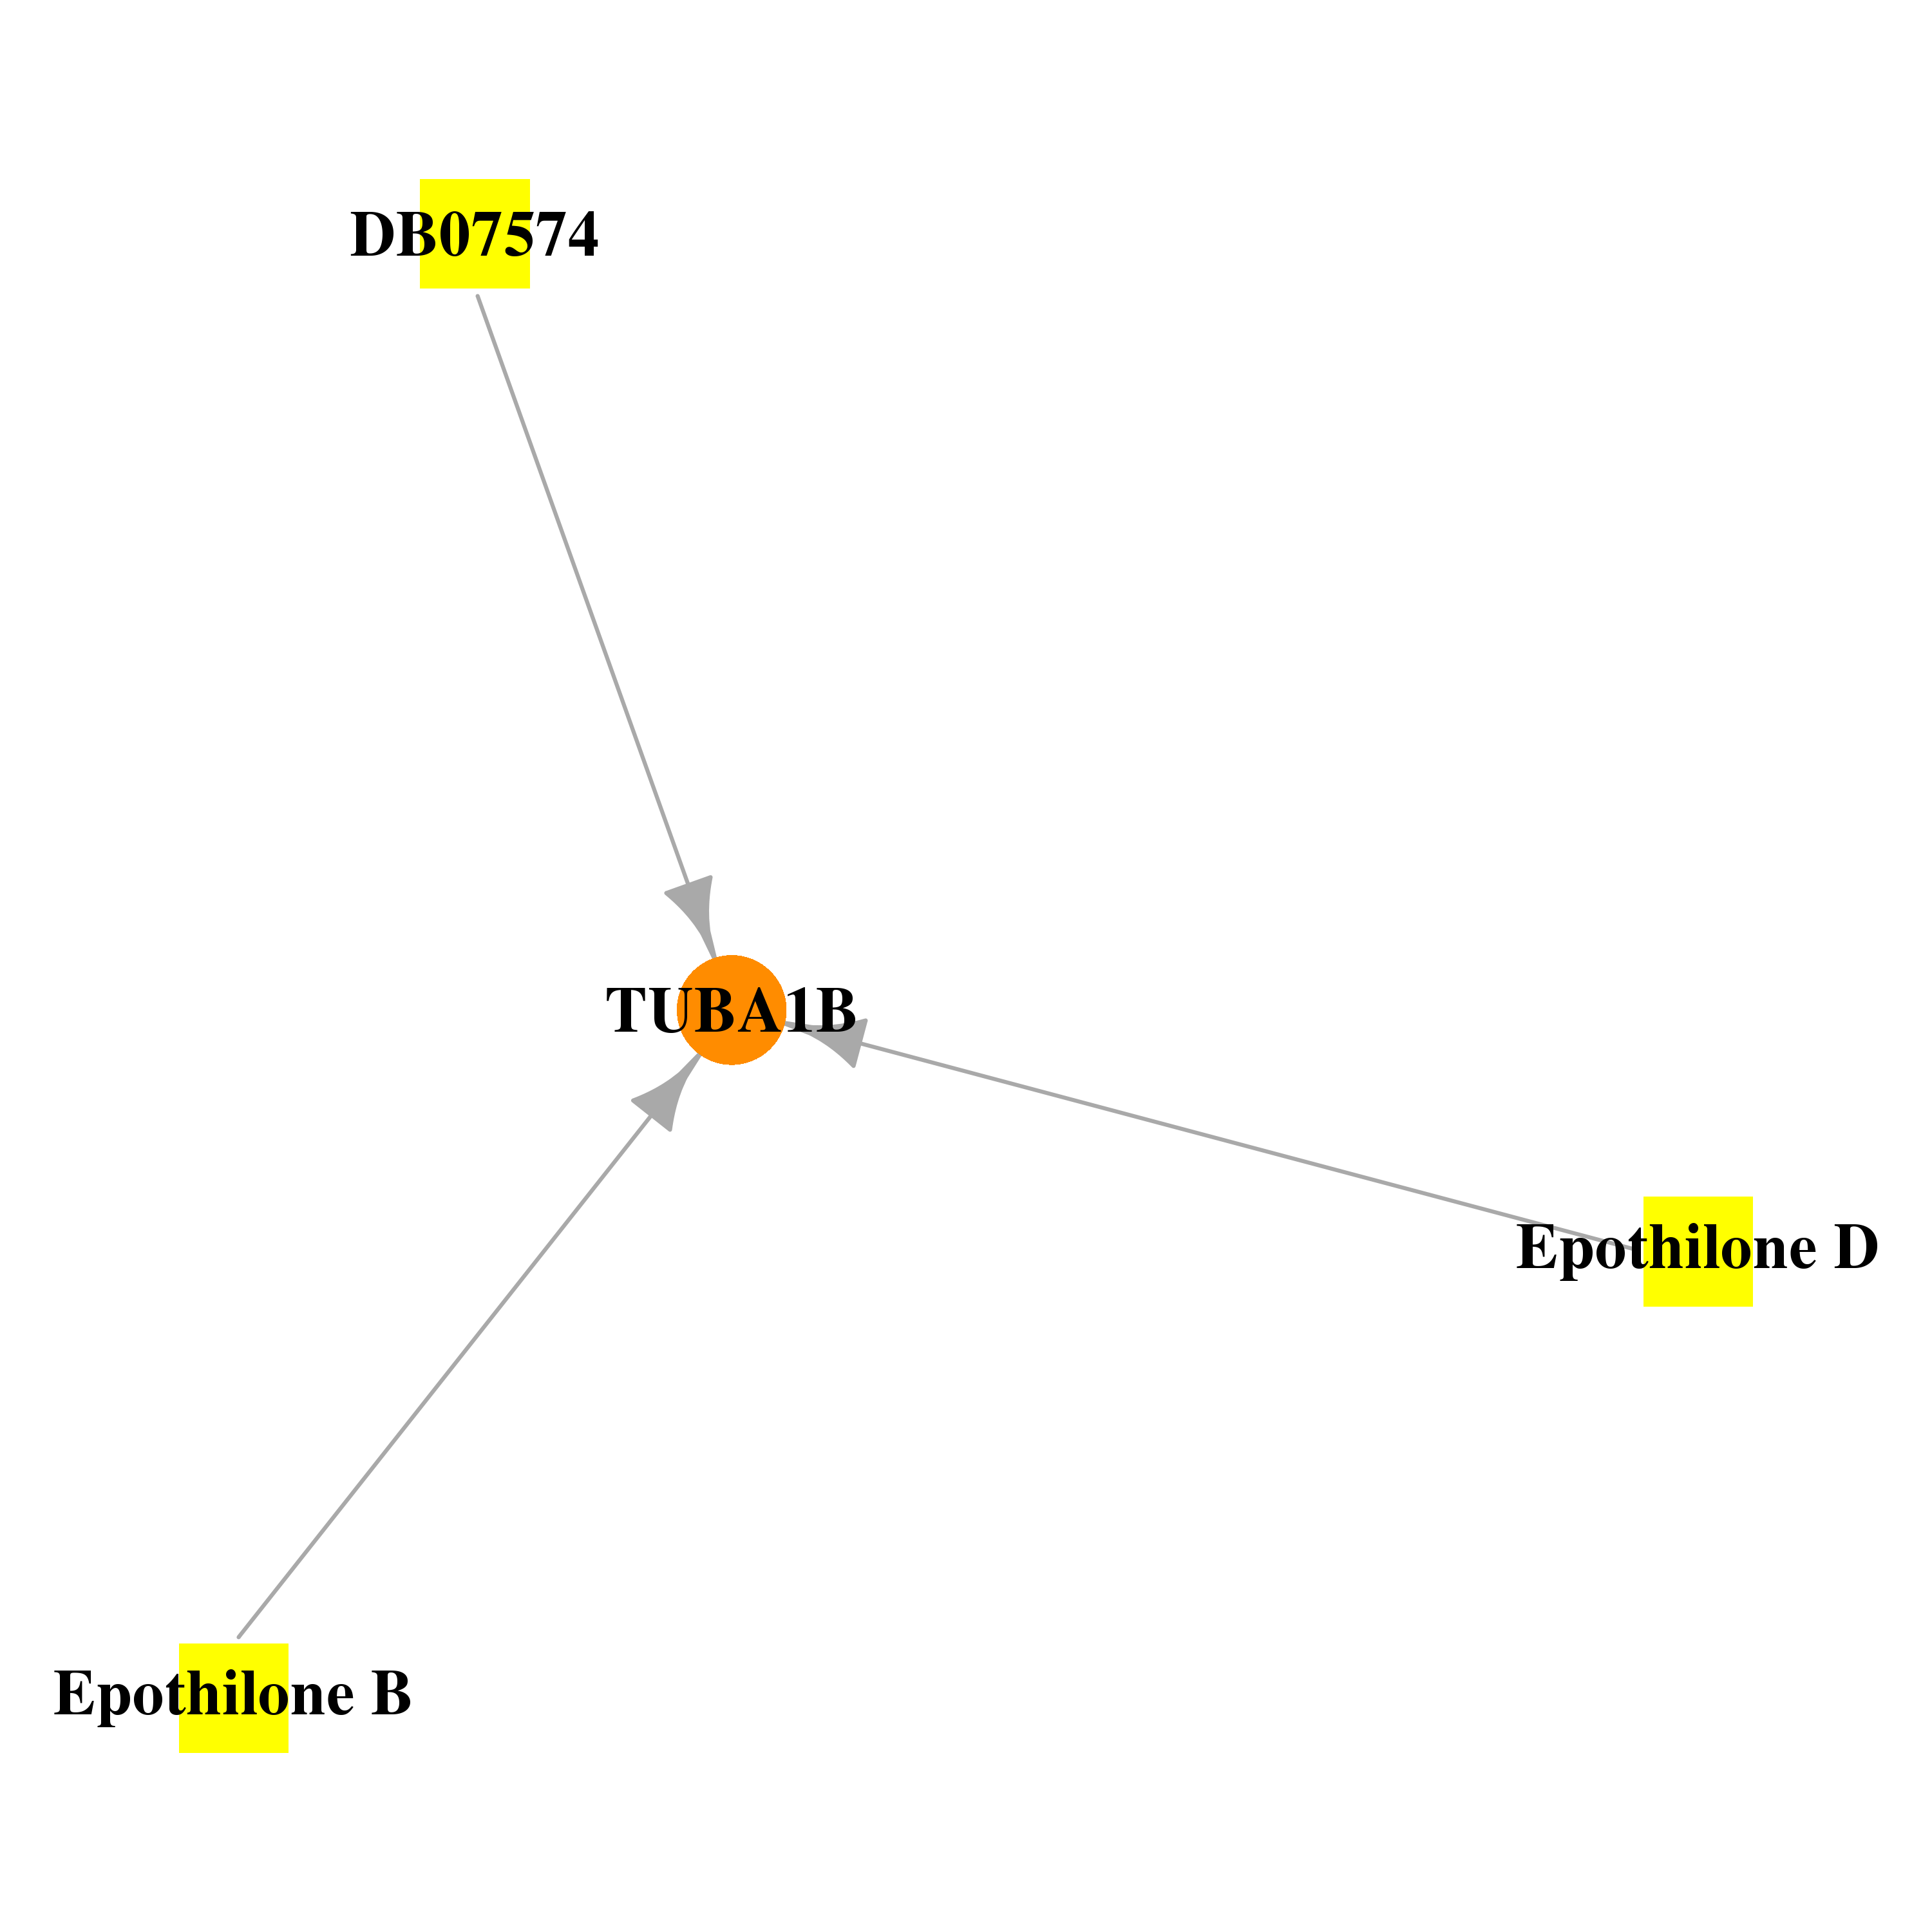 |
| * Drug Centered Interaction Network. |
| DrugBank ID | Target Name | Drug Groups | Generic Name | Drug Centered Network | Drug Structure |
| DB01873 | tubulin, alpha 1b | experimental; investigational | Epothilone D |  | 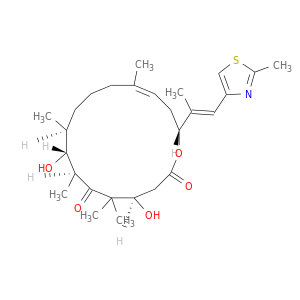 |
| DB03010 | tubulin, alpha 1b | experimental; investigational | Epothilone B | 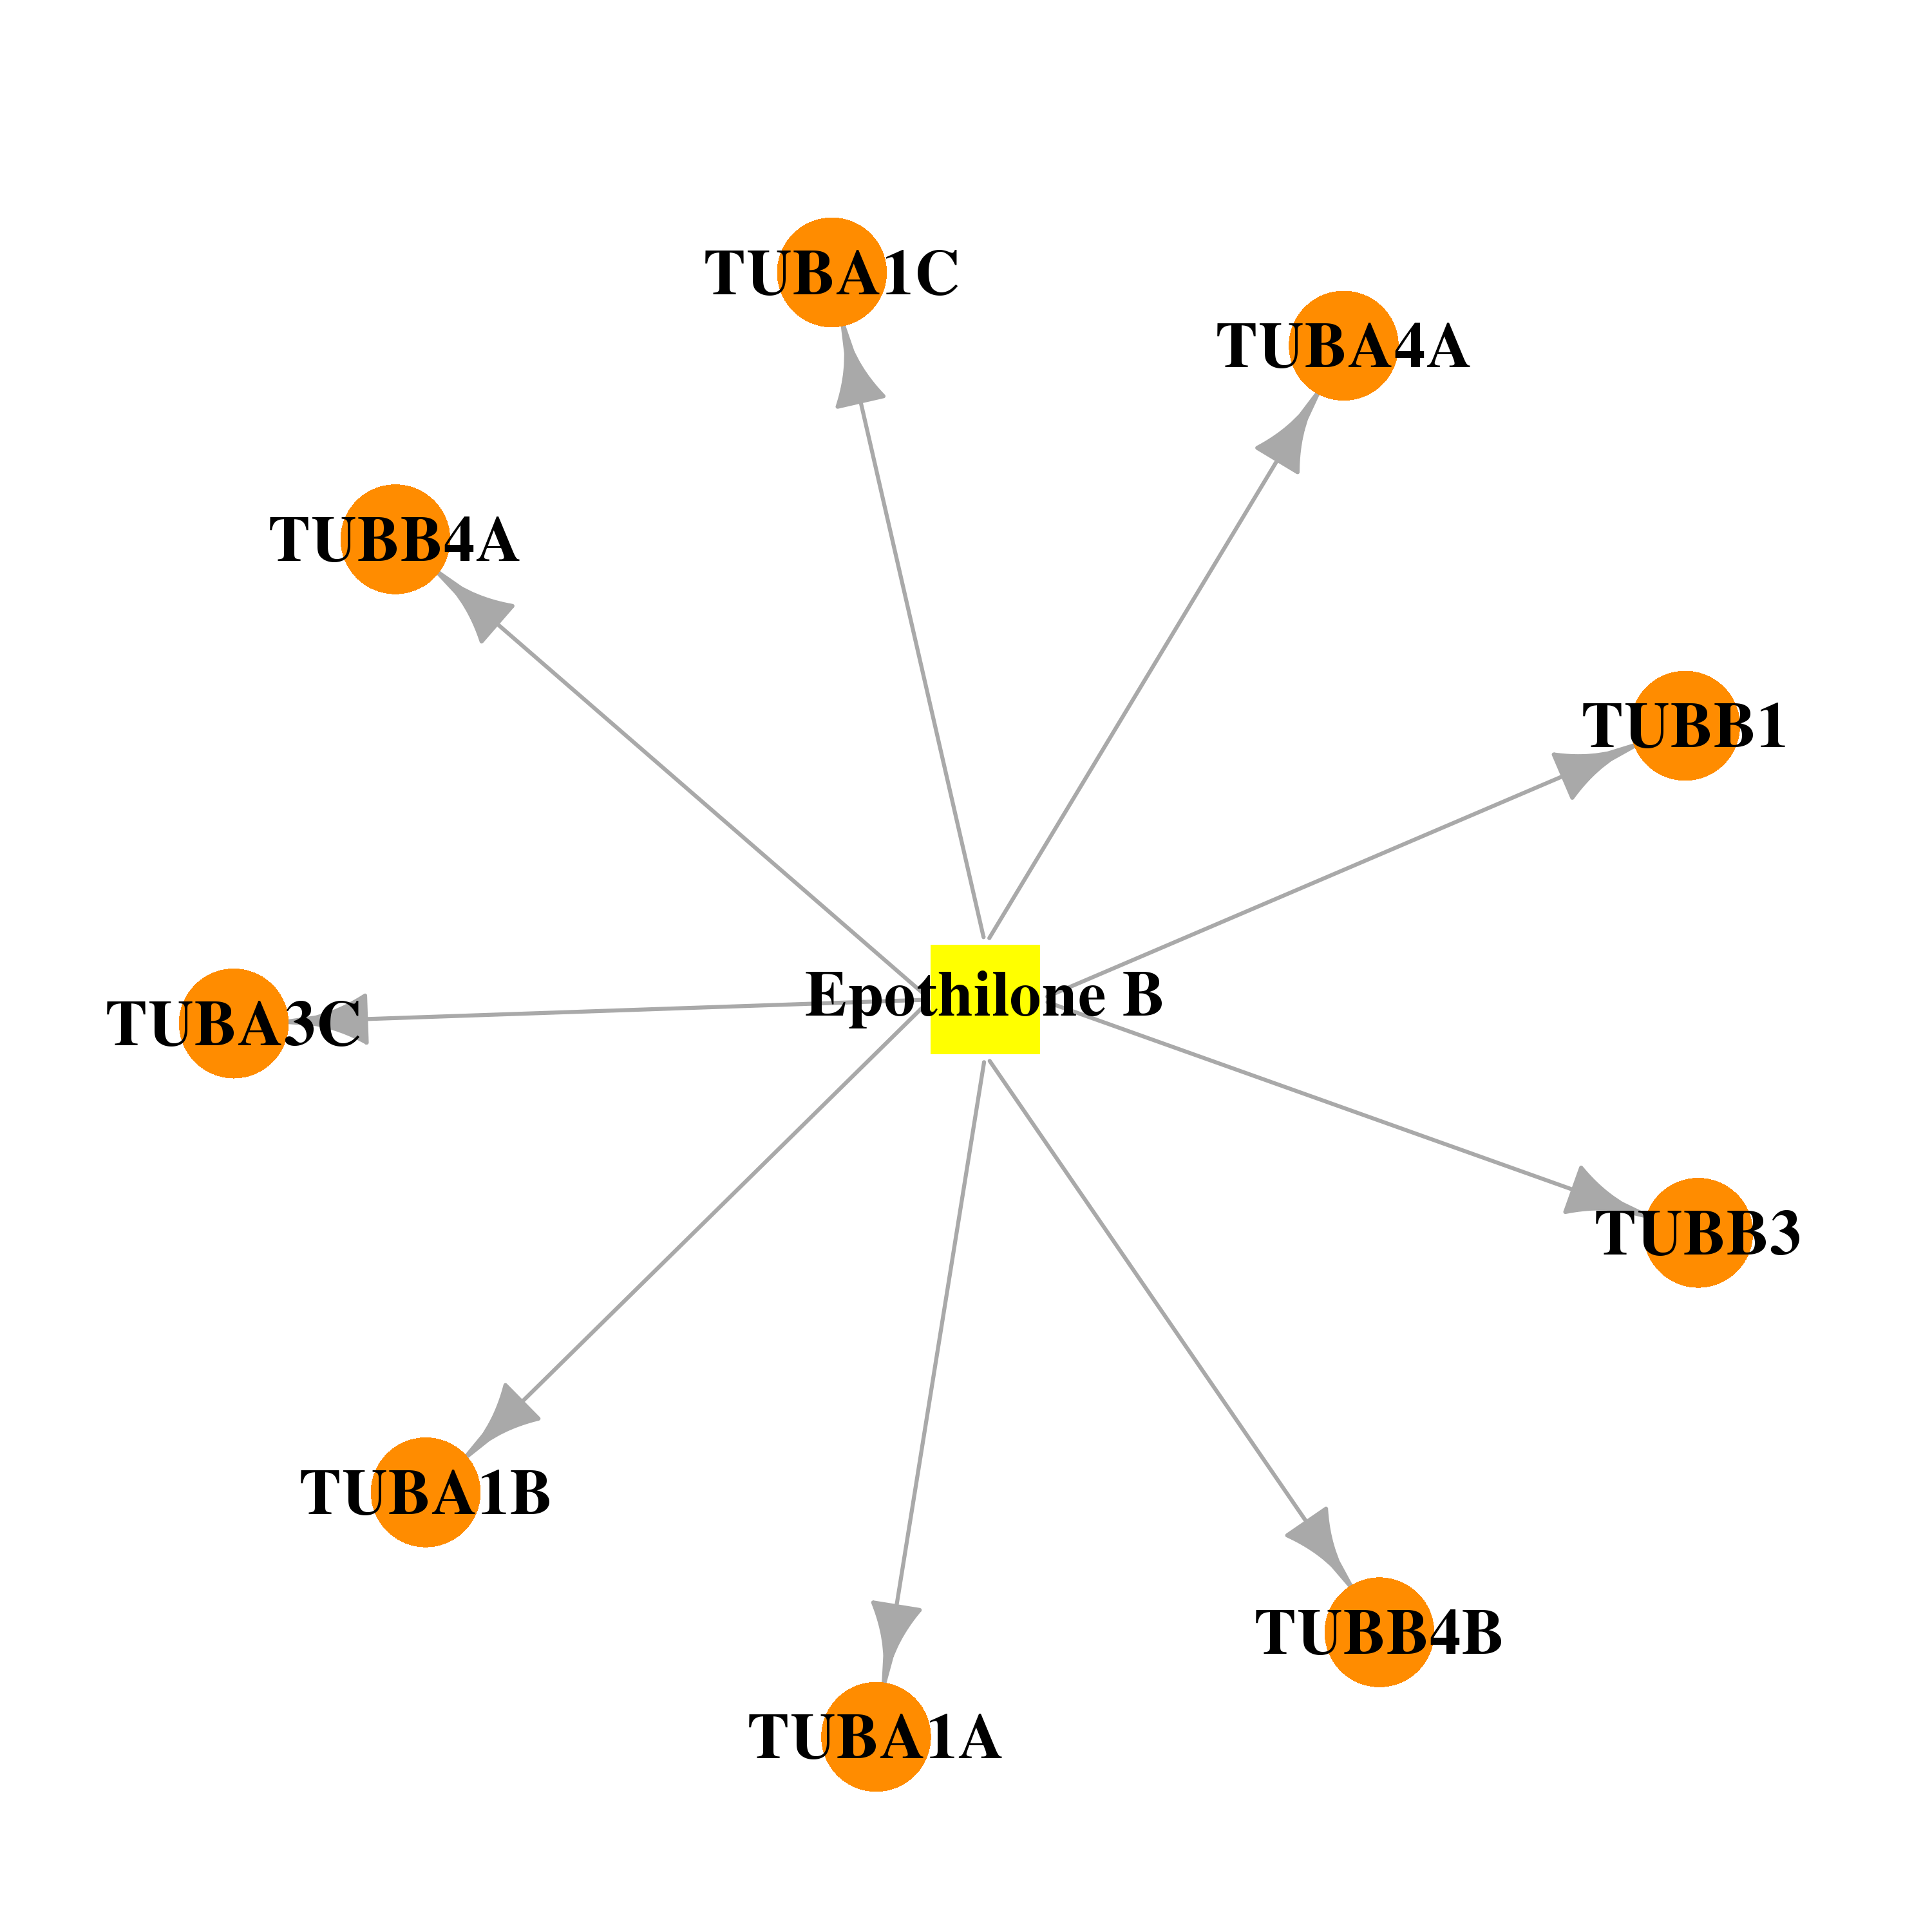 |  |
| DB07574 | tubulin, alpha 1b | experimental | 2-MERCAPTO-N-[1,2,3,10-TETRAMETHOXY-9-OXO-5,6,7,9-TETRAHYDRO-BENZO[A]HEPTALEN-7-YL]ACETAMIDE | 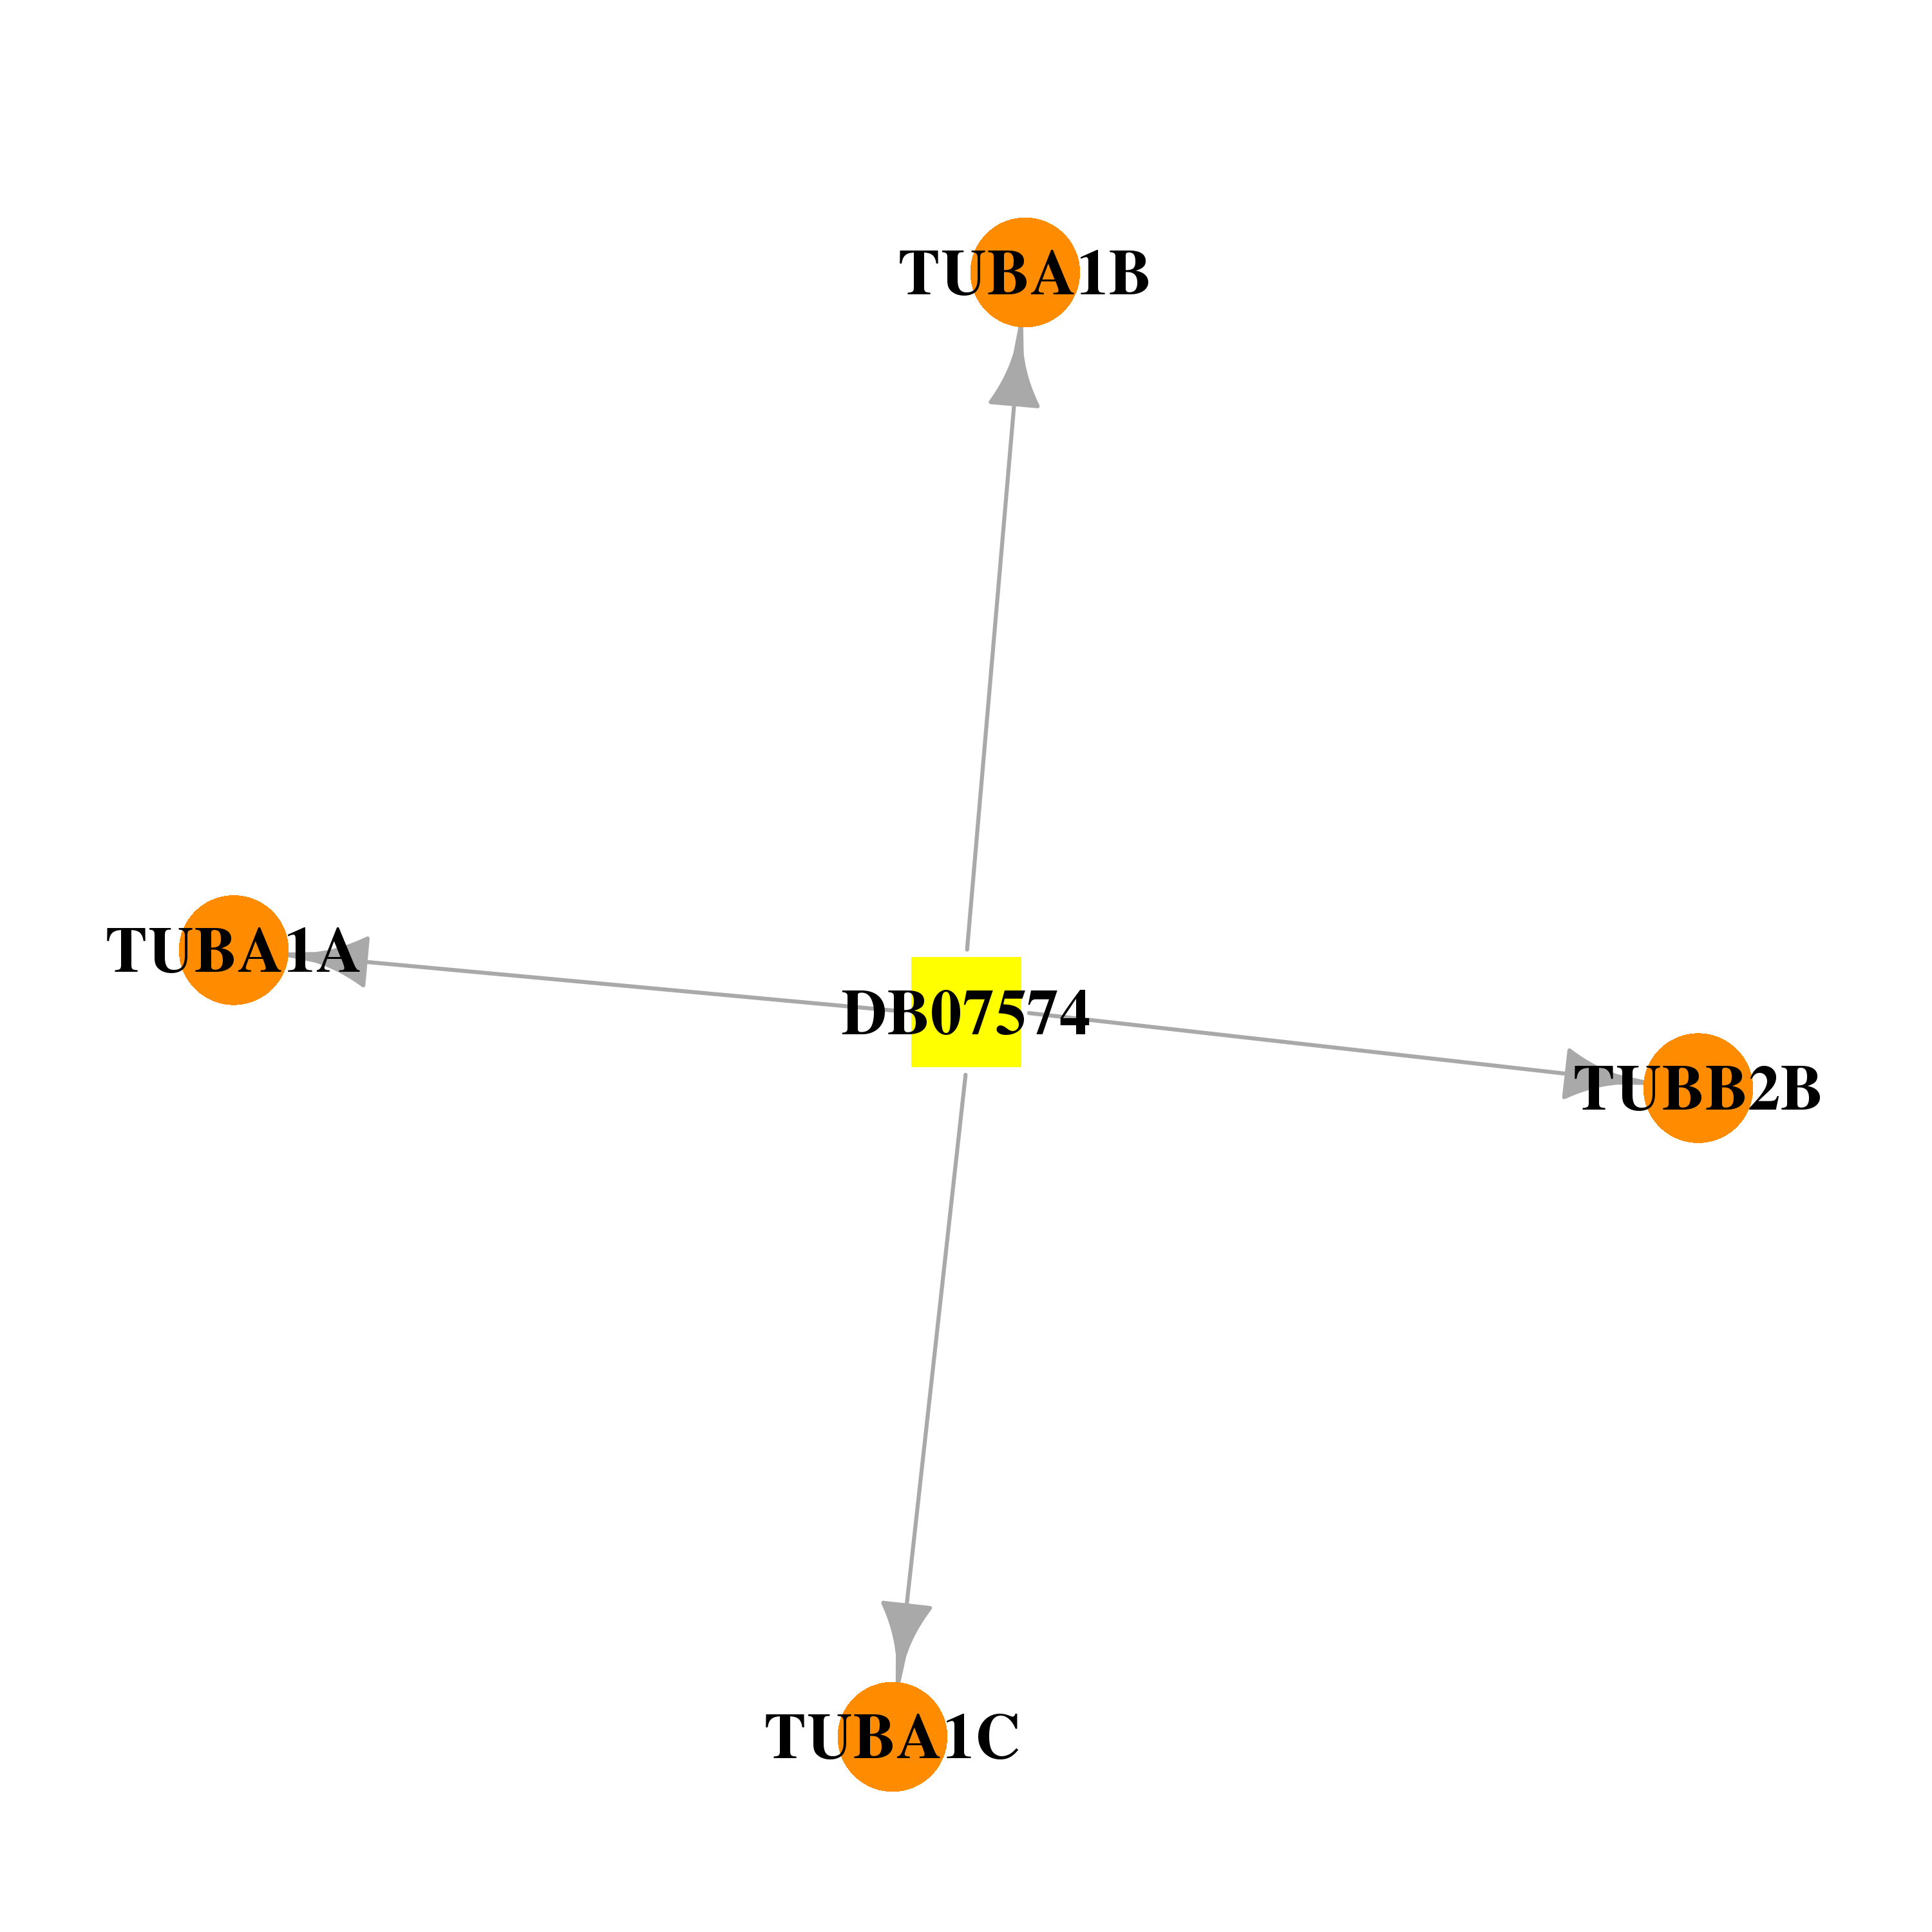 |  |
| Top |
| Cross referenced IDs for TUBA1B |
| * We obtained these cross-references from Uniprot database. It covers 150 different DBs, 18 categories. http://www.uniprot.org/help/cross_references_section |
: Open all cross reference information
|
Copyright © 2016-Present - The Univsersity of Texas Health Science Center at Houston @ |