|
||||||||||||||||||||
| |
| Phenotypic Information (metabolism pathway, cancer, disease, phenome) |
| |
| |
| Gene-Gene Network Information: Co-Expression Network, Interacting Genes & KEGG |
| |
|


| Gene Summary for BPNT1 |
| Top |
| Phenotypic Information for BPNT1(metabolism pathway, cancer, disease, phenome) |
| Cancer | CGAP: BPNT1 |
| Familial Cancer Database: BPNT1 | |
| * This gene is included in those cancer gene databases. |
|
|
|
|
|
|
| ||||||||||||||
Oncogene 1 | Significant driver gene in | |||||||||||||||||||
| cf) number; DB name 1 Oncogene; http://nar.oxfordjournals.org/content/35/suppl_1/D721.long, 2 Tumor Suppressor gene; https://bioinfo.uth.edu/TSGene/, 3 Cancer Gene Census; http://www.nature.com/nrc/journal/v4/n3/abs/nrc1299.html, 4 CancerGenes; http://nar.oxfordjournals.org/content/35/suppl_1/D721.long, 5 Network of Cancer Gene; http://ncg.kcl.ac.uk/index.php, 1Therapeutic Vulnerabilities in Cancer; http://cbio.mskcc.org/cancergenomics/statius/ |
| KEGG_SULFUR_METABOLISM | |
| OMIM | |
| Orphanet | |
| Disease | KEGG Disease: BPNT1 |
| MedGen: BPNT1 (Human Medical Genetics with Condition) | |
| ClinVar: BPNT1 | |
| Phenotype | MGI: BPNT1 (International Mouse Phenotyping Consortium) |
| PhenomicDB: BPNT1 | |
| Mutations for BPNT1 |
| * Under tables are showing count per each tissue to give us broad intuition about tissue specific mutation patterns.You can go to the detailed page for each mutation database's web site. |
| There's no structural variation information in COSMIC data for this gene. |
| * From mRNA Sanger sequences, Chitars2.0 arranged chimeric transcripts. This table shows BPNT1 related fusion information. |
| ID | Head Gene | Tail Gene | Accession | Gene_a | qStart_a | qEnd_a | Chromosome_a | tStart_a | tEnd_a | Gene_a | qStart_a | qEnd_a | Chromosome_a | tStart_a | tEnd_a |
| Top |
| There's no copy number variation information in COSMIC data for this gene. |
| Top |
|
 |
| Top |
| Stat. for Non-Synonymous SNVs (# total SNVs=28) | (# total SNVs=6) |
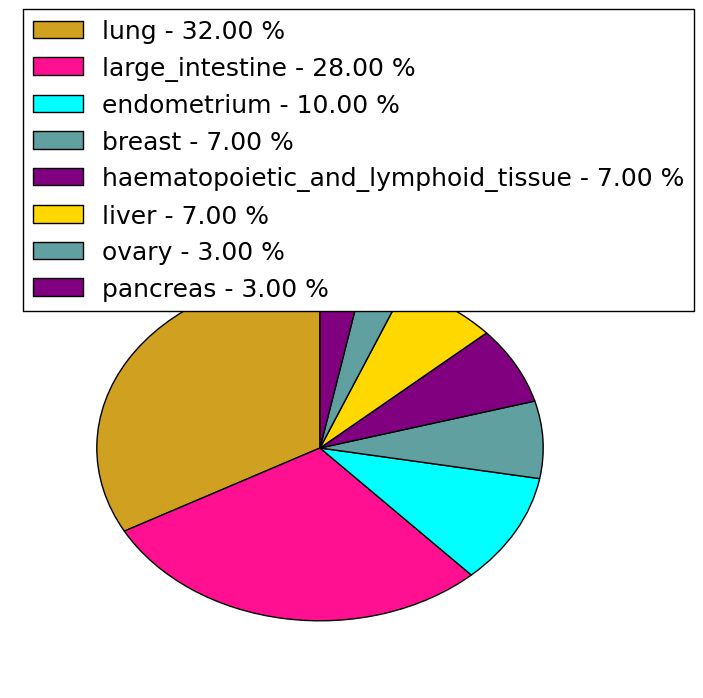 | 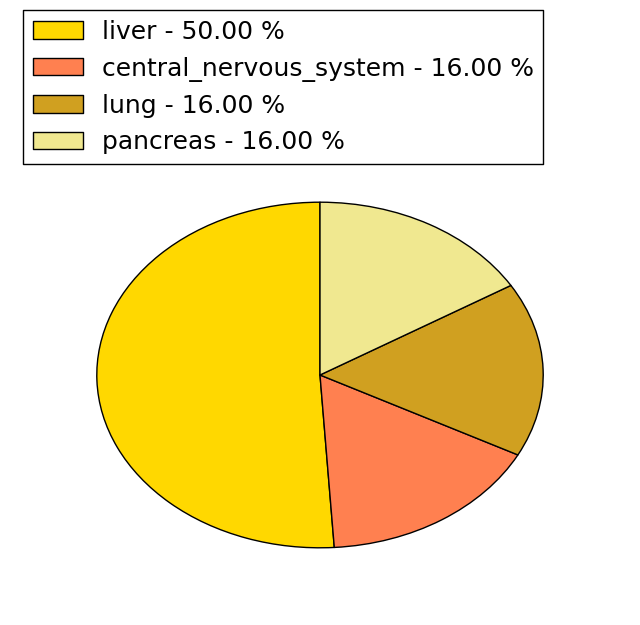 |
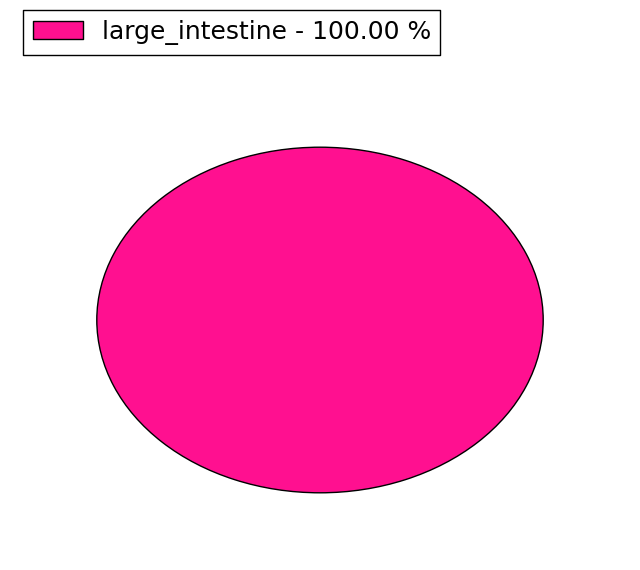
(# total SNVs=1) | (# total SNVs=0) |
 |
| Top |
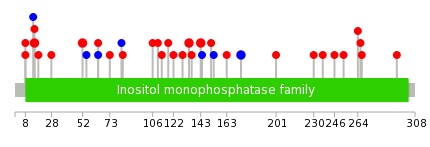
| * When you move the cursor on each content, you can see more deailed mutation information on the Tooltip. Those are primary_site,primary_histology,mutation(aa),pubmedID. |
| GRCh37 position | Mutation(aa) | Unique sampleID count |
| chr1:220247379-220247379 | p.R52Q | 2 |
| chr1:220253146-220253146 | p.A15T | 2 |
| chr1:220240690-220240690 | p.G143E | 2 |
| chr1:220246300-220246300 | p.? | 2 |
| chr1:220240718-220240718 | p.T134S | 2 |
| chr1:220236249-220236249 | p.G174G | 2 |
| chr1:220232316-220232316 | p.H266R | 1 |
| chr1:220240635-220240635 | p.? | 1 |
| chr1:220242771-220242771 | p.V113M | 1 |
| chr1:220232323-220232323 | p.D264N | 1 |
| Top |
|
 |
| Point Mutation/ Tissue ID | 1 | 2 | 3 | 4 | 5 | 6 | 7 | 8 | 9 | 10 | 11 | 12 | 13 | 14 | 15 | 16 | 17 | 18 | 19 | 20 |
| # sample | 2 | 1 | 5 | 1 | 1 | 6 | 2 | 1 | 1 | 1 | 3 | 3 | ||||||||
| # mutation | 2 | 1 | 4 | 1 | 1 | 8 | 2 | 1 | 1 | 1 | 3 | 3 | ||||||||
| nonsynonymous SNV | 2 | 1 | 4 | 1 | 1 | 4 | 1 | 1 | 2 | 3 | ||||||||||
| synonymous SNV | 4 | 1 | 1 | 1 | 1 |
| cf) Tissue ID; Tissue type (1; BLCA[Bladder Urothelial Carcinoma], 2; BRCA[Breast invasive carcinoma], 3; CESC[Cervical squamous cell carcinoma and endocervical adenocarcinoma], 4; COAD[Colon adenocarcinoma], 5; GBM[Glioblastoma multiforme], 6; Glioma Low Grade, 7; HNSC[Head and Neck squamous cell carcinoma], 8; KICH[Kidney Chromophobe], 9; KIRC[Kidney renal clear cell carcinoma], 10; KIRP[Kidney renal papillary cell carcinoma], 11; LAML[Acute Myeloid Leukemia], 12; LUAD[Lung adenocarcinoma], 13; LUSC[Lung squamous cell carcinoma], 14; OV[Ovarian serous cystadenocarcinoma ], 15; PAAD[Pancreatic adenocarcinoma], 16; PRAD[Prostate adenocarcinoma], 17; SKCM[Skin Cutaneous Melanoma], 18:STAD[Stomach adenocarcinoma], 19:THCA[Thyroid carcinoma], 20:UCEC[Uterine Corpus Endometrial Carcinoma]) |
| Top |
| * We represented just top 10 SNVs. When you move the cursor on each content, you can see more deailed mutation information on the Tooltip. Those are primary_site, primary_histology, mutation(aa), pubmedID. |
| Genomic Position | Mutation(aa) | Unique sampleID count |
| chr1:220247379 | p.R52Q,BPNT1 | 2 |
| chr1:220232316 | p.Y238C,BPNT1 | 1 |
| chr1:220242730 | p.A51G,BPNT1 | 1 |
| chr1:220253139 | p.H211R,BPNT1 | 1 |
| chr1:220232323 | p.V27V,BPNT1 | 1 |
| chr1:220242743 | p.D209N,BPNT1 | 1 |
| chr1:220253146 | p.L22M,BPNT1 | 1 |
| chr1:220233032 | p.V203V,BPNT1 | 1 |
| chr1:220242756 | p.R9R,BPNT1 | 1 |
| chr1:220253147 | p.A202D,BPNT1 | 1 |
| * Copy number data were extracted from TCGA using R package TCGA-Assembler. The URLs of all public data files on TCGA DCC data server were gathered on Jan-05-2015. Function ProcessCNAData in TCGA-Assembler package was used to obtain gene-level copy number value which is calculated as the average copy number of the genomic region of a gene. |
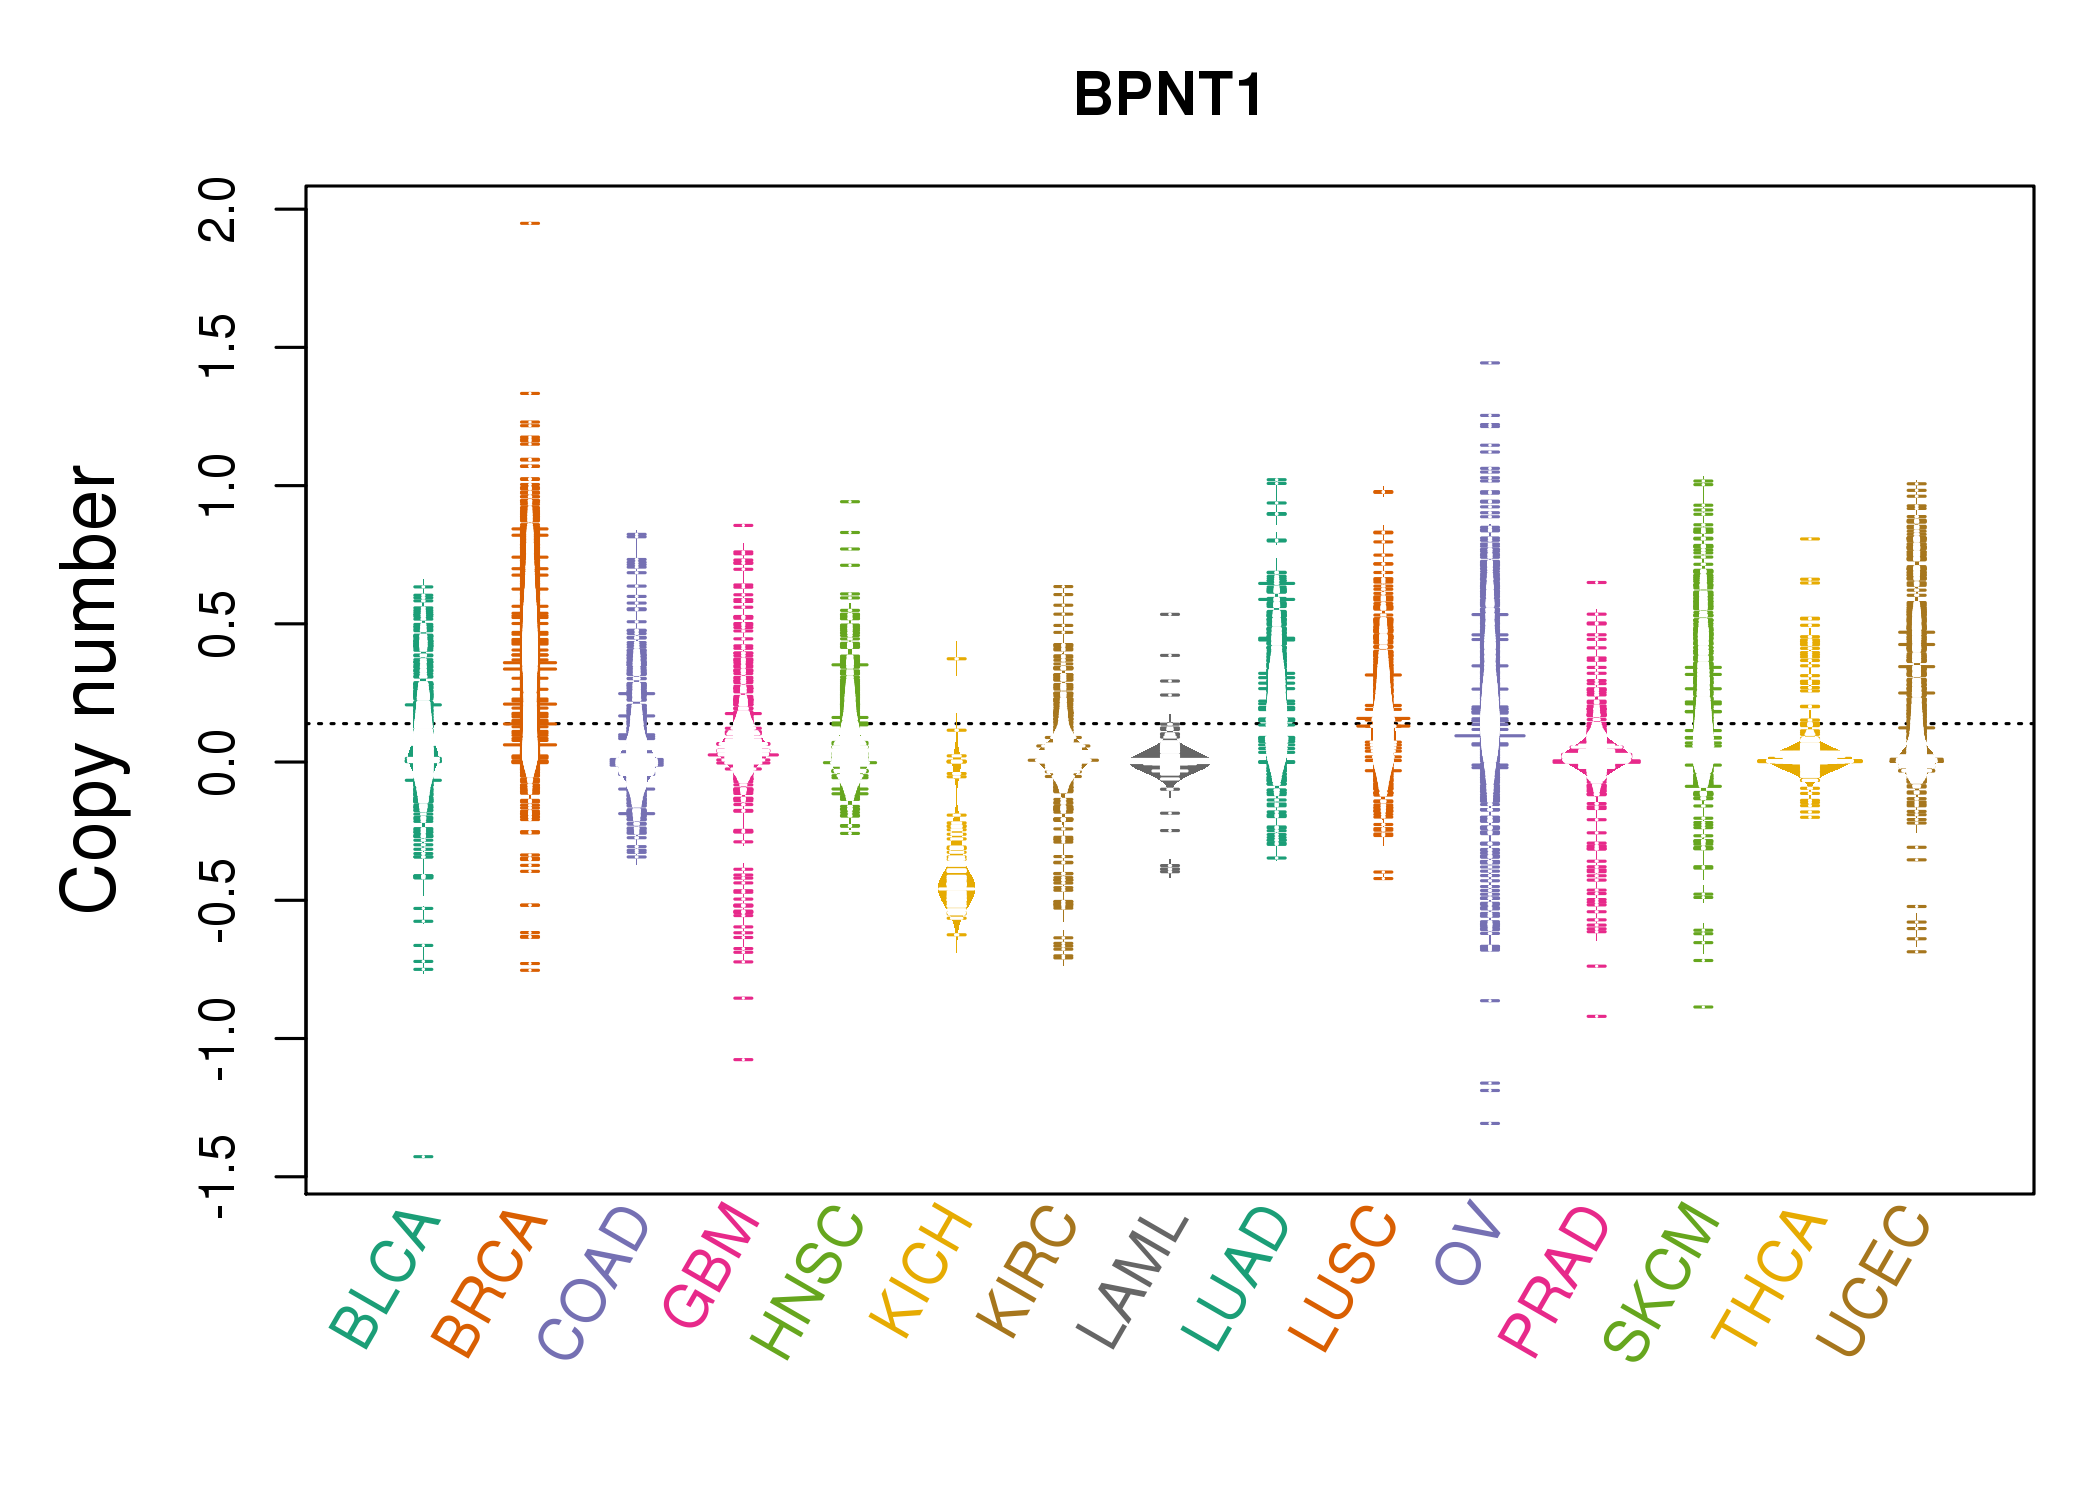 |
| cf) Tissue ID[Tissue type]: BLCA[Bladder Urothelial Carcinoma], BRCA[Breast invasive carcinoma], CESC[Cervical squamous cell carcinoma and endocervical adenocarcinoma], COAD[Colon adenocarcinoma], GBM[Glioblastoma multiforme], Glioma Low Grade, HNSC[Head and Neck squamous cell carcinoma], KICH[Kidney Chromophobe], KIRC[Kidney renal clear cell carcinoma], KIRP[Kidney renal papillary cell carcinoma], LAML[Acute Myeloid Leukemia], LUAD[Lung adenocarcinoma], LUSC[Lung squamous cell carcinoma], OV[Ovarian serous cystadenocarcinoma ], PAAD[Pancreatic adenocarcinoma], PRAD[Prostate adenocarcinoma], SKCM[Skin Cutaneous Melanoma], STAD[Stomach adenocarcinoma], THCA[Thyroid carcinoma], UCEC[Uterine Corpus Endometrial Carcinoma] |
| Top |
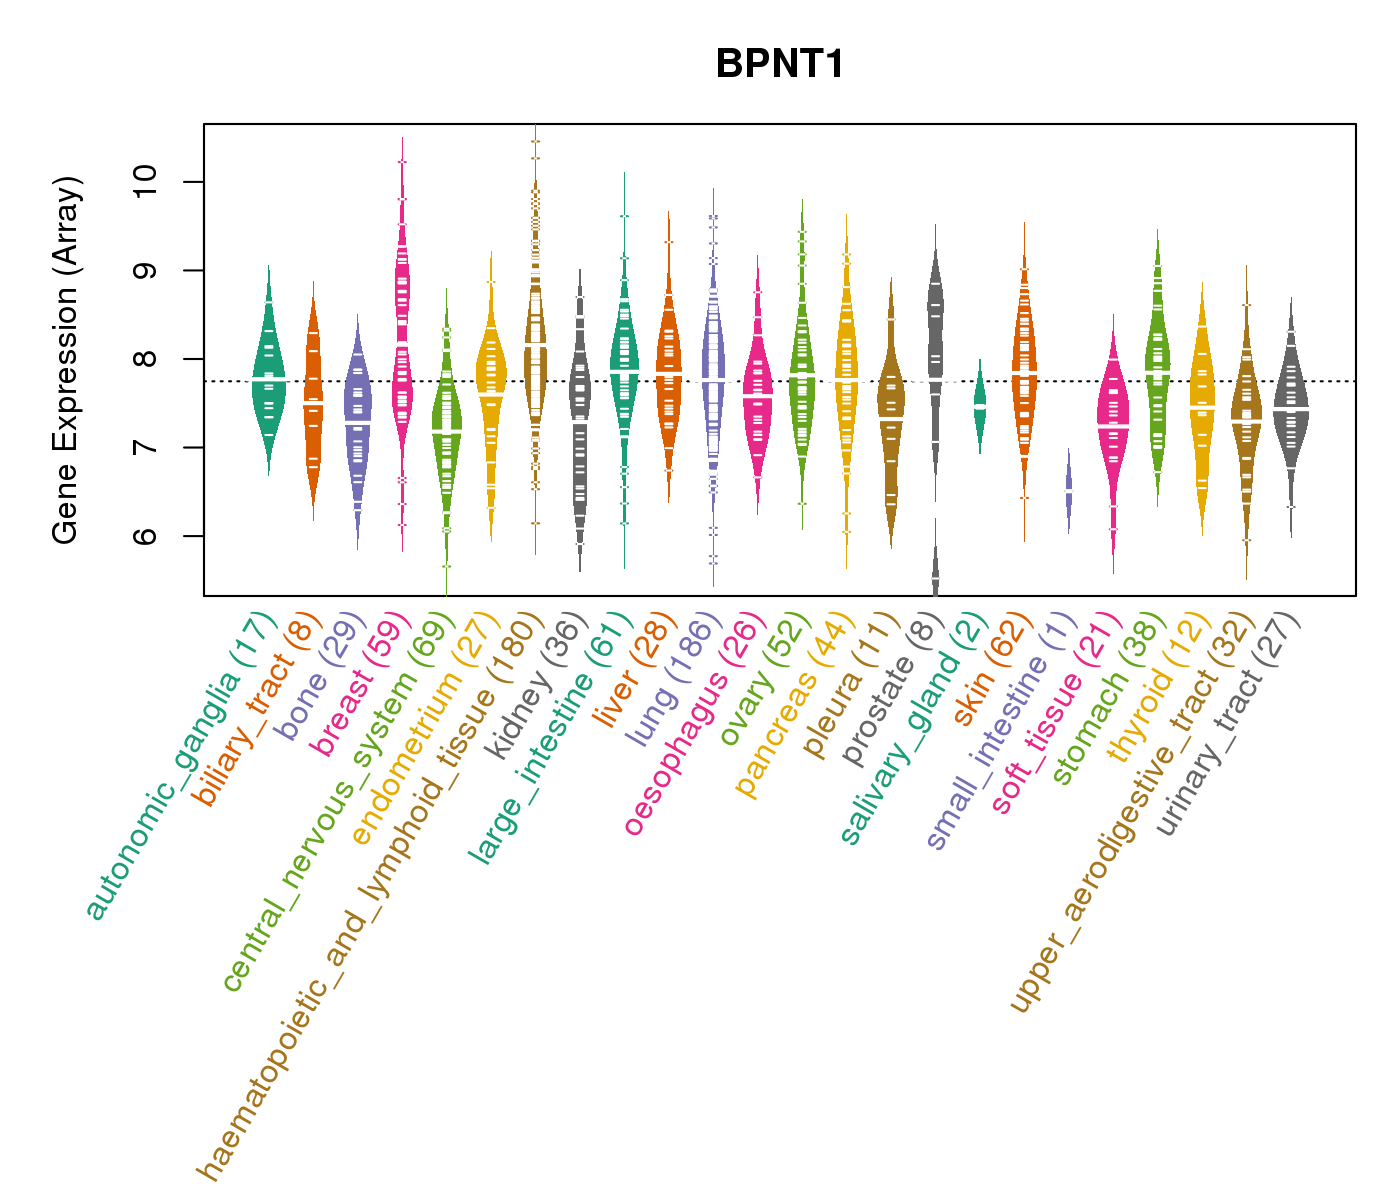
| Gene Expression for BPNT1 |
| * CCLE gene expression data were extracted from CCLE_Expression_Entrez_2012-10-18.res: Gene-centric RMA-normalized mRNA expression data. |
 |
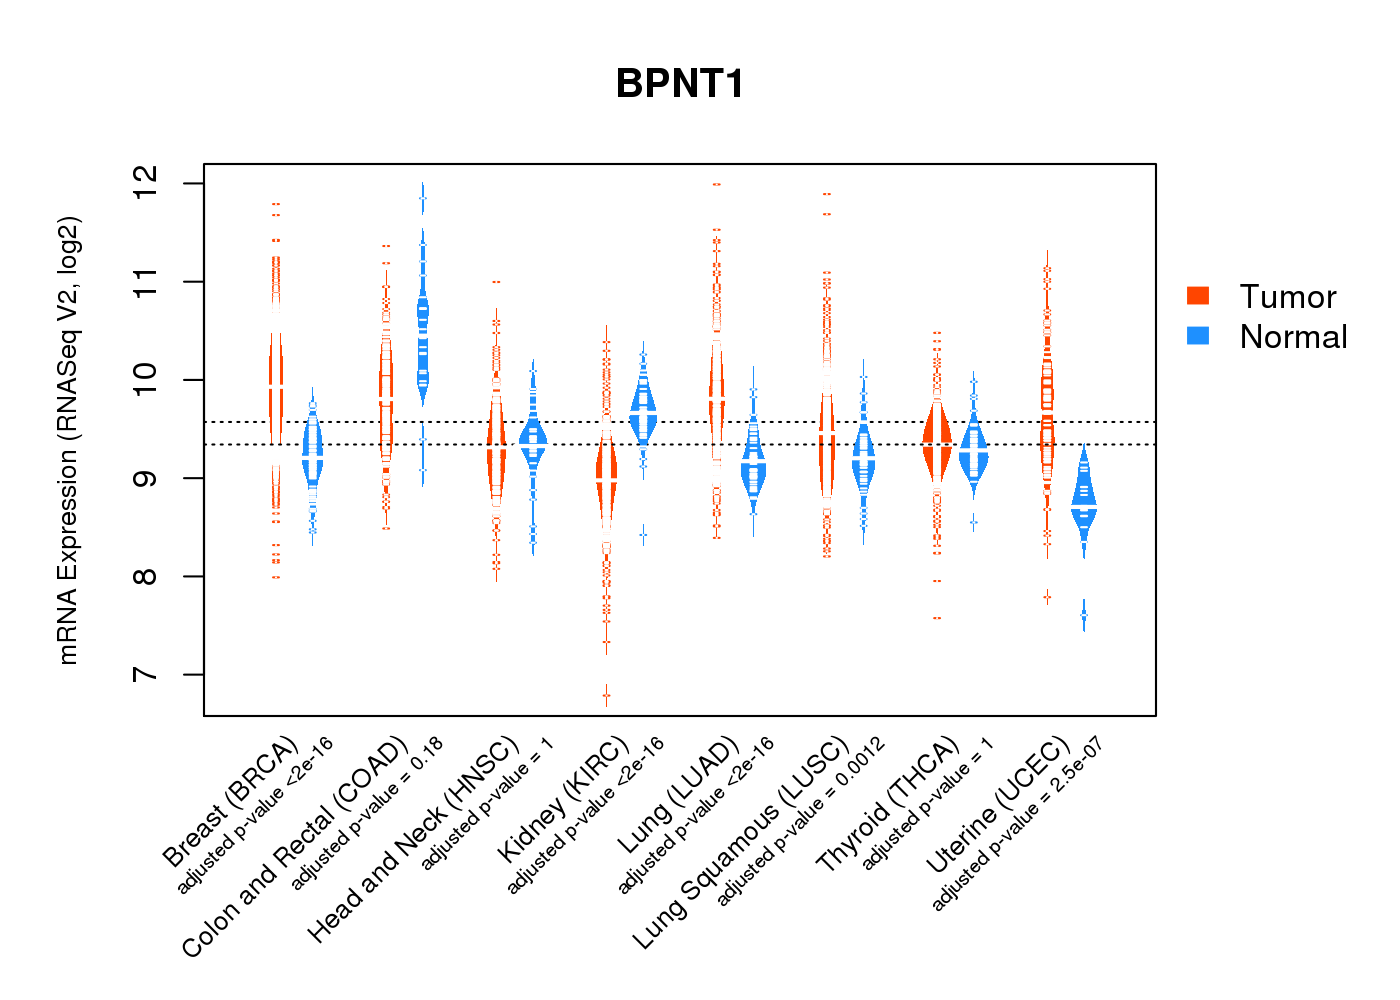
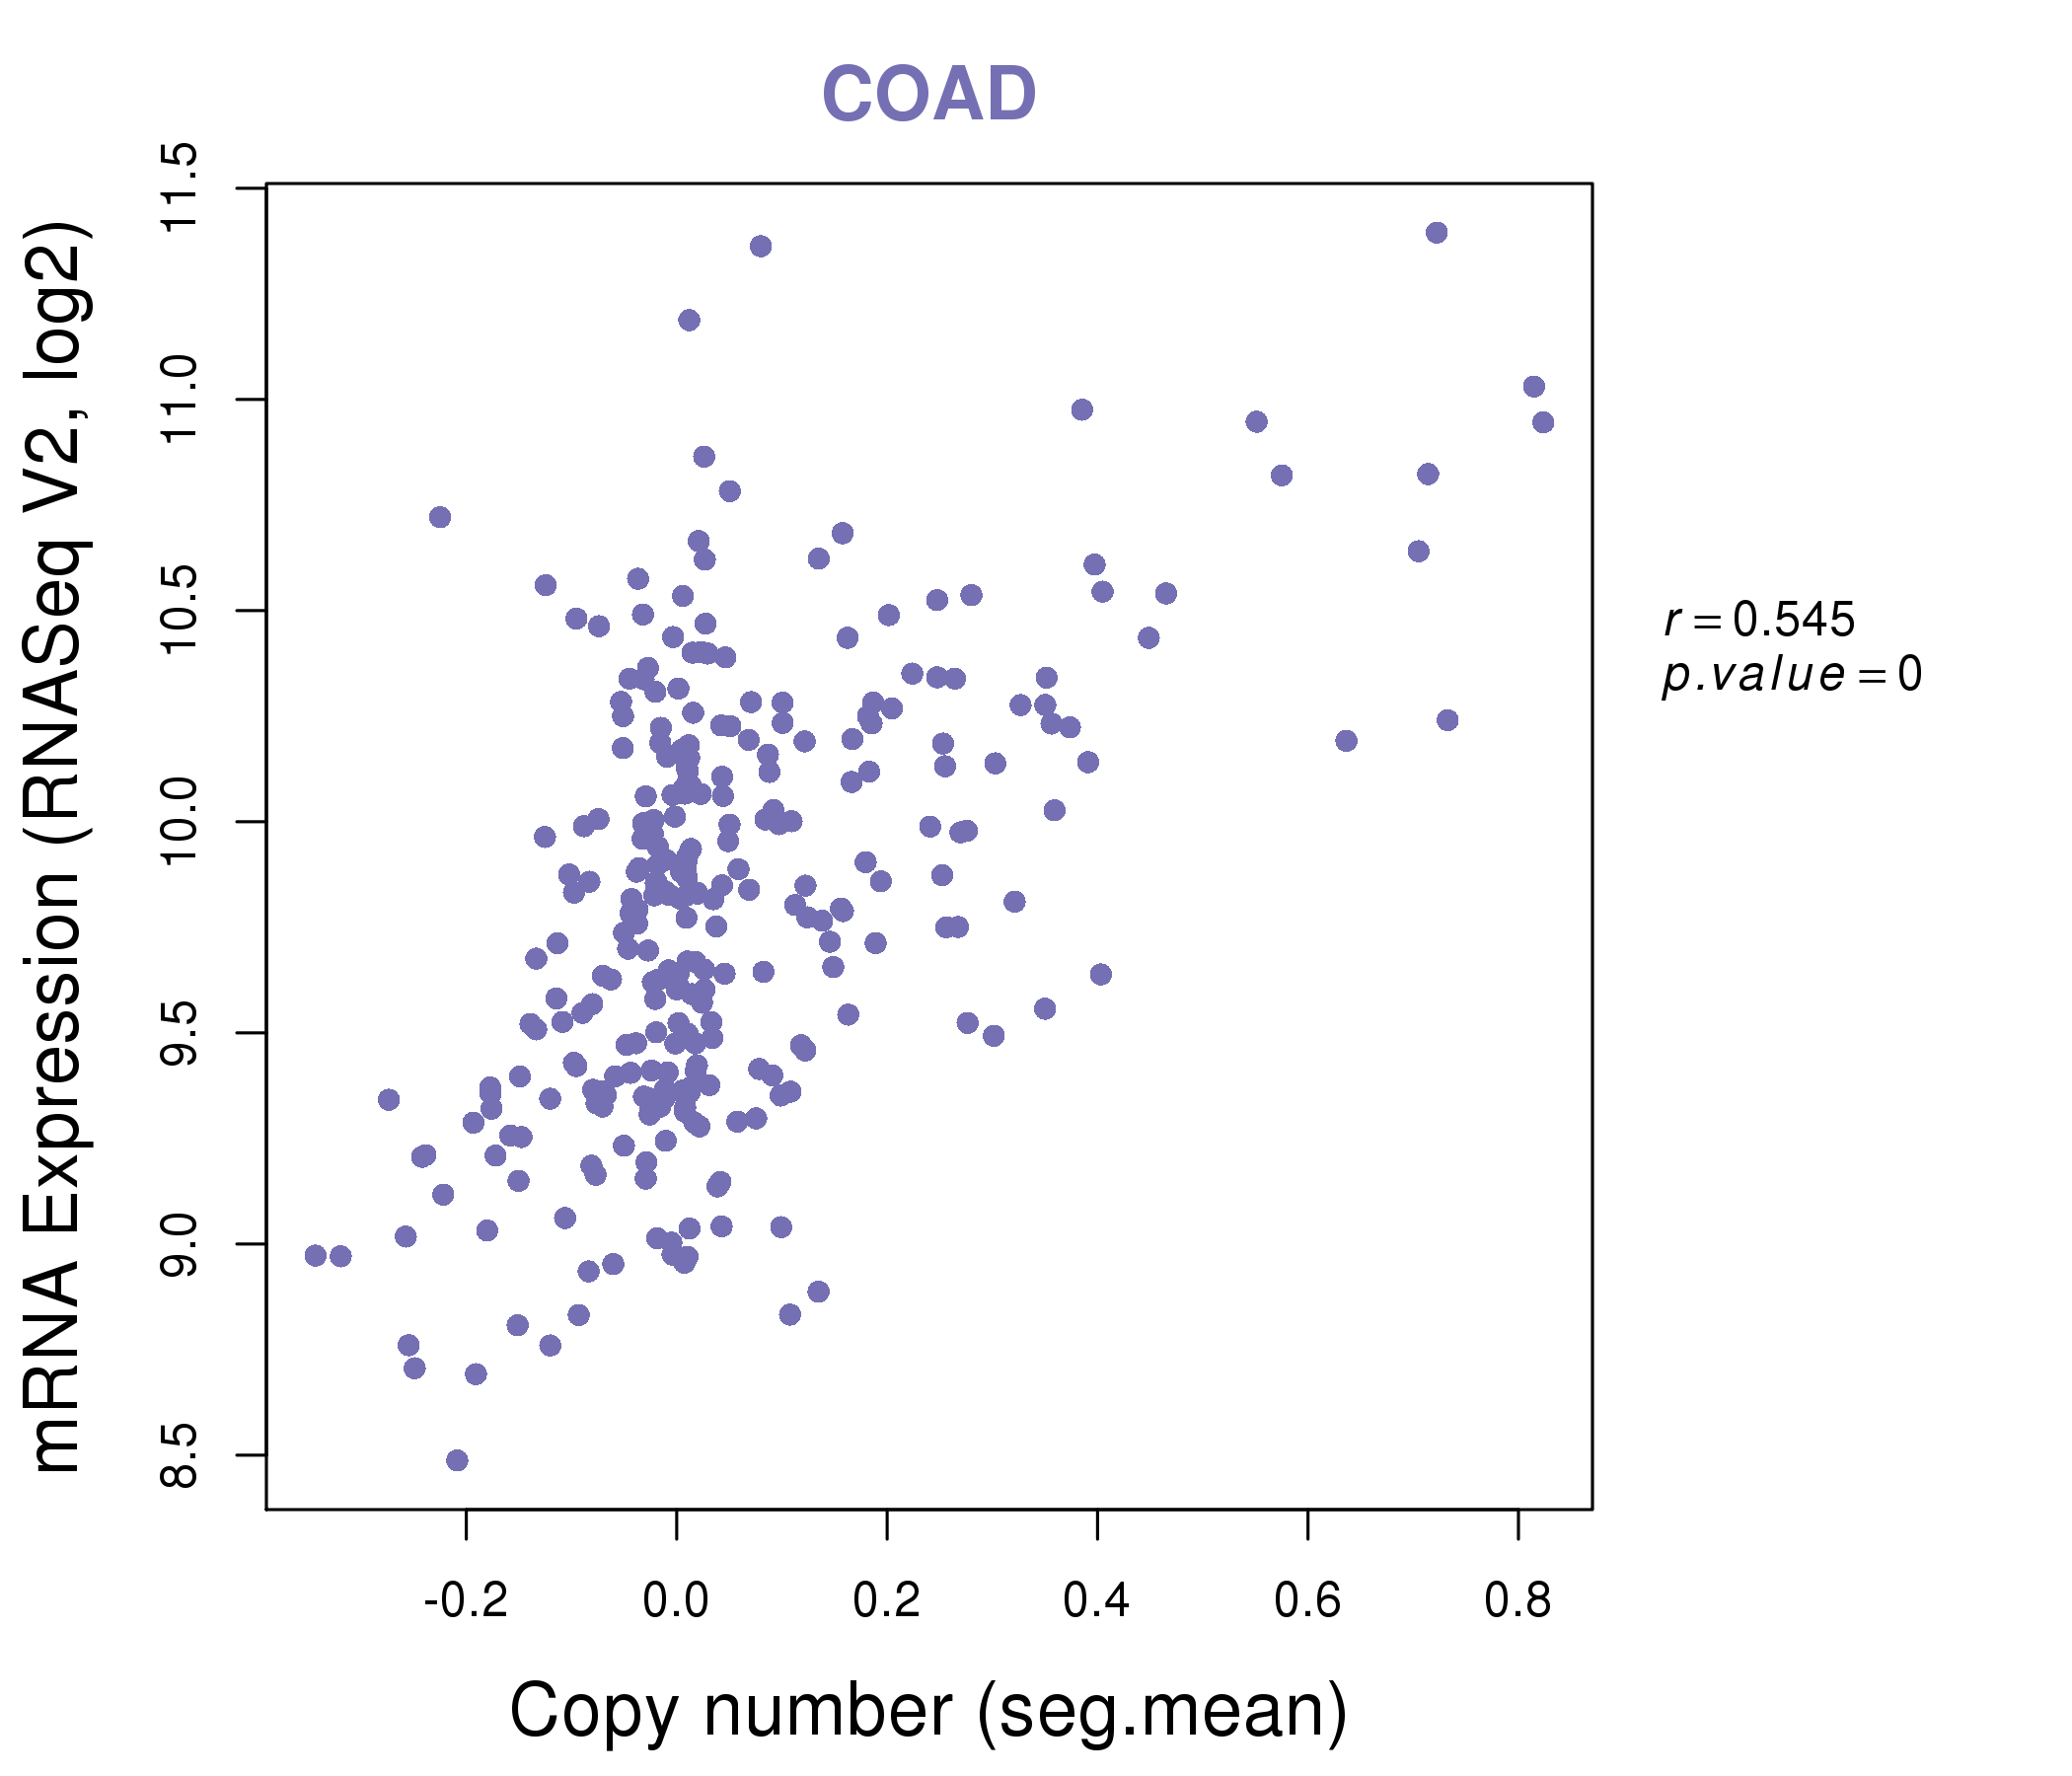
| * Normalized gene expression data of RNASeqV2 was extracted from TCGA using R package TCGA-Assembler. The URLs of all public data files on TCGA DCC data server were gathered at Jan-05-2015. Only eight cancer types have enough normal control samples for differential expression analysis. (t test, adjusted p<0.05 (using Benjamini-Hochberg FDR)) |
 |
| Top |
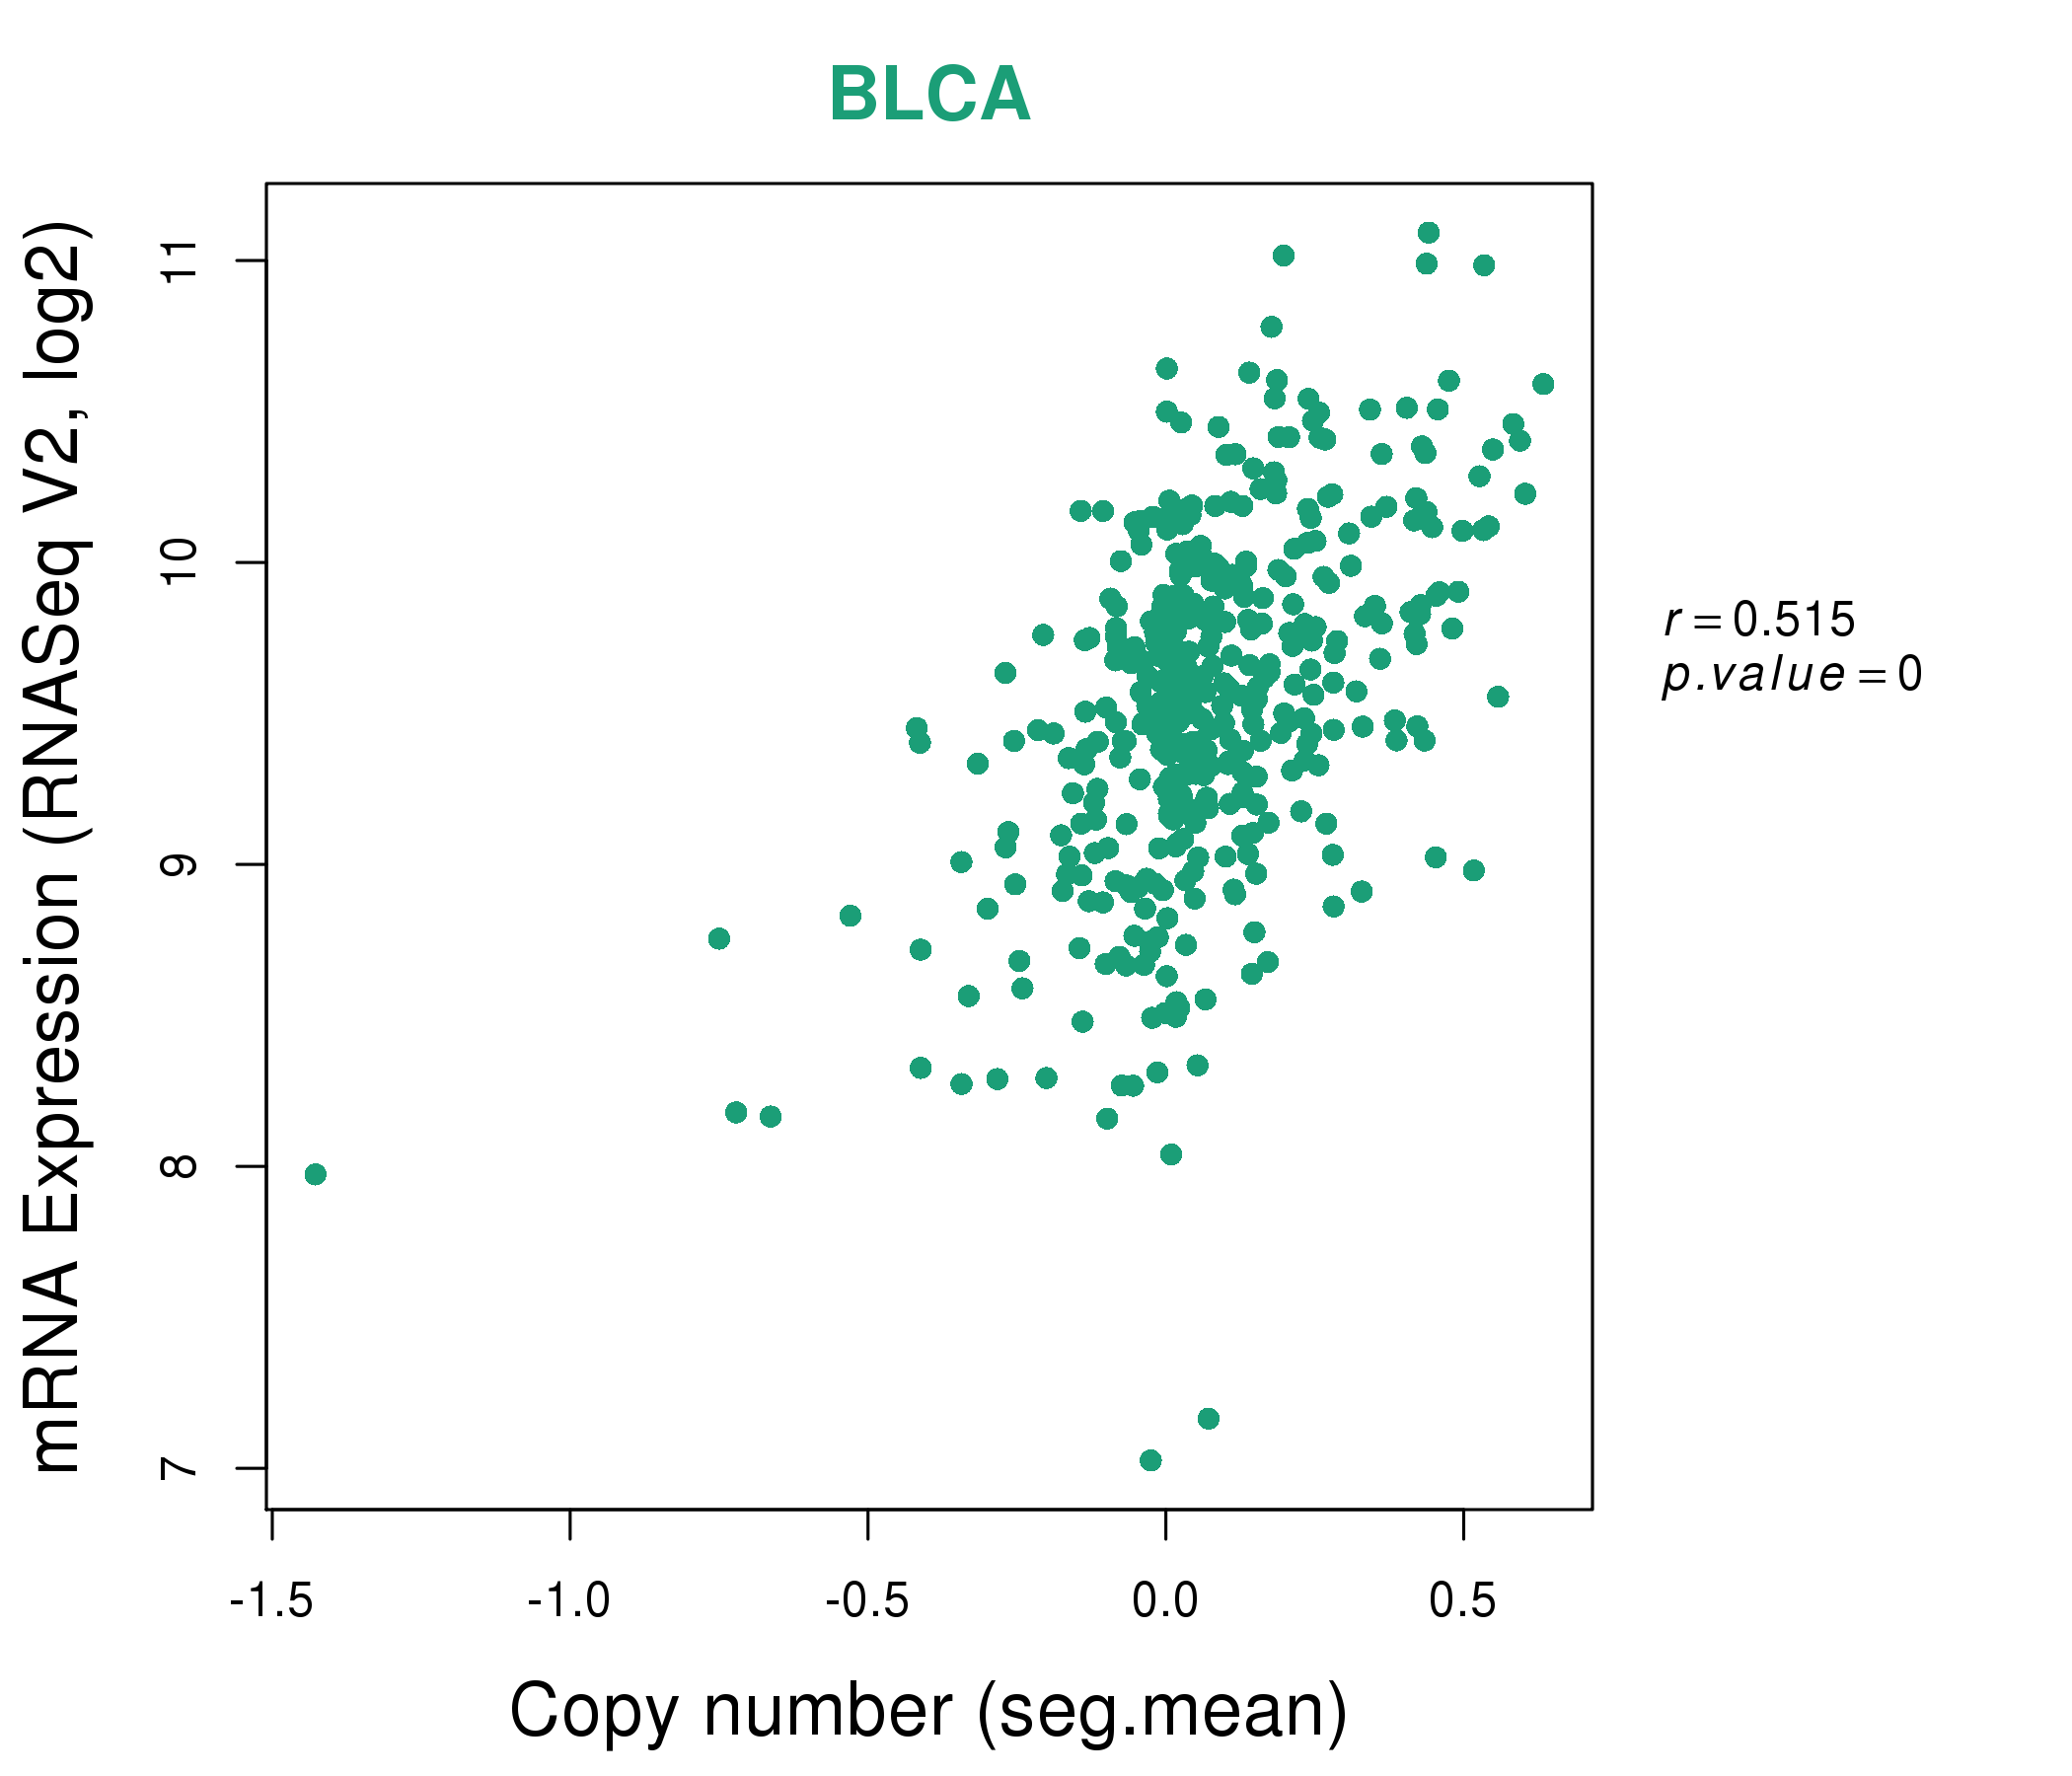
| * This plots show the correlation between CNV and gene expression. |
: Open all plots for all cancer types
 |
|
 |
|


| Top |
| Gene-Gene Network Information |
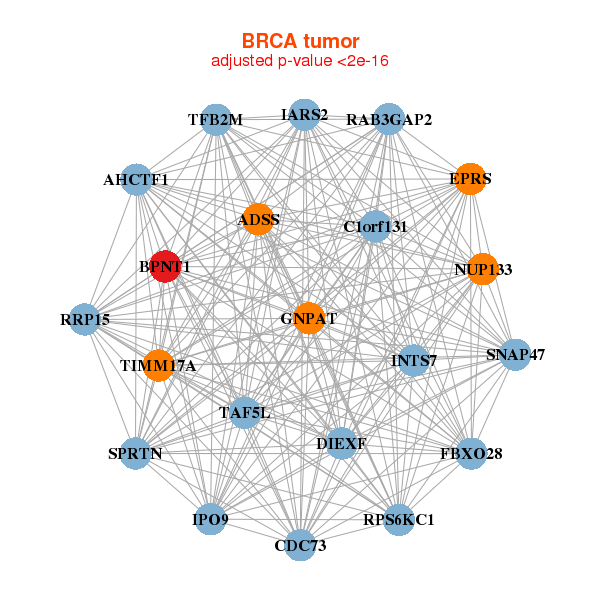
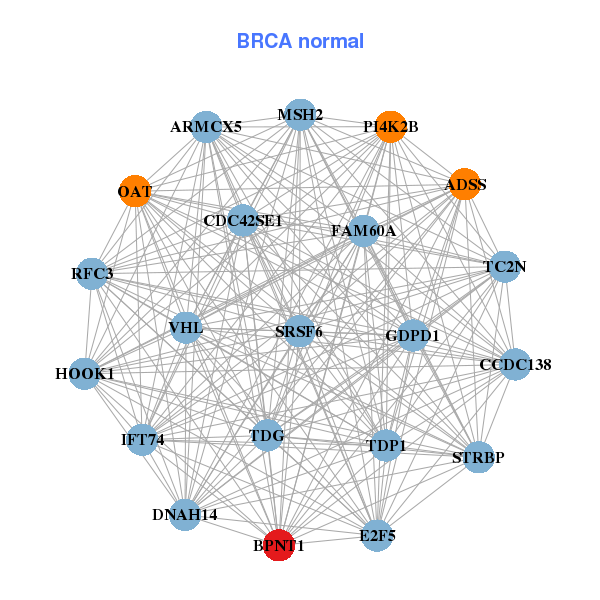
| * Co-Expression network figures were drawn using R package igraph. Only the top 20 genes with the highest correlations were shown. Red circle: input gene, orange circle: cell metabolism gene, sky circle: other gene |
: Open all plots for all cancer types
 |
|
| ADSS,AHCTF1,BPNT1,DIEXF,SPRTN,C1orf131,CDC73, EPRS,FBXO28,GNPAT,IARS2,INTS7,IPO9,NUP133, RAB3GAP2,RPS6KC1,RRP15,SNAP47,TAF5L,TFB2M,TIMM17A | ADSS,ARMCX5,BPNT1,CCDC138,CDC42SE1,DNAH14,E2F5, FAM60A,GDPD1,HOOK1,IFT74,MSH2,OAT,PI4K2B, RFC3,SRSF6,STRBP,TC2N,TDG,TDP1,VHL |
 |
|
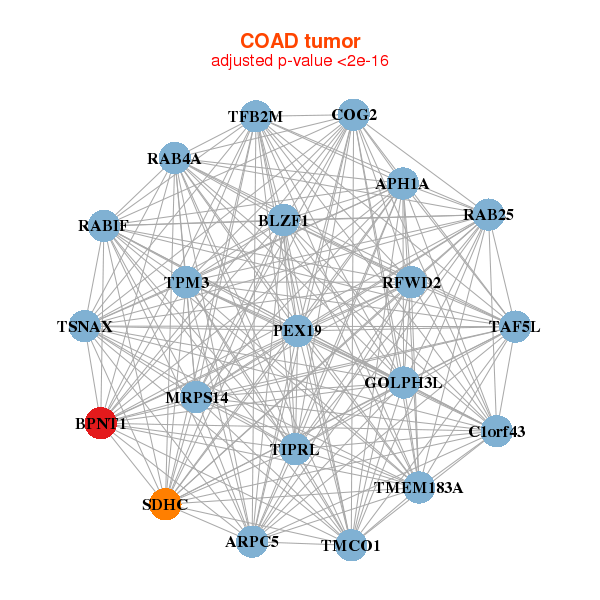
| APH1A,ARPC5,BLZF1,BPNT1,C1orf43,COG2,GOLPH3L, MRPS14,PEX19,RAB25,RAB4A,RABIF,RFWD2,SDHC, TAF5L,TFB2M,TIPRL,TMCO1,TMEM183A,TPM3,TSNAX | BPNT1,ABRACL,CRYL1,ETFA,RMDN2,HDHD3,HTATIP2, LGALS3,MAD2L1BP,MGST3,MLX,MYL12B,NAT2,NDFIP2, NMNAT1,SLC51B,SLC25A20,SLC25A5,SLMO2,SRI,TACO1 |
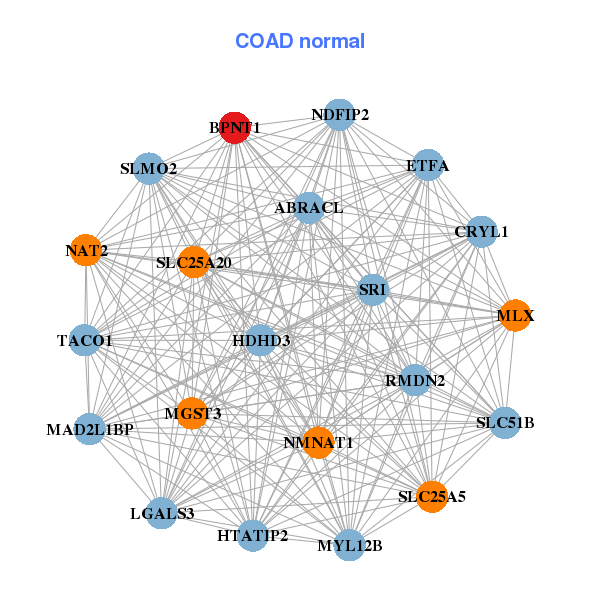
| * Co-Expression network figures were drawn using R package igraph. Only the top 20 genes with the highest correlations were shown. Red circle: input gene, orange circle: cell metabolism gene, sky circle: other gene |
: Open all plots for all cancer types
| Top |
: Open all interacting genes' information including KEGG pathway for all interacting genes from DAVID
| Top |
| Pharmacological Information for BPNT1 |
| There's no related Drug. |
| Top |
| Cross referenced IDs for BPNT1 |
| * We obtained these cross-references from Uniprot database. It covers 150 different DBs, 18 categories. http://www.uniprot.org/help/cross_references_section |
: Open all cross reference information
|
Copyright © 2016-Present - The Univsersity of Texas Health Science Center at Houston @ |