|
||||||||||||||||||||
| |
| Phenotypic Information (metabolism pathway, cancer, disease, phenome) |
| |
| |
| Gene-Gene Network Information: Co-Expression Network, Interacting Genes & KEGG |
| |
|


| Gene Summary for TUBB4A |
| Top |
| Phenotypic Information for TUBB4A(metabolism pathway, cancer, disease, phenome) |
| Cancer | CGAP: TUBB4A |
| Familial Cancer Database: TUBB4A | |
| * This gene is included in those cancer gene databases. |
|
|
|
|
|
| . | ||||||||||||||
Oncogene 1 | Significant driver gene in | |||||||||||||||||||
| cf) number; DB name 1 Oncogene; http://nar.oxfordjournals.org/content/35/suppl_1/D721.long, 2 Tumor Suppressor gene; https://bioinfo.uth.edu/TSGene/, 3 Cancer Gene Census; http://www.nature.com/nrc/journal/v4/n3/abs/nrc1299.html, 4 CancerGenes; http://nar.oxfordjournals.org/content/35/suppl_1/D721.long, 5 Network of Cancer Gene; http://ncg.kcl.ac.uk/index.php, 1Therapeutic Vulnerabilities in Cancer; http://cbio.mskcc.org/cancergenomics/statius/ |
| REACTOME_METABOLISM_OF_PROTEINS | |
| OMIM | |
| Orphanet | |
| Disease | KEGG Disease: TUBB4A |
| MedGen: TUBB4A (Human Medical Genetics with Condition) | |
| ClinVar: TUBB4A | |
| Phenotype | MGI: TUBB4A (International Mouse Phenotyping Consortium) |
| PhenomicDB: TUBB4A | |
| Mutations for TUBB4A |
| * Under tables are showing count per each tissue to give us broad intuition about tissue specific mutation patterns.You can go to the detailed page for each mutation database's web site. |
| - Statistics for Tissue and Mutation type | Top |
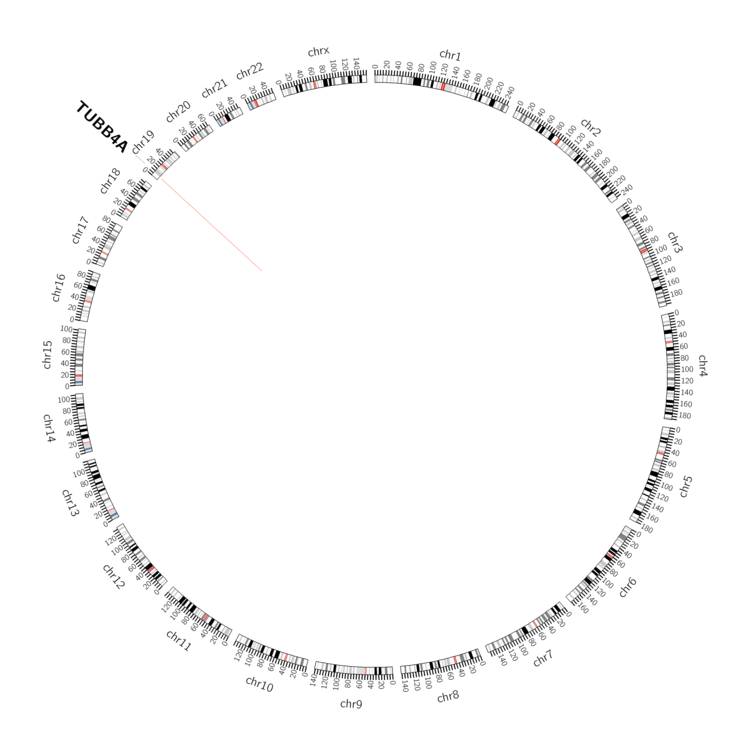 |
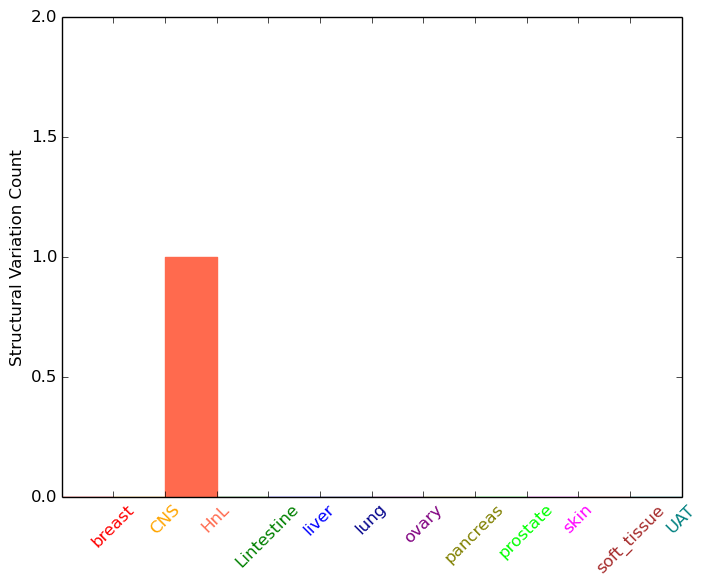
| - For Inter-chromosomal Variations |
| There's no inter-chromosomal structural variation. |
| - For Intra-chromosomal Variations |
| * Intra-chromosomal variantions includes 'intrachromosomal amplicon to amplicon', 'intrachromosomal amplicon to non-amplified dna', 'intrachromosomal deletion', 'intrachromosomal fold-back inversion', 'intrachromosomal inversion', 'intrachromosomal tandem duplication', 'Intrachromosomal unknown type', 'intrachromosomal with inverted orientation', 'intrachromosomal with non-inverted orientation'. |
 |
| Sample | Symbol_a | Chr_a | Start_a | End_a | Symbol_b | Chr_b | Start_b | End_b |
| haematopoietic_and_lymphoid_tissue | TUBB4A | chr19 | 6497249 | 6497249 | TUBB4A | chr19 | 6497249 | 6497249 |
| cf) Tissue number; Tissue name (1;Breast, 2;Central_nervous_system, 3;Haematopoietic_and_lymphoid_tissue, 4;Large_intestine, 5;Liver, 6;Lung, 7;Ovary, 8;Pancreas, 9;Prostate, 10;Skin, 11;Soft_tissue, 12;Upper_aerodigestive_tract) |
| * From mRNA Sanger sequences, Chitars2.0 arranged chimeric transcripts. This table shows TUBB4A related fusion information. |
| ID | Head Gene | Tail Gene | Accession | Gene_a | qStart_a | qEnd_a | Chromosome_a | tStart_a | tEnd_a | Gene_a | qStart_a | qEnd_a | Chromosome_a | tStart_a | tEnd_a |
| CB146214 | KDM5A | 21 | 277 | 12 | 402041 | 402297 | TUBB4A | 273 | 446 | 19 | 6494726 | 6494899 | |
| AW953448 | TUBG2 | 11 | 485 | 17 | 40818201 | 40818876 | TUBB4A | 484 | 652 | 19 | 6494553 | 6494721 | |
| DA073851 | MALAT1 | 1 | 245 | 11 | 65266516 | 65266760 | TUBB4A | 246 | 589 | 19 | 6501331 | 6502323 | |
| AA683237 | TUBB4A | 1 | 369 | 19 | 6494565 | 6494933 | RBM20 | 366 | 445 | 10 | 112494468 | 112494549 | |
| BF945627 | RILPL1 | 12 | 297 | 12 | 123968777 | 123969063 | TUBB4A | 293 | 408 | 19 | 6494559 | 6494674 | |
| T06068 | TUBB4A | 1 | 53 | 19 | 6494331 | 6494383 | TCF4 | 54 | 300 | 18 | 52896288 | 52901841 | |
| BF946266 | LDB3 | 5 | 201 | 10 | 88458259 | 88458454 | TUBB4A | 188 | 425 | 19 | 6495154 | 6495391 | |
| BF933096 | PPT2 | 1 | 288 | 6 | 3397686 | 3397973 | TUBB4A | 286 | 357 | 19 | 6495065 | 6495139 | |
| BI035864 | PBX2 | 1 | 266 | 6 | 3504787 | 3505293 | TUBB4A | 260 | 329 | 19 | 6494464 | 6494533 | |
| Top |
| There's no copy number variation information in COSMIC data for this gene. |
| Top |
|
 |
| Top |
| Stat. for Non-Synonymous SNVs (# total SNVs=0) | (# total SNVs=0) |
(# total SNVs=0) | (# total SNVs=0) |
| Top |
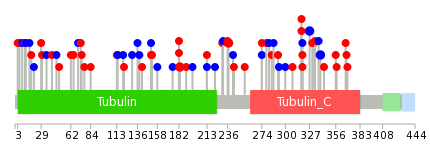
| * When you move the cursor on each content, you can see more deailed mutation information on the Tooltip. Those are primary_site,primary_histology,mutation(aa),pubmedID. |
| GRCh37 position | Mutation(aa) | Unique sampleID count |
| Top |
|
 |
| Point Mutation/ Tissue ID | 1 | 2 | 3 | 4 | 5 | 6 | 7 | 8 | 9 | 10 | 11 | 12 | 13 | 14 | 15 | 16 | 17 | 18 | 19 | 20 |
| # sample | 2 | 2 | 1 | 10 | 6 | 4 | 2 | 1 | 14 | 4 | 2 | 1 | 6 | 8 | 7 | |||||
| # mutation | 2 | 2 | 1 | 9 | 6 | 4 | 2 | 1 | 16 | 5 | 2 | 1 | 6 | 8 | 12 | |||||
| nonsynonymous SNV | 2 | 1 | 4 | 3 | 3 | 1 | 1 | 10 | 4 | 2 | 3 | 5 | 8 | |||||||
| synonymous SNV | 2 | 5 | 3 | 1 | 1 | 6 | 1 | 1 | 3 | 3 | 4 |
| cf) Tissue ID; Tissue type (1; BLCA[Bladder Urothelial Carcinoma], 2; BRCA[Breast invasive carcinoma], 3; CESC[Cervical squamous cell carcinoma and endocervical adenocarcinoma], 4; COAD[Colon adenocarcinoma], 5; GBM[Glioblastoma multiforme], 6; Glioma Low Grade, 7; HNSC[Head and Neck squamous cell carcinoma], 8; KICH[Kidney Chromophobe], 9; KIRC[Kidney renal clear cell carcinoma], 10; KIRP[Kidney renal papillary cell carcinoma], 11; LAML[Acute Myeloid Leukemia], 12; LUAD[Lung adenocarcinoma], 13; LUSC[Lung squamous cell carcinoma], 14; OV[Ovarian serous cystadenocarcinoma ], 15; PAAD[Pancreatic adenocarcinoma], 16; PRAD[Prostate adenocarcinoma], 17; SKCM[Skin Cutaneous Melanoma], 18:STAD[Stomach adenocarcinoma], 19:THCA[Thyroid carcinoma], 20:UCEC[Uterine Corpus Endometrial Carcinoma]) |
| Top |
| * We represented just top 10 SNVs. When you move the cursor on each content, you can see more deailed mutation information on the Tooltip. Those are primary_site, primary_histology, mutation(aa), pubmedID. |
| Genomic Position | Mutation(aa) | Unique sampleID count |
| chr19:6495313 | p.T327T,TUBB4A | 2 |
| chr19:6495341 | p.R237C,TUBB4A | 2 |
| chr19:6495747 | p.R318Q,TUBB4A | 2 |
| chr19:6495277 | p.V183I,TUBB4A | 2 |
| chr19:6495749 | p.A339A,TUBB4A | 2 |
| chr19:6495585 | p.A182G,TUBB4A | 2 |
| chr19:6495957 | p.N175N,TUBB4A | 1 |
| chr19:6495433 | p.S73Y,TUBB4A | 1 |
| chr19:6495601 | p.G29D,TUBB4A | 1 |
| chr19:6501326 | p.E333K,TUBB4A | 1 |
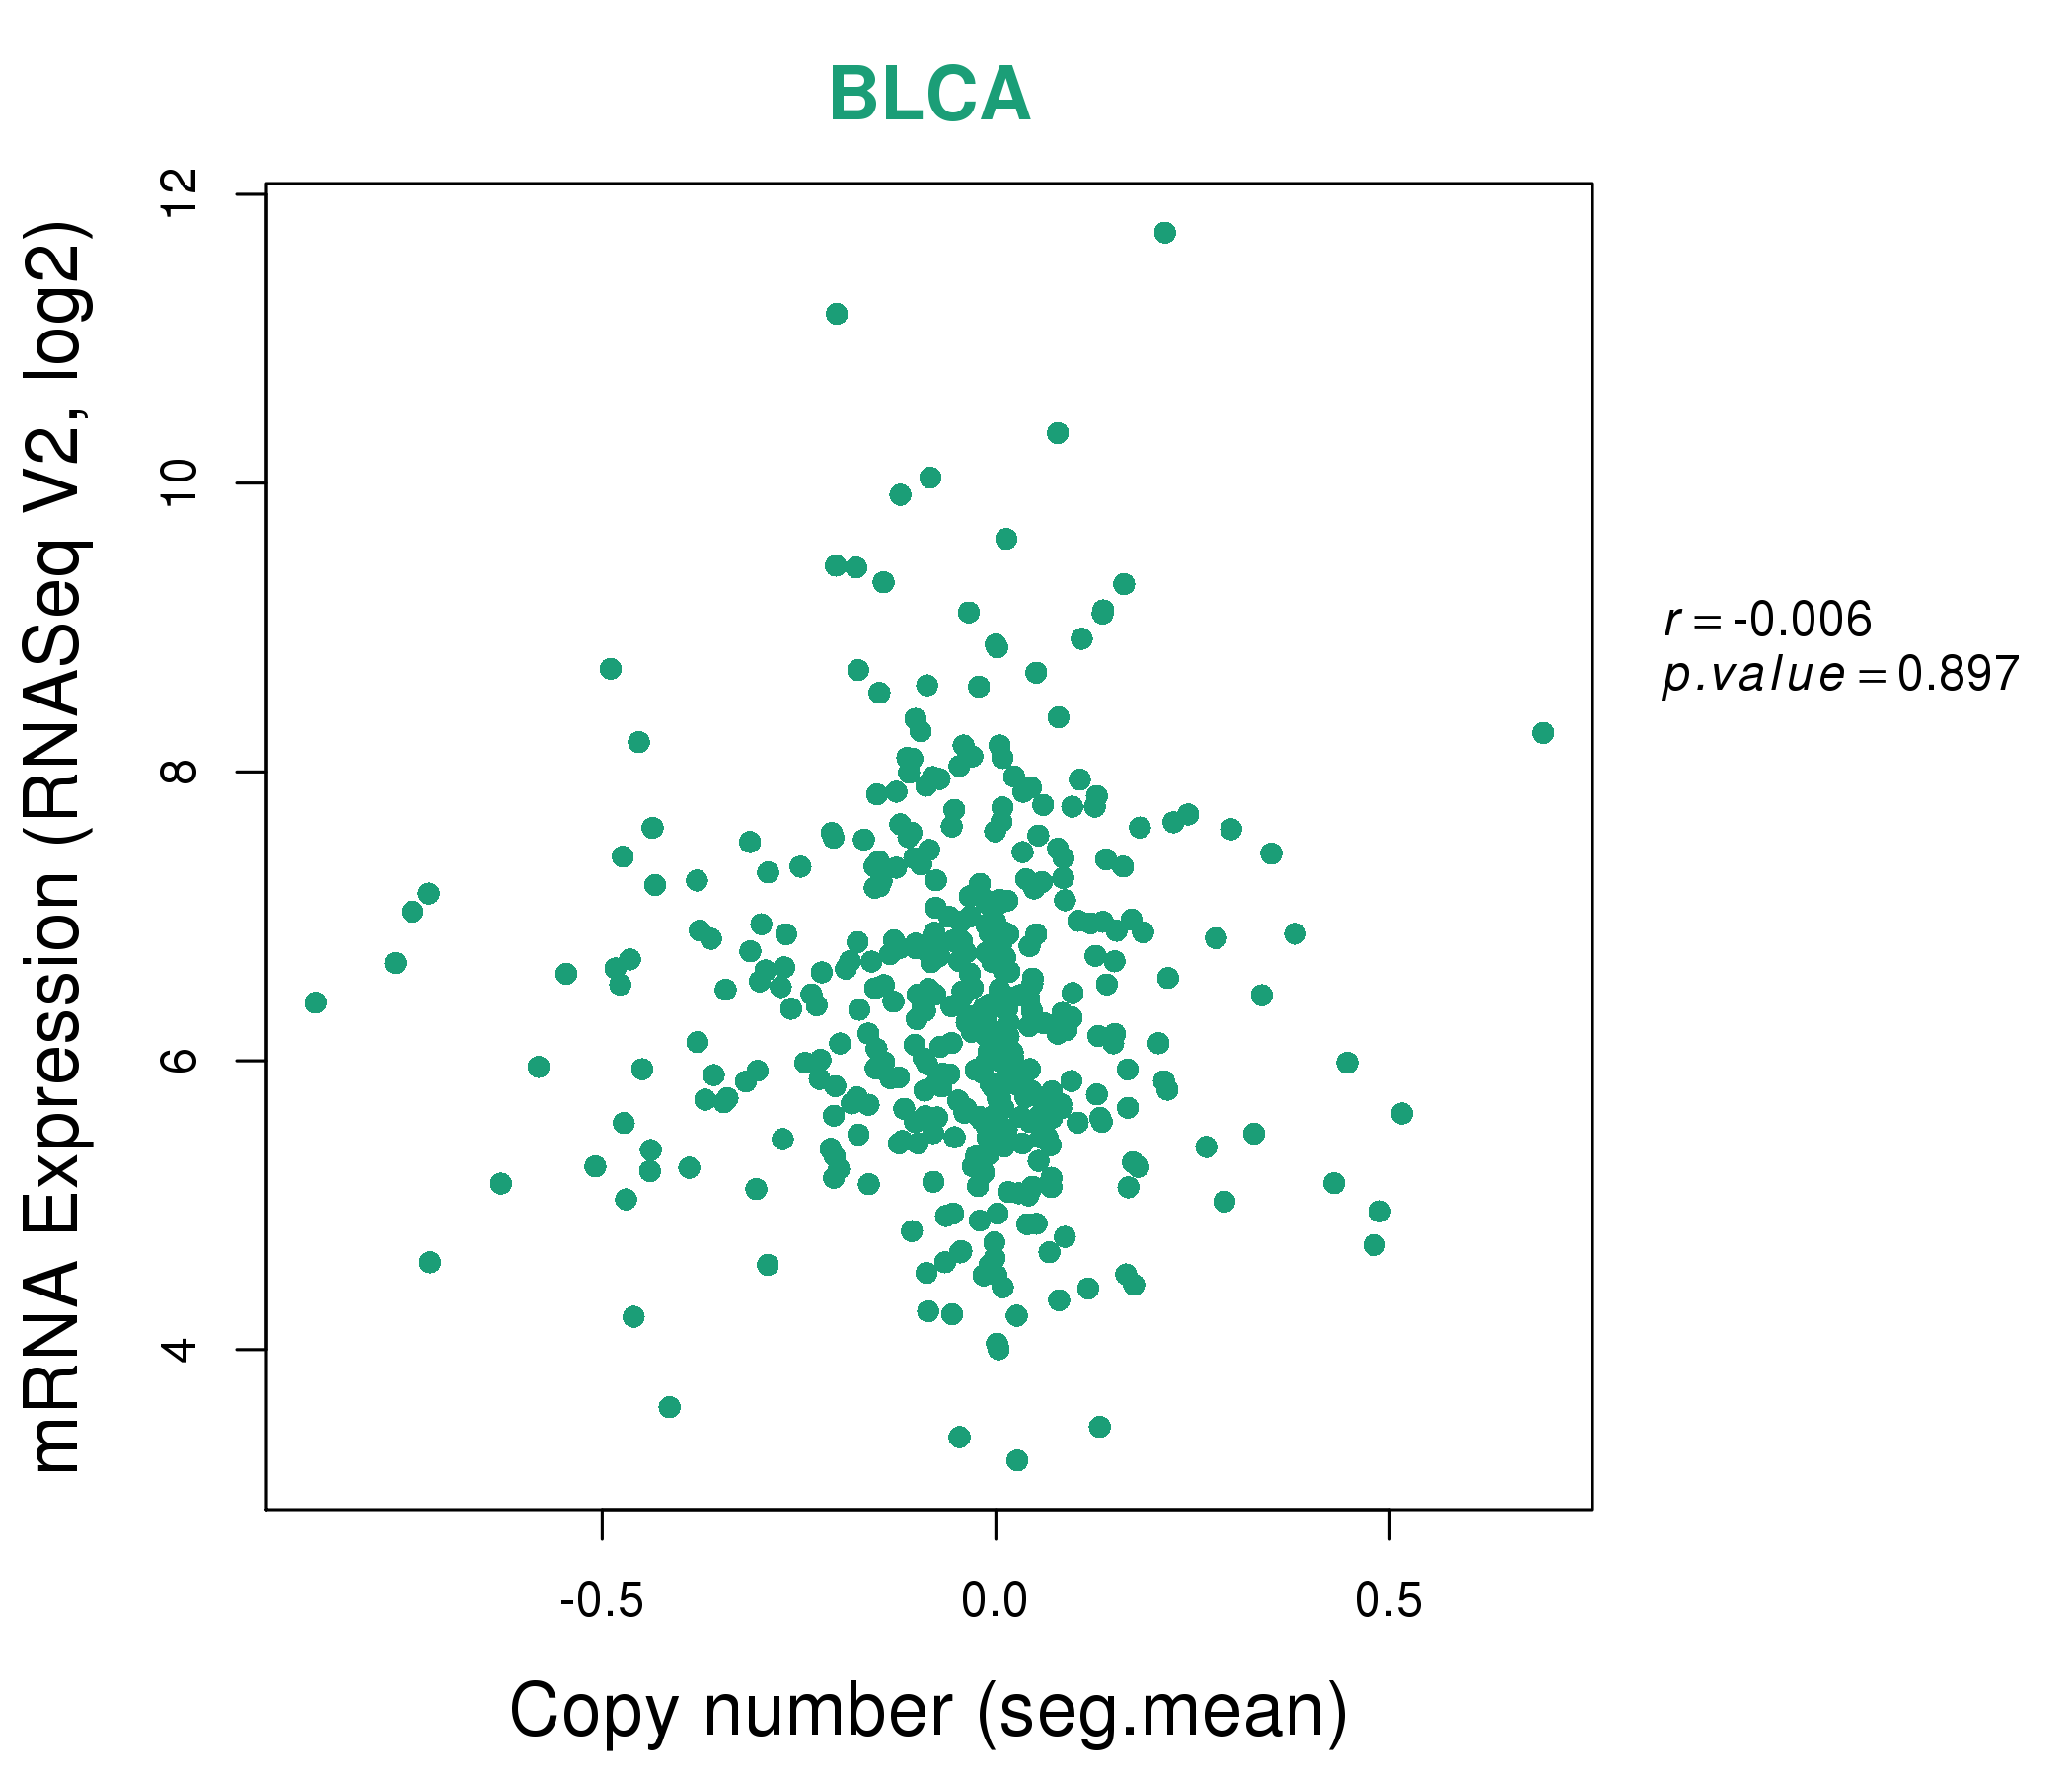
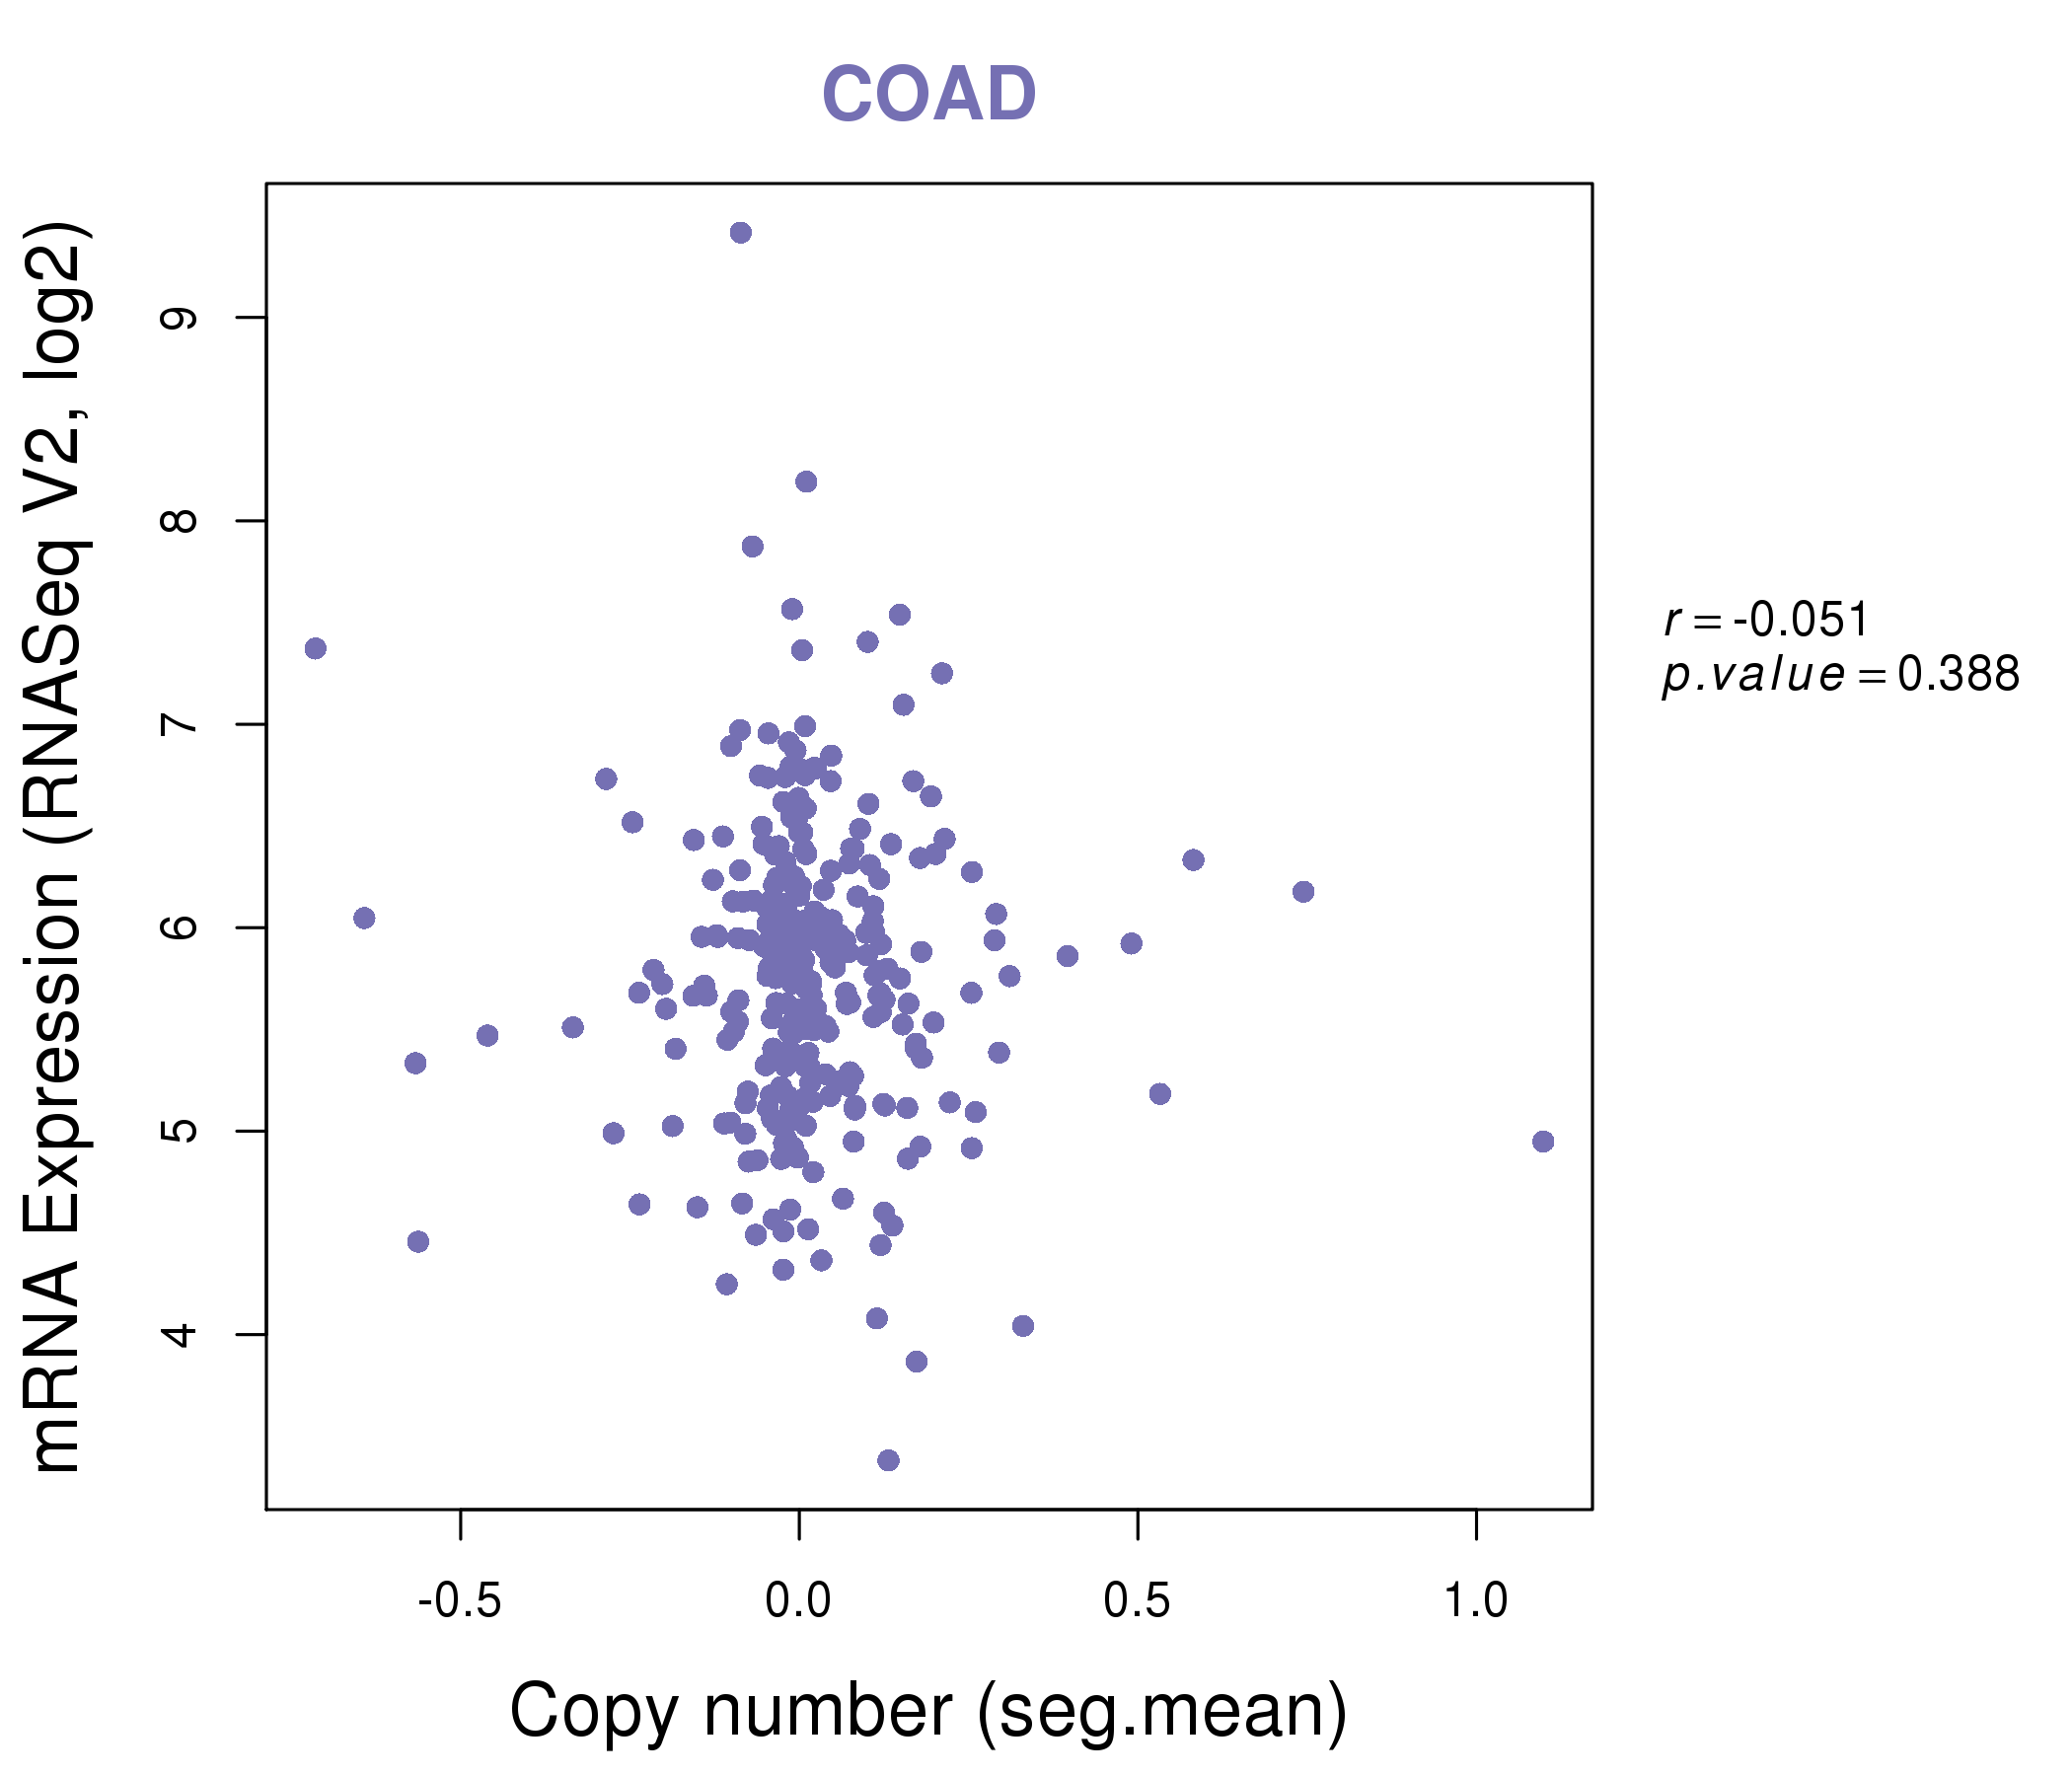
| * Copy number data were extracted from TCGA using R package TCGA-Assembler. The URLs of all public data files on TCGA DCC data server were gathered on Jan-05-2015. Function ProcessCNAData in TCGA-Assembler package was used to obtain gene-level copy number value which is calculated as the average copy number of the genomic region of a gene. |
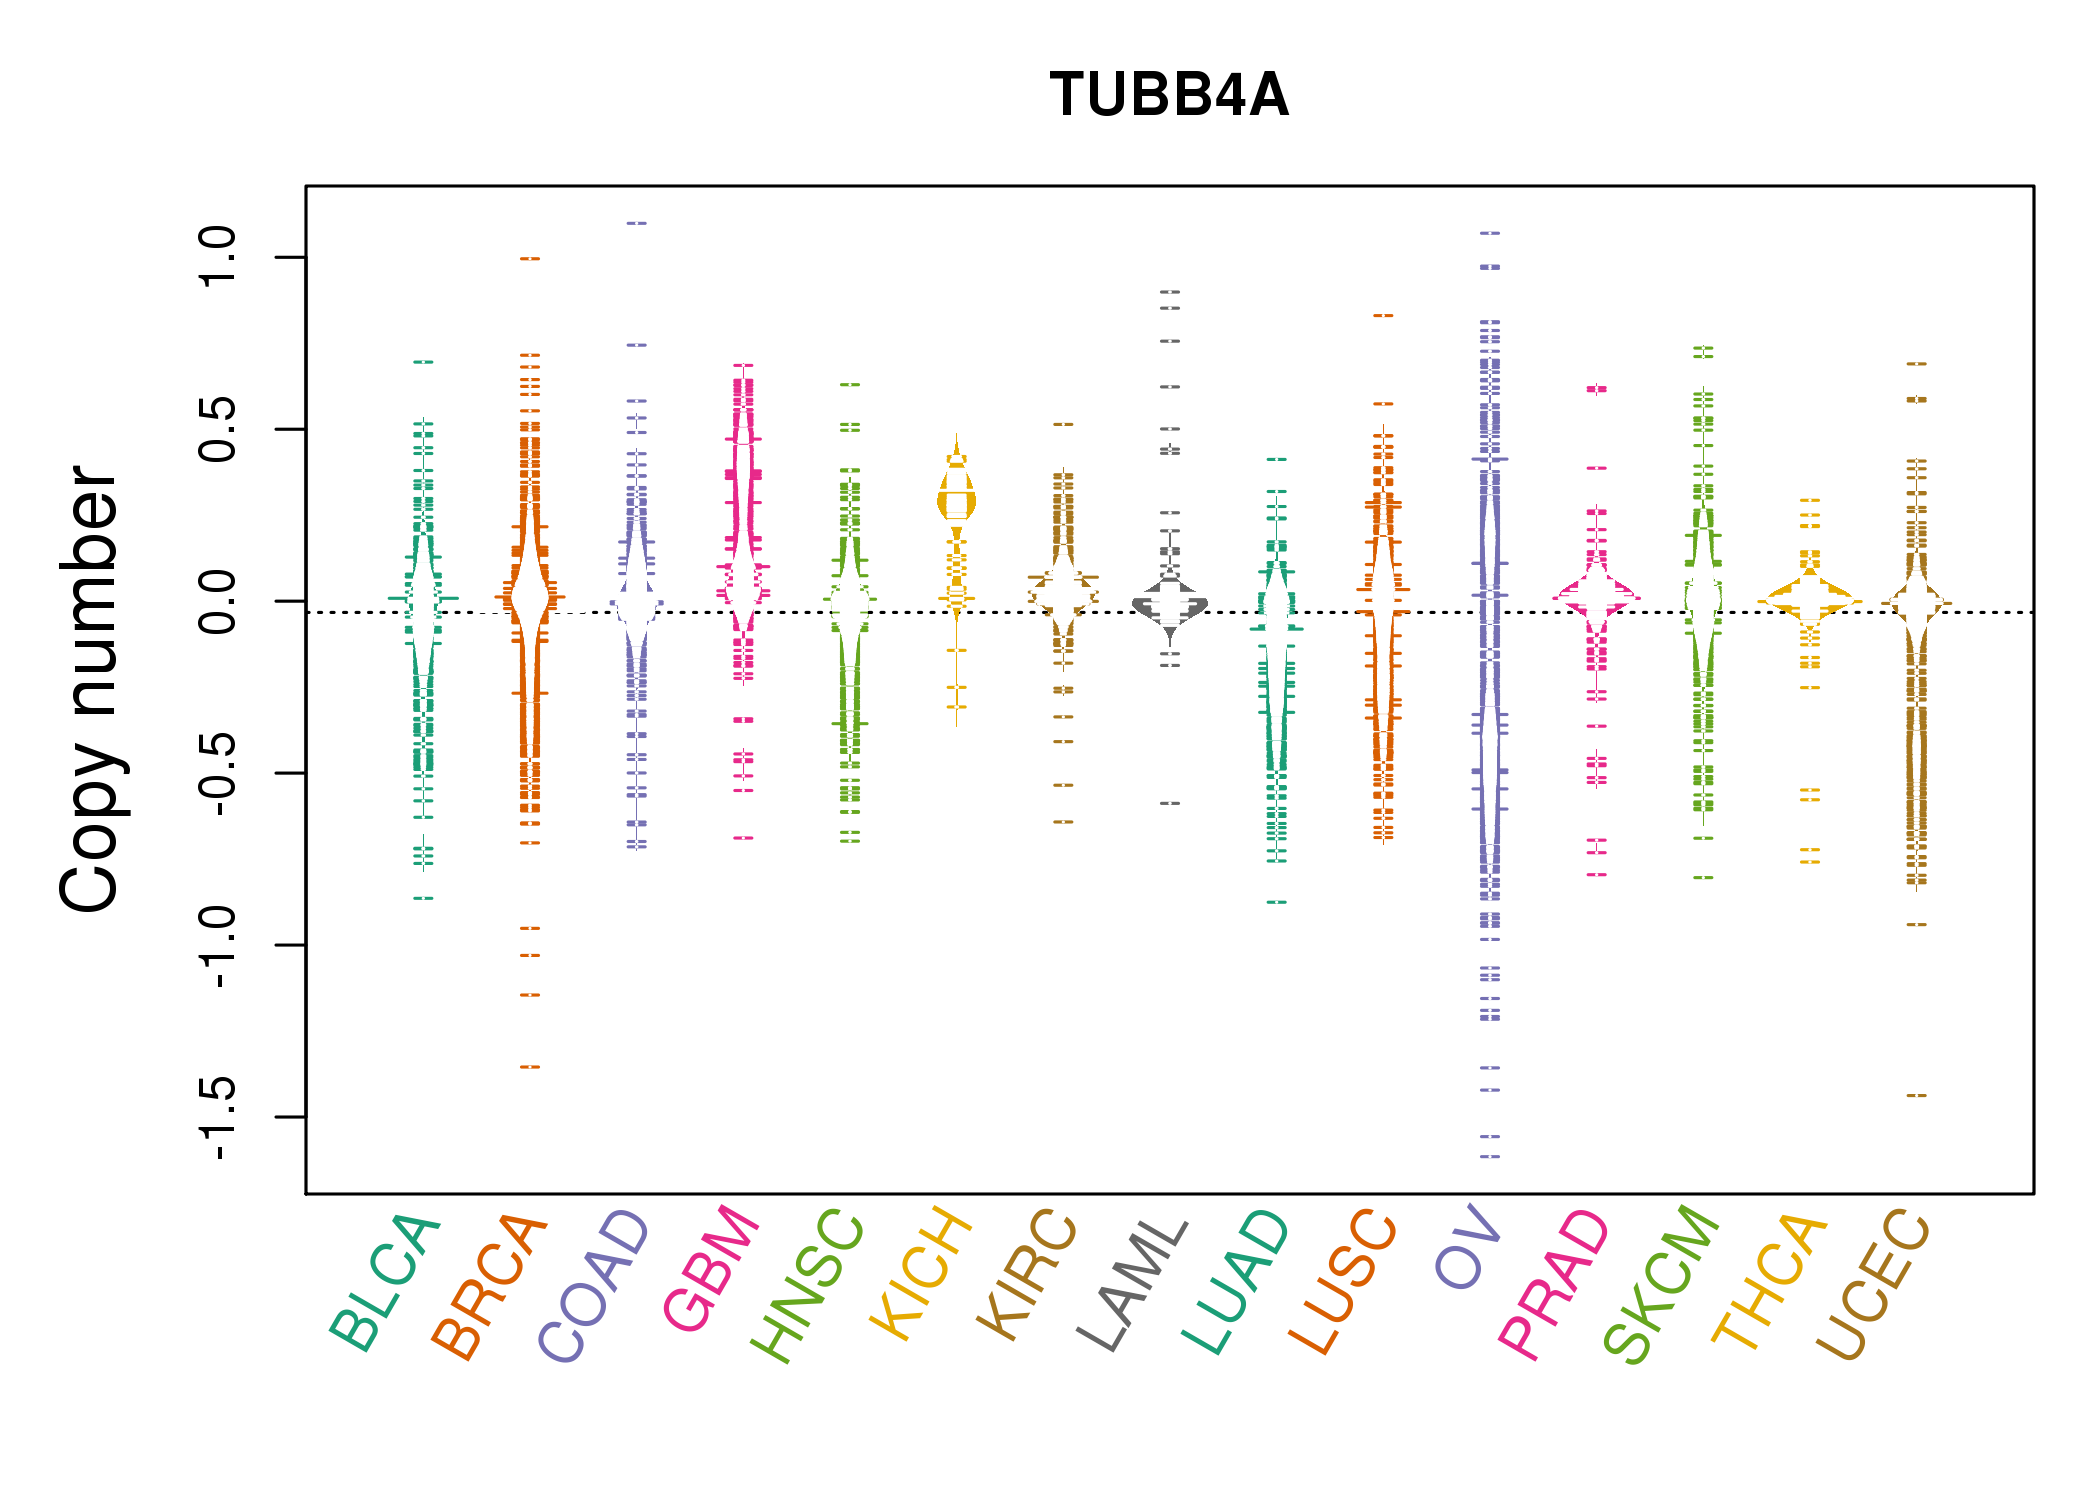 |
| cf) Tissue ID[Tissue type]: BLCA[Bladder Urothelial Carcinoma], BRCA[Breast invasive carcinoma], CESC[Cervical squamous cell carcinoma and endocervical adenocarcinoma], COAD[Colon adenocarcinoma], GBM[Glioblastoma multiforme], Glioma Low Grade, HNSC[Head and Neck squamous cell carcinoma], KICH[Kidney Chromophobe], KIRC[Kidney renal clear cell carcinoma], KIRP[Kidney renal papillary cell carcinoma], LAML[Acute Myeloid Leukemia], LUAD[Lung adenocarcinoma], LUSC[Lung squamous cell carcinoma], OV[Ovarian serous cystadenocarcinoma ], PAAD[Pancreatic adenocarcinoma], PRAD[Prostate adenocarcinoma], SKCM[Skin Cutaneous Melanoma], STAD[Stomach adenocarcinoma], THCA[Thyroid carcinoma], UCEC[Uterine Corpus Endometrial Carcinoma] |
| Top |
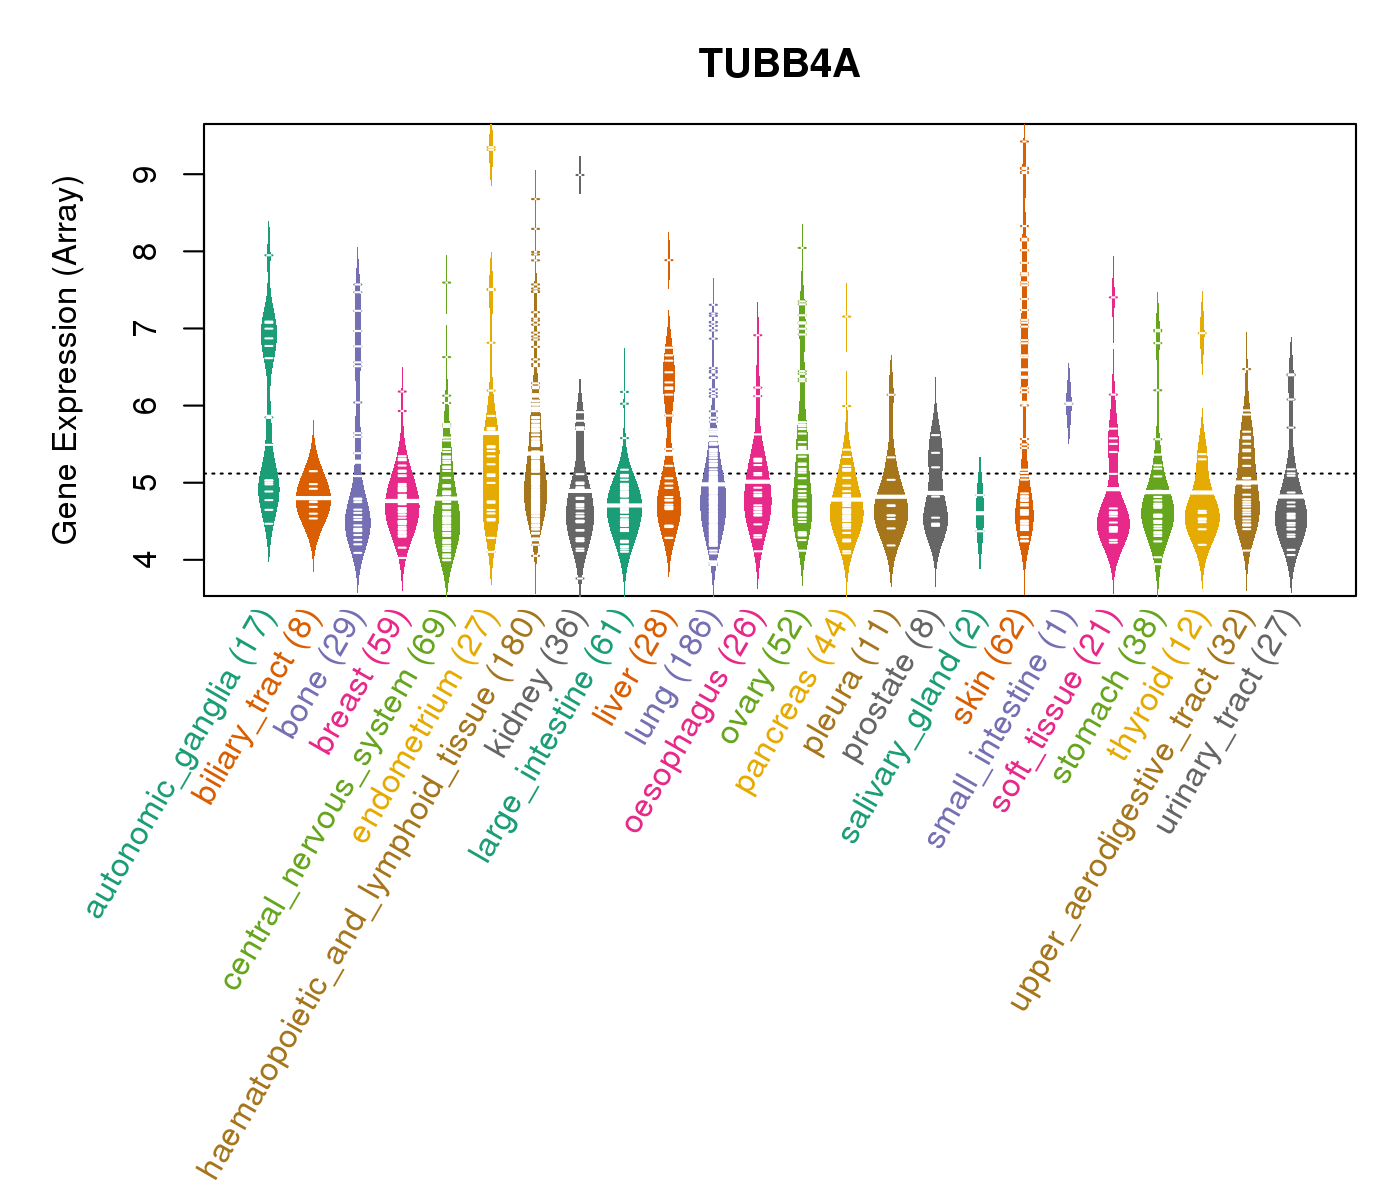
| Gene Expression for TUBB4A |
| * CCLE gene expression data were extracted from CCLE_Expression_Entrez_2012-10-18.res: Gene-centric RMA-normalized mRNA expression data. |
 |
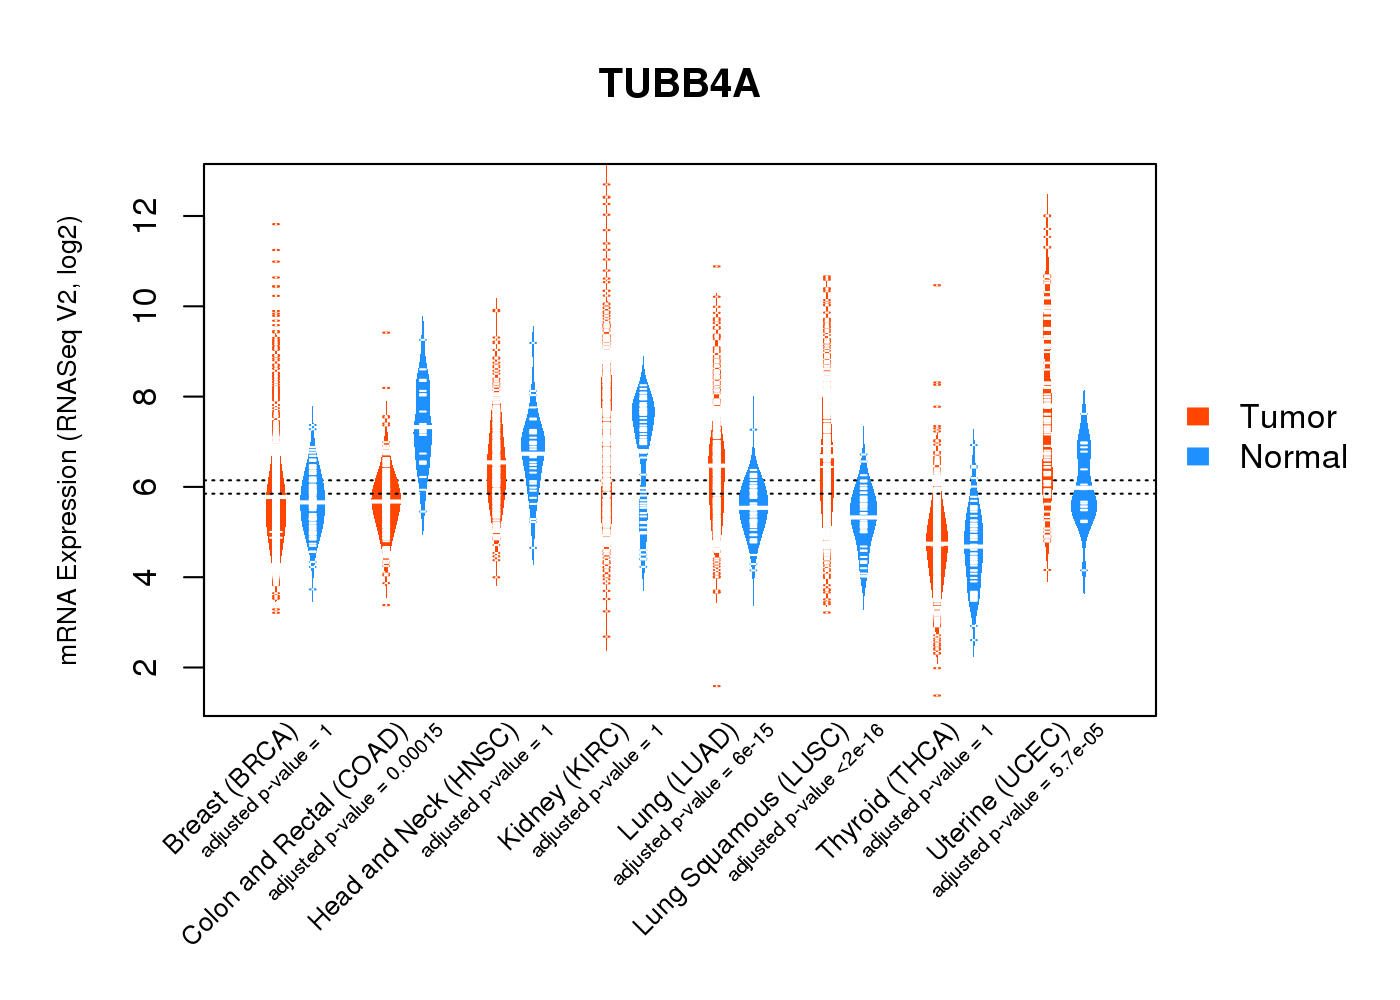
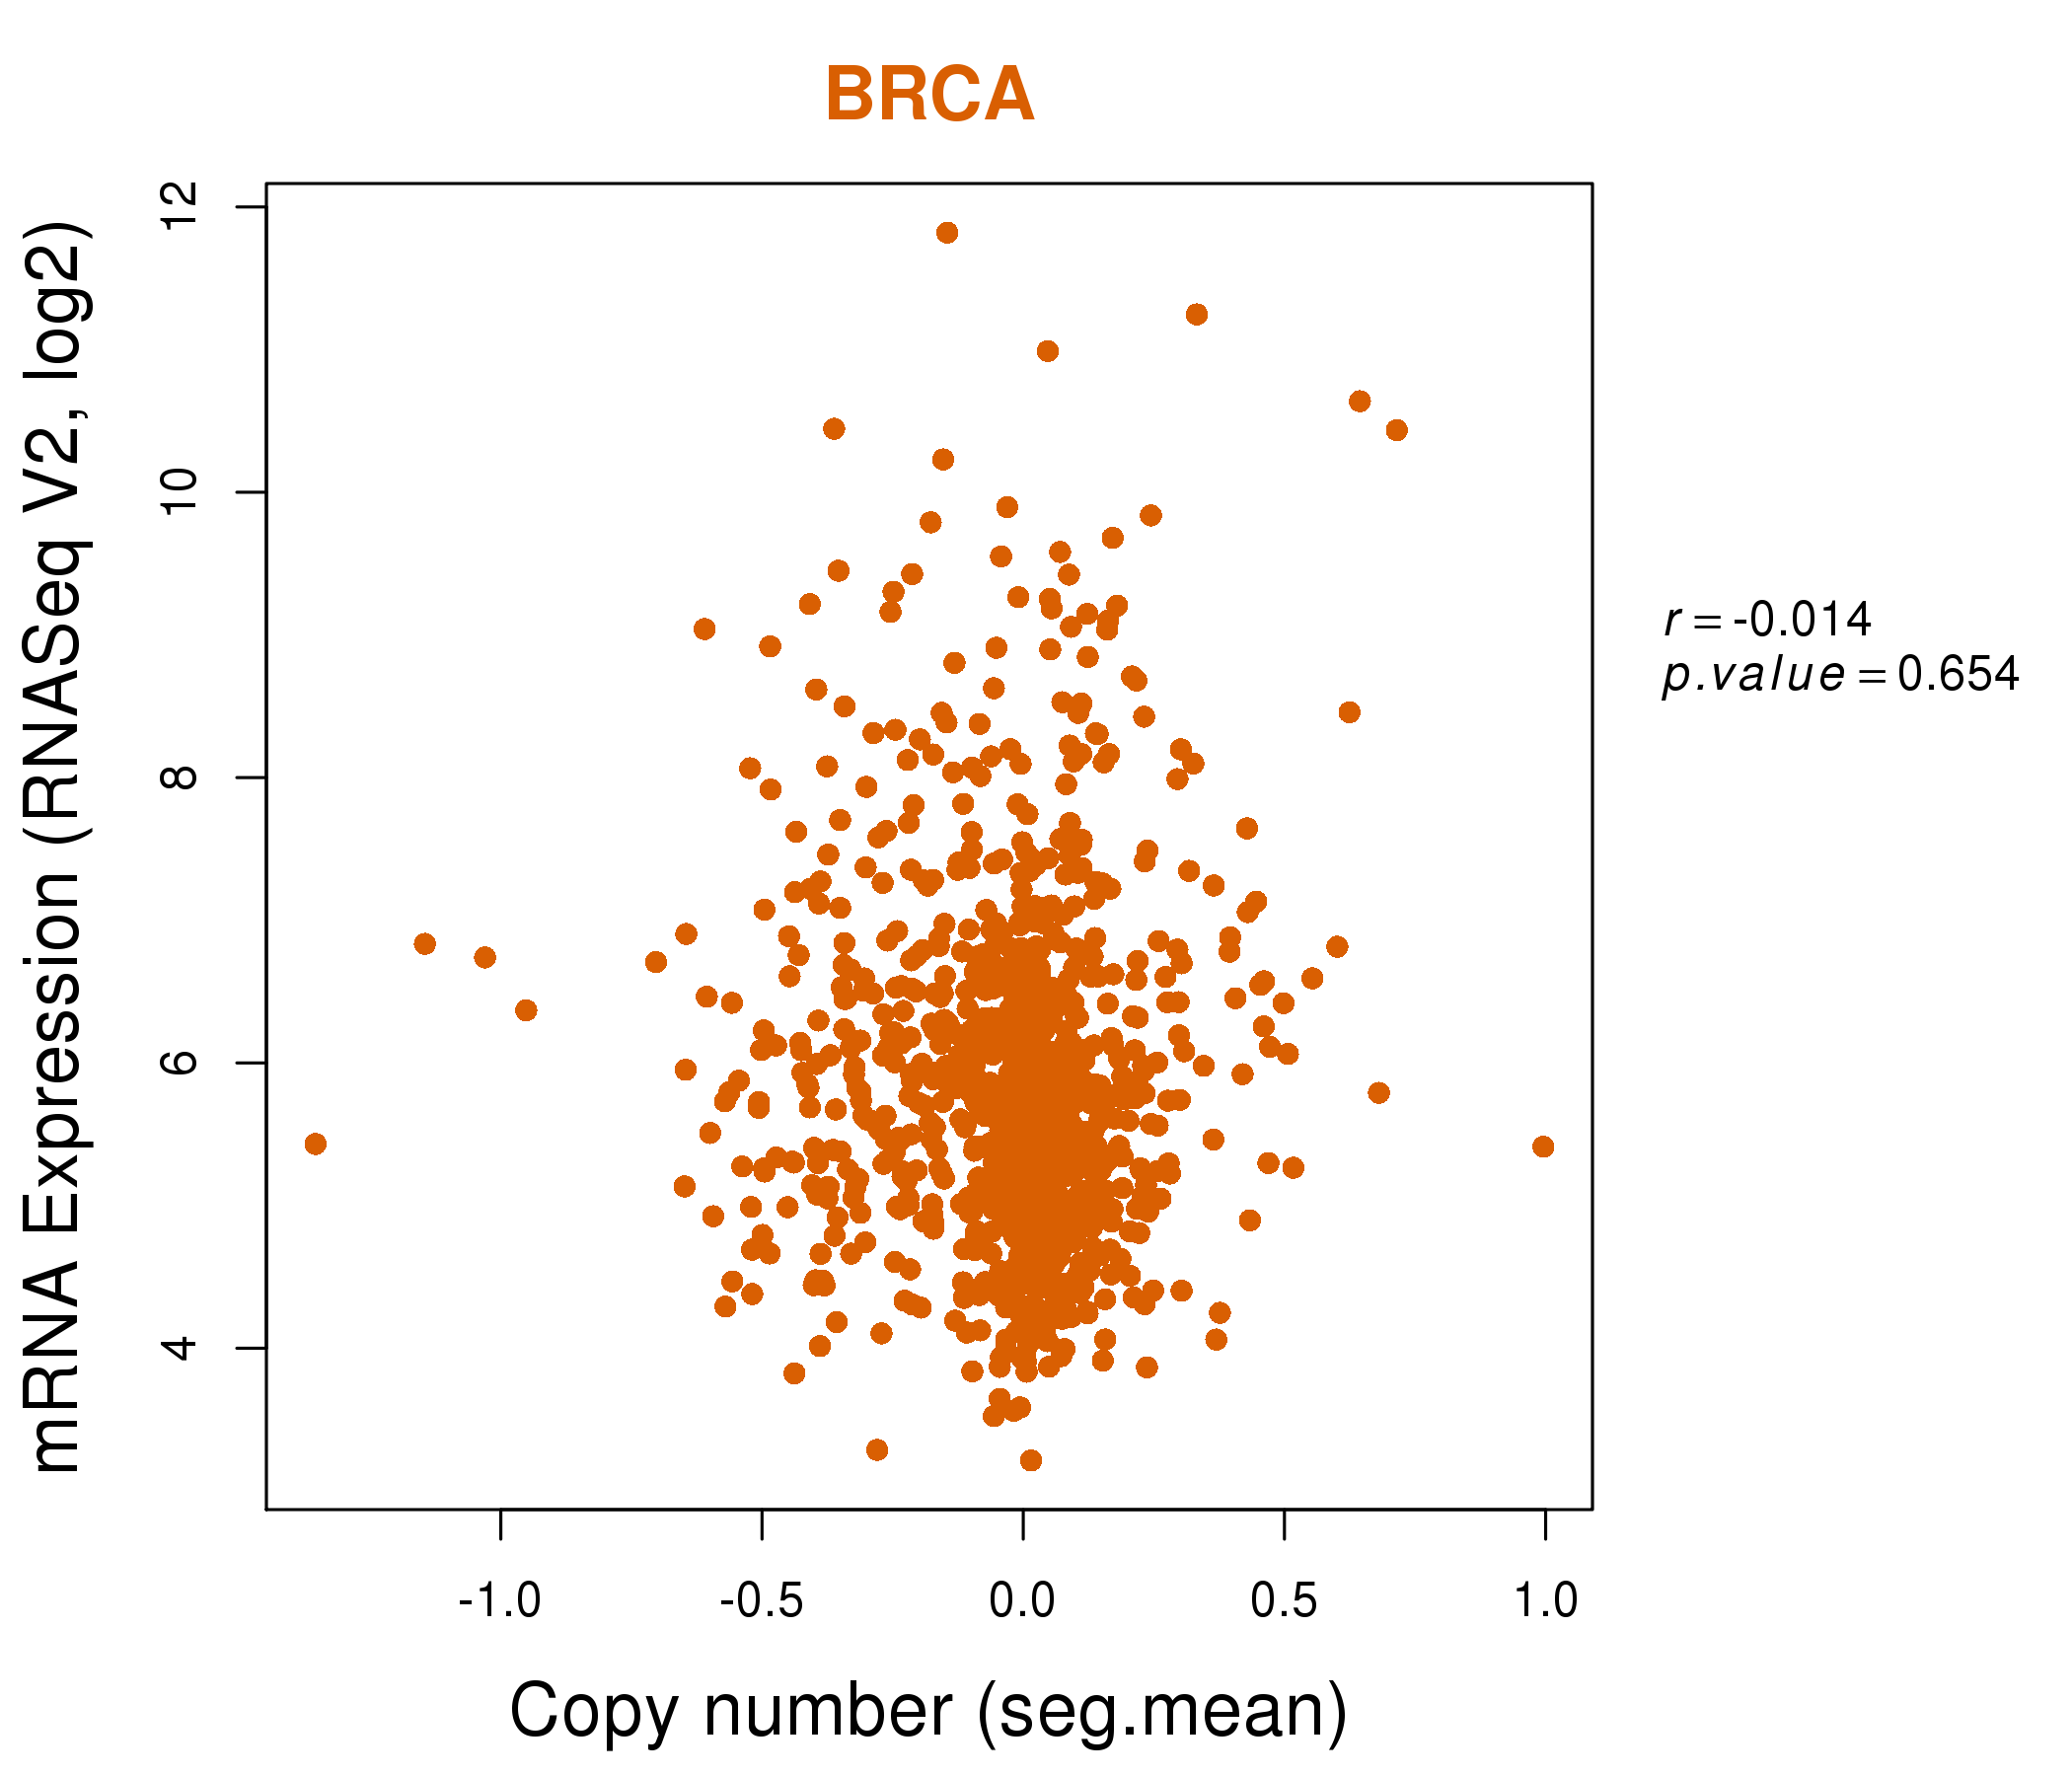
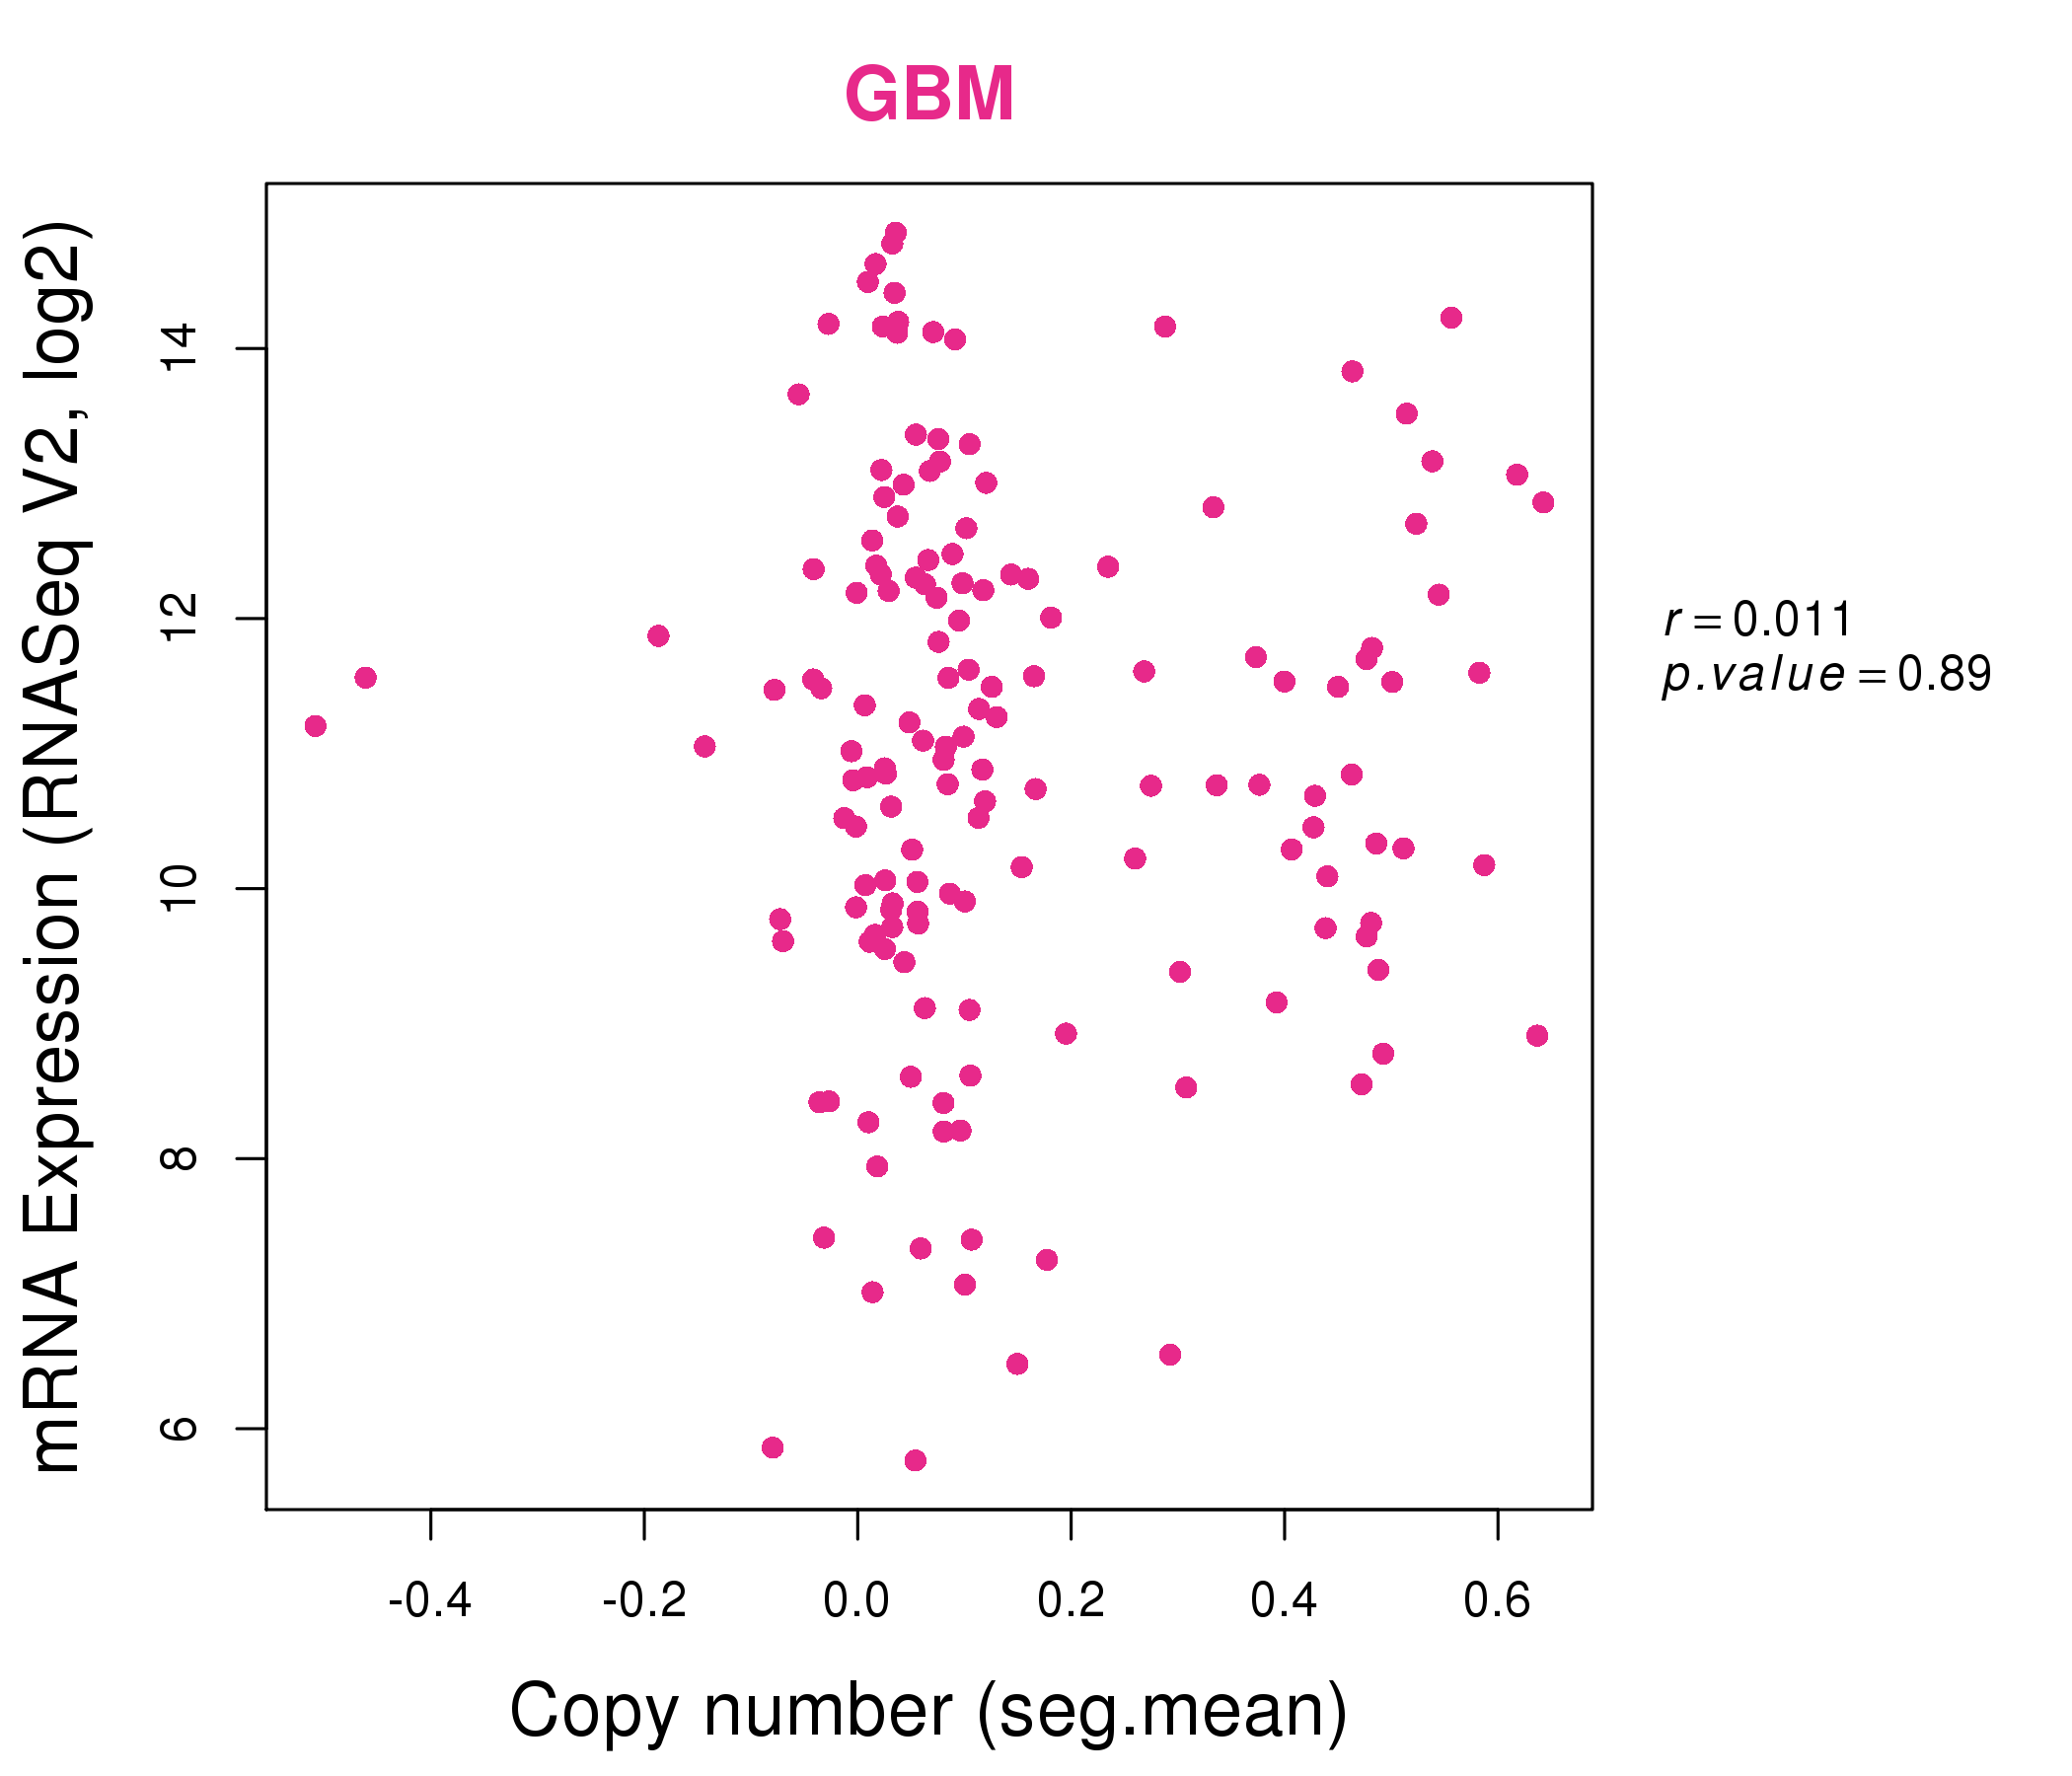
| * Normalized gene expression data of RNASeqV2 was extracted from TCGA using R package TCGA-Assembler. The URLs of all public data files on TCGA DCC data server were gathered at Jan-05-2015. Only eight cancer types have enough normal control samples for differential expression analysis. (t test, adjusted p<0.05 (using Benjamini-Hochberg FDR)) |
 |
| Top |
| * This plots show the correlation between CNV and gene expression. |
: Open all plots for all cancer types
 |
|
 |
|
| Top |
| Gene-Gene Network Information |
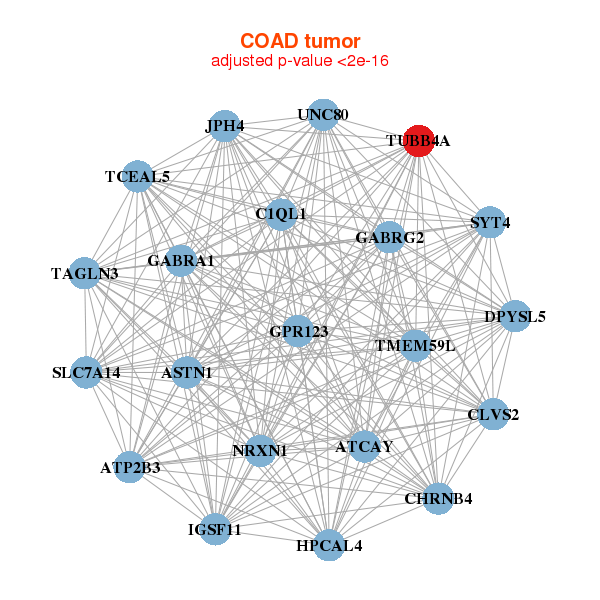
| * Co-Expression network figures were drawn using R package igraph. Only the top 20 genes with the highest correlations were shown. Red circle: input gene, orange circle: cell metabolism gene, sky circle: other gene |
: Open all plots for all cancer types
 |
| ||||
| AMHR2,AQP2,CYP11A1,CYP17A1,CYP19A1,FDX1,FSHR, HOXA11-AS,HPCAL4,INSL3,LHCGR,LOC286467,MBOAT4,QRICH2, SCARB1,STAR,TAC4,TMEM14E,TREML5P,TUBB4A,ZDHHC19 | ARHGDIA,C6orf226,CFL1,CRIP2,DRAP1,FAM58A,GIPC1, GUK1,JMJD8,PFN1,RABAC1,RHOC,RNH1,LAMTOR2, TBCB,TMSB10,TUBB2A,TUBB4B,TUBB4A,YIF1A,ZNHIT1 | ||||
 |
| ||||
| ASTN1,ATCAY,ATP2B3,C1QL1,CHRNB4,CLVS2,DPYSL5, GABRA1,GABRG2,GPR123,HPCAL4,IGSF11,JPH4,NRXN1, SLC7A14,SYT4,TAGLN3,TCEAL5,TMEM59L,TUBB4A,UNC80 | ATCAY,ATP1A3,CNTN2,CTNNA2,DNER,DPYSL5,EEF1A2, INA,KIF1A,NEFH,NEFL,NEFM,PHOX2B,SLC7A14, SNAP91,ST8SIA3,SYN1,TMEM130,TMEM59L,TUBB3,TUBB4A |
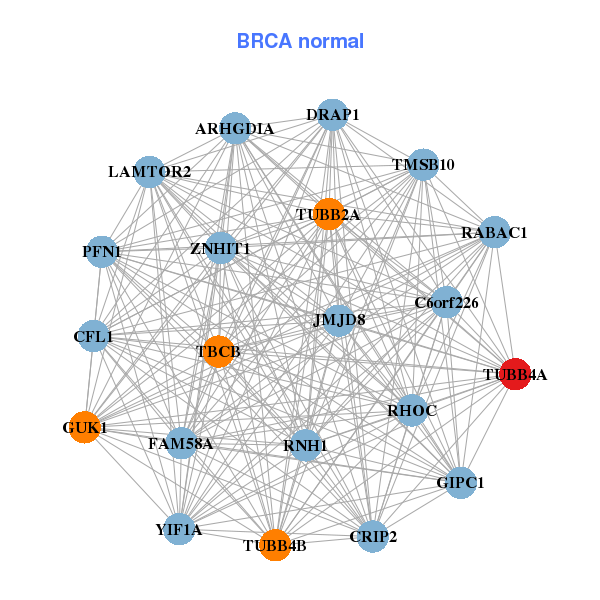
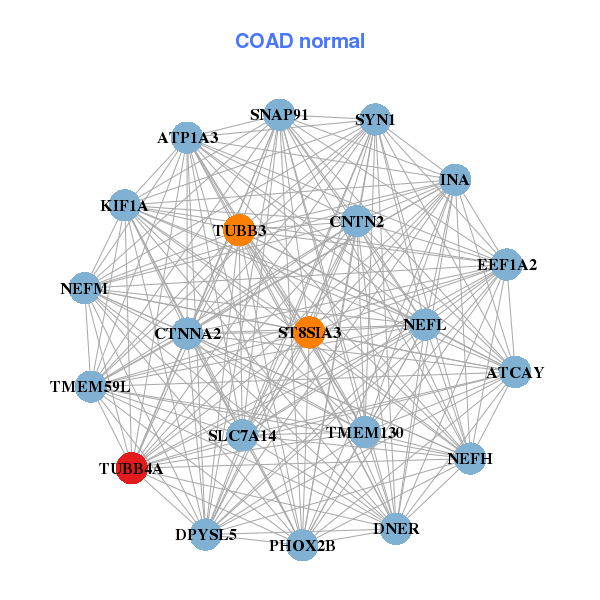
| * Co-Expression network figures were drawn using R package igraph. Only the top 20 genes with the highest correlations were shown. Red circle: input gene, orange circle: cell metabolism gene, sky circle: other gene |
: Open all plots for all cancer types
| Top |
: Open all interacting genes' information including KEGG pathway for all interacting genes from DAVID
| Top |
| Pharmacological Information for TUBB4A |
| DB Category | DB Name | DB's ID and Url link |
| * Gene Centered Interaction Network. |
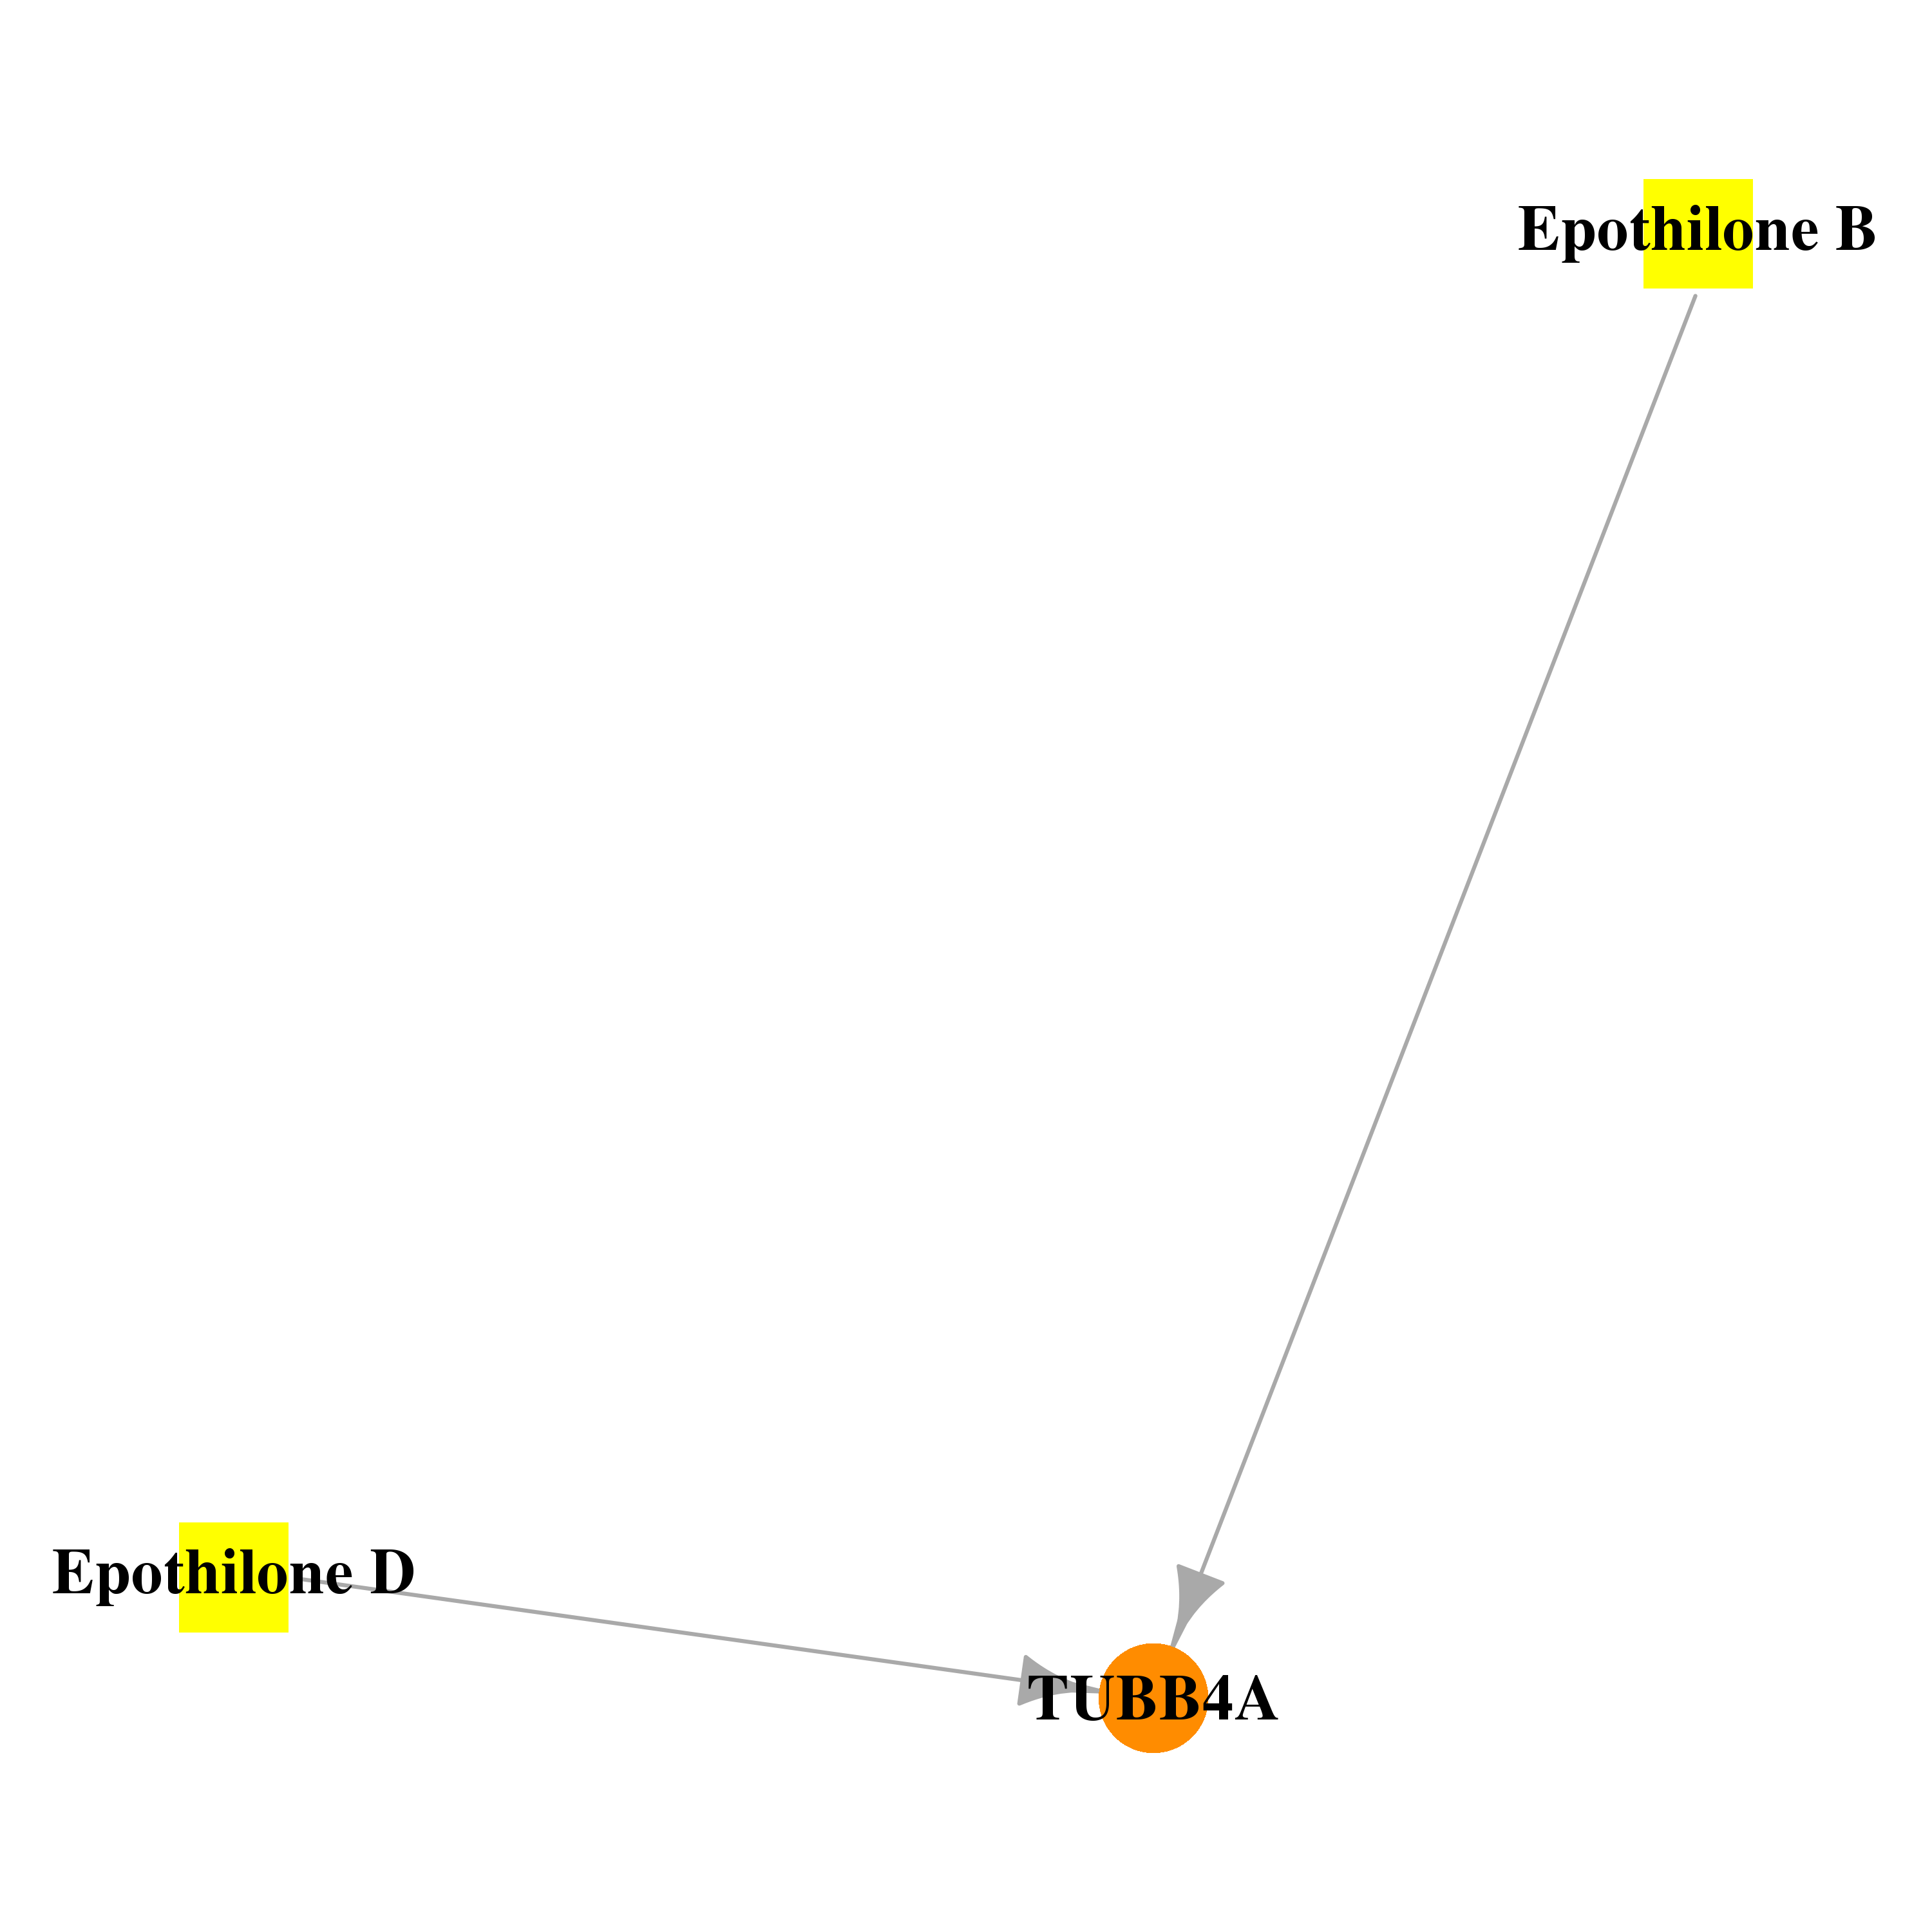 |
| * Drug Centered Interaction Network. |
| DrugBank ID | Target Name | Drug Groups | Generic Name | Drug Centered Network | Drug Structure |
| DB01873 | tubulin, beta 4A class IVa | experimental; investigational | Epothilone D |  | 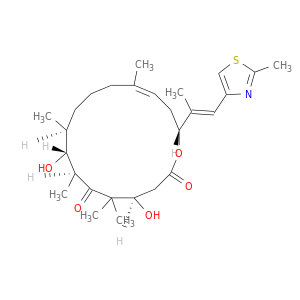 |
| DB03010 | tubulin, beta 4A class IVa | experimental; investigational | Epothilone B | 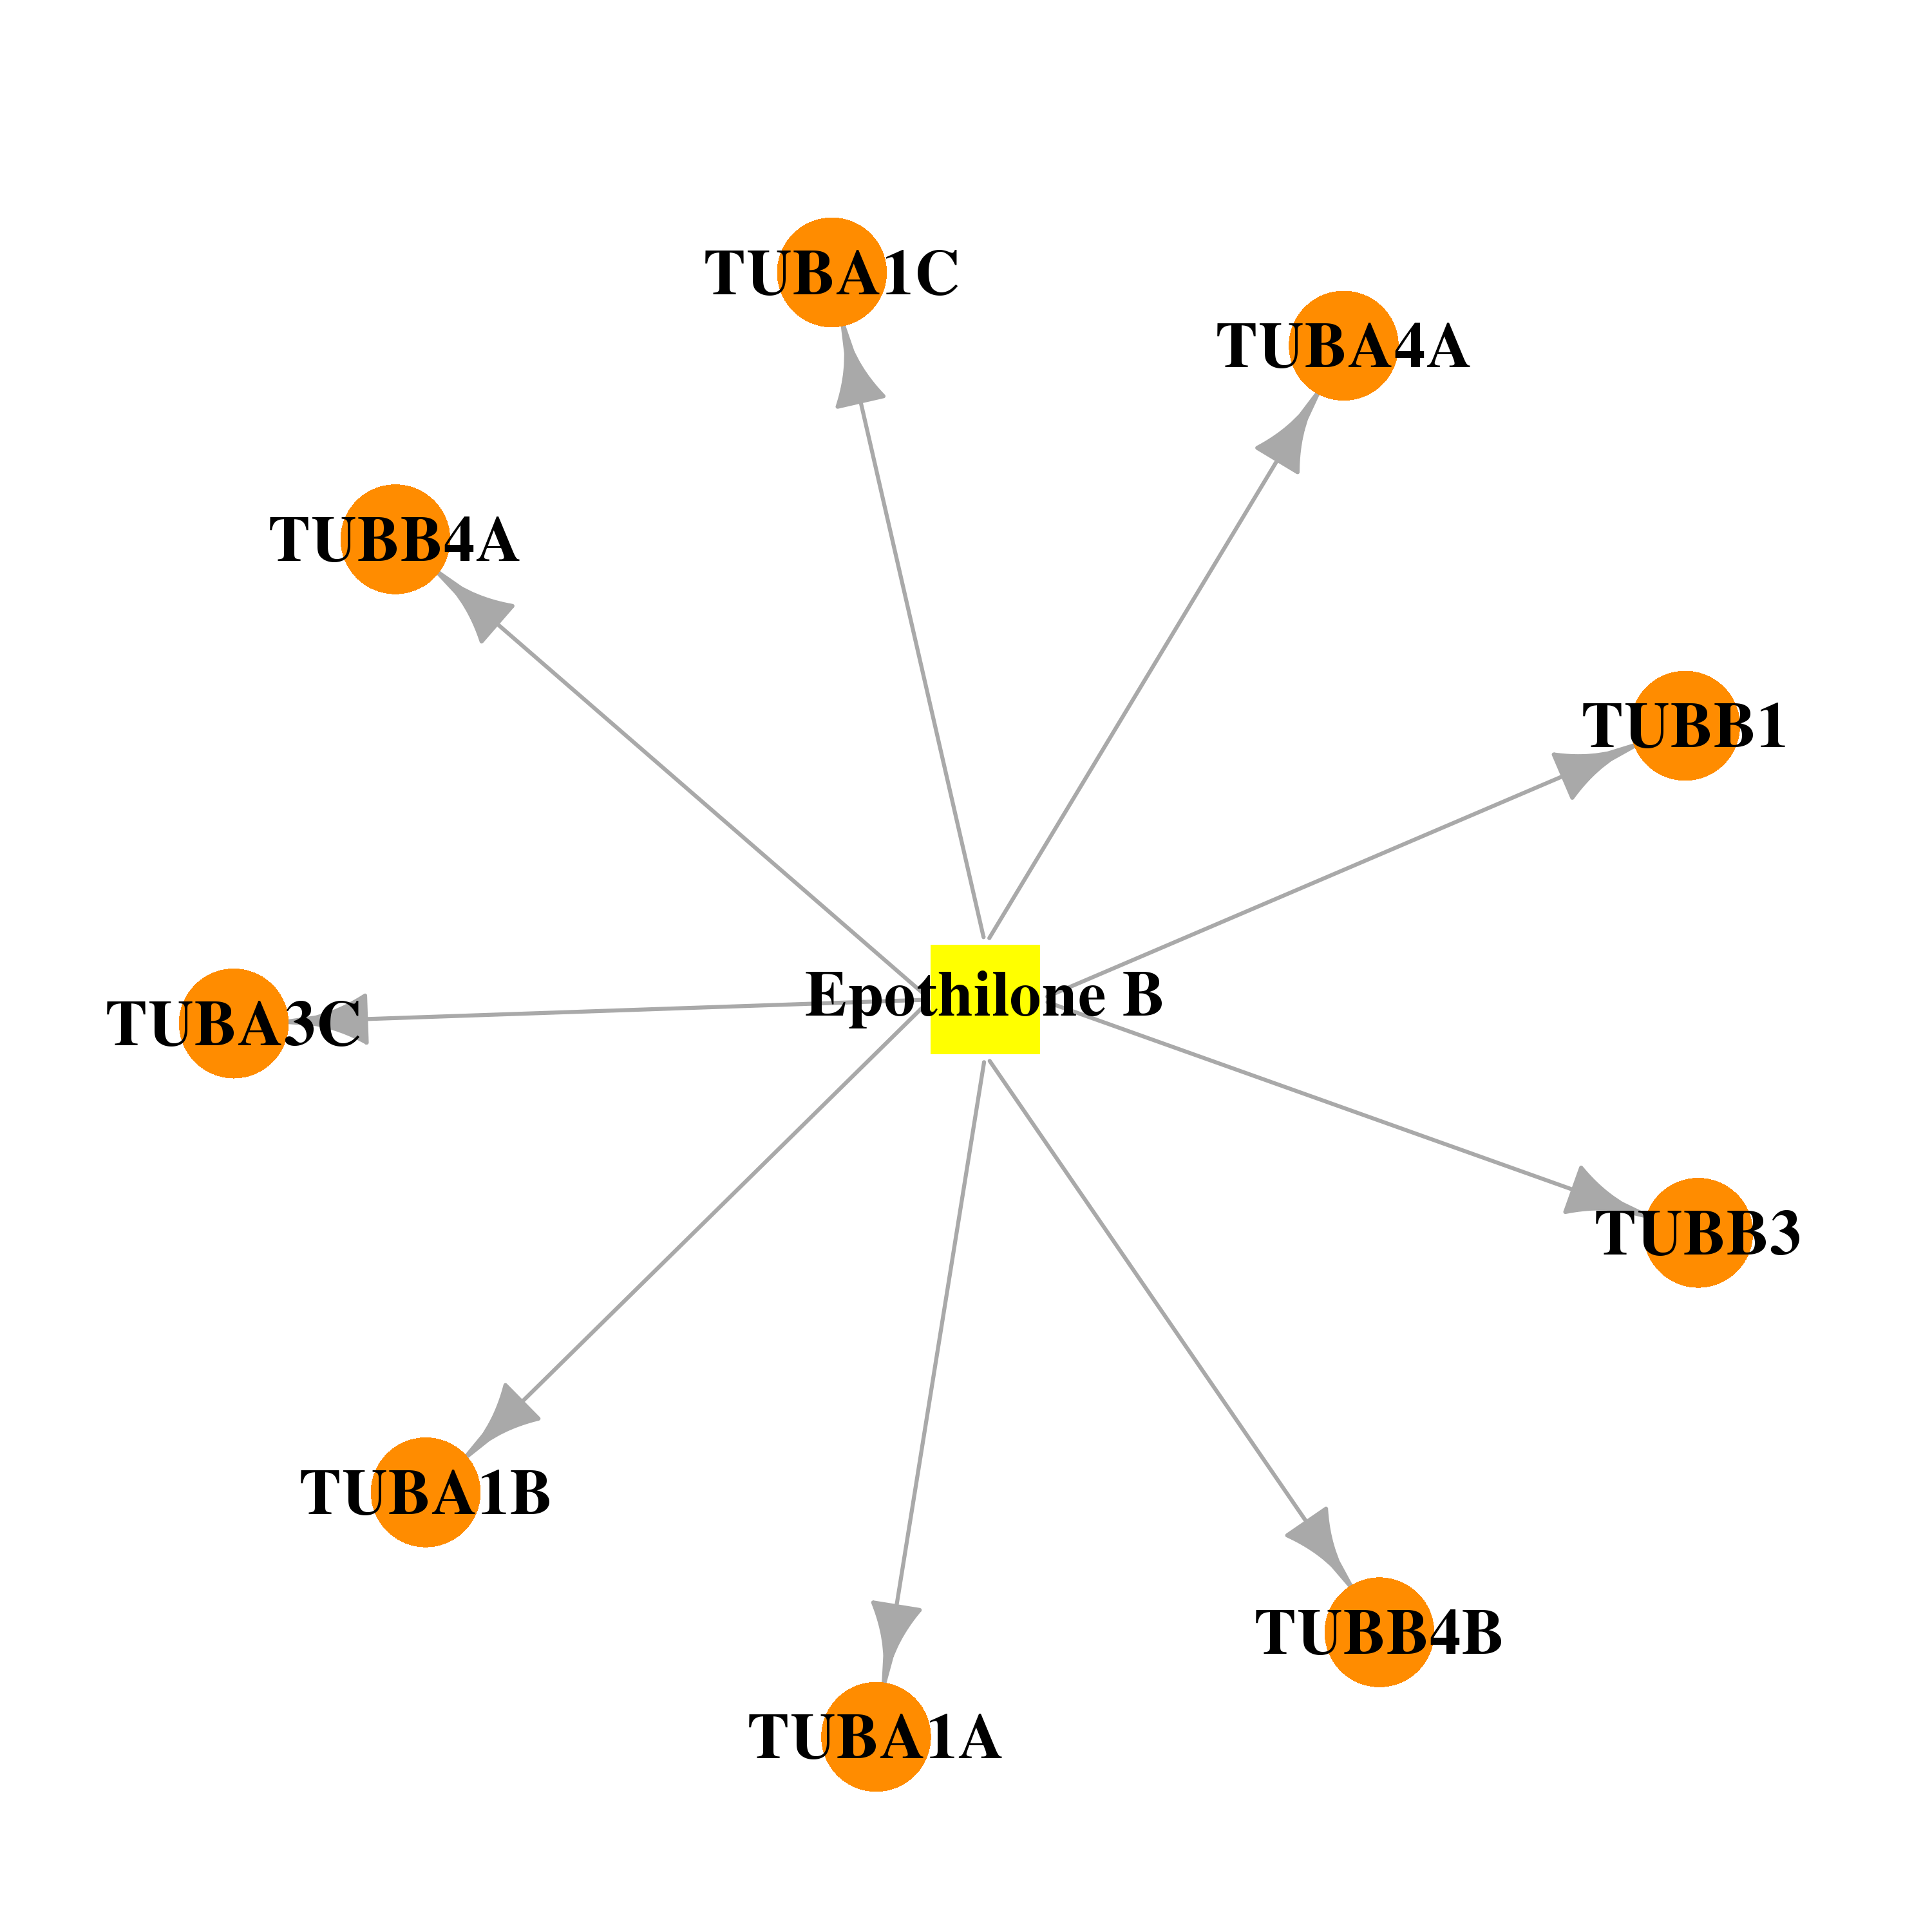 | 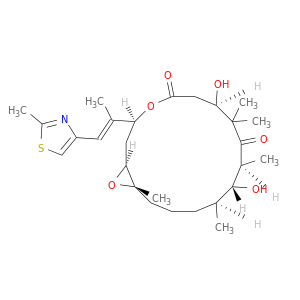 |
| Top |
| Cross referenced IDs for TUBB4A |
| * We obtained these cross-references from Uniprot database. It covers 150 different DBs, 18 categories. http://www.uniprot.org/help/cross_references_section |
: Open all cross reference information
|
Copyright © 2016-Present - The Univsersity of Texas Health Science Center at Houston @ |