|
||||||||||||||||||||
| |
| Phenotypic Information (metabolism pathway, cancer, disease, phenome) |
| |
| |
| Gene-Gene Network Information: Co-Expression Network, Interacting Genes & KEGG |
| |
|


| Gene Summary for TUBB4B |
| Top |
| Phenotypic Information for TUBB4B(metabolism pathway, cancer, disease, phenome) |
| Cancer | CGAP: TUBB4B |
| Familial Cancer Database: TUBB4B | |
| * This gene is included in those cancer gene databases. |
|
|
|
|
|
| . | ||||||||||||||
Oncogene 1 | Significant driver gene in | |||||||||||||||||||
| cf) number; DB name 1 Oncogene; http://nar.oxfordjournals.org/content/35/suppl_1/D721.long, 2 Tumor Suppressor gene; https://bioinfo.uth.edu/TSGene/, 3 Cancer Gene Census; http://www.nature.com/nrc/journal/v4/n3/abs/nrc1299.html, 4 CancerGenes; http://nar.oxfordjournals.org/content/35/suppl_1/D721.long, 5 Network of Cancer Gene; http://ncg.kcl.ac.uk/index.php, 1Therapeutic Vulnerabilities in Cancer; http://cbio.mskcc.org/cancergenomics/statius/ |
| REACTOME_METABOLISM_OF_PROTEINS | |
| OMIM | |
| Orphanet | |
| Disease | KEGG Disease: TUBB4B |
| MedGen: TUBB4B (Human Medical Genetics with Condition) | |
| ClinVar: TUBB4B | |
| Phenotype | MGI: TUBB4B (International Mouse Phenotyping Consortium) |
| PhenomicDB: TUBB4B | |
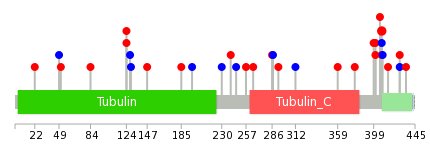
| Mutations for TUBB4B |
| * Under tables are showing count per each tissue to give us broad intuition about tissue specific mutation patterns.You can go to the detailed page for each mutation database's web site. |
| There's no structural variation information in COSMIC data for this gene. |
| * From mRNA Sanger sequences, Chitars2.0 arranged chimeric transcripts. This table shows TUBB4B related fusion information. |
| ID | Head Gene | Tail Gene | Accession | Gene_a | qStart_a | qEnd_a | Chromosome_a | tStart_a | tEnd_a | Gene_a | qStart_a | qEnd_a | Chromosome_a | tStart_a | tEnd_a |
| DA594703 | TUBB4B | 1 | 465 | 9 | 140135739 | 140137061 | ITPRIP | 465 | 565 | 10 | 106073634 | 106073733 | |
| AK310334 | CDH5 | 1 | 1159 | 16 | 66410293 | 66424453 | TUBB4B | 1155 | 2052 | 9 | 140137262 | 140138159 | |
| DB150819 | TUBB4B | 1 | 402 | 9 | 140135739 | 140136997 | A2M | 398 | 584 | 12 | 9246089 | 9247668 | |
| BE903667 | CTTNBP2NL | 60 | 398 | 1 | 112959928 | 112960268 | TUBB4B | 399 | 812 | 9 | 140135754 | 140137031 | |
| BQ361837 | TUBB4B | 17 | 82 | 9 | 140137027 | 140137092 | TUBB4B | 81 | 308 | 9 | 140137109 | 140137333 | |
| BC071888 | CTTNBP2NL | 25 | 365 | 1 | 112959928 | 112960268 | TUBB4B | 366 | 1913 | 9 | 140135754 | 140138159 | |
| BQ319576 | TUBB4B | 10 | 90 | 9 | 140138079 | 140138159 | PGAP2 | 91 | 600 | 11 | 3847053 | 3847574 | |
| BE902916 | CTTNBP2NL | 6 | 344 | 1 | 112959928 | 112960268 | TUBB4B | 345 | 773 | 9 | 140135754 | 140137057 | |
| Top |
| There's no copy number variation information in COSMIC data for this gene. |
| Top |
|
 |
| Top |
| Stat. for Non-Synonymous SNVs (# total SNVs=0) | (# total SNVs=0) |
(# total SNVs=0) | (# total SNVs=0) |
| Top |
| * When you move the cursor on each content, you can see more deailed mutation information on the Tooltip. Those are primary_site,primary_histology,mutation(aa),pubmedID. |
| GRCh37 position | Mutation(aa) | Unique sampleID count |
| Top |
|
 |
| Point Mutation/ Tissue ID | 1 | 2 | 3 | 4 | 5 | 6 | 7 | 8 | 9 | 10 | 11 | 12 | 13 | 14 | 15 | 16 | 17 | 18 | 19 | 20 |
| # sample | 1 | 3 | 8 | 1 | 3 | 2 | 1 | 4 | 1 | 2 | 1 | 2 | ||||||||
| # mutation | 1 | 3 | 7 | 1 | 3 | 2 | 1 | 5 | 1 | 2 | 1 | 2 | ||||||||
| nonsynonymous SNV | 1 | 3 | 4 | 1 | 1 | 4 | 1 | 2 | 1 | 2 | ||||||||||
| synonymous SNV | 3 | 1 | 2 | 2 | 1 |
| cf) Tissue ID; Tissue type (1; BLCA[Bladder Urothelial Carcinoma], 2; BRCA[Breast invasive carcinoma], 3; CESC[Cervical squamous cell carcinoma and endocervical adenocarcinoma], 4; COAD[Colon adenocarcinoma], 5; GBM[Glioblastoma multiforme], 6; Glioma Low Grade, 7; HNSC[Head and Neck squamous cell carcinoma], 8; KICH[Kidney Chromophobe], 9; KIRC[Kidney renal clear cell carcinoma], 10; KIRP[Kidney renal papillary cell carcinoma], 11; LAML[Acute Myeloid Leukemia], 12; LUAD[Lung adenocarcinoma], 13; LUSC[Lung squamous cell carcinoma], 14; OV[Ovarian serous cystadenocarcinoma ], 15; PAAD[Pancreatic adenocarcinoma], 16; PRAD[Prostate adenocarcinoma], 17; SKCM[Skin Cutaneous Melanoma], 18:STAD[Stomach adenocarcinoma], 19:THCA[Thyroid carcinoma], 20:UCEC[Uterine Corpus Endometrial Carcinoma]) |
| Top |
| * We represented just top 10 SNVs. When you move the cursor on each content, you can see more deailed mutation information on the Tooltip. Those are primary_site, primary_histology, mutation(aa), pubmedID. |
| Genomic Position | Mutation(aa) | Unique sampleID count |
| chr9:140137892 | p.F408L | 3 |
| chr9:140137041 | p.A124V | 2 |
| chr9:140137531 | p.D197D | 1 |
| chr9:140137897 | p.S230S | 1 |
| chr9:140137057 | p.F408F | 1 |
| chr9:140137547 | p.L240P | 1 |
| chr9:140137915 | p.T409T | 1 |
| chr9:140137109 | p.L246L | 1 |
| chr9:140137606 | p.M415I | 1 |
| chr9:140137952 | p.M257I | 1 |
| * Copy number data were extracted from TCGA using R package TCGA-Assembler. The URLs of all public data files on TCGA DCC data server were gathered on Jan-05-2015. Function ProcessCNAData in TCGA-Assembler package was used to obtain gene-level copy number value which is calculated as the average copy number of the genomic region of a gene. |
 |
| cf) Tissue ID[Tissue type]: BLCA[Bladder Urothelial Carcinoma], BRCA[Breast invasive carcinoma], CESC[Cervical squamous cell carcinoma and endocervical adenocarcinoma], COAD[Colon adenocarcinoma], GBM[Glioblastoma multiforme], Glioma Low Grade, HNSC[Head and Neck squamous cell carcinoma], KICH[Kidney Chromophobe], KIRC[Kidney renal clear cell carcinoma], KIRP[Kidney renal papillary cell carcinoma], LAML[Acute Myeloid Leukemia], LUAD[Lung adenocarcinoma], LUSC[Lung squamous cell carcinoma], OV[Ovarian serous cystadenocarcinoma ], PAAD[Pancreatic adenocarcinoma], PRAD[Prostate adenocarcinoma], SKCM[Skin Cutaneous Melanoma], STAD[Stomach adenocarcinoma], THCA[Thyroid carcinoma], UCEC[Uterine Corpus Endometrial Carcinoma] |
| Top |
| Gene Expression for TUBB4B |
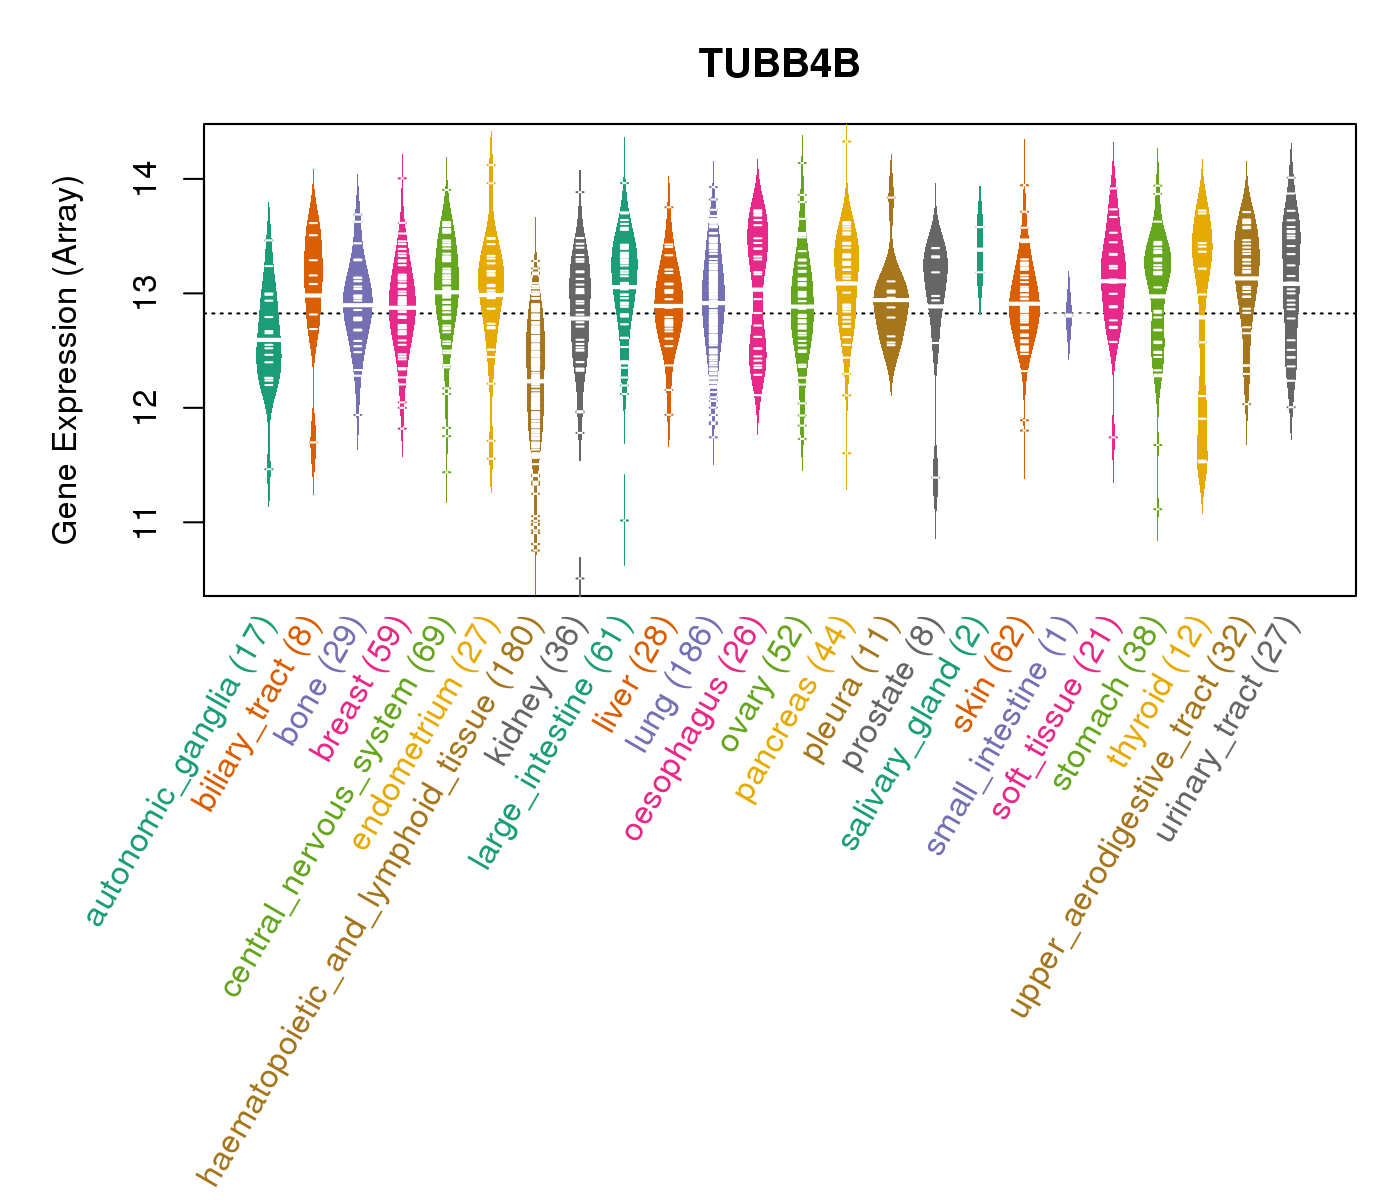
| * CCLE gene expression data were extracted from CCLE_Expression_Entrez_2012-10-18.res: Gene-centric RMA-normalized mRNA expression data. |
 |
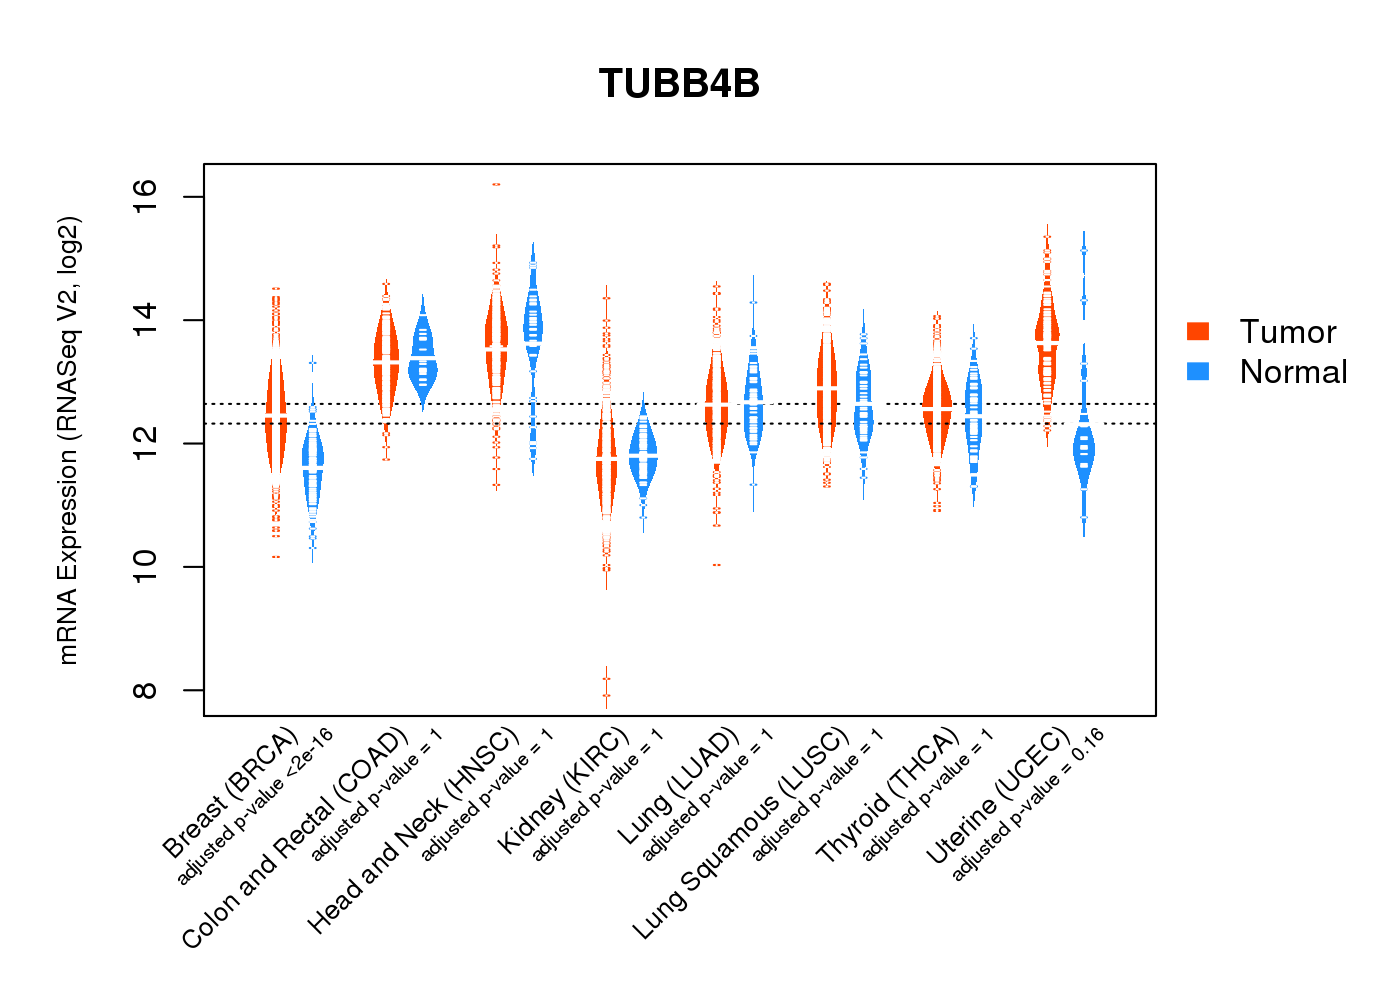
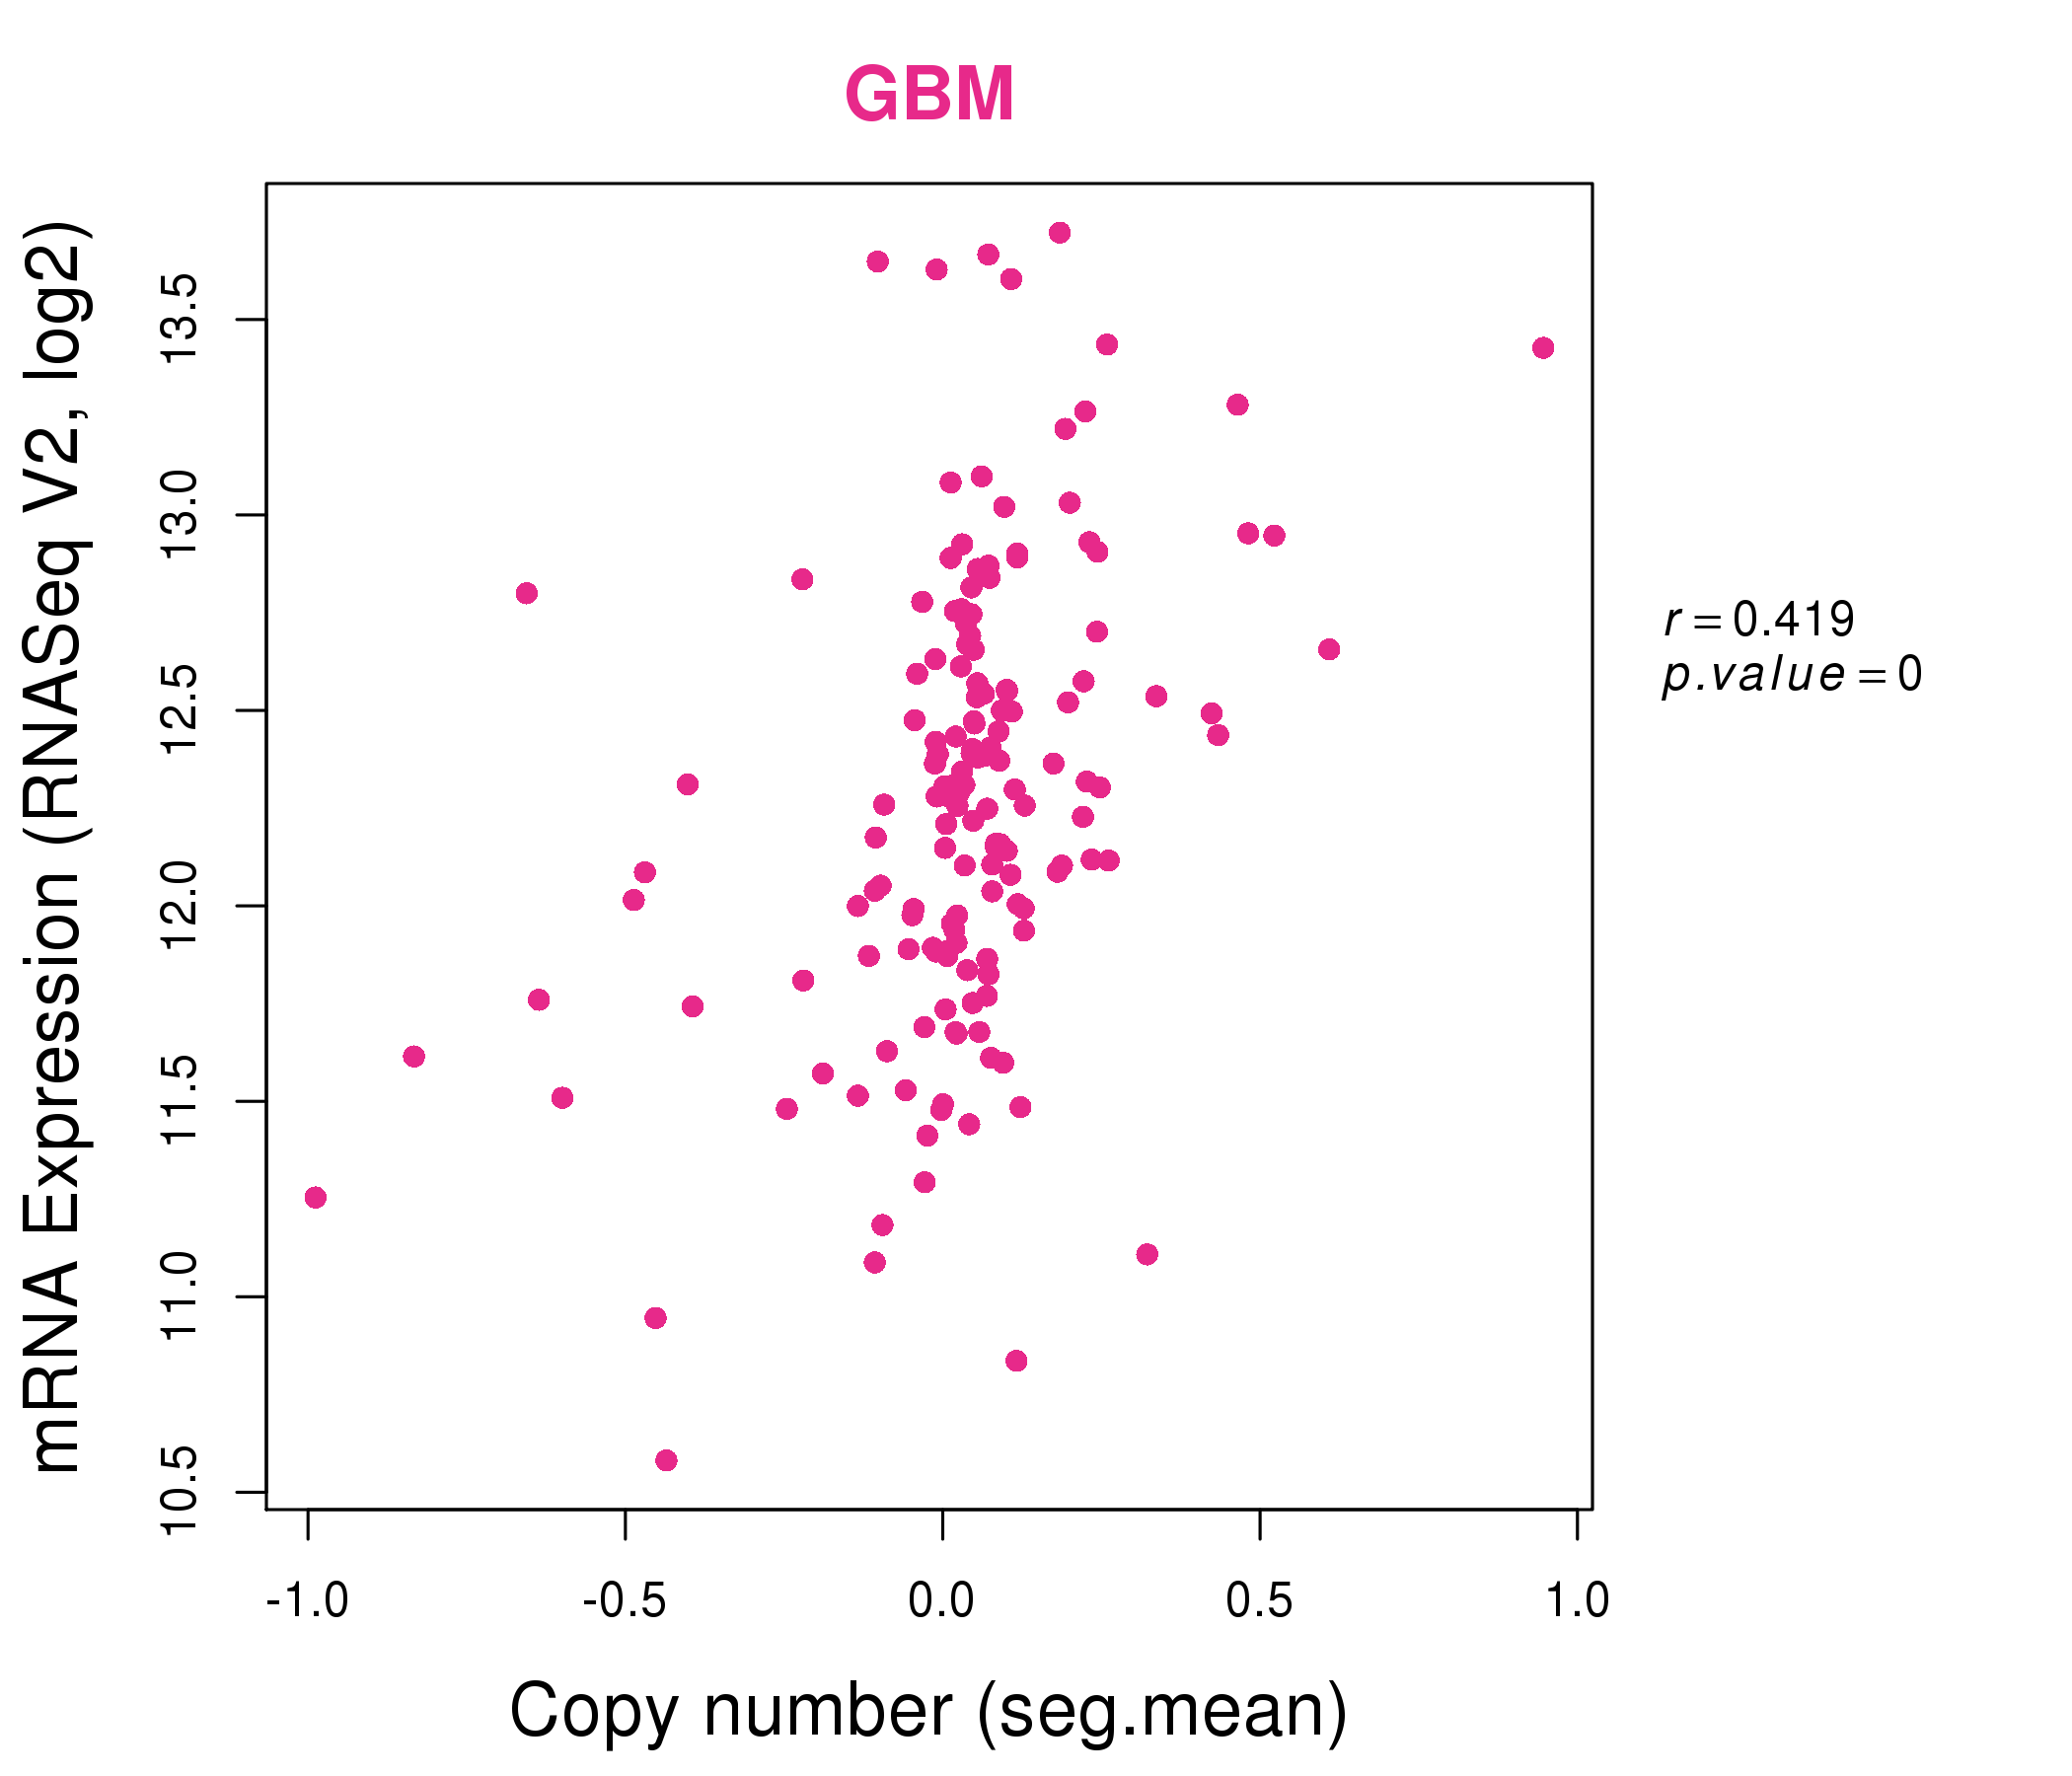
| * Normalized gene expression data of RNASeqV2 was extracted from TCGA using R package TCGA-Assembler. The URLs of all public data files on TCGA DCC data server were gathered at Jan-05-2015. Only eight cancer types have enough normal control samples for differential expression analysis. (t test, adjusted p<0.05 (using Benjamini-Hochberg FDR)) |
 |
| Top |
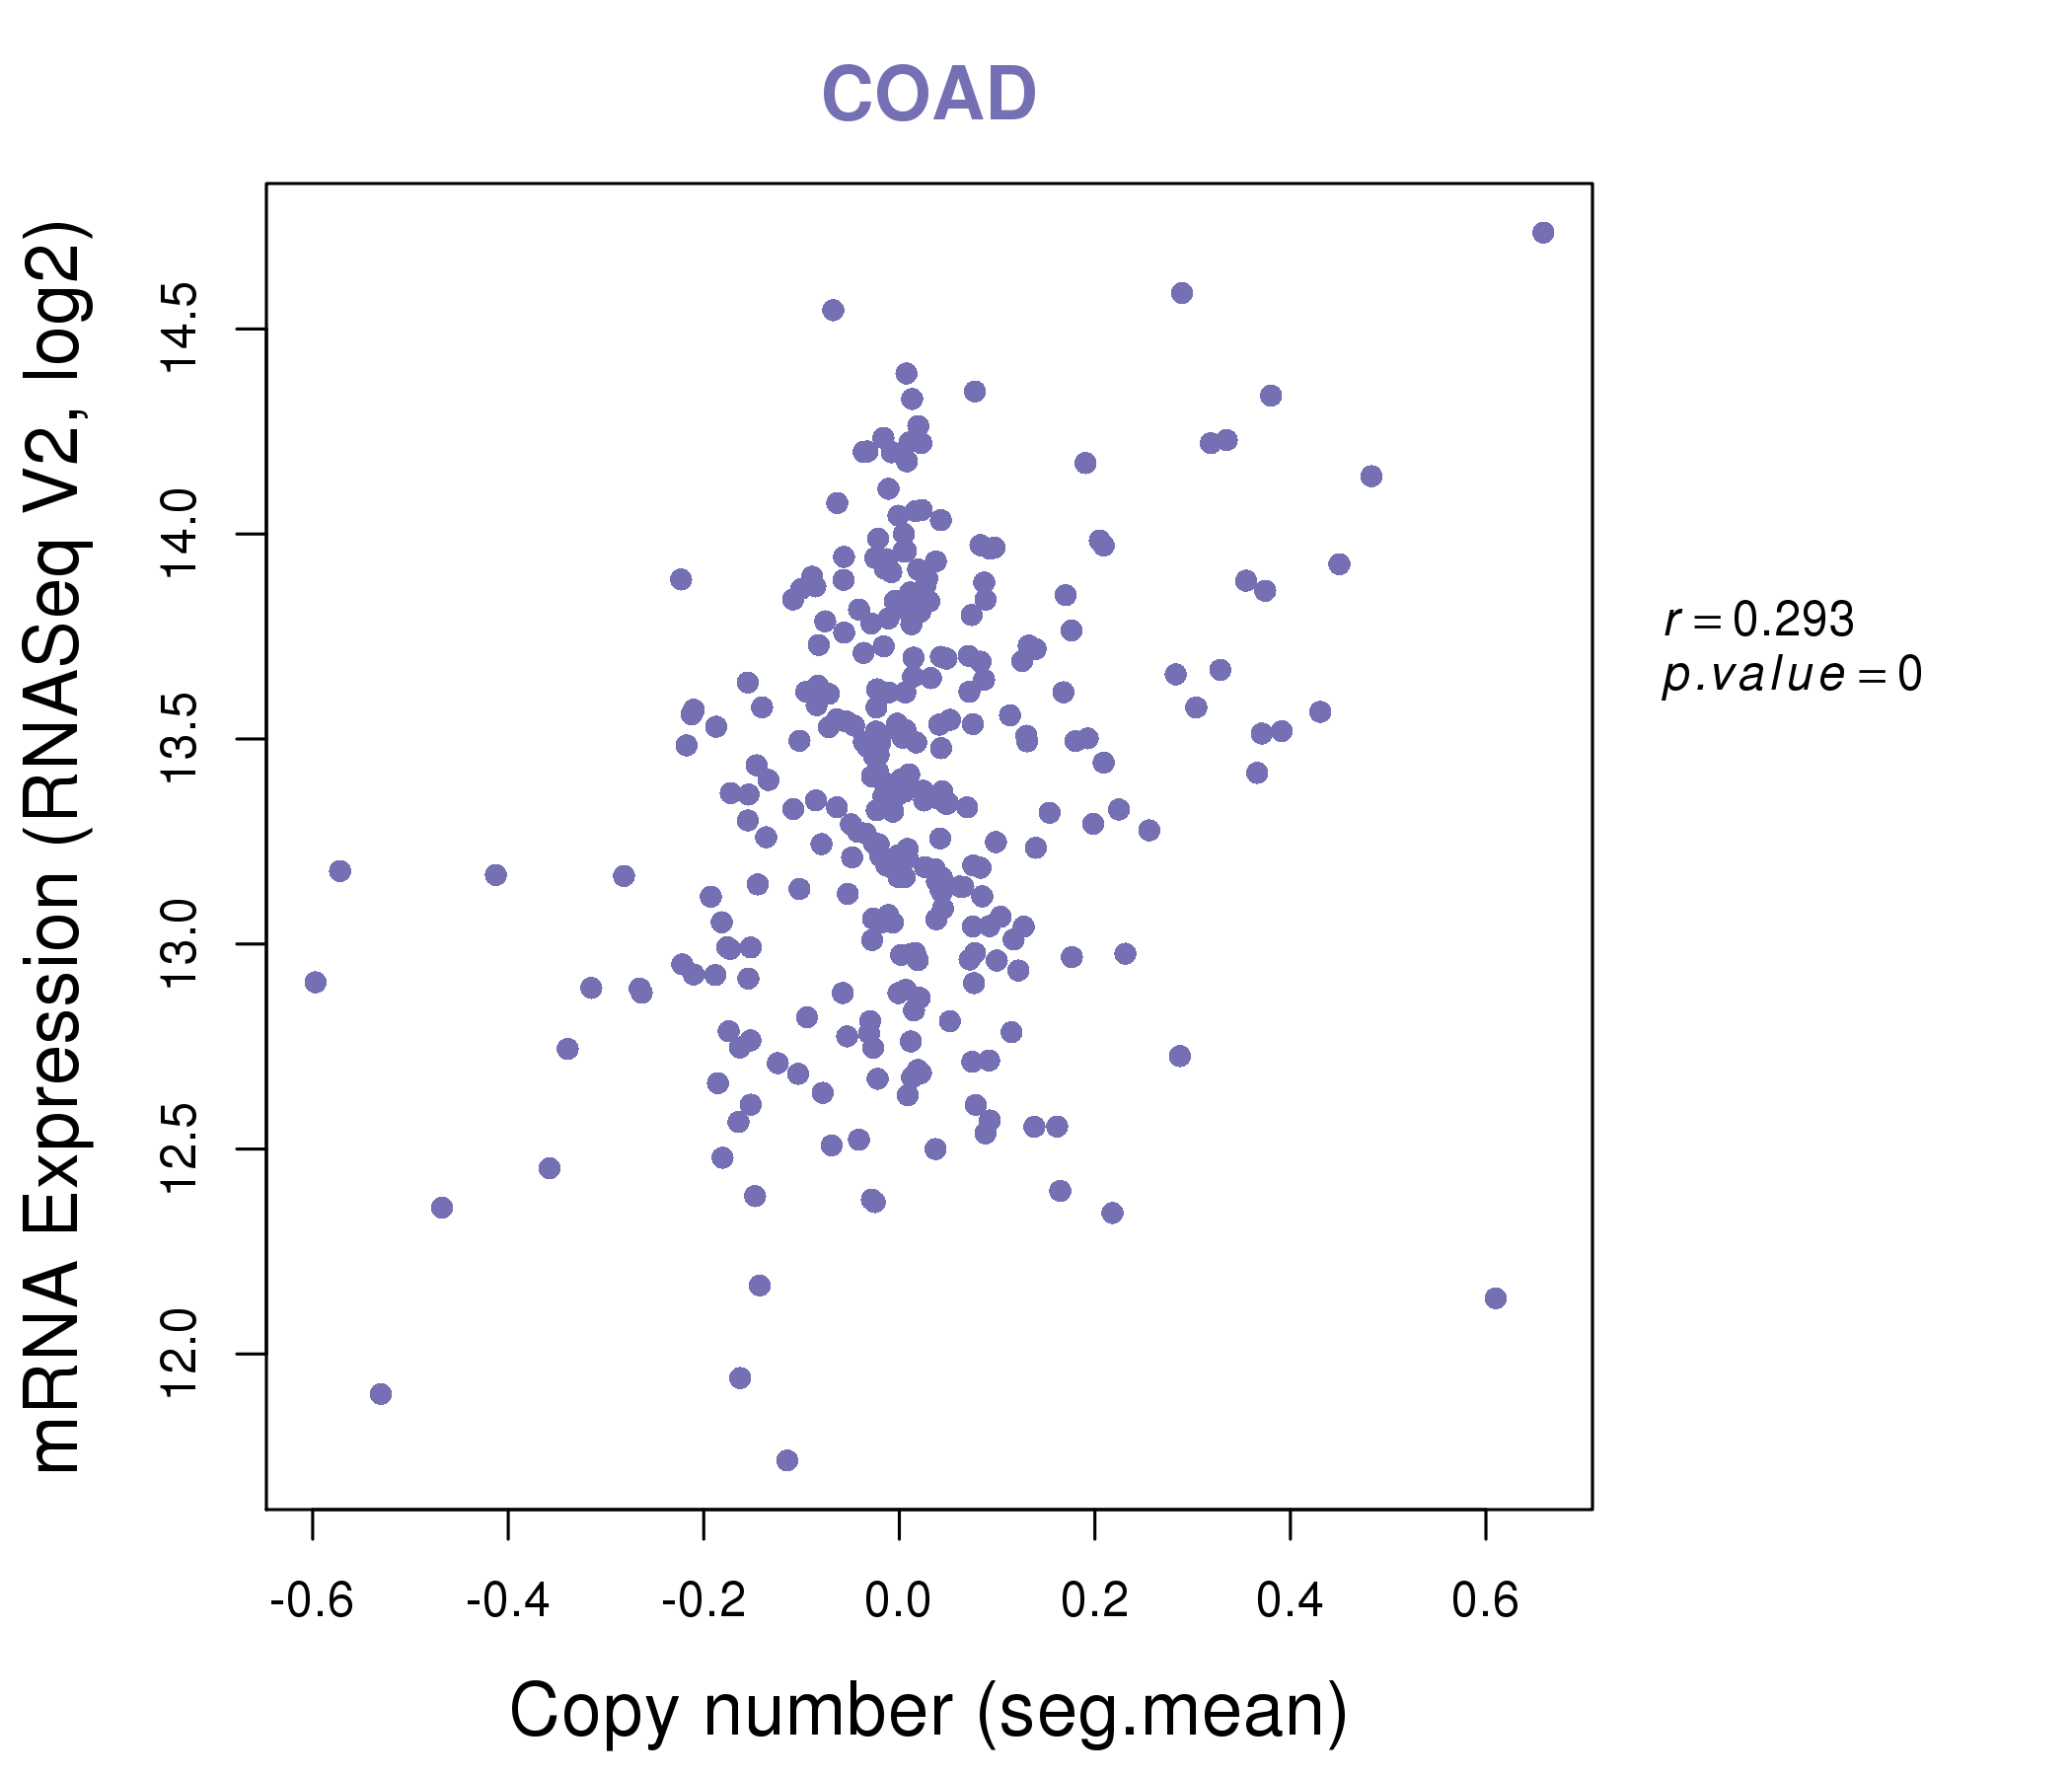
| * This plots show the correlation between CNV and gene expression. |
: Open all plots for all cancer types
 |
|
 |
|

| Top |
| Gene-Gene Network Information |
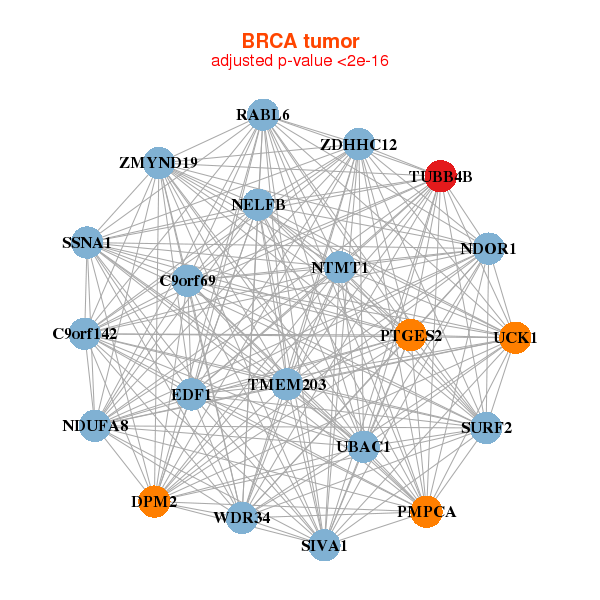
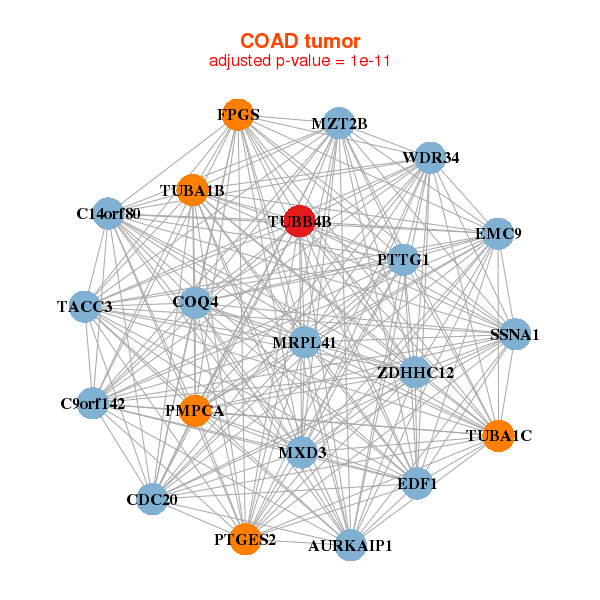
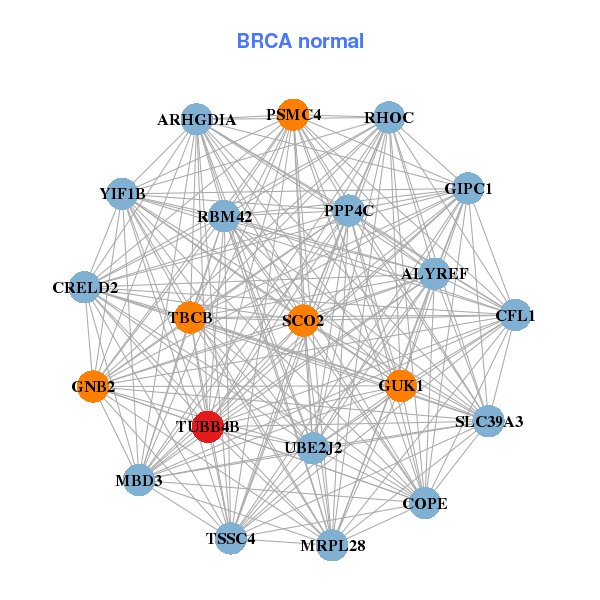
| * Co-Expression network figures were drawn using R package igraph. Only the top 20 genes with the highest correlations were shown. Red circle: input gene, orange circle: cell metabolism gene, sky circle: other gene |
: Open all plots for all cancer types
 |
| ||||
| C9orf142,C9orf69,RABL6,NELFB,DPM2,EDF1,NTMT1, NDOR1,NDUFA8,PMPCA,PTGES2,SIVA1,SSNA1,SURF2, TMEM203,TUBB4B,UBAC1,UCK1,WDR34,ZDHHC12,ZMYND19 | ARHGDIA,CFL1,COPE,CRELD2,GIPC1,GNB2,GUK1, MBD3,MRPL28,PPP4C,PSMC4,RBM42,RHOC,SCO2, SLC39A3,TBCB,ALYREF,TSSC4,TUBB4B,UBE2J2,YIF1B | ||||
 |
| ||||
| AURKAIP1,C14orf80,C9orf142,CDC20,COQ4,EDF1,MZT2B, EMC9,FPGS,MRPL41,MXD3,PMPCA,PTGES2,PTTG1, SSNA1,TACC3,TUBA1B,TUBA1C,TUBB4B,WDR34,ZDHHC12 | ACTG1,ARHGDIA,ATP2A2,B3GNT3,BAIAP2L1,BCL10,DPP9, IPPK,KCTD5,NPLOC4,PHLDA2,PLAUR,PSME3,RAB35, RDH13,RPS6KA4,SFN,TRIM15,TUBA1C,TUBB4B,YWHAB |
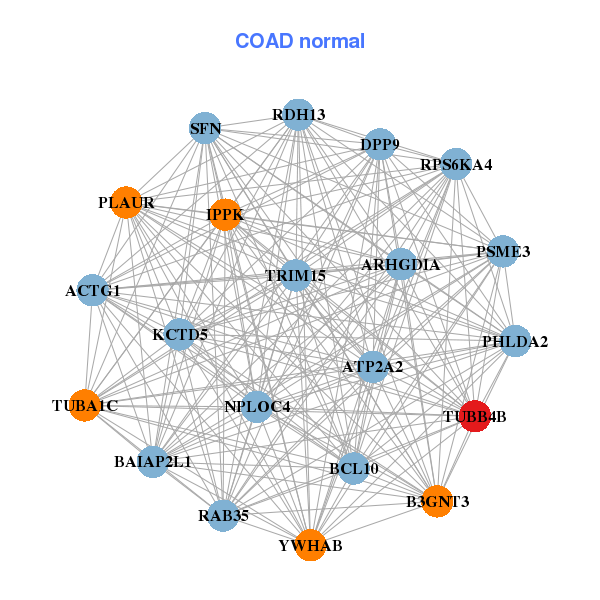
| * Co-Expression network figures were drawn using R package igraph. Only the top 20 genes with the highest correlations were shown. Red circle: input gene, orange circle: cell metabolism gene, sky circle: other gene |
: Open all plots for all cancer types
| Top |
: Open all interacting genes' information including KEGG pathway for all interacting genes from DAVID
| Top |
| Pharmacological Information for TUBB4B |
| DB Category | DB Name | DB's ID and Url link |
| * Gene Centered Interaction Network. |
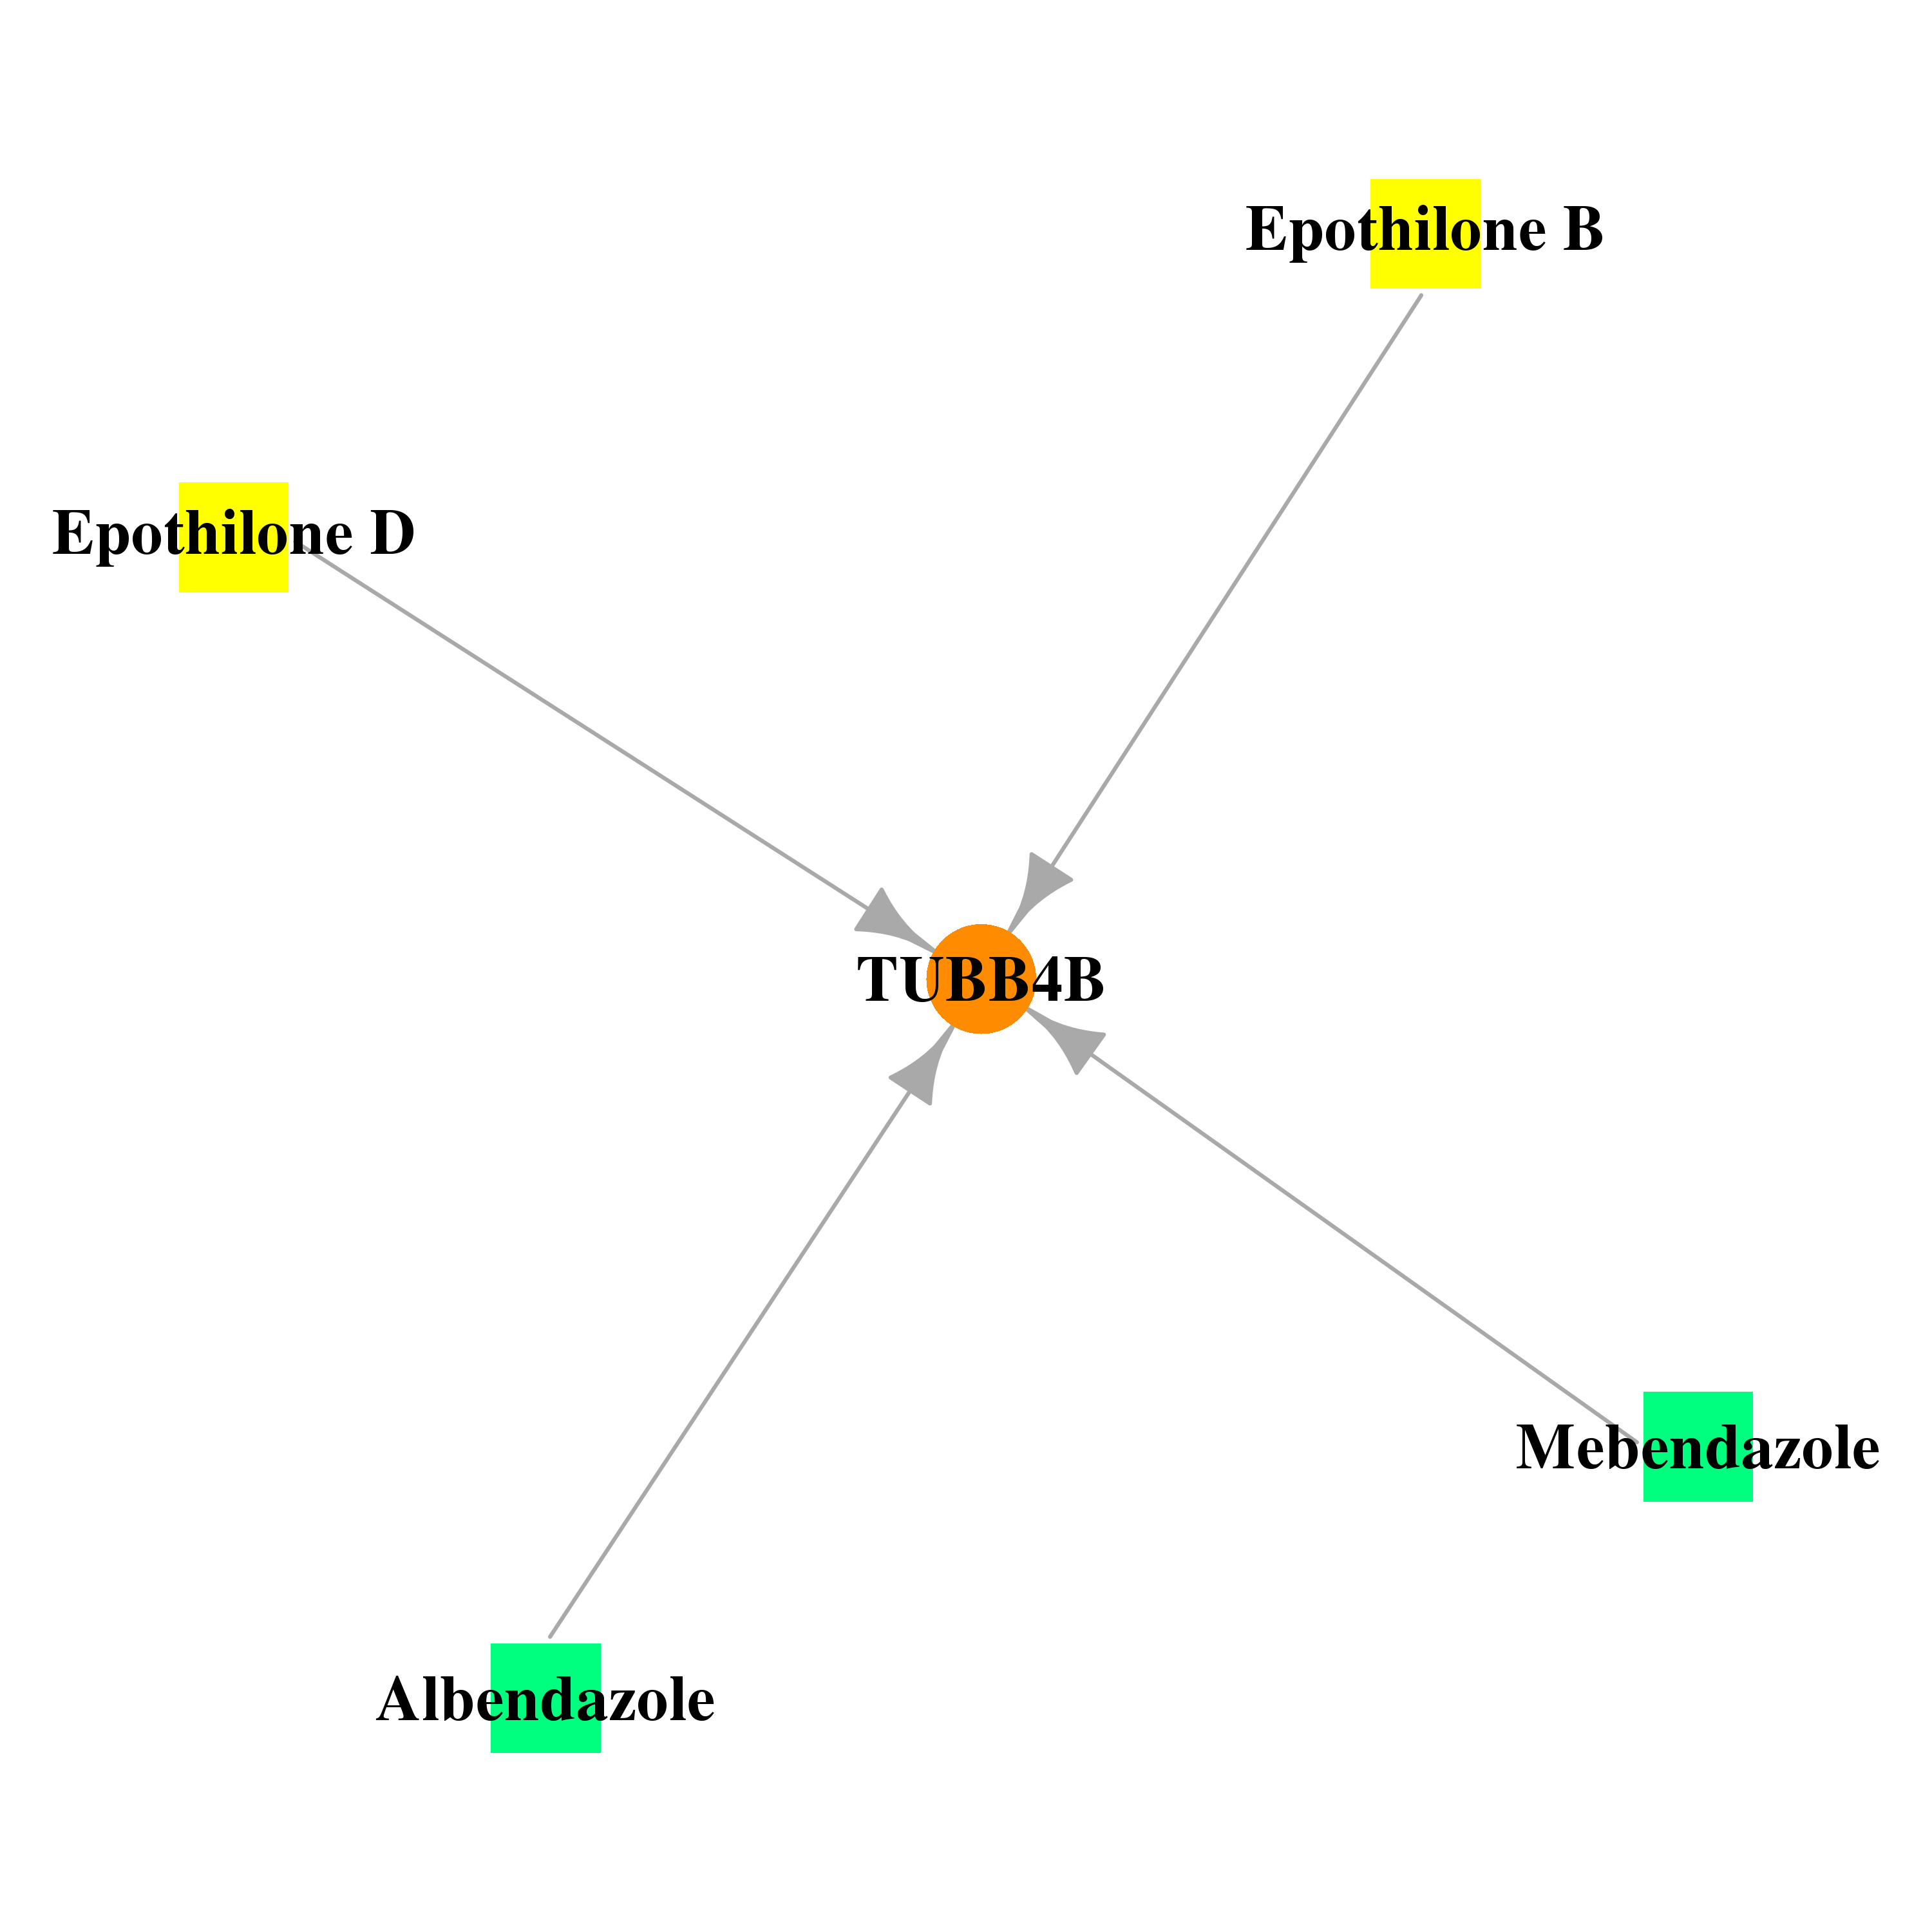 |
| * Drug Centered Interaction Network. |
| DrugBank ID | Target Name | Drug Groups | Generic Name | Drug Centered Network | Drug Structure |
| DB00518 | tubulin, beta 4B class IVb | approved | Albendazole | 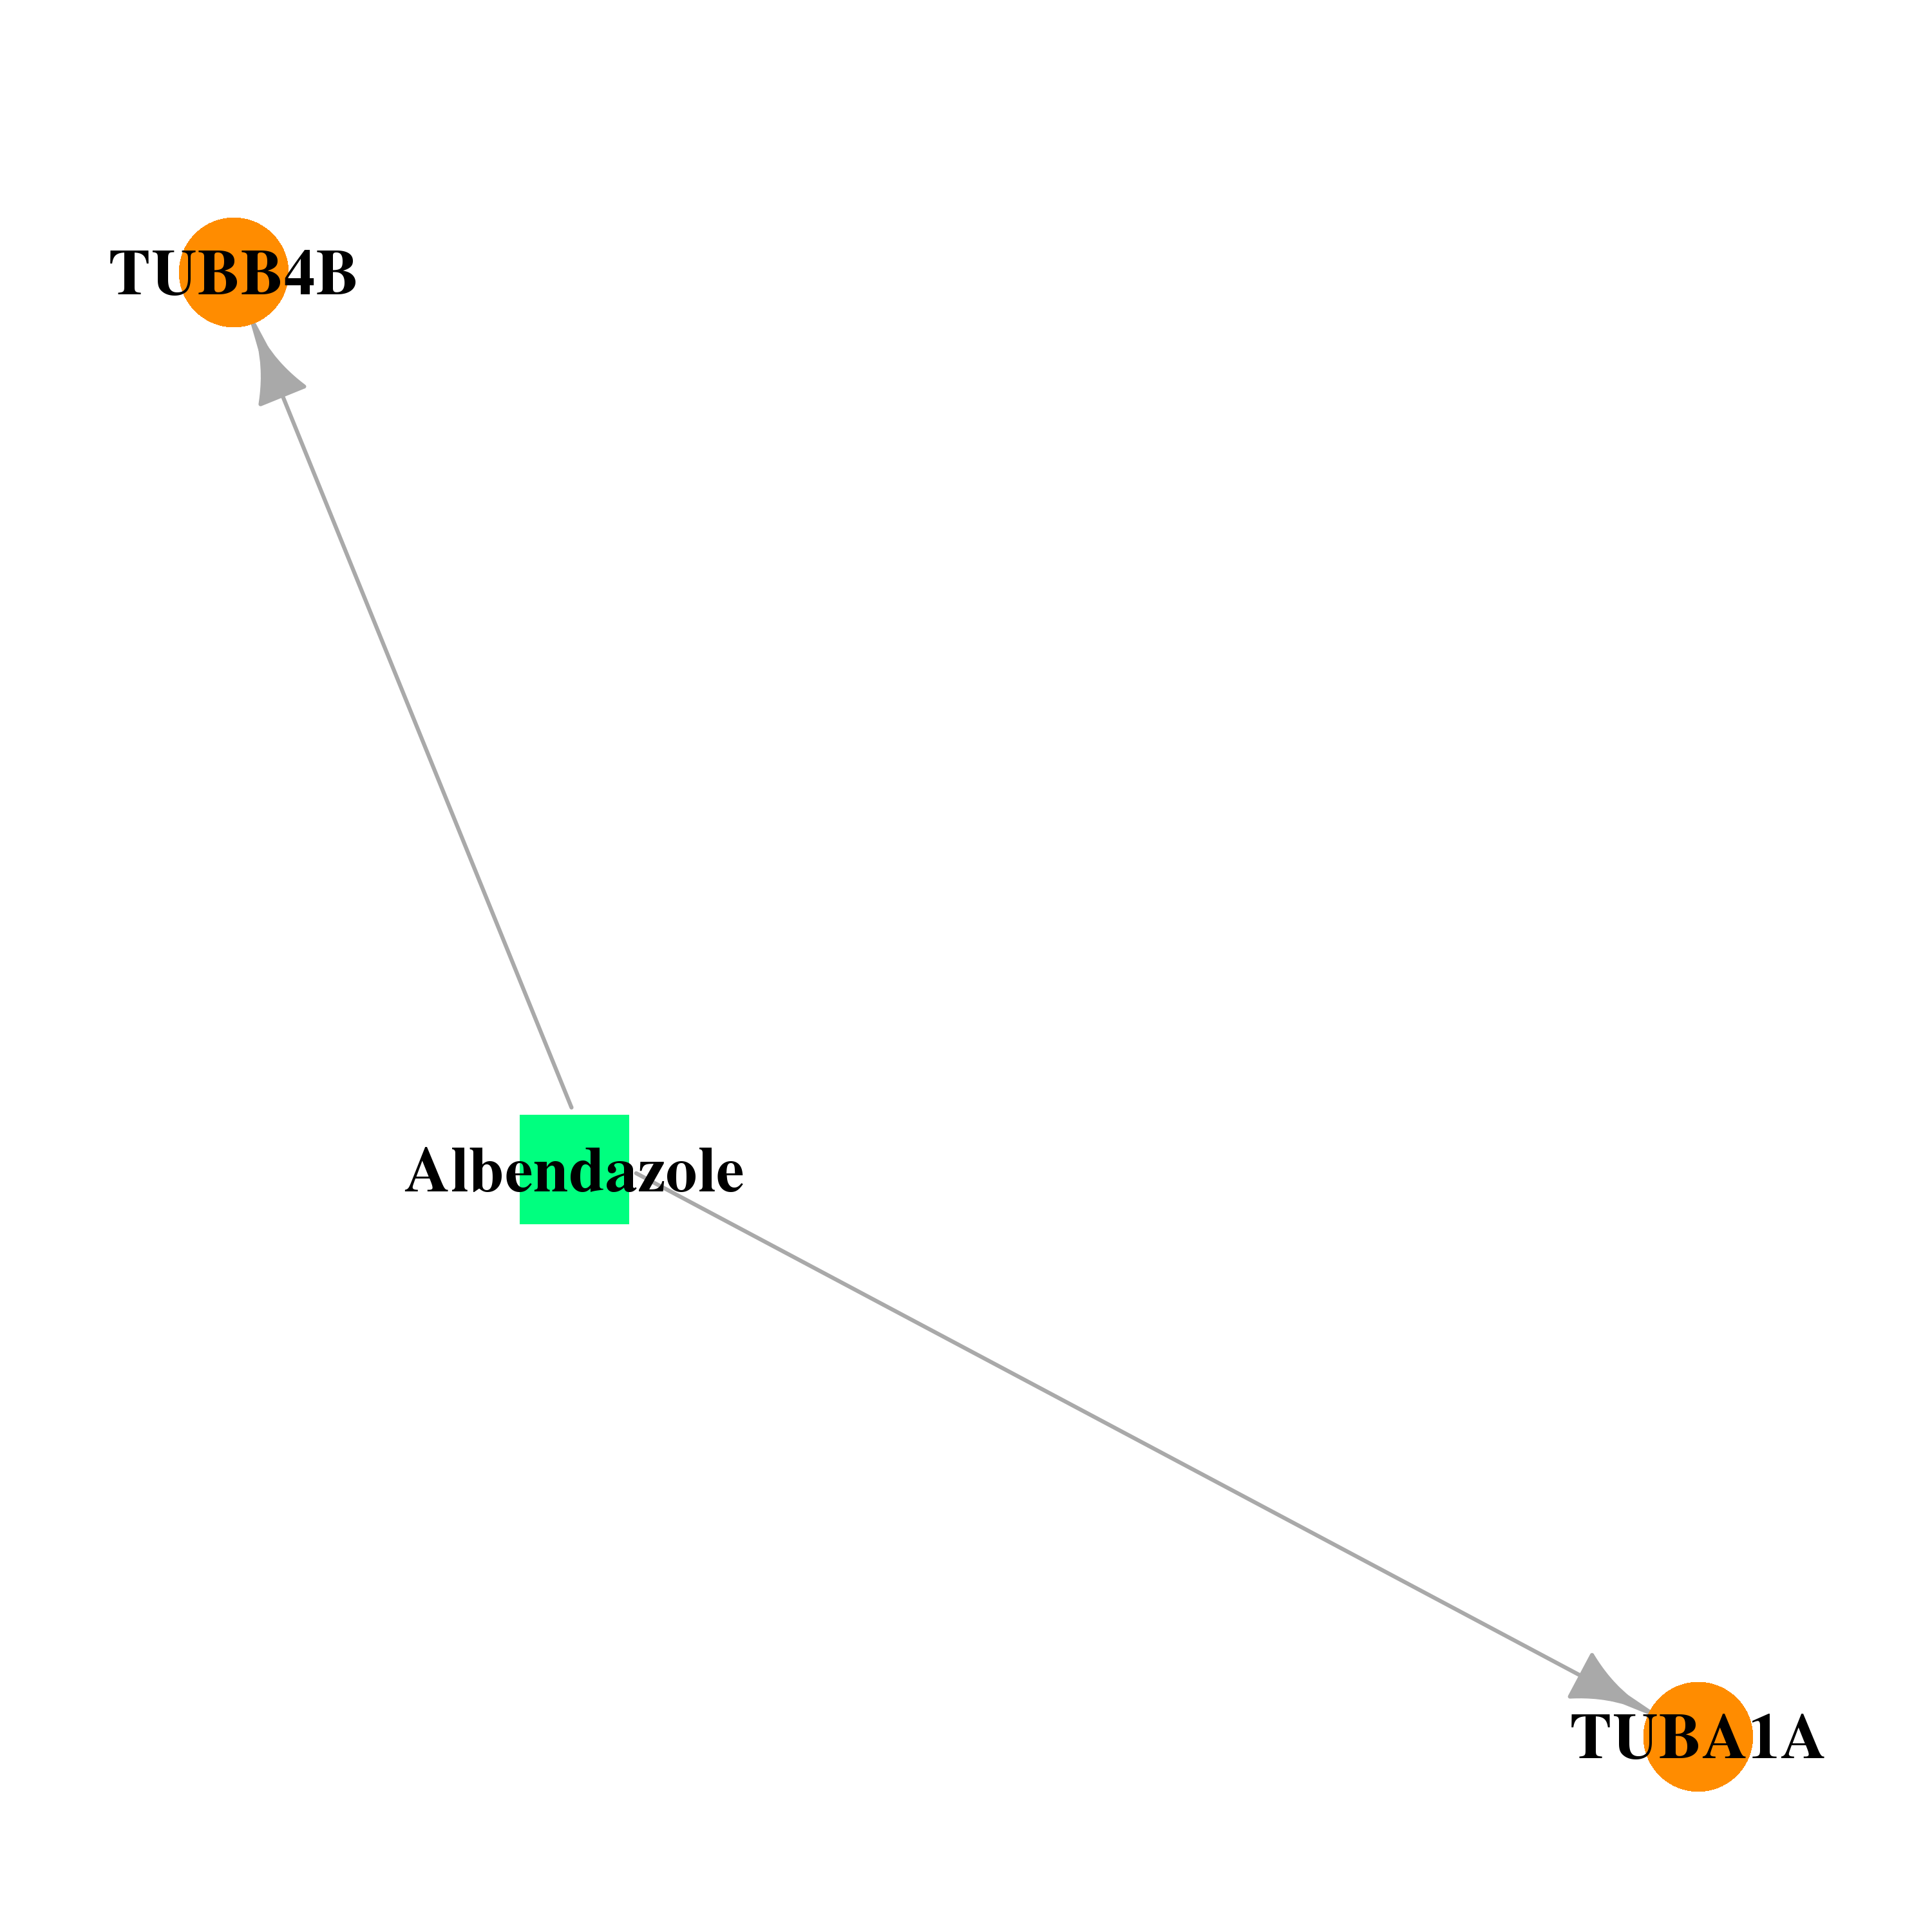 |  |
| DB00643 | tubulin, beta 4B class IVb | approved | Mebendazole | 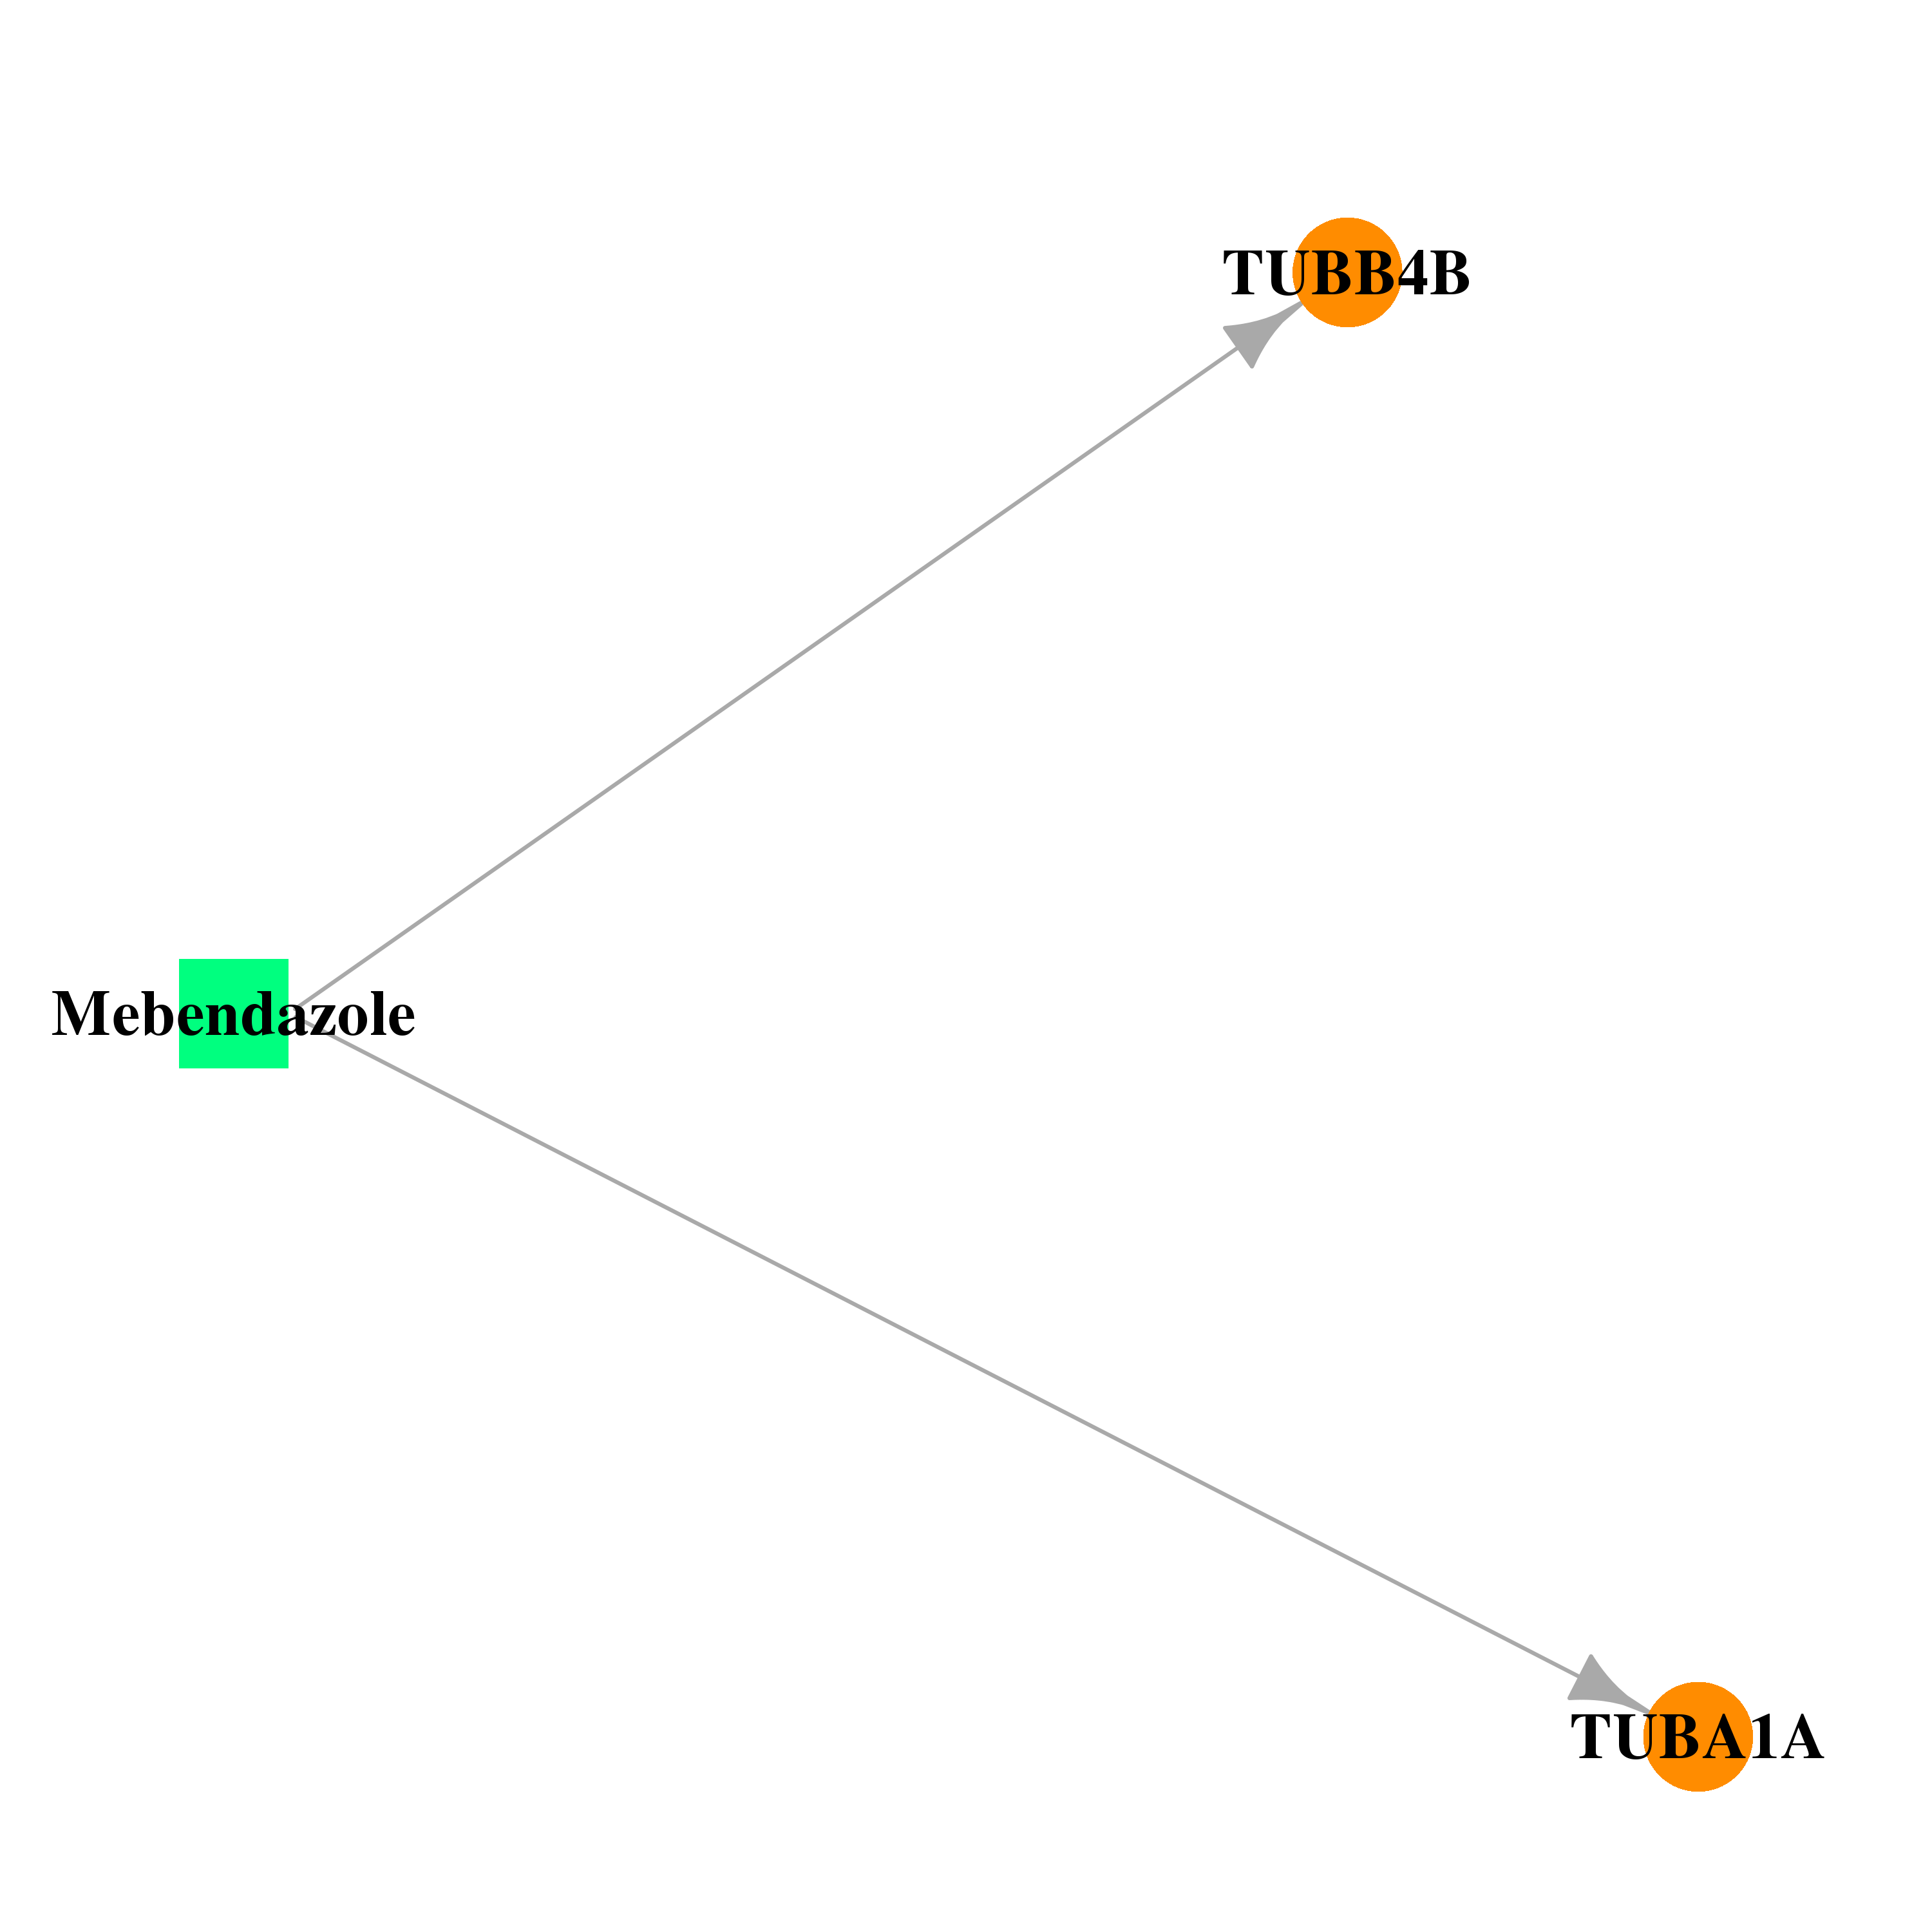 |  |
| DB01873 | tubulin, beta 4B class IVb | experimental; investigational | Epothilone D |  |  |
| DB03010 | tubulin, beta 4B class IVb | experimental; investigational | Epothilone B | 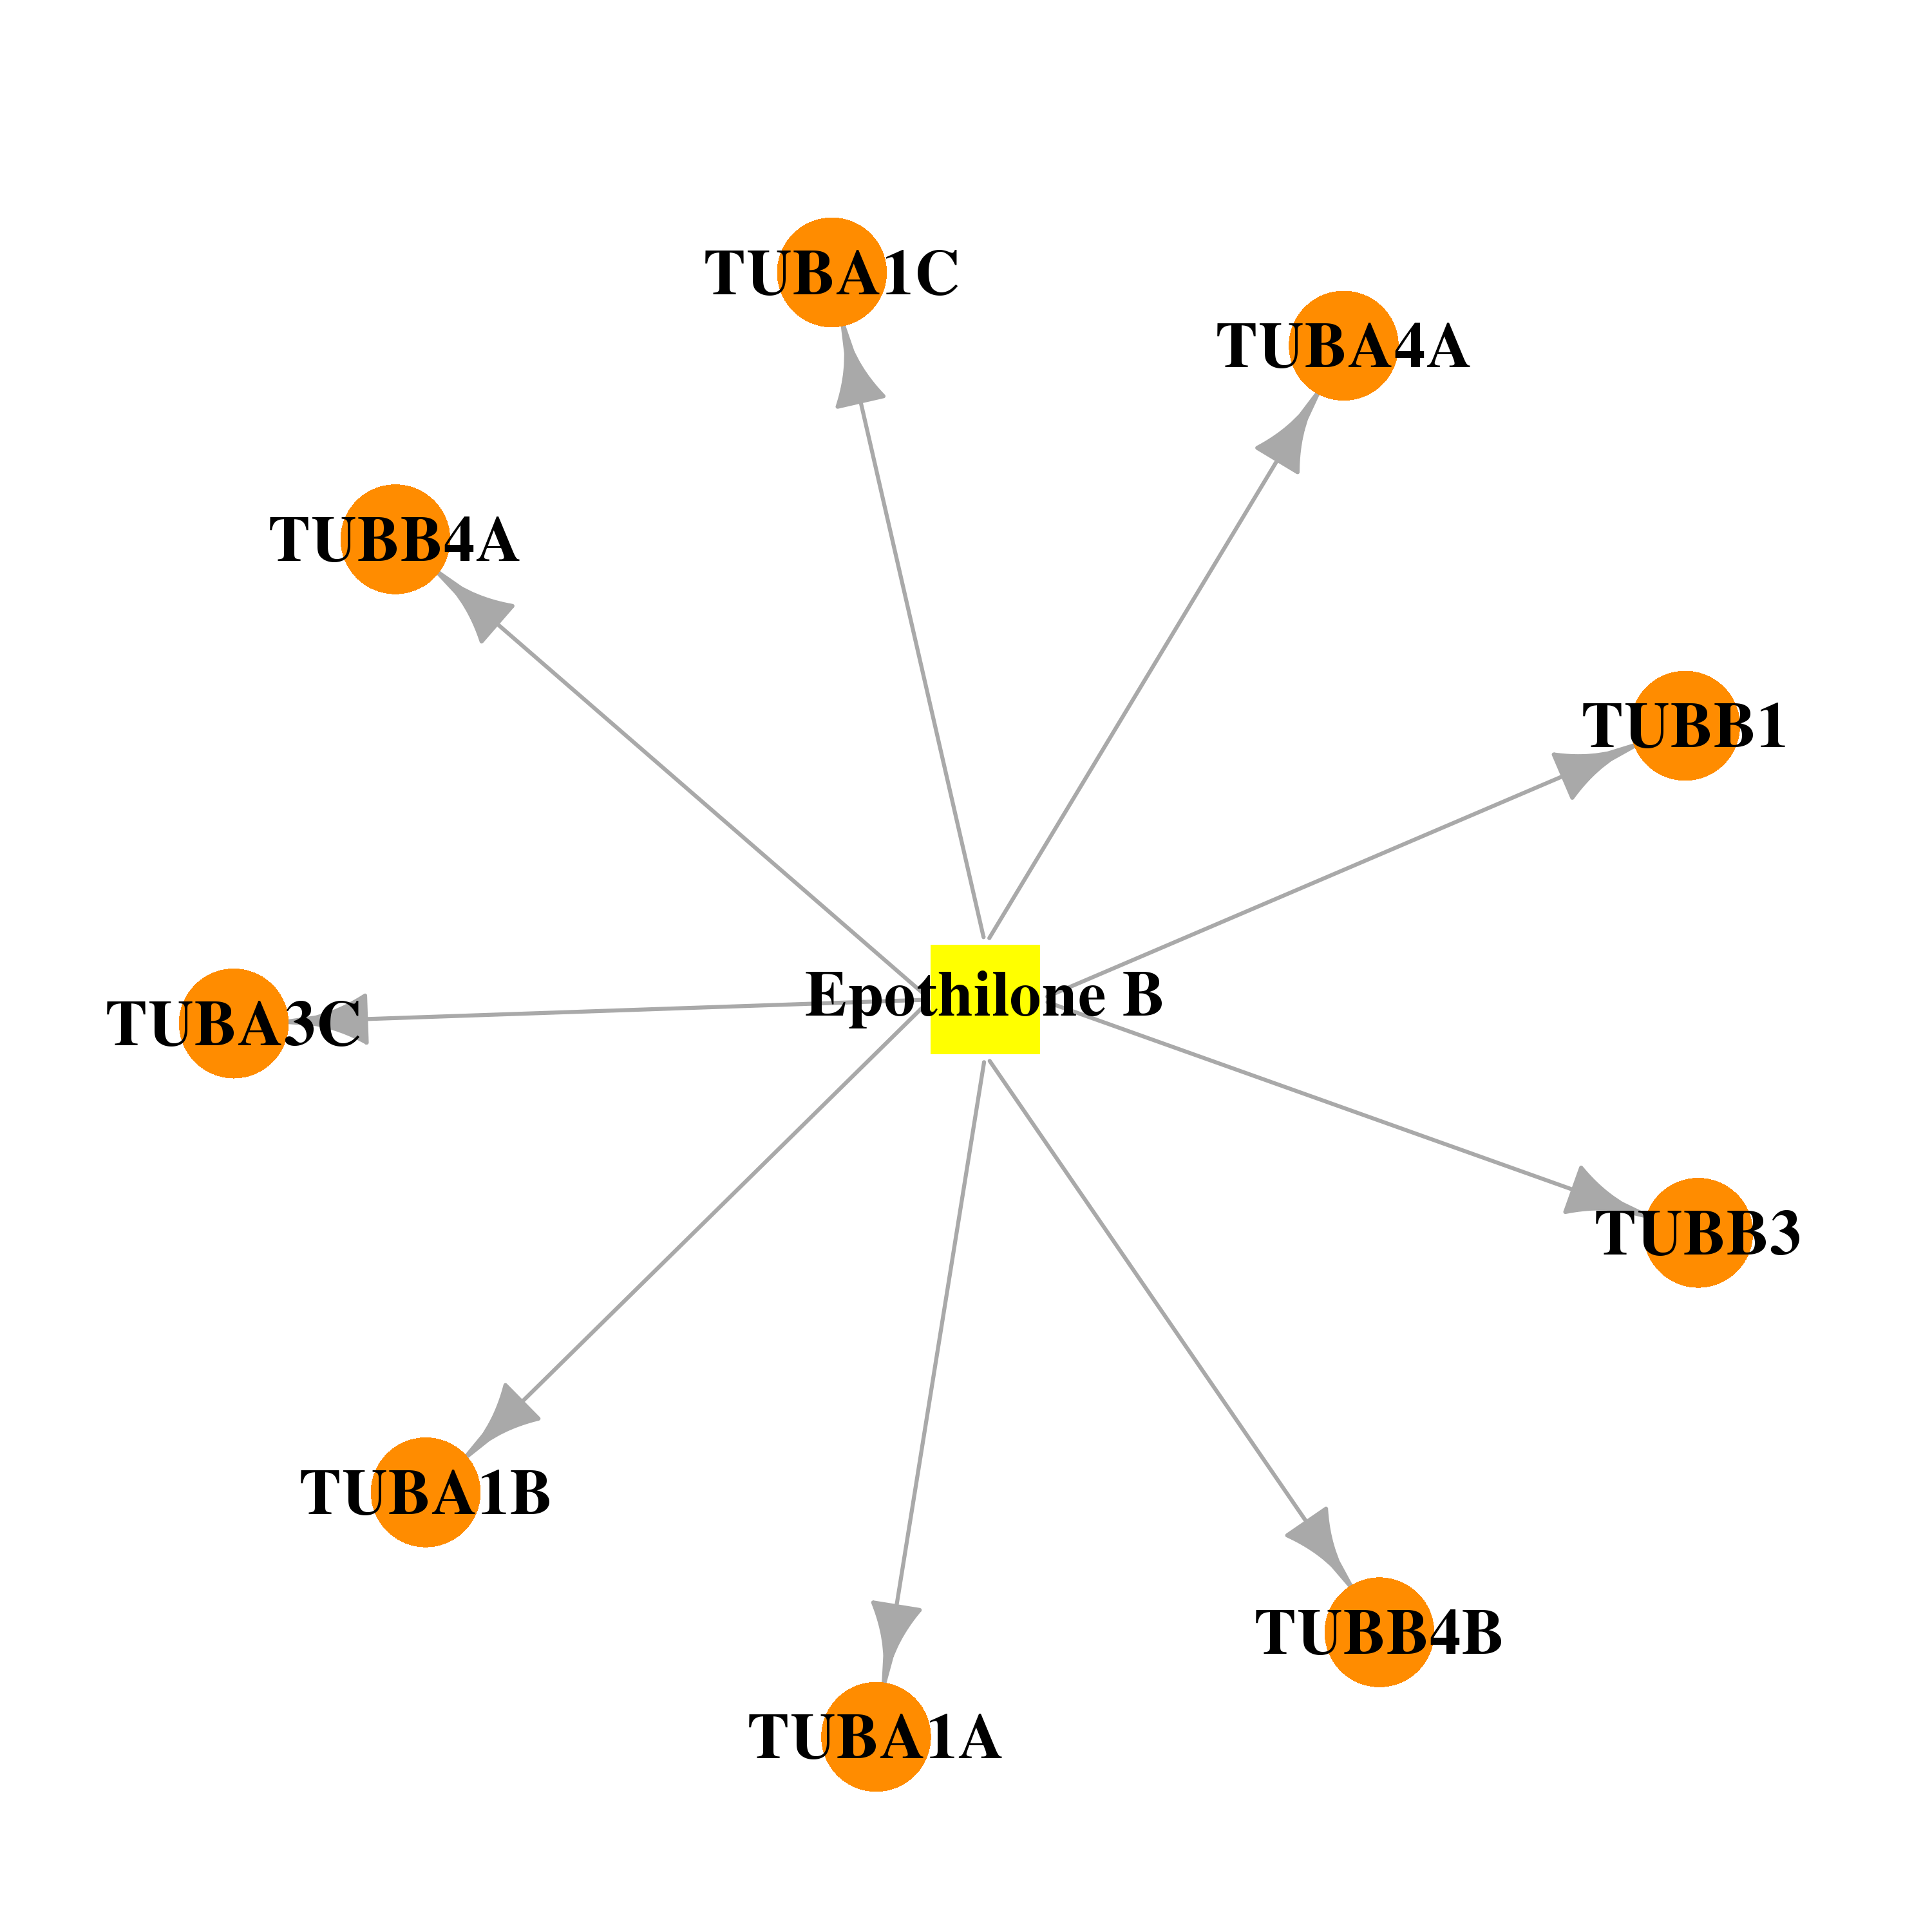 |  |
| Top |
| Cross referenced IDs for TUBB4B |
| * We obtained these cross-references from Uniprot database. It covers 150 different DBs, 18 categories. http://www.uniprot.org/help/cross_references_section |
: Open all cross reference information
|
Copyright © 2016-Present - The Univsersity of Texas Health Science Center at Houston @ |