|
|||||||||||||||||||||||||||||||||||||||||||||||||||||||||||||||||||||||||||||||||||||||||||||||||||||||||||||||||||||||||||||||||||||||||||||||||||||||||||||||||||||||||||||||||||||||||||||||||||||||||||||||||||||||||||||||||||||||||||||||||||||||||||||||||||||||||||||||||||||||||||||||||||||||||||||||||||||||||||||||
| |
| Phenotypic Information (metabolism pathway, cancer, disease, phenome) |
| |
| |
| Gene-Gene Network Information: Co-Expression Network, Interacting Genes & KEGG |
| |
|


| Gene Summary for YAP1 |
| Basic gene info. | Gene symbol | YAP1 |
| Gene name | Yes-associated protein 1 | |
| Synonyms | COB1|YAP|YAP2|YAP65|YKI | |
| Cytomap | UCSC genome browser: 11q13 | |
| Genomic location | chr11 :101981191-102104154 | |
| Type of gene | protein-coding | |
| RefGenes | NM_001130145.2, NM_001195044.1,NM_001195045.1,NM_001282097.1,NM_001282098.1, NM_001282099.1,NM_001282100.1,NM_001282101.1,NM_006106.4, | |
| Ensembl id | ENSG00000137693 | |
| Description | 65 kDa Yes-associated proteinprotein yorkie homologtranscriptional coactivator YAP1yes-associated protein 2yes-associated protein YAP65 homologyorkie homolog | |
| Modification date | 20141222 | |
| dbXrefs | MIM : 606608 | |
| HGNC : HGNC | ||
| Ensembl : ENSG00000137693 | ||
| HPRD : 09424 | ||
| Vega : OTTHUMG00000167322 | ||
| Protein | UniProt: P46937 go to UniProt's Cross Reference DB Table | |
| Expression | CleanEX: HS_YAP1 | |
| BioGPS: 10413 | ||
| Gene Expression Atlas: ENSG00000137693 | ||
| The Human Protein Atlas: ENSG00000137693 | ||
| Pathway | NCI Pathway Interaction Database: YAP1 | |
| KEGG: YAP1 | ||
| REACTOME: YAP1 | ||
| ConsensusPathDB | ||
| Pathway Commons: YAP1 | ||
| Metabolism | MetaCyc: YAP1 | |
| HUMANCyc: YAP1 | ||
| Regulation | Ensembl's Regulation: ENSG00000137693 | |
| miRBase: chr11 :101,981,191-102,104,154 | ||
| TargetScan: NM_001130145 | ||
| cisRED: ENSG00000137693 | ||
| Context | iHOP: YAP1 | |
| cancer metabolism search in PubMed: YAP1 | ||
| UCL Cancer Institute: YAP1 | ||
| Assigned class in ccmGDB | A - This gene has a literature evidence and it belongs to cancer gene. | |
| References showing role of YAP1 in cancer cell metabolism | 1. Mapelli V, Hillestrøm PR, Patil K, Larsen EH, Olsson L (2012) The interplay between sulphur and selenium metabolism influences the intracellular redox balance in Saccharomyces cerevisiae. FEMS yeast research 12: 20-32. go to article | |
| Top |
| Phenotypic Information for YAP1(metabolism pathway, cancer, disease, phenome) |
| Cancer | CGAP: YAP1 |
| Familial Cancer Database: YAP1 | |
| * This gene is included in those cancer gene databases. |
|
|
|
|
|
| . | |||||||||||||||||||||||||||||||||||||||||||||||||||||||||||||||||||||||||||||||||||||||||||||||||||||||||||||||||||||||||||||||||||||||||||||||||||||||||||||||||||||||||||||||||||||||||||||||||||||||||||||||||||||||||||||||||||||||||||||||||||||||||||||||||||||||||||||||||||||||||||||||||||||||||||||||||||||||||
Oncogene 1 | Significant driver gene in | ||||||||||||||||||||||||||||||||||||||||||||||||||||||||||||||||||||||||||||||||||||||||||||||||||||||||||||||||||||||||||||||||||||||||||||||||||||||||||||||||||||||||||||||||||||||||||||||||||||||||||||||||||||||||||||||||||||||||||||||||||||||||||||||||||||||||||||||||||||||||||||||||||||||||||||||||||||||||||||||
| cf) number; DB name 1 Oncogene; http://nar.oxfordjournals.org/content/35/suppl_1/D721.long, 2 Tumor Suppressor gene; https://bioinfo.uth.edu/TSGene/, 3 Cancer Gene Census; http://www.nature.com/nrc/journal/v4/n3/abs/nrc1299.html, 4 CancerGenes; http://nar.oxfordjournals.org/content/35/suppl_1/D721.long, 5 Network of Cancer Gene; http://ncg.kcl.ac.uk/index.php, 1Therapeutic Vulnerabilities in Cancer; http://cbio.mskcc.org/cancergenomics/statius/ |
| REACTOME_METABOLISM_OF_LIPIDS_AND_LIPOPROTEINS | |
| OMIM | 120433; phenotype. 120433; phenotype. 606608; gene. 606608; gene. |
| Orphanet | 1473; Uveal coloboma - cleft lip and palate - intellectual disability. 1473; Uveal coloboma - cleft lip and palate - intellectual disability. |
| Disease | KEGG Disease: YAP1 |
| MedGen: YAP1 (Human Medical Genetics with Condition) | |
| ClinVar: YAP1 | |
| Phenotype | MGI: YAP1 (International Mouse Phenotyping Consortium) |
| PhenomicDB: YAP1 | |
| Mutations for YAP1 |
| * Under tables are showing count per each tissue to give us broad intuition about tissue specific mutation patterns.You can go to the detailed page for each mutation database's web site. |
| - Statistics for Tissue and Mutation type | Top |
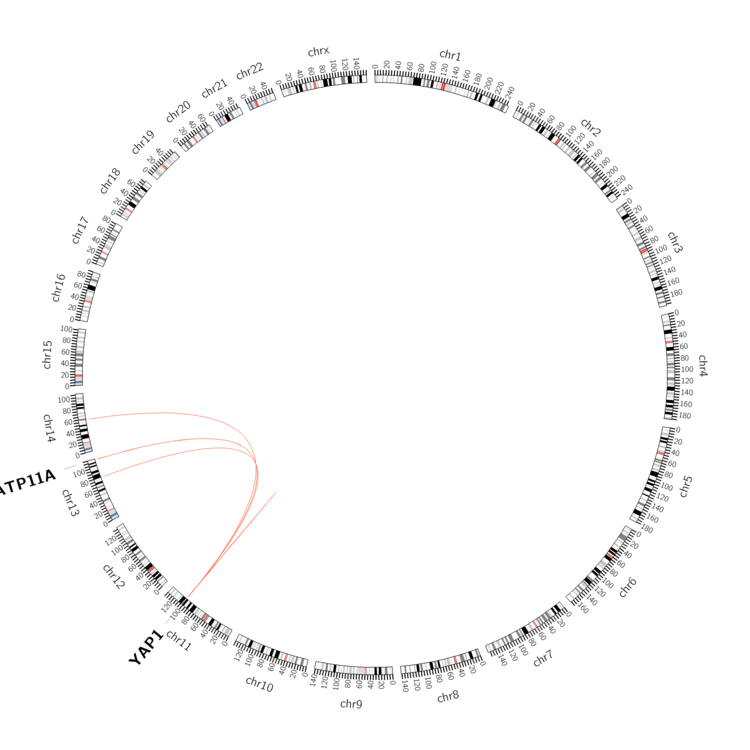 |
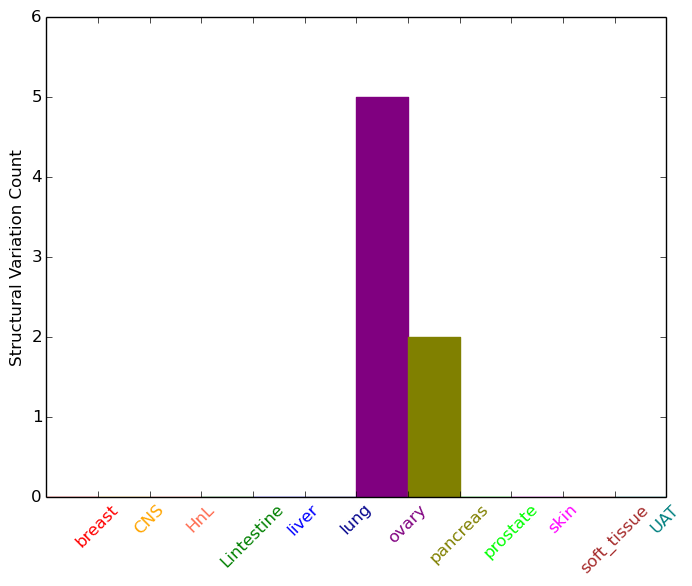
| - For Inter-chromosomal Variations |
| * Inter-chromosomal variantions includes 'interchromosomal amplicon to amplicon', 'interchromosomal amplicon to non-amplified dna', 'interchromosomal insertion', 'Interchromosomal unknown type'. |
 |
| - For Intra-chromosomal Variations |
| * Intra-chromosomal variantions includes 'intrachromosomal amplicon to amplicon', 'intrachromosomal amplicon to non-amplified dna', 'intrachromosomal deletion', 'intrachromosomal fold-back inversion', 'intrachromosomal inversion', 'intrachromosomal tandem duplication', 'Intrachromosomal unknown type', 'intrachromosomal with inverted orientation', 'intrachromosomal with non-inverted orientation'. |
 |
| Sample | Symbol_a | Chr_a | Start_a | End_a | Symbol_b | Chr_b | Start_b | End_b |
| ovary | YAP1 | chr11 | 102014722 | 102014742 | YAP1 | chr11 | 102015522 | 102015542 |
| ovary | YAP1 | chr11 | 102027028 | 102027048 | YAP1 | chr11 | 102027645 | 102027665 |
| ovary | YAP1 | chr11 | 102028234 | 102028254 | YAP1 | chr11 | 102029152 | 102029172 |
| ovary | YAP1 | chr11 | 102080625 | 102080645 | chr11 | 102115174 | 102115194 | |
| ovary | YAP1 | chr11 | 102081150 | 102081170 | chr11 | 102608531 | 102608551 | |
| ovary | YAP1 | chr11 | 102095386 | 102095406 | chr13 | 113617548 | 113617568 | |
| ovary | YAP1 | chr11 | 102101378 | 102101398 | chr13 | 79427390 | 79427410 | |
| ovary | YAP1 | chr11 | 102102313 | 102102333 | ATP11A | chr13 | 113482670 | 113482690 |
| pancreas | YAP1 | chr11 | 102055972 | 102055992 | chr14 | 59238465 | 59238485 | |
| pancreas | YAP1 | chr11 | 102064752 | 102064772 | YAP1 | chr11 | 102081228 | 102081248 |
| cf) Tissue number; Tissue name (1;Breast, 2;Central_nervous_system, 3;Haematopoietic_and_lymphoid_tissue, 4;Large_intestine, 5;Liver, 6;Lung, 7;Ovary, 8;Pancreas, 9;Prostate, 10;Skin, 11;Soft_tissue, 12;Upper_aerodigestive_tract) |
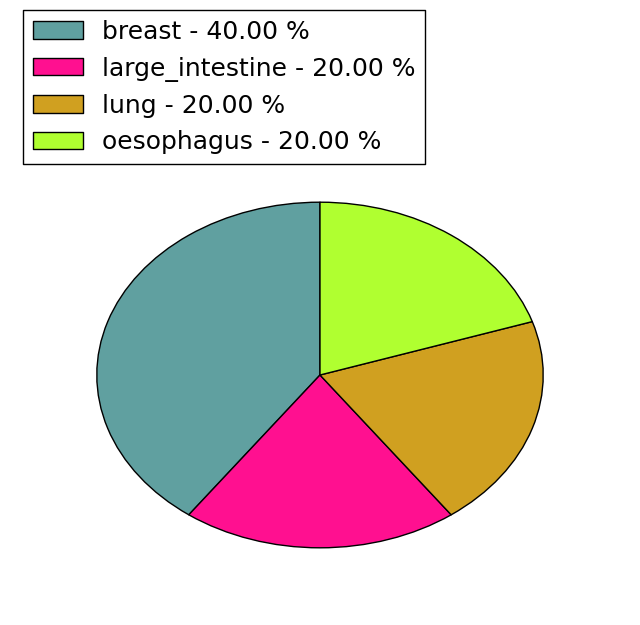
| * From mRNA Sanger sequences, Chitars2.0 arranged chimeric transcripts. This table shows YAP1 related fusion information. |
| ID | Head Gene | Tail Gene | Accession | Gene_a | qStart_a | qEnd_a | Chromosome_a | tStart_a | tEnd_a | Gene_a | qStart_a | qEnd_a | Chromosome_a | tStart_a | tEnd_a |
| BQ370439 | METAP1D | 8 | 348 | 2 | 172935671 | 172944922 | YAP1 | 342 | 433 | 11 | 102020541 | 102020632 | |
| Top |
| Mutation type/ Tissue ID | brca | cns | cerv | endome | haematopo | kidn | Lintest | liver | lung | ns | ovary | pancre | prost | skin | stoma | thyro | urina | |||
| Total # sample | 1 | 1 | 2 | 2 | 2 | 1 | 1 | 3 | 2 | |||||||||||
| GAIN (# sample) | 1 | 2 | 2 | 2 | 1 | 2 | 2 | |||||||||||||
| LOSS (# sample) | 1 | 1 | 1 |
| cf) Tissue ID; Tissue type (1; Breast, 2; Central_nervous_system, 3; Cervix, 4; Endometrium, 5; Haematopoietic_and_lymphoid_tissue, 6; Kidney, 7; Large_intestine, 8; Liver, 9; Lung, 10; NS, 11; Ovary, 12; Pancreas, 13; Prostate, 14; Skin, 15; Stomach, 16; Thyroid, 17; Urinary_tract) |
| Top |
|
 |
| Top |
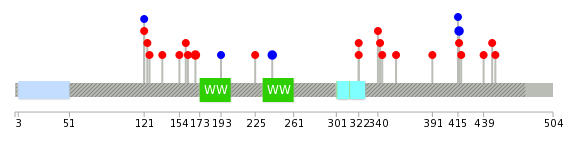
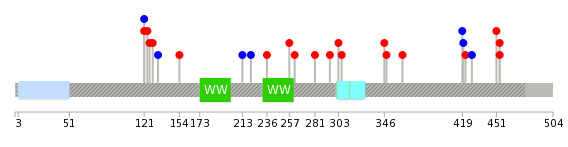
| Stat. for Non-Synonymous SNVs (# total SNVs=20) | (# total SNVs=5) |
 |  |
(# total SNVs=0) | (# total SNVs=0) |
| Top |
| * When you move the cursor on each content, you can see more deailed mutation information on the Tooltip. Those are primary_site,primary_histology,mutation(aa),pubmedID. |
| GRCh37 position | Mutation(aa) | Unique sampleID count |
| chr11:101985058-101985058 | p.D169N | 2 |
| chr11:101984916-101984916 | p.Q121Q | 2 |
| chr11:102076658-102076658 | p.V241V | 2 |
| chr11:102100566-102100566 | p.L416L | 2 |
| chr11:102094446-102094446 | p.T322A | 2 |
| chr11:102098228-102098228 | p.T344A | 1 |
| chr11:102100666-102100666 | p.L450I | 1 |
| chr11:101985038-101985038 | p.Q162R | 1 |
| chr11:102098267-102098267 | p.R357* | 1 |
| chr11:102098268-102098268 | p.R357Q | 1 |
| Top |
|
 |
| Point Mutation/ Tissue ID | 1 | 2 | 3 | 4 | 5 | 6 | 7 | 8 | 9 | 10 | 11 | 12 | 13 | 14 | 15 | 16 | 17 | 18 | 19 | 20 |
| # sample | 2 | 1 | 5 | 1 | 2 | 1 | 2 | 2 | 1 | 2 | 1 | 1 | 4 | |||||||
| # mutation | 2 | 1 | 4 | 1 | 2 | 2 | 2 | 2 | 1 | 2 | 1 | 1 | 4 | |||||||
| nonsynonymous SNV | 1 | 1 | 4 | 1 | 2 | 2 | 1 | 1 | 1 | 1 | 4 | |||||||||
| synonymous SNV | 1 | 1 | 2 | 2 | 1 |
| cf) Tissue ID; Tissue type (1; BLCA[Bladder Urothelial Carcinoma], 2; BRCA[Breast invasive carcinoma], 3; CESC[Cervical squamous cell carcinoma and endocervical adenocarcinoma], 4; COAD[Colon adenocarcinoma], 5; GBM[Glioblastoma multiforme], 6; Glioma Low Grade, 7; HNSC[Head and Neck squamous cell carcinoma], 8; KICH[Kidney Chromophobe], 9; KIRC[Kidney renal clear cell carcinoma], 10; KIRP[Kidney renal papillary cell carcinoma], 11; LAML[Acute Myeloid Leukemia], 12; LUAD[Lung adenocarcinoma], 13; LUSC[Lung squamous cell carcinoma], 14; OV[Ovarian serous cystadenocarcinoma ], 15; PAAD[Pancreatic adenocarcinoma], 16; PRAD[Prostate adenocarcinoma], 17; SKCM[Skin Cutaneous Melanoma], 18:STAD[Stomach adenocarcinoma], 19:THCA[Thyroid carcinoma], 20:UCEC[Uterine Corpus Endometrial Carcinoma]) |
| Top |
| * We represented just top 10 SNVs. When you move the cursor on each content, you can see more deailed mutation information on the Tooltip. Those are primary_site, primary_histology, mutation(aa), pubmedID. |
| Genomic Position | Mutation(aa) | Unique sampleID count |
| chr11:101984916 | p.Q121Q,YAP1 | 2 |
| chr11:102098228 | p.W236L,YAP1 | 1 |
| chr11:102033253 | p.L454S,YAP1 | 1 |
| chr11:102098274 | p.S257F,YAP1 | 1 |
| chr11:102033277 | p.R262M,YAP1 | 1 |
| chr11:102100563 | p.R281W,YAP1 | 1 |
| chr11:102056767 | p.I295N,YAP1 | 1 |
| chr11:102100566 | p.P303A,YAP1 | 1 |
| chr11:102056830 | p.Q306K,YAP1 | 1 |
| chr11:102100570 | p.E346D,YAP1 | 1 |
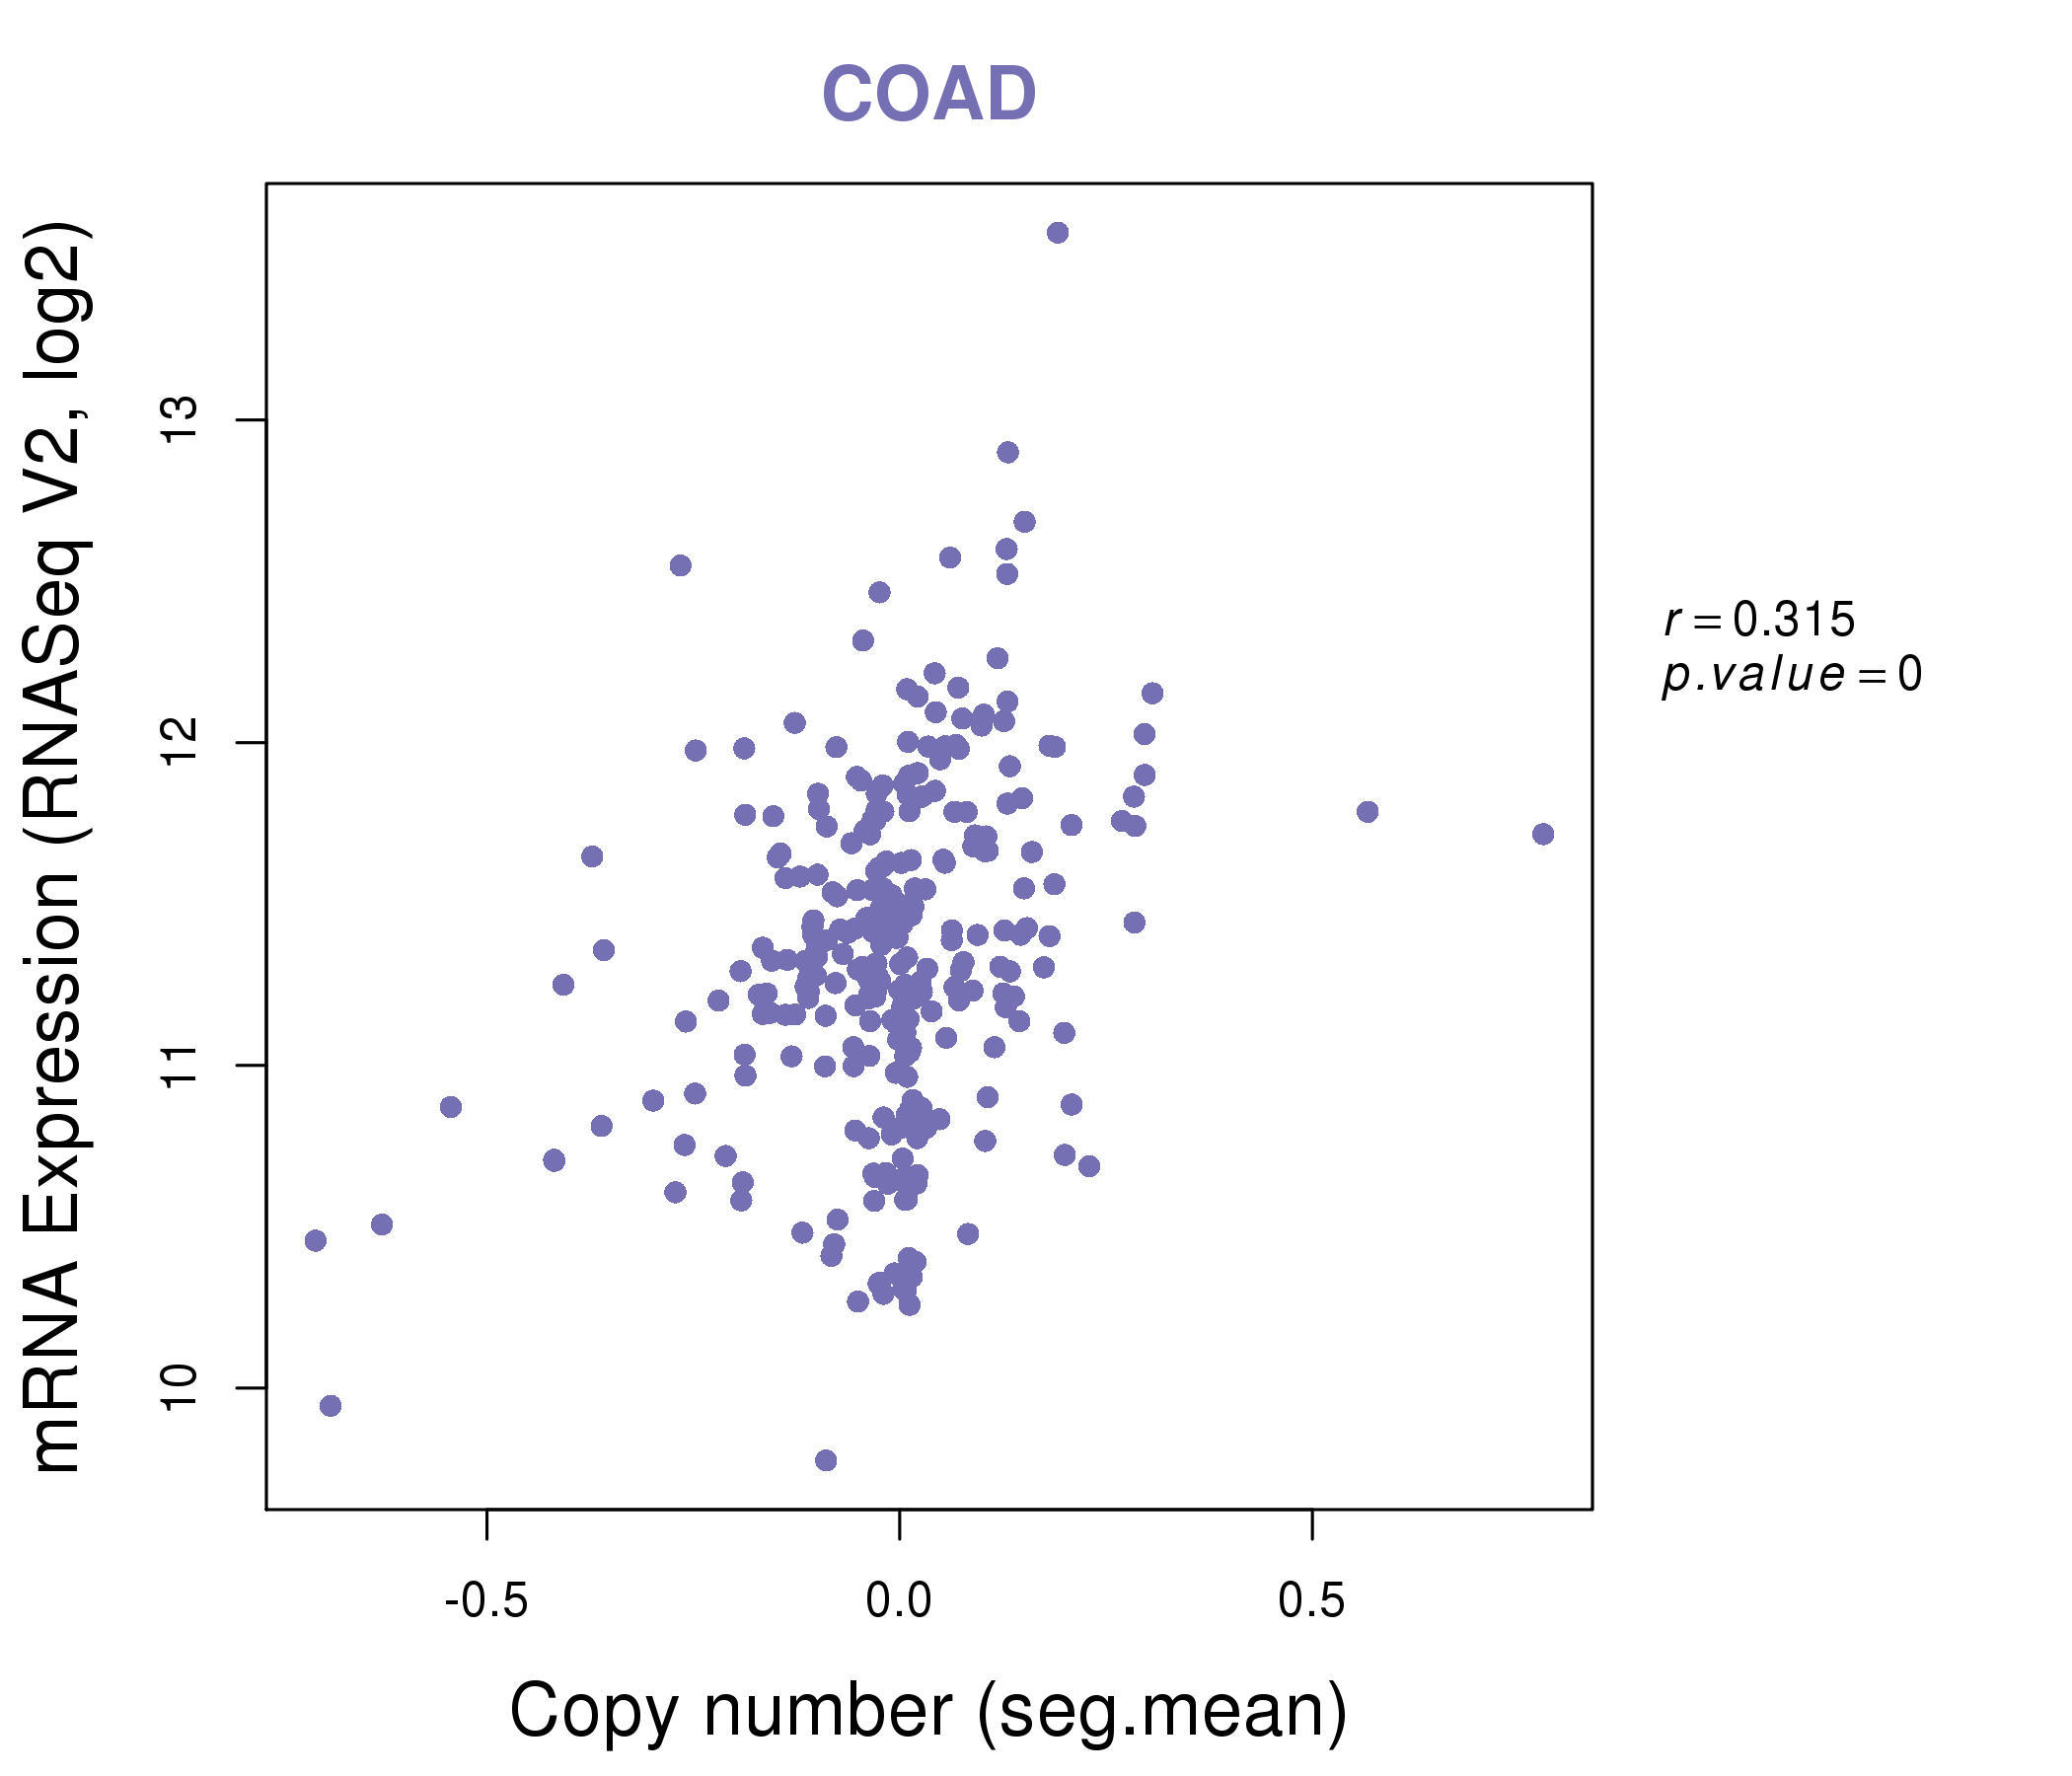
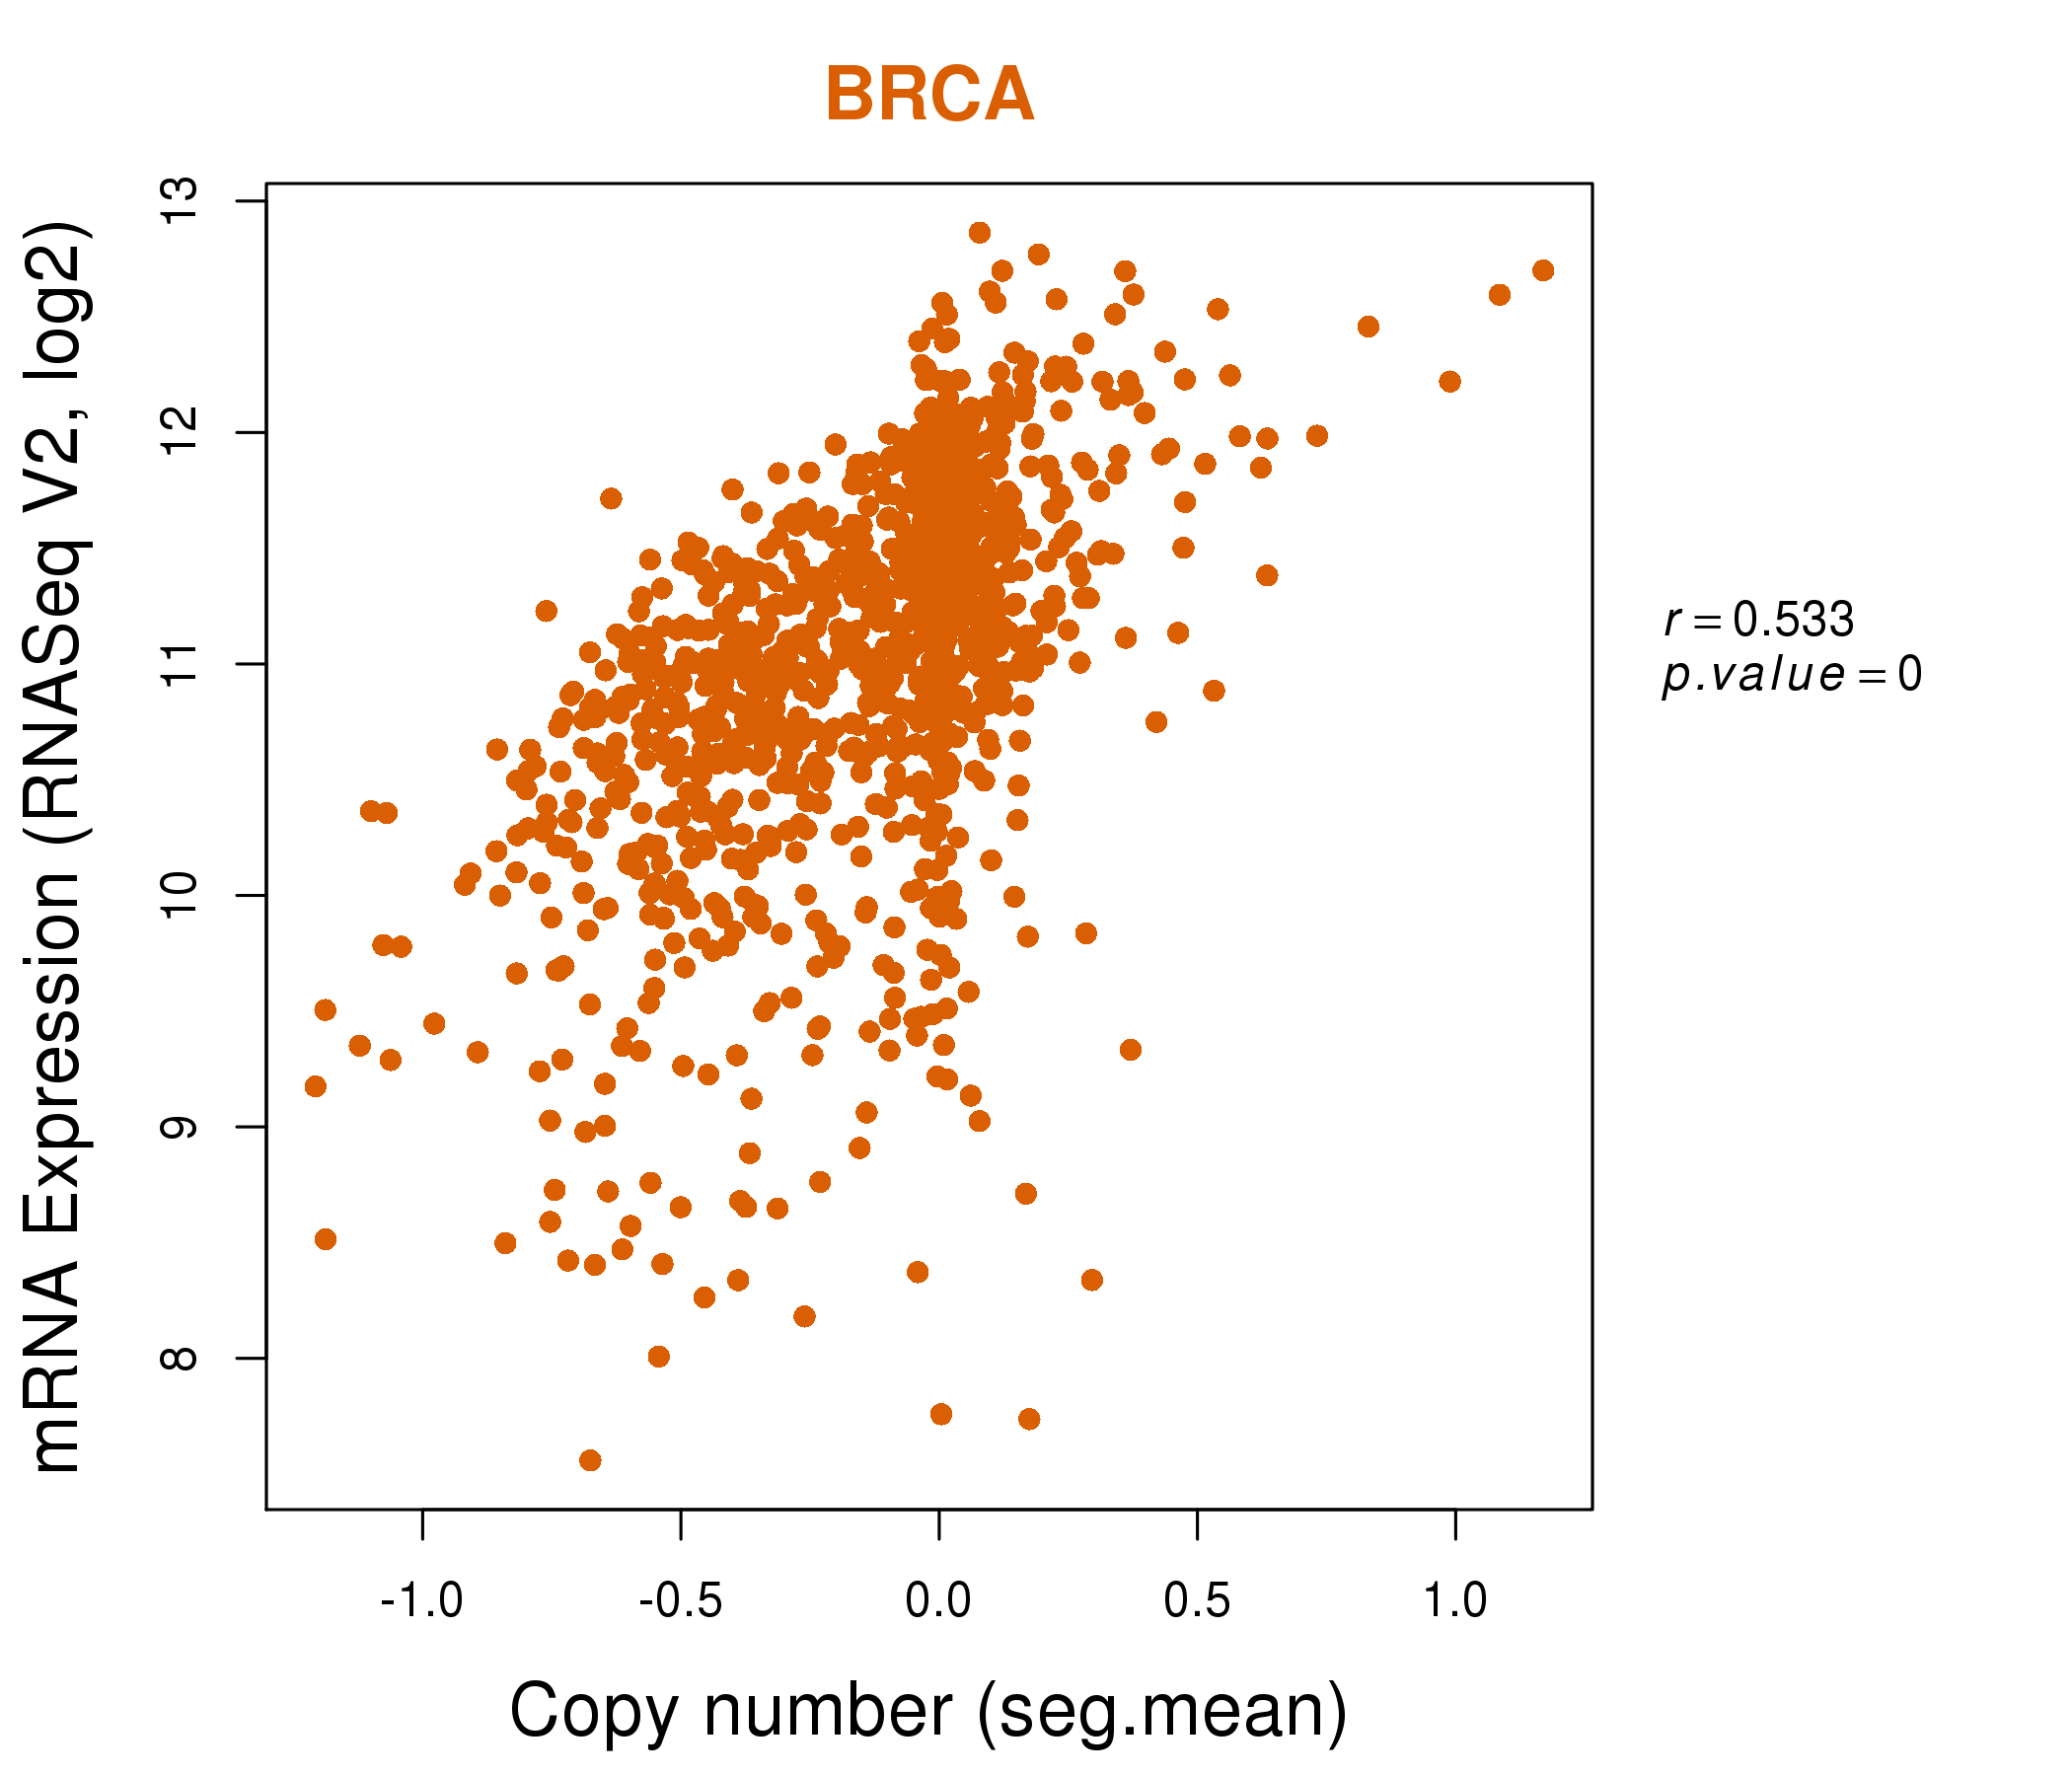
| * Copy number data were extracted from TCGA using R package TCGA-Assembler. The URLs of all public data files on TCGA DCC data server were gathered on Jan-05-2015. Function ProcessCNAData in TCGA-Assembler package was used to obtain gene-level copy number value which is calculated as the average copy number of the genomic region of a gene. |
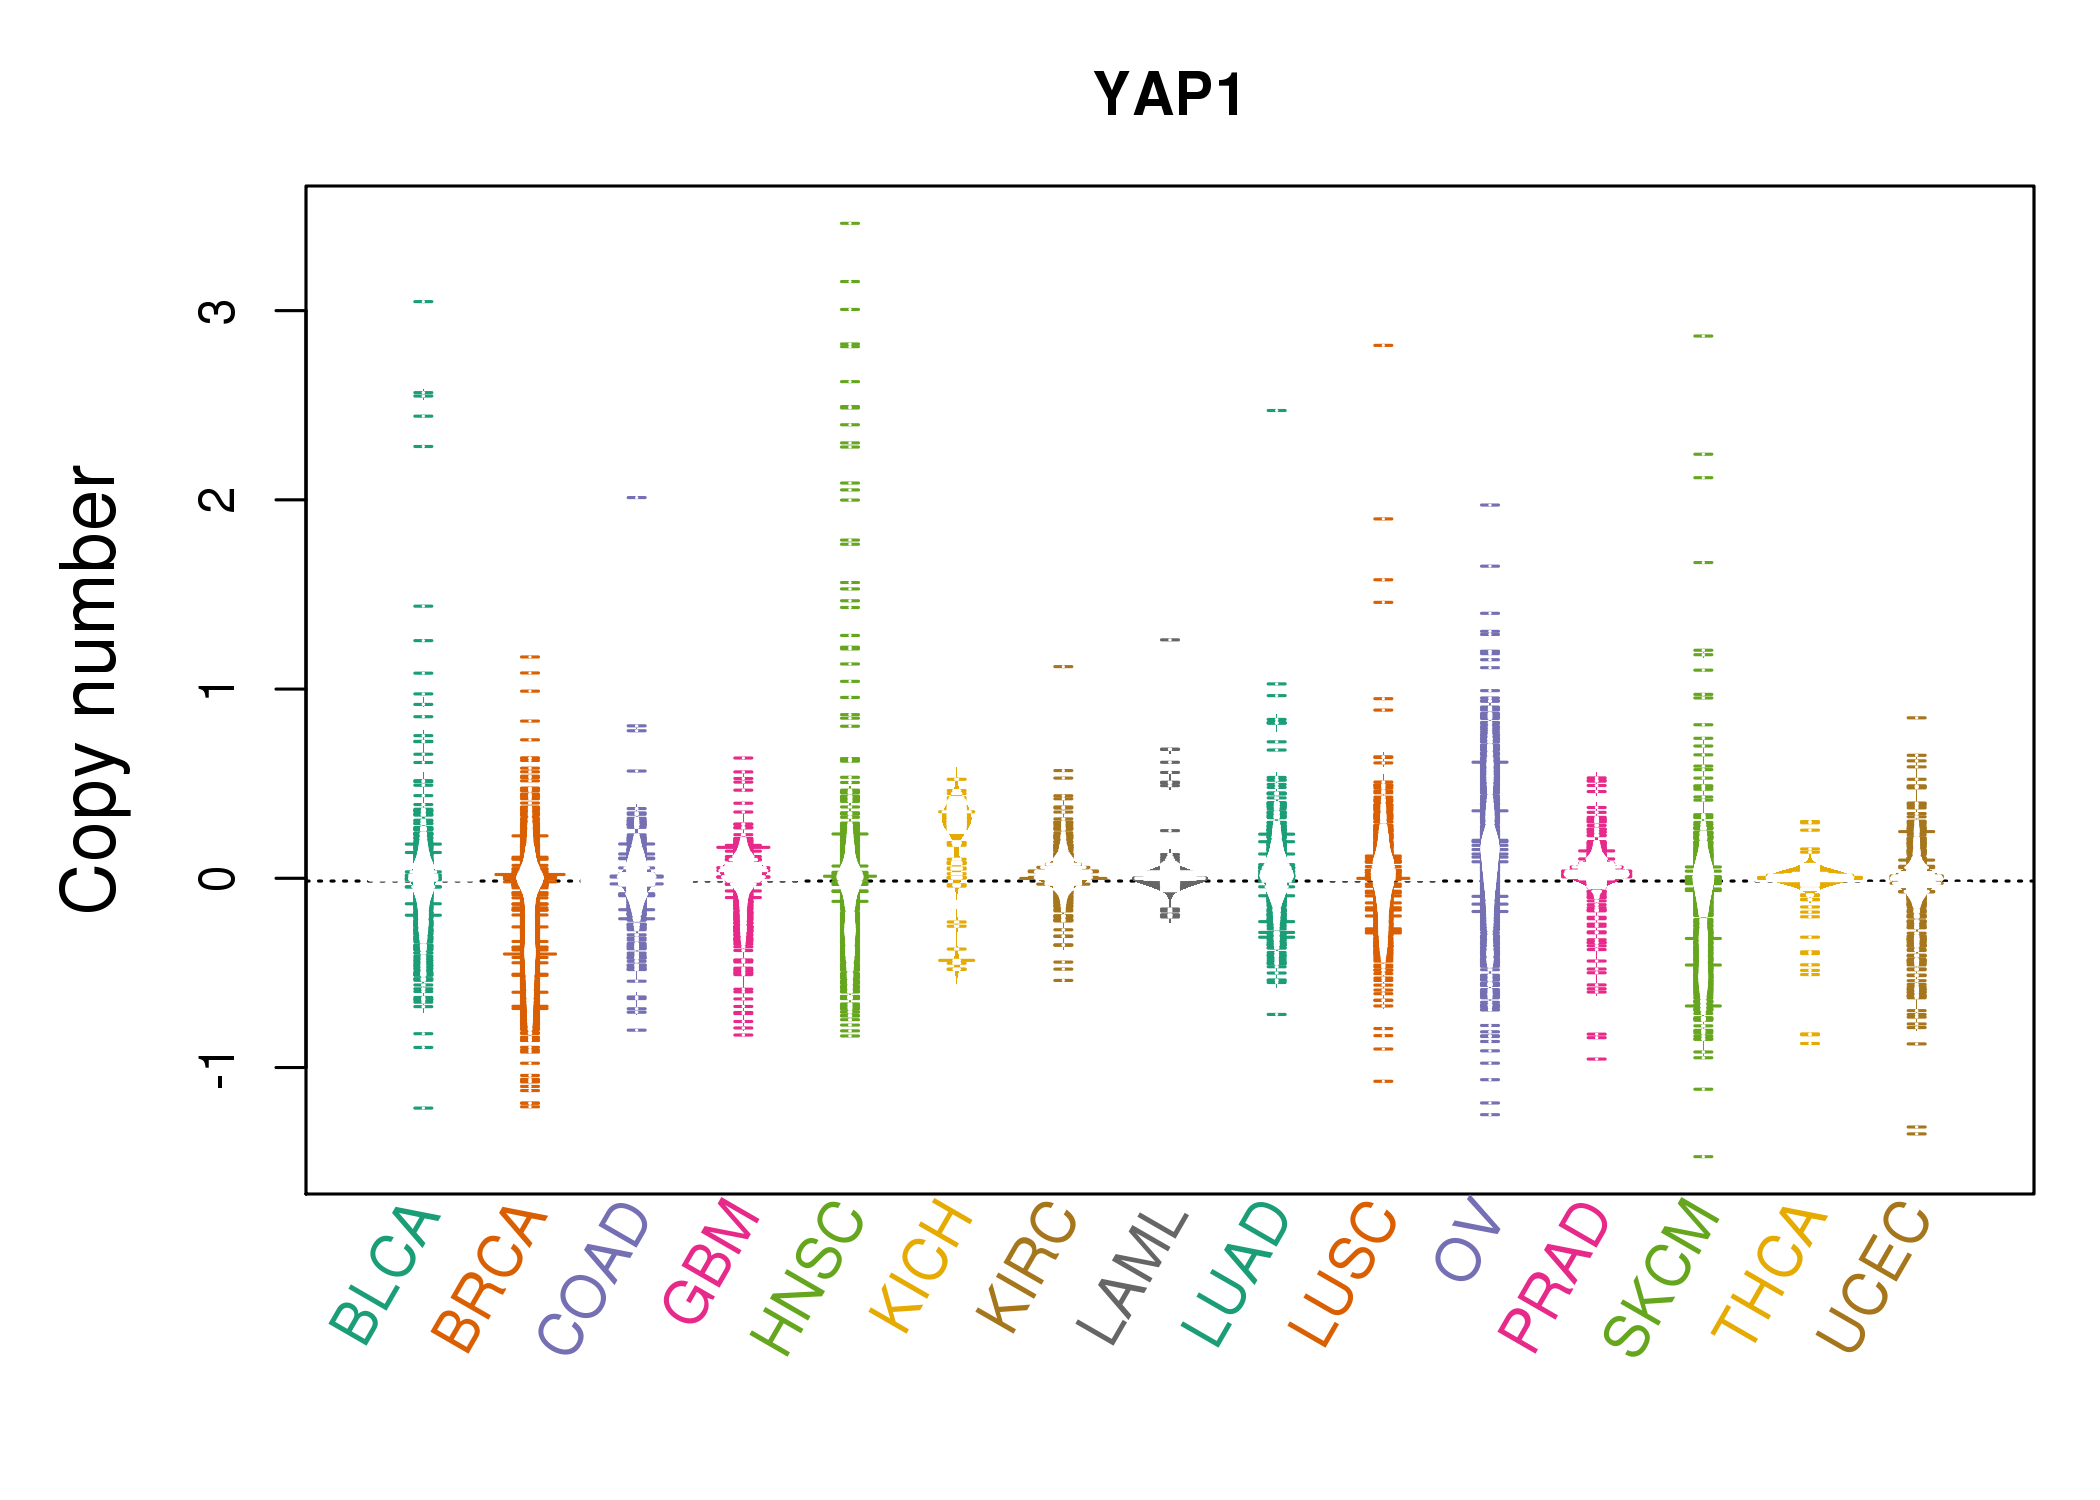 |
| cf) Tissue ID[Tissue type]: BLCA[Bladder Urothelial Carcinoma], BRCA[Breast invasive carcinoma], CESC[Cervical squamous cell carcinoma and endocervical adenocarcinoma], COAD[Colon adenocarcinoma], GBM[Glioblastoma multiforme], Glioma Low Grade, HNSC[Head and Neck squamous cell carcinoma], KICH[Kidney Chromophobe], KIRC[Kidney renal clear cell carcinoma], KIRP[Kidney renal papillary cell carcinoma], LAML[Acute Myeloid Leukemia], LUAD[Lung adenocarcinoma], LUSC[Lung squamous cell carcinoma], OV[Ovarian serous cystadenocarcinoma ], PAAD[Pancreatic adenocarcinoma], PRAD[Prostate adenocarcinoma], SKCM[Skin Cutaneous Melanoma], STAD[Stomach adenocarcinoma], THCA[Thyroid carcinoma], UCEC[Uterine Corpus Endometrial Carcinoma] |
| Top |
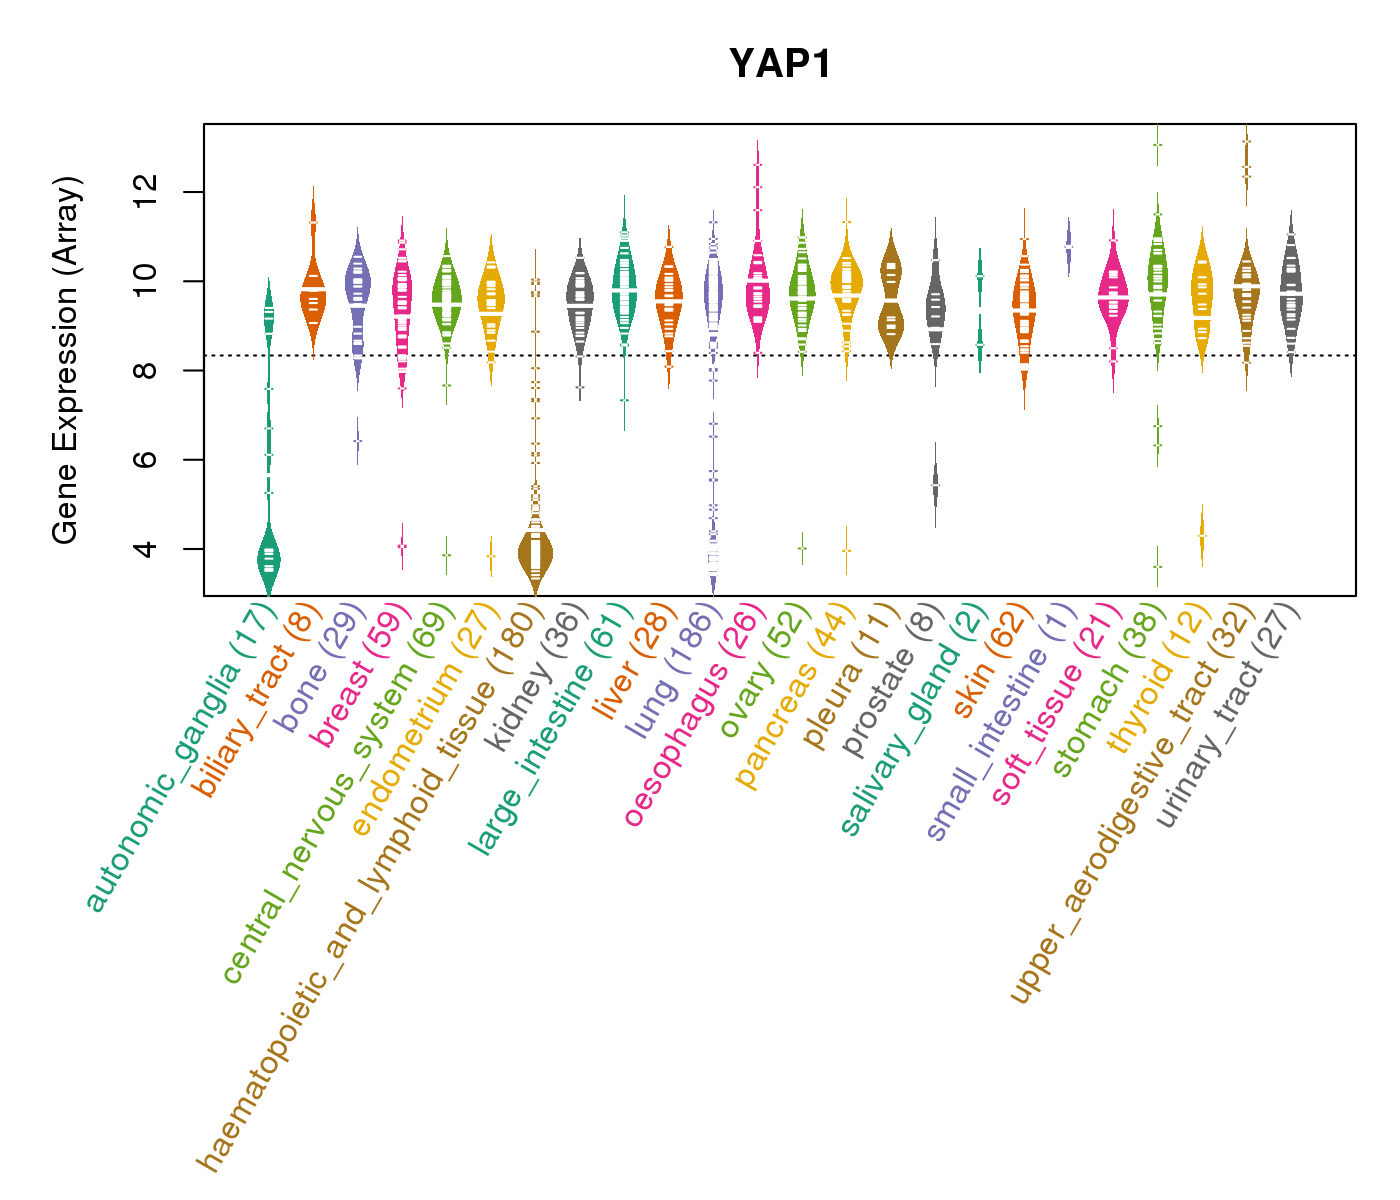
| Gene Expression for YAP1 |
| * CCLE gene expression data were extracted from CCLE_Expression_Entrez_2012-10-18.res: Gene-centric RMA-normalized mRNA expression data. |
 |
| Top |
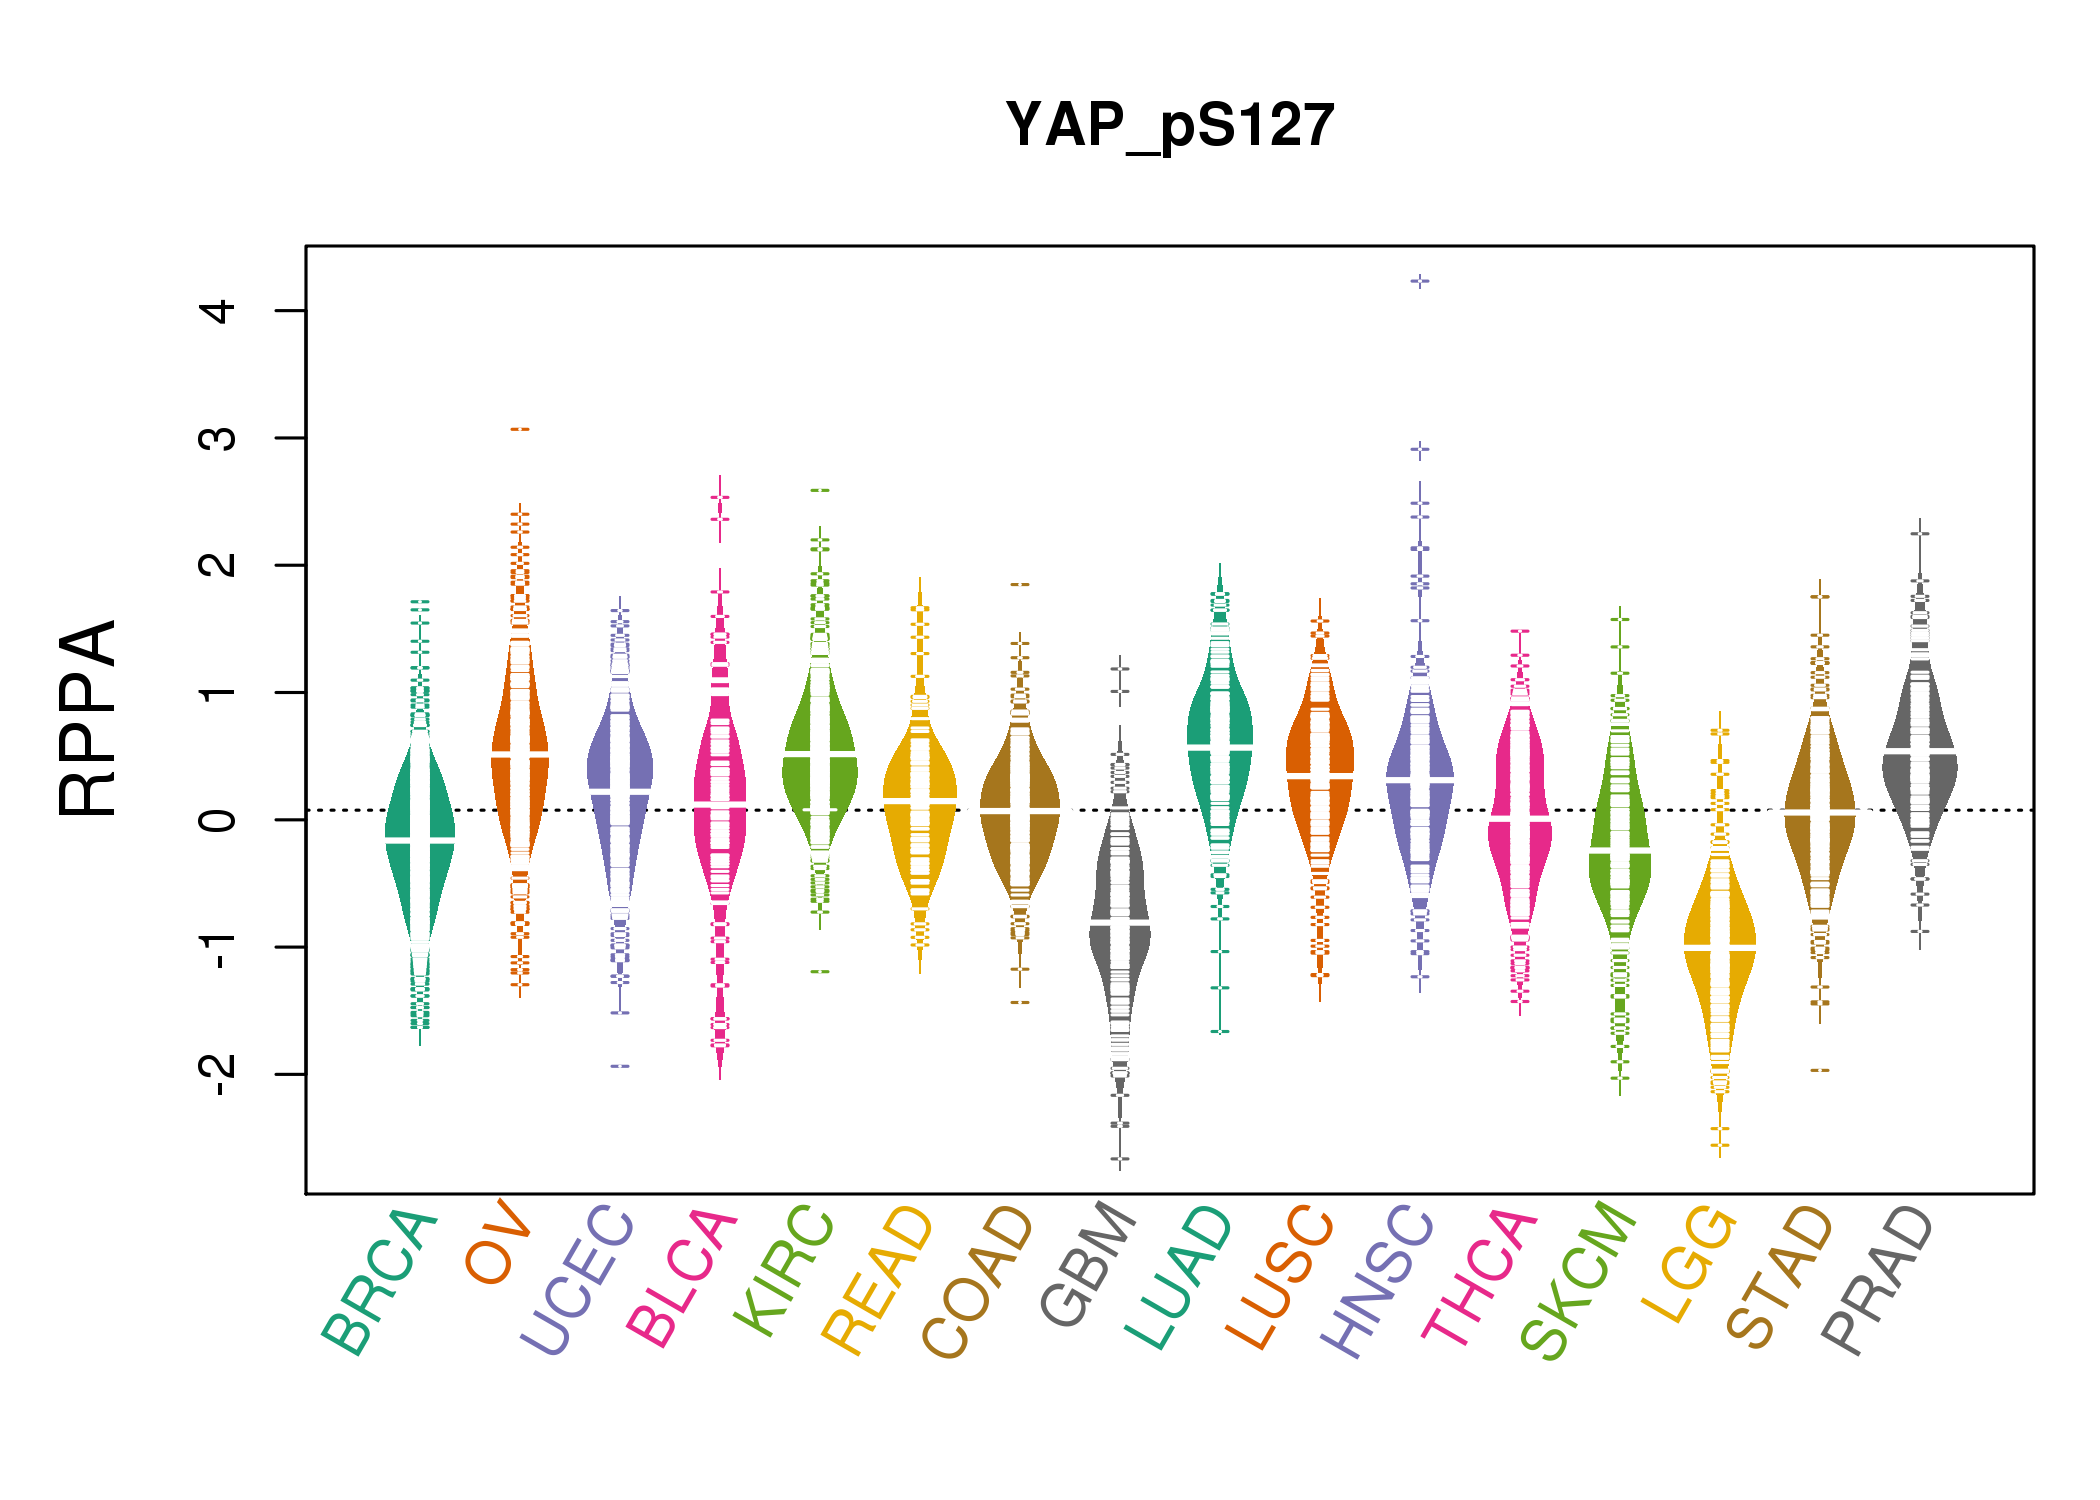
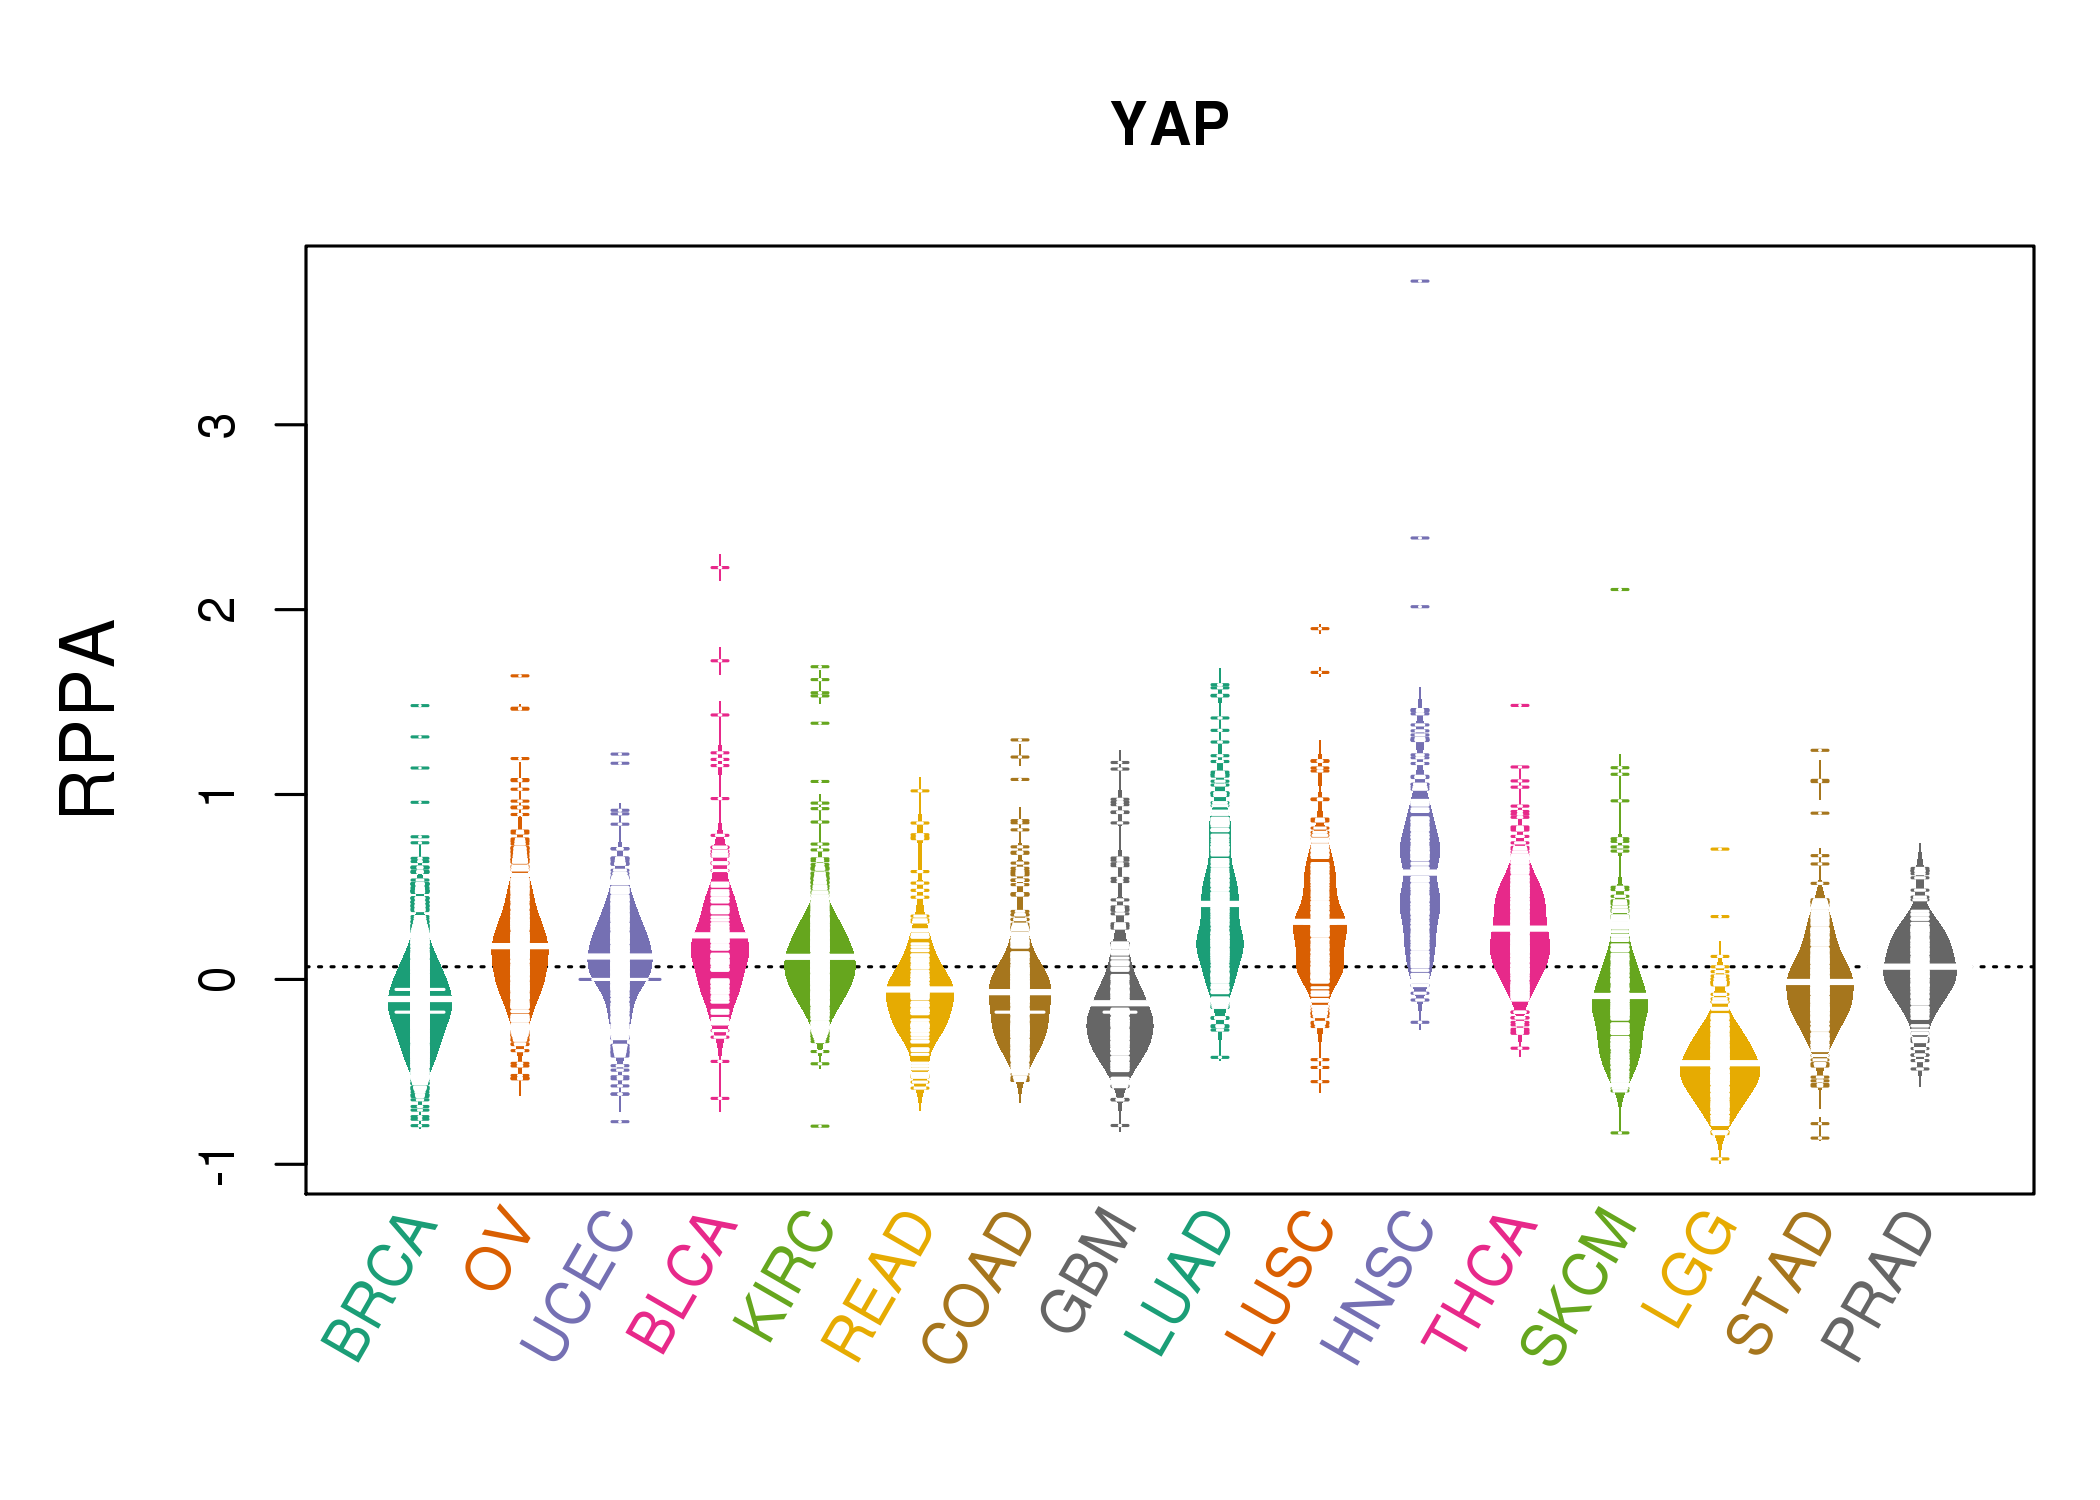
| *RPPA protein expression data were extracted from TCPA (The Cancer Proteome Atlas). Normalized data based on replicated based normalization (RBN) was used to draw following figures. |
 |
 |
| * Normalized gene expression data of RNASeqV2 was extracted from TCGA using R package TCGA-Assembler. The URLs of all public data files on TCGA DCC data server were gathered at Jan-05-2015. Only eight cancer types have enough normal control samples for differential expression analysis. (t test, adjusted p<0.05 (using Benjamini-Hochberg FDR)) |
 |
| Top |
| * This plots show the correlation between CNV and gene expression. |
: Open all plots for all cancer types
 |
|
 |
|

| Top |
| Gene-Gene Network Information |
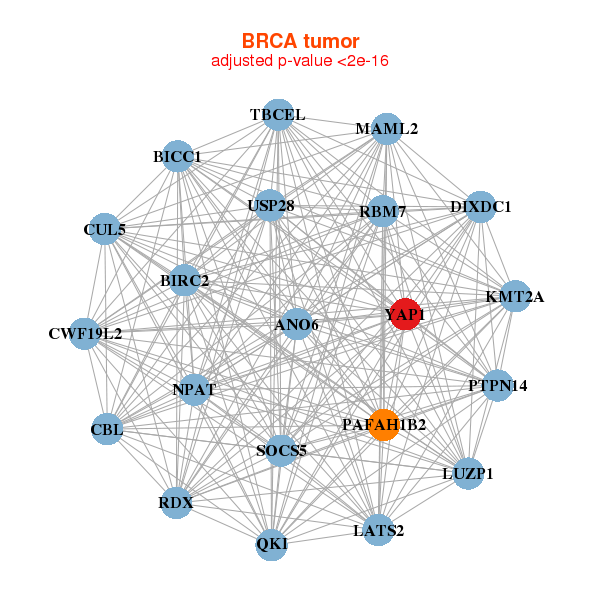
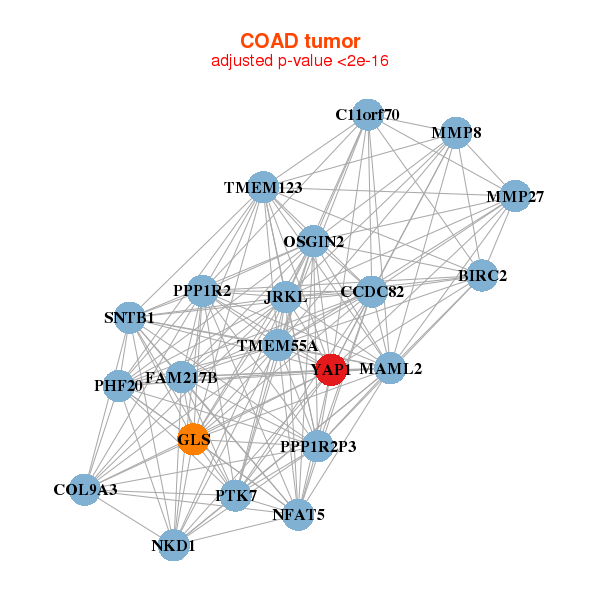
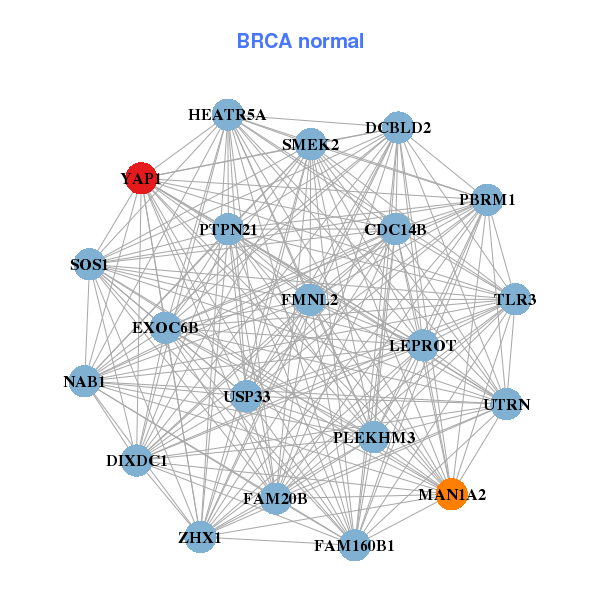
| * Co-Expression network figures were drawn using R package igraph. Only the top 20 genes with the highest correlations were shown. Red circle: input gene, orange circle: cell metabolism gene, sky circle: other gene |
: Open all plots for all cancer types
 |
|
| ANO6,BICC1,BIRC2,CBL,CUL5,CWF19L2,DIXDC1, LATS2,LUZP1,MAML2,KMT2A,NPAT,PAFAH1B2,PTPN14, QKI,RBM7,RDX,SOCS5,TBCEL,USP28,YAP1 | CDC14B,DCBLD2,DIXDC1,EXOC6B,FAM160B1,FAM20B,FMNL2, HEATR5A,LEPROT,MAN1A2,NAB1,PBRM1,PLEKHM3,PTPN21, SMEK2,SOS1,TLR3,USP33,UTRN,YAP1,ZHX1 |
 |
|
| BIRC2,C11orf70,FAM217B,CCDC82,COL9A3,GLS,JRKL, MAML2,MMP27,MMP8,NFAT5,NKD1,OSGIN2,PHF20, PPP1R2,PPP1R2P3,PTK7,SNTB1,TMEM123,TMEM55A,YAP1 | BBX,COL12A1,DIXDC1,DPYSL3,FAM127C,FBXL7,JAM3, JMY,LOXL4,MID2,PBX1,PCDHGB7,PDE2A,RBFOX2, RHOJ,SLC16A2,SLIT2,SMARCA1,TMEM43,TMEM47,YAP1 |
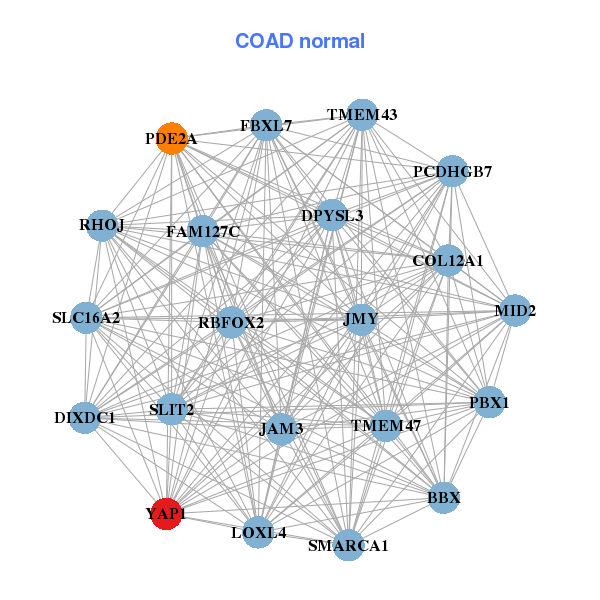
| * Co-Expression network figures were drawn using R package igraph. Only the top 20 genes with the highest correlations were shown. Red circle: input gene, orange circle: cell metabolism gene, sky circle: other gene |
: Open all plots for all cancer types
| Top |
: Open all interacting genes' information including KEGG pathway for all interacting genes from DAVID
| Top |
| Pharmacological Information for YAP1 |
| There's no related Drug. |
| Top |
| Cross referenced IDs for YAP1 |
| * We obtained these cross-references from Uniprot database. It covers 150 different DBs, 18 categories. http://www.uniprot.org/help/cross_references_section |
: Open all cross reference information
|
Copyright © 2016-Present - The Univsersity of Texas Health Science Center at Houston @ |