|
||||||||||||||||||||||||||||||||||||||||||||||||||||||||||||||||||||||||||||||||||||||||||||||||||||||||||||||||||||||||||||||||||||||||||||||||||||||||||||||||||||||||||||||||||||||||||||||||||||||||||||||||||||||||||||||||||||||||||||||||||||||||||||||||||||||||||||||||||||||||||||||||||||||||||||||||||||||||||
| |
| Phenotypic Information (metabolism pathway, cancer, disease, phenome) |
| |
| |
| Gene-Gene Network Information: Co-Expression Network, Interacting Genes & KEGG |
| |
|


| Gene Summary for ACAA2 |
| Top |
| Phenotypic Information for ACAA2(metabolism pathway, cancer, disease, phenome) |
| Cancer | CGAP: ACAA2 |
| Familial Cancer Database: ACAA2 | |
| * This gene is included in those cancer gene databases. |
|
|
|
|
|
|
| ||||||||||||||||||||||||||||||||||||||||||||||||||||||||||||||||||||||||||||||||||||||||||||||||||||||||||||||||||||||||||||||||||||||||||||||||||||||||||||||||||||||||||||||||||||||||||||||||||||||||||||||||||||||||||||||||||||||||||||||||||||||||||||||||||||||||||||||||||||||||||||||||||||||||||||||||||||
Oncogene 1 | Significant driver gene in | |||||||||||||||||||||||||||||||||||||||||||||||||||||||||||||||||||||||||||||||||||||||||||||||||||||||||||||||||||||||||||||||||||||||||||||||||||||||||||||||||||||||||||||||||||||||||||||||||||||||||||||||||||||||||||||||||||||||||||||||||||||||||||||||||||||||||||||||||||||||||||||||||||||||||||||||||||||||||
| cf) number; DB name 1 Oncogene; http://nar.oxfordjournals.org/content/35/suppl_1/D721.long, 2 Tumor Suppressor gene; https://bioinfo.uth.edu/TSGene/, 3 Cancer Gene Census; http://www.nature.com/nrc/journal/v4/n3/abs/nrc1299.html, 4 CancerGenes; http://nar.oxfordjournals.org/content/35/suppl_1/D721.long, 5 Network of Cancer Gene; http://ncg.kcl.ac.uk/index.php, 1Therapeutic Vulnerabilities in Cancer; http://cbio.mskcc.org/cancergenomics/statius/ |
| KEGG_FATTY_ACID_METABOLISM | |
| OMIM | |
| Orphanet | |
| Disease | KEGG Disease: ACAA2 |
| MedGen: ACAA2 (Human Medical Genetics with Condition) | |
| ClinVar: ACAA2 | |
| Phenotype | MGI: ACAA2 (International Mouse Phenotyping Consortium) |
| PhenomicDB: ACAA2 | |
| Mutations for ACAA2 |
| * Under tables are showing count per each tissue to give us broad intuition about tissue specific mutation patterns.You can go to the detailed page for each mutation database's web site. |
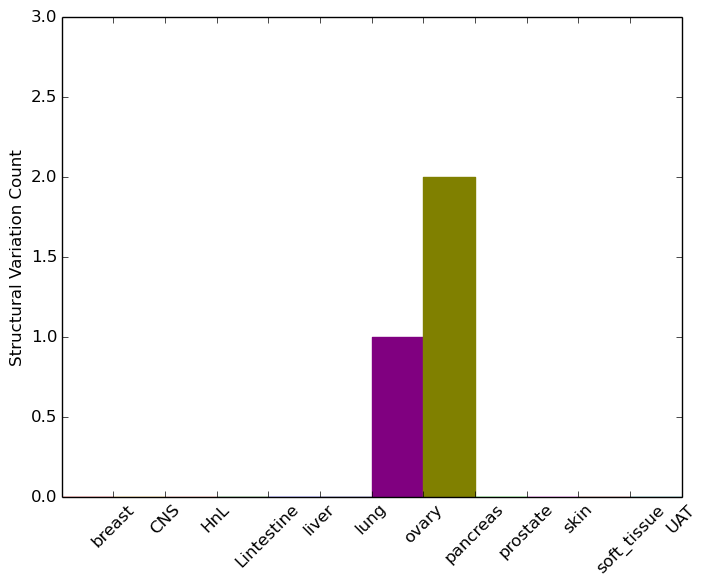
| - Statistics for Tissue and Mutation type | Top |
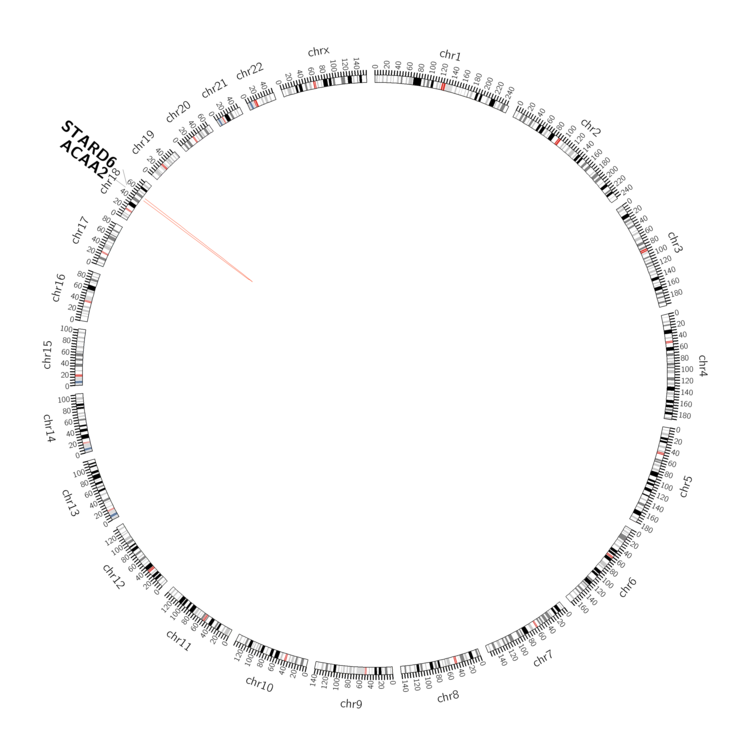 |
| - For Inter-chromosomal Variations |
| There's no inter-chromosomal structural variation. |
| - For Intra-chromosomal Variations |
| * Intra-chromosomal variantions includes 'intrachromosomal amplicon to amplicon', 'intrachromosomal amplicon to non-amplified dna', 'intrachromosomal deletion', 'intrachromosomal fold-back inversion', 'intrachromosomal inversion', 'intrachromosomal tandem duplication', 'Intrachromosomal unknown type', 'intrachromosomal with inverted orientation', 'intrachromosomal with non-inverted orientation'. |
 |
| Sample | Symbol_a | Chr_a | Start_a | End_a | Symbol_b | Chr_b | Start_b | End_b |
| ovary | ACAA2 | chr18 | 47337305 | 47337325 | STARD6 | chr18 | 51868789 | 51868809 |
| pancreas | ACAA2 | chr18 | 47337305 | 47337325 | STARD6 | chr18 | 51868784 | 51868804 |
| pancreas | ACAA2 | chr18 | 47337305 | 47337325 | STARD6 | chr18 | 51868789 | 51868809 |
| cf) Tissue number; Tissue name (1;Breast, 2;Central_nervous_system, 3;Haematopoietic_and_lymphoid_tissue, 4;Large_intestine, 5;Liver, 6;Lung, 7;Ovary, 8;Pancreas, 9;Prostate, 10;Skin, 11;Soft_tissue, 12;Upper_aerodigestive_tract) |
| * From mRNA Sanger sequences, Chitars2.0 arranged chimeric transcripts. This table shows ACAA2 related fusion information. |
| ID | Head Gene | Tail Gene | Accession | Gene_a | qStart_a | qEnd_a | Chromosome_a | tStart_a | tEnd_a | Gene_a | qStart_a | qEnd_a | Chromosome_a | tStart_a | tEnd_a |
| BE842124 | ACAA2 | 13 | 144 | 18 | 47313702 | 47317942 | SMG1 | 137 | 409 | 16 | 18845615 | 18846340 | |
| BQ328229 | MAML1 | 18 | 302 | 5 | 179202226 | 179202513 | ACAA2 | 294 | 650 | 18 | 47310069 | 47311692 | |
| DA908810 | CXorf38 | 1 | 353 | X | 40506259 | 40506774 | ACAA2 | 352 | 555 | 18 | 47322179 | 47323966 | |
| AV688387 | ACAA2 | 1 | 438 | 18 | 47322176 | 47339910 | LOC100505989 | 427 | 449 | 4 | 165698716 | 165698741 | |
| Top |
| Mutation type/ Tissue ID | brca | cns | cerv | endome | haematopo | kidn | Lintest | liver | lung | ns | ovary | pancre | prost | skin | stoma | thyro | urina | |||
| Total # sample | 1 | |||||||||||||||||||
| GAIN (# sample) | 1 | |||||||||||||||||||
| LOSS (# sample) |
| cf) Tissue ID; Tissue type (1; Breast, 2; Central_nervous_system, 3; Cervix, 4; Endometrium, 5; Haematopoietic_and_lymphoid_tissue, 6; Kidney, 7; Large_intestine, 8; Liver, 9; Lung, 10; NS, 11; Ovary, 12; Pancreas, 13; Prostate, 14; Skin, 15; Stomach, 16; Thyroid, 17; Urinary_tract) |
| Top |
|
 |
| Top |
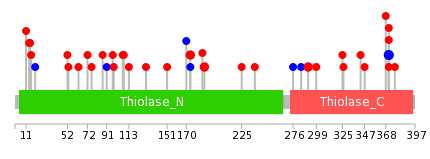
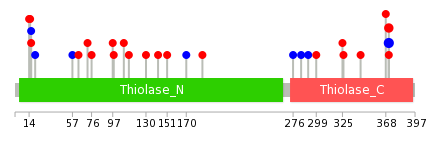
| Stat. for Non-Synonymous SNVs (# total SNVs=28) | (# total SNVs=7) |
 |  |
(# total SNVs=0) | (# total SNVs=0) |
| Top |
| * When you move the cursor on each content, you can see more deailed mutation information on the Tooltip. Those are primary_site,primary_histology,mutation(aa),pubmedID. |
| GRCh37 position | Mutation(aa) | Unique sampleID count |
| chr18:47310298-47310298 | p.R371R | 3 |
| chr18:47317852-47317852 | p.I291V | 2 |
| chr18:47310299-47310299 | p.R371H | 2 |
| chr18:47320663-47320663 | p.Q188H | 2 |
| chr18:47320707-47320707 | p.I174V | 2 |
| chr18:47311703-47311703 | p.P325S | 1 |
| chr18:47329209-47329209 | p.A11S | 1 |
| chr18:47320717-47320717 | p.V170V | 1 |
| chr18:47323934-47323934 | p.H72D | 1 |
| chr18:47313719-47313719 | p.A299V | 1 |
| Top |
|
 |
| Point Mutation/ Tissue ID | 1 | 2 | 3 | 4 | 5 | 6 | 7 | 8 | 9 | 10 | 11 | 12 | 13 | 14 | 15 | 16 | 17 | 18 | 19 | 20 |
| # sample | 1 | 2 | 8 | 1 | 3 | 1 | 1 | 5 | 4 | 3 | ||||||||||
| # mutation | 1 | 2 | 6 | 1 | 3 | 1 | 1 | 5 | 4 | 3 | ||||||||||
| nonsynonymous SNV | 1 | 2 | 4 | 1 | 2 | 1 | 1 | 2 | 3 | 3 | ||||||||||
| synonymous SNV | 2 | 1 | 3 | 1 |
| cf) Tissue ID; Tissue type (1; BLCA[Bladder Urothelial Carcinoma], 2; BRCA[Breast invasive carcinoma], 3; CESC[Cervical squamous cell carcinoma and endocervical adenocarcinoma], 4; COAD[Colon adenocarcinoma], 5; GBM[Glioblastoma multiforme], 6; Glioma Low Grade, 7; HNSC[Head and Neck squamous cell carcinoma], 8; KICH[Kidney Chromophobe], 9; KIRC[Kidney renal clear cell carcinoma], 10; KIRP[Kidney renal papillary cell carcinoma], 11; LAML[Acute Myeloid Leukemia], 12; LUAD[Lung adenocarcinoma], 13; LUSC[Lung squamous cell carcinoma], 14; OV[Ovarian serous cystadenocarcinoma ], 15; PAAD[Pancreatic adenocarcinoma], 16; PRAD[Prostate adenocarcinoma], 17; SKCM[Skin Cutaneous Melanoma], 18:STAD[Stomach adenocarcinoma], 19:THCA[Thyroid carcinoma], 20:UCEC[Uterine Corpus Endometrial Carcinoma]) |
| Top |
| * We represented just top 10 SNVs. When you move the cursor on each content, you can see more deailed mutation information on the Tooltip. Those are primary_site, primary_histology, mutation(aa), pubmedID. |
| Genomic Position | Mutation(aa) | Unique sampleID count |
| chr18:47310298 | p.R371R | 3 |
| chr18:47310300 | p.R371C | 2 |
| chr18:47317850 | p.S151L | 1 |
| chr18:47323859 | p.I142M | 1 |
| chr18:47317871 | p.R130T | 1 |
| chr18:47323922 | p.V113G | 1 |
| chr18:47317897 | p.R371P | 1 |
| chr18:47323934 | p.V108A | 1 |
| chr18:47320670 | p.S98P | 1 |
| chr18:47323960 | p.E368K | 1 |
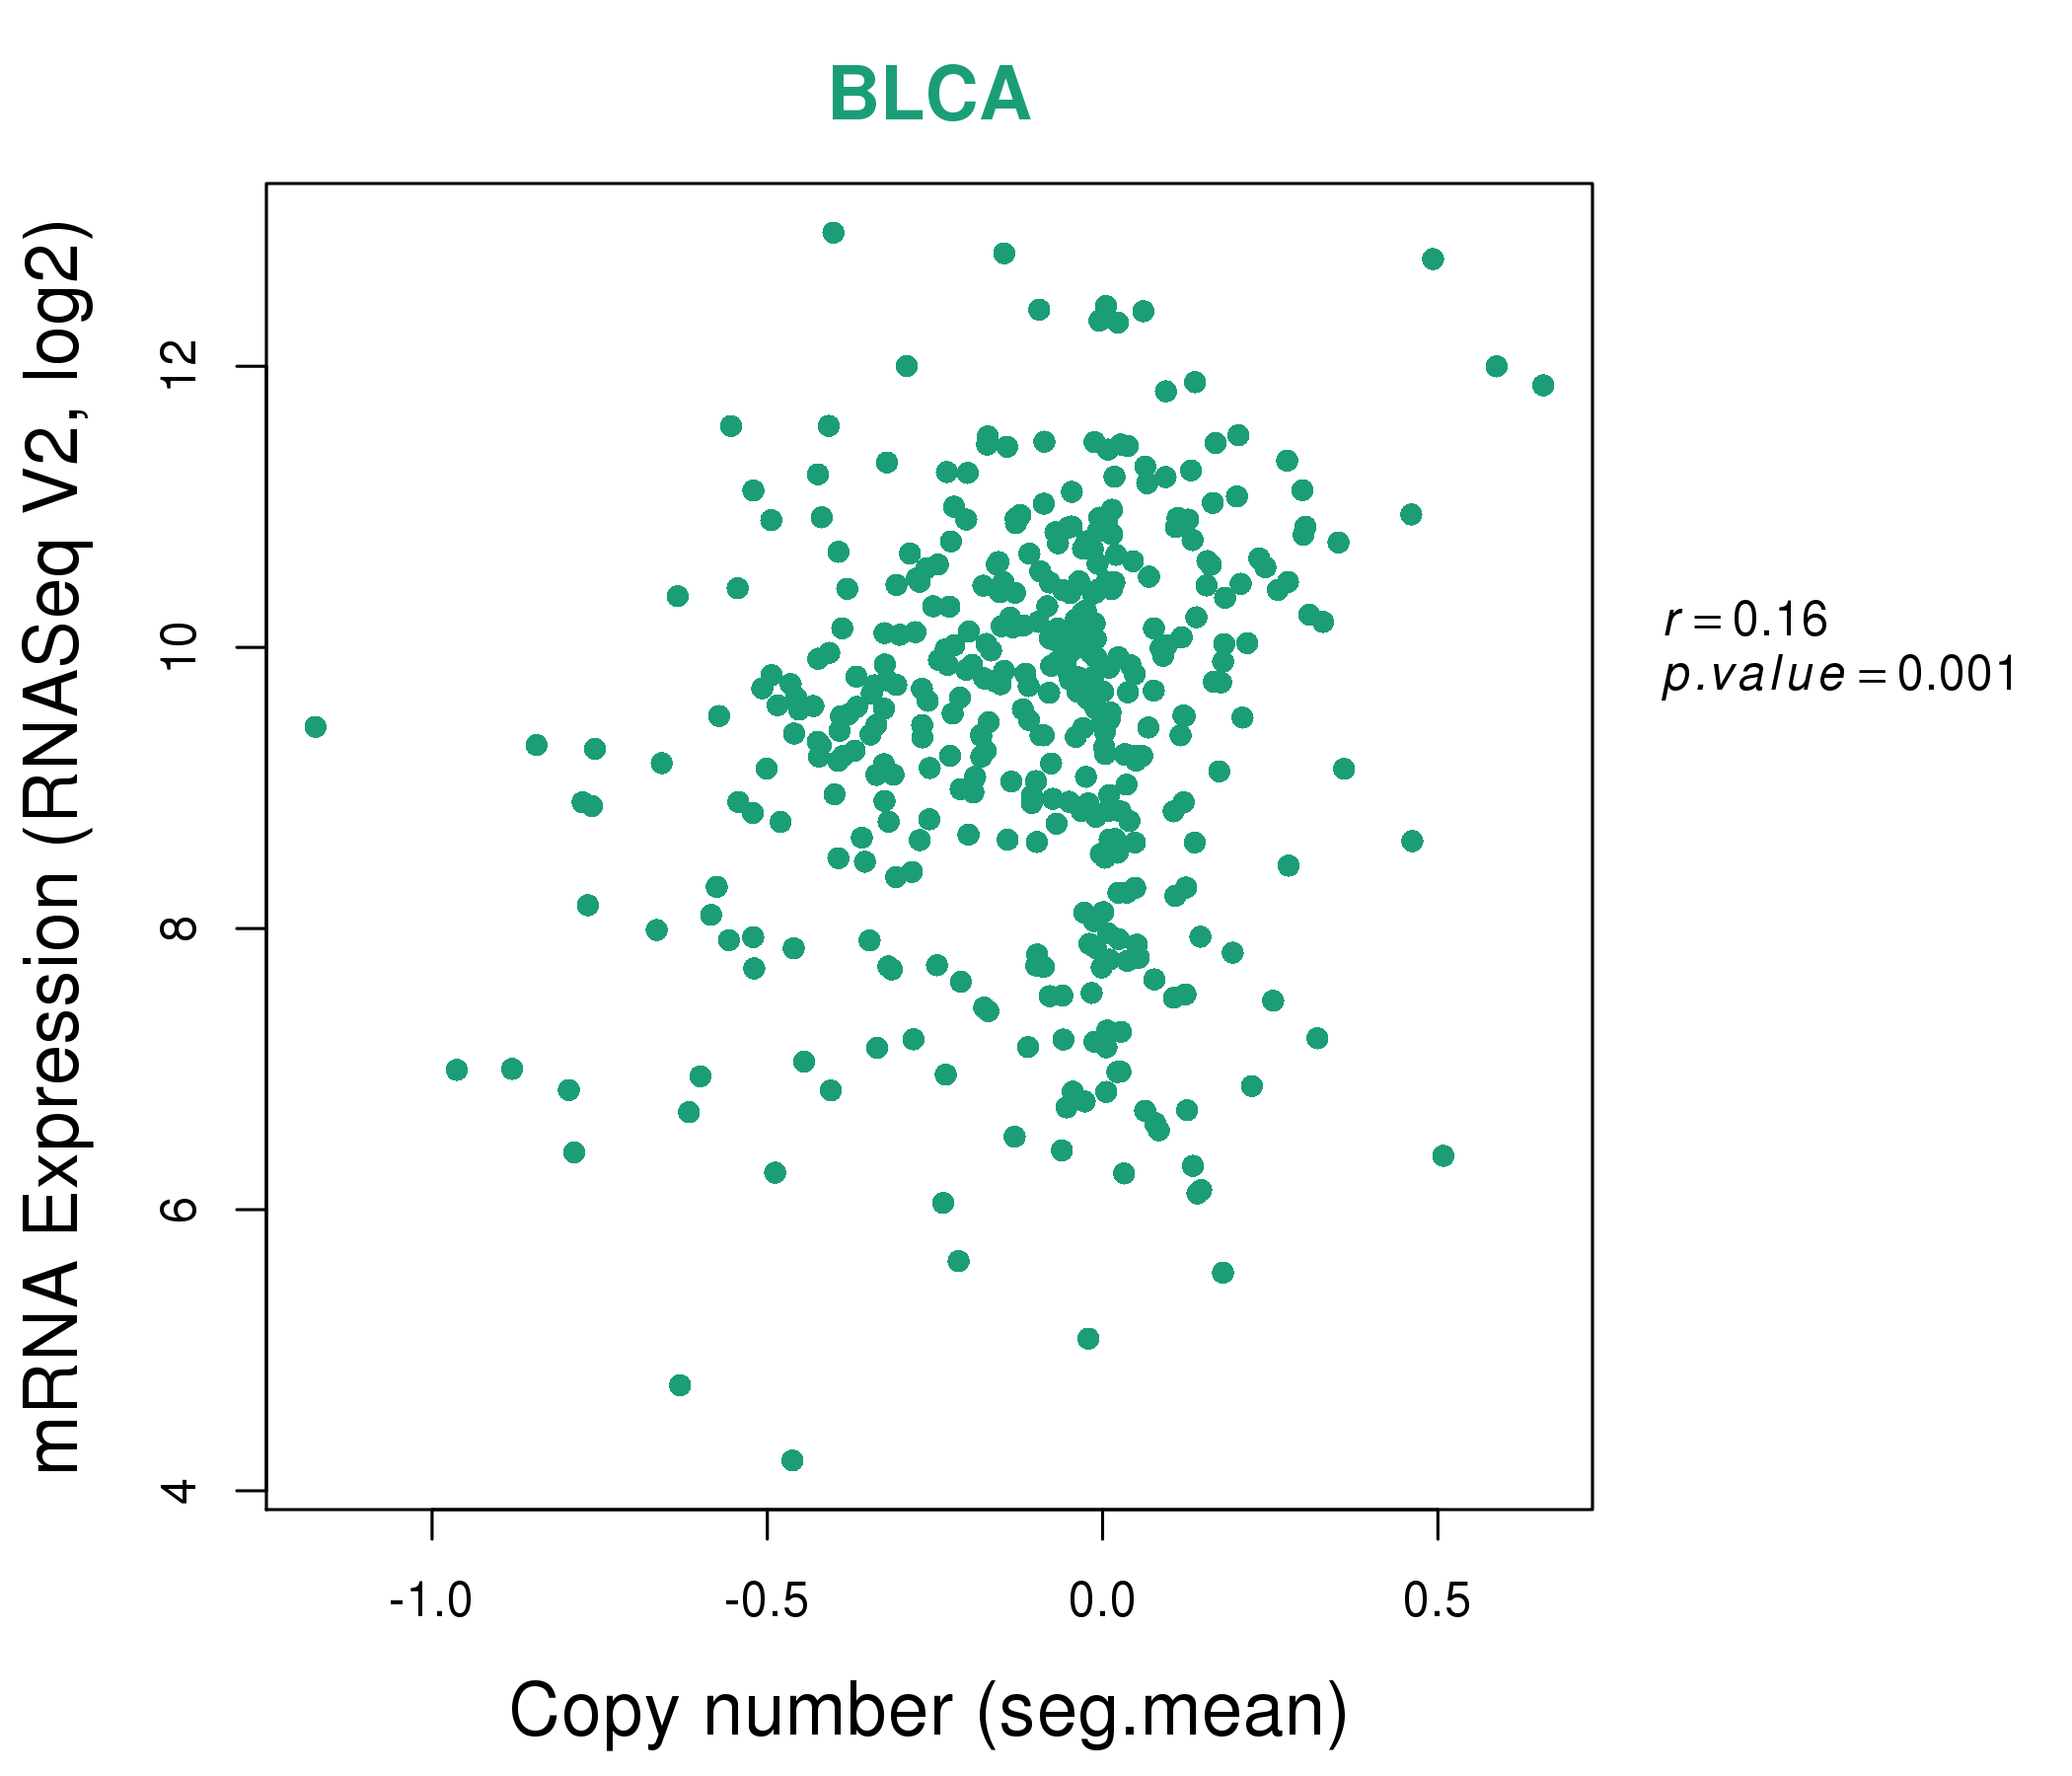
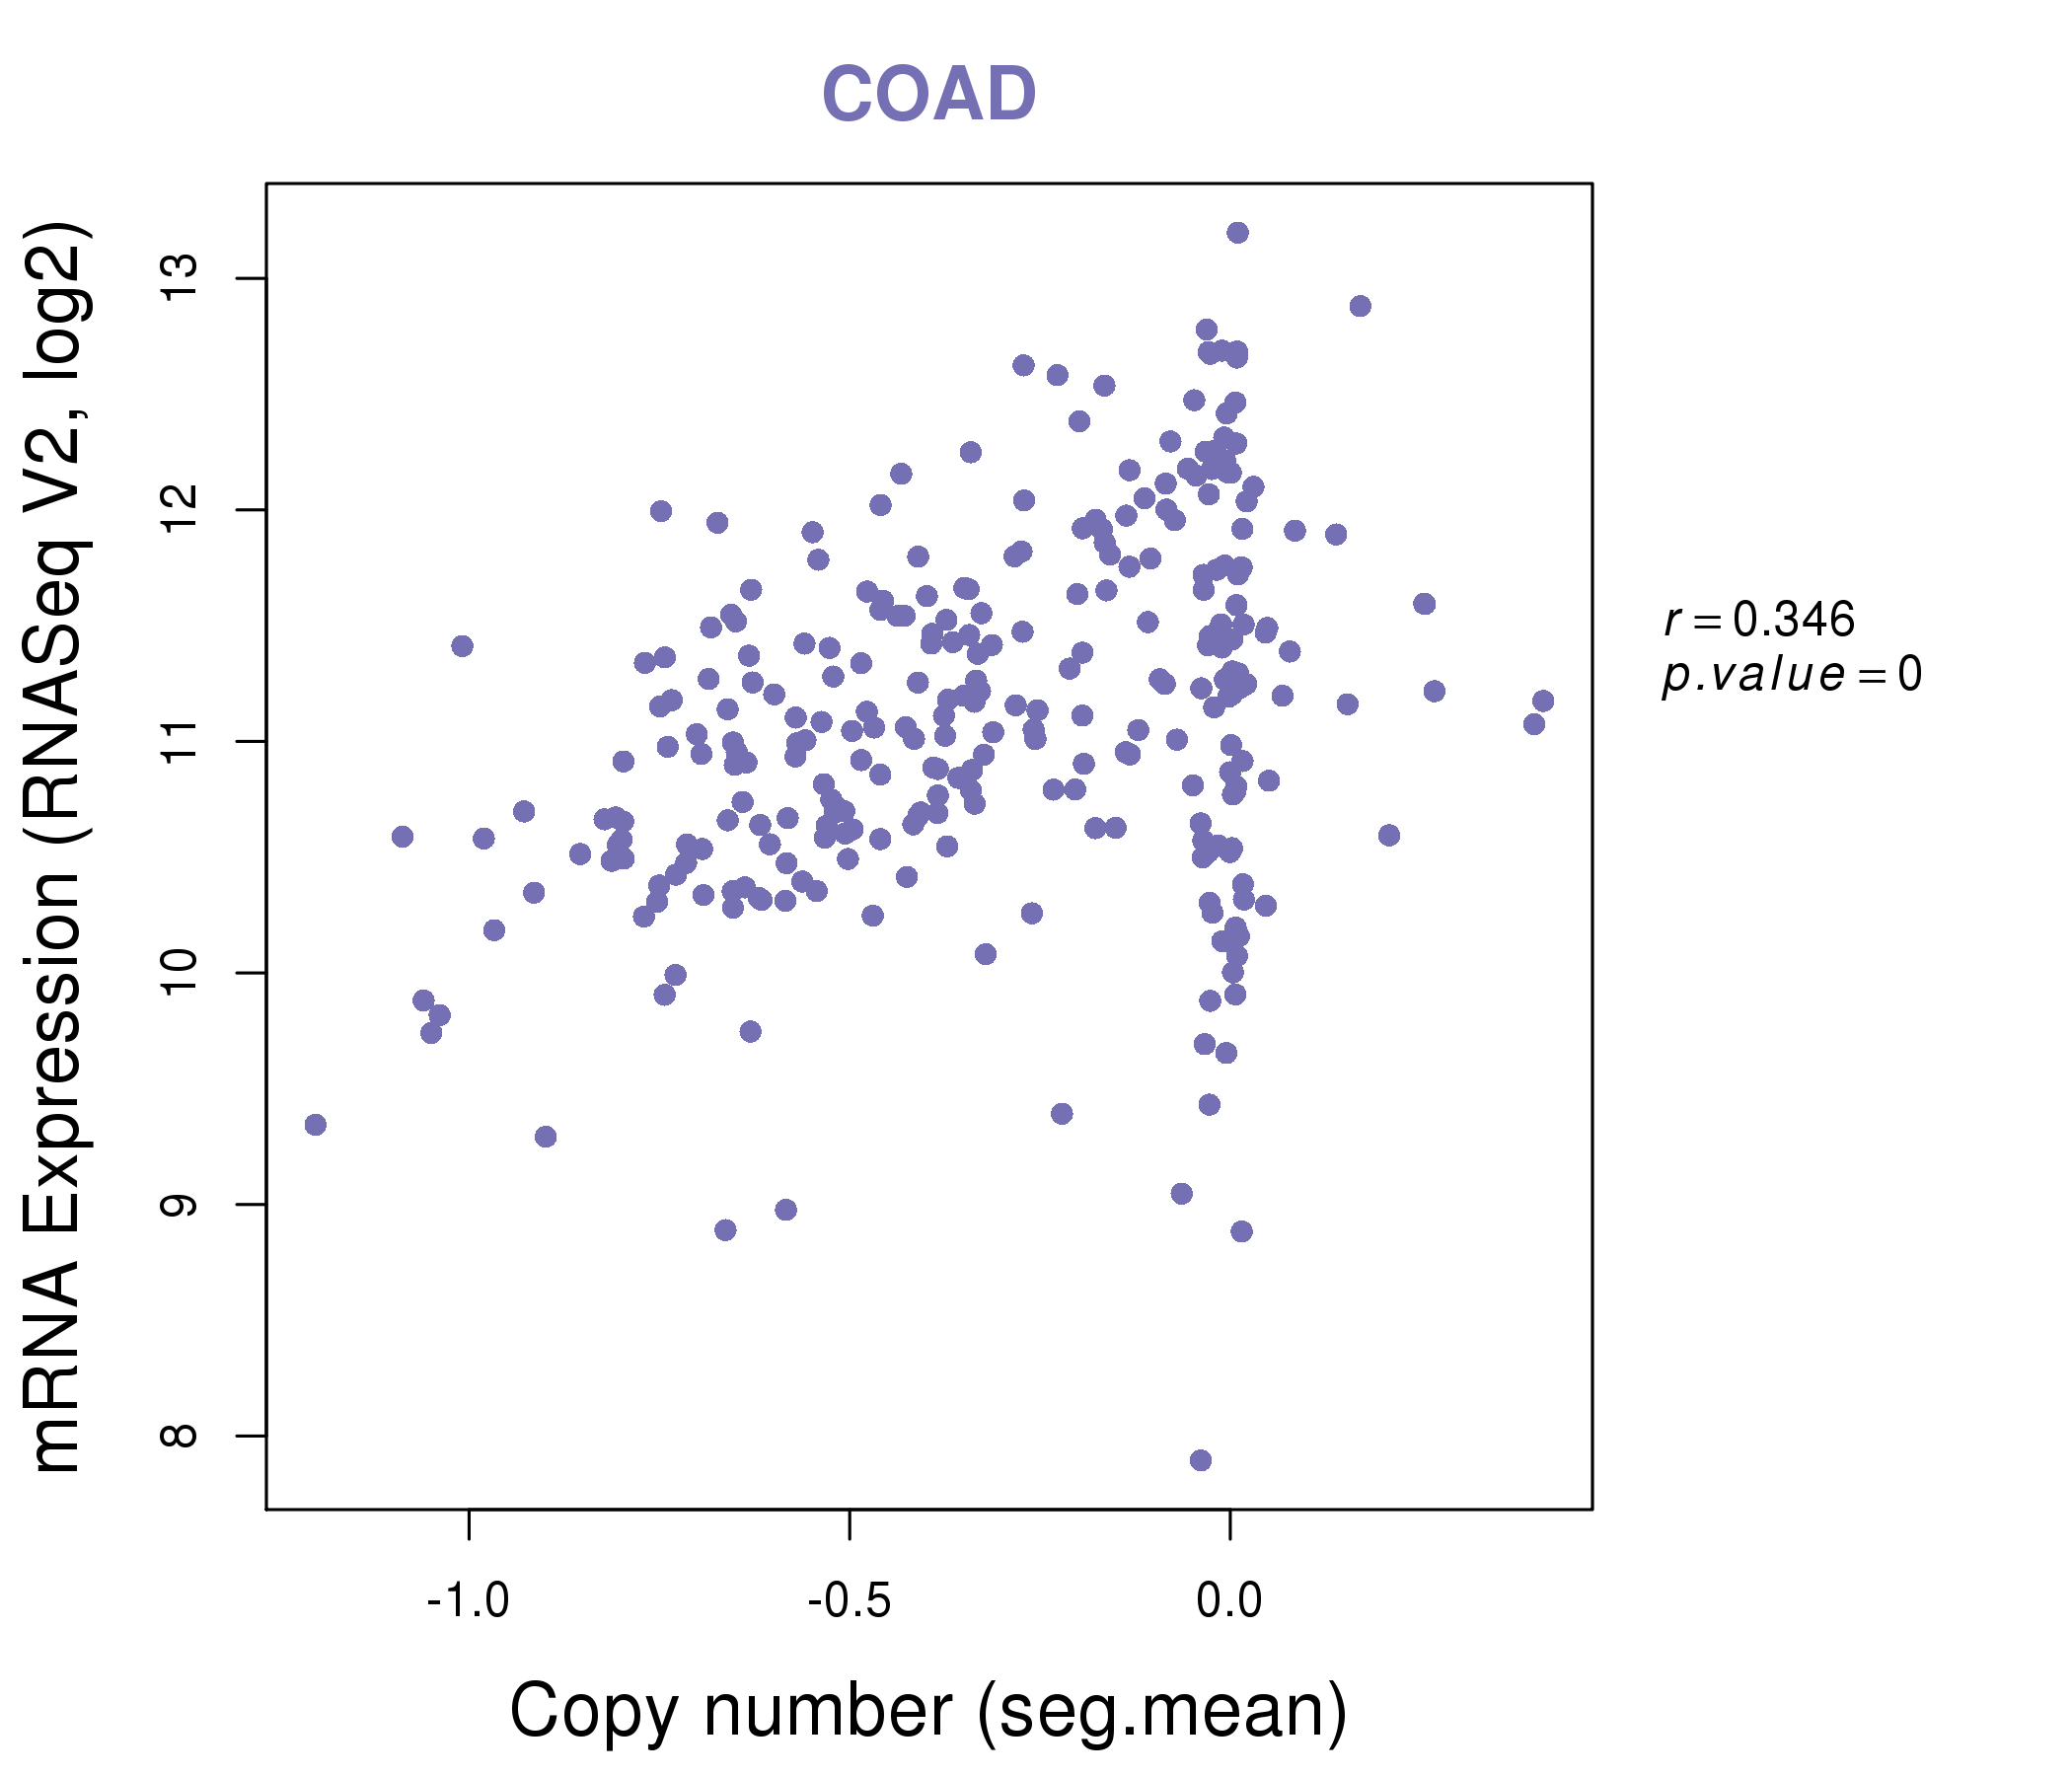
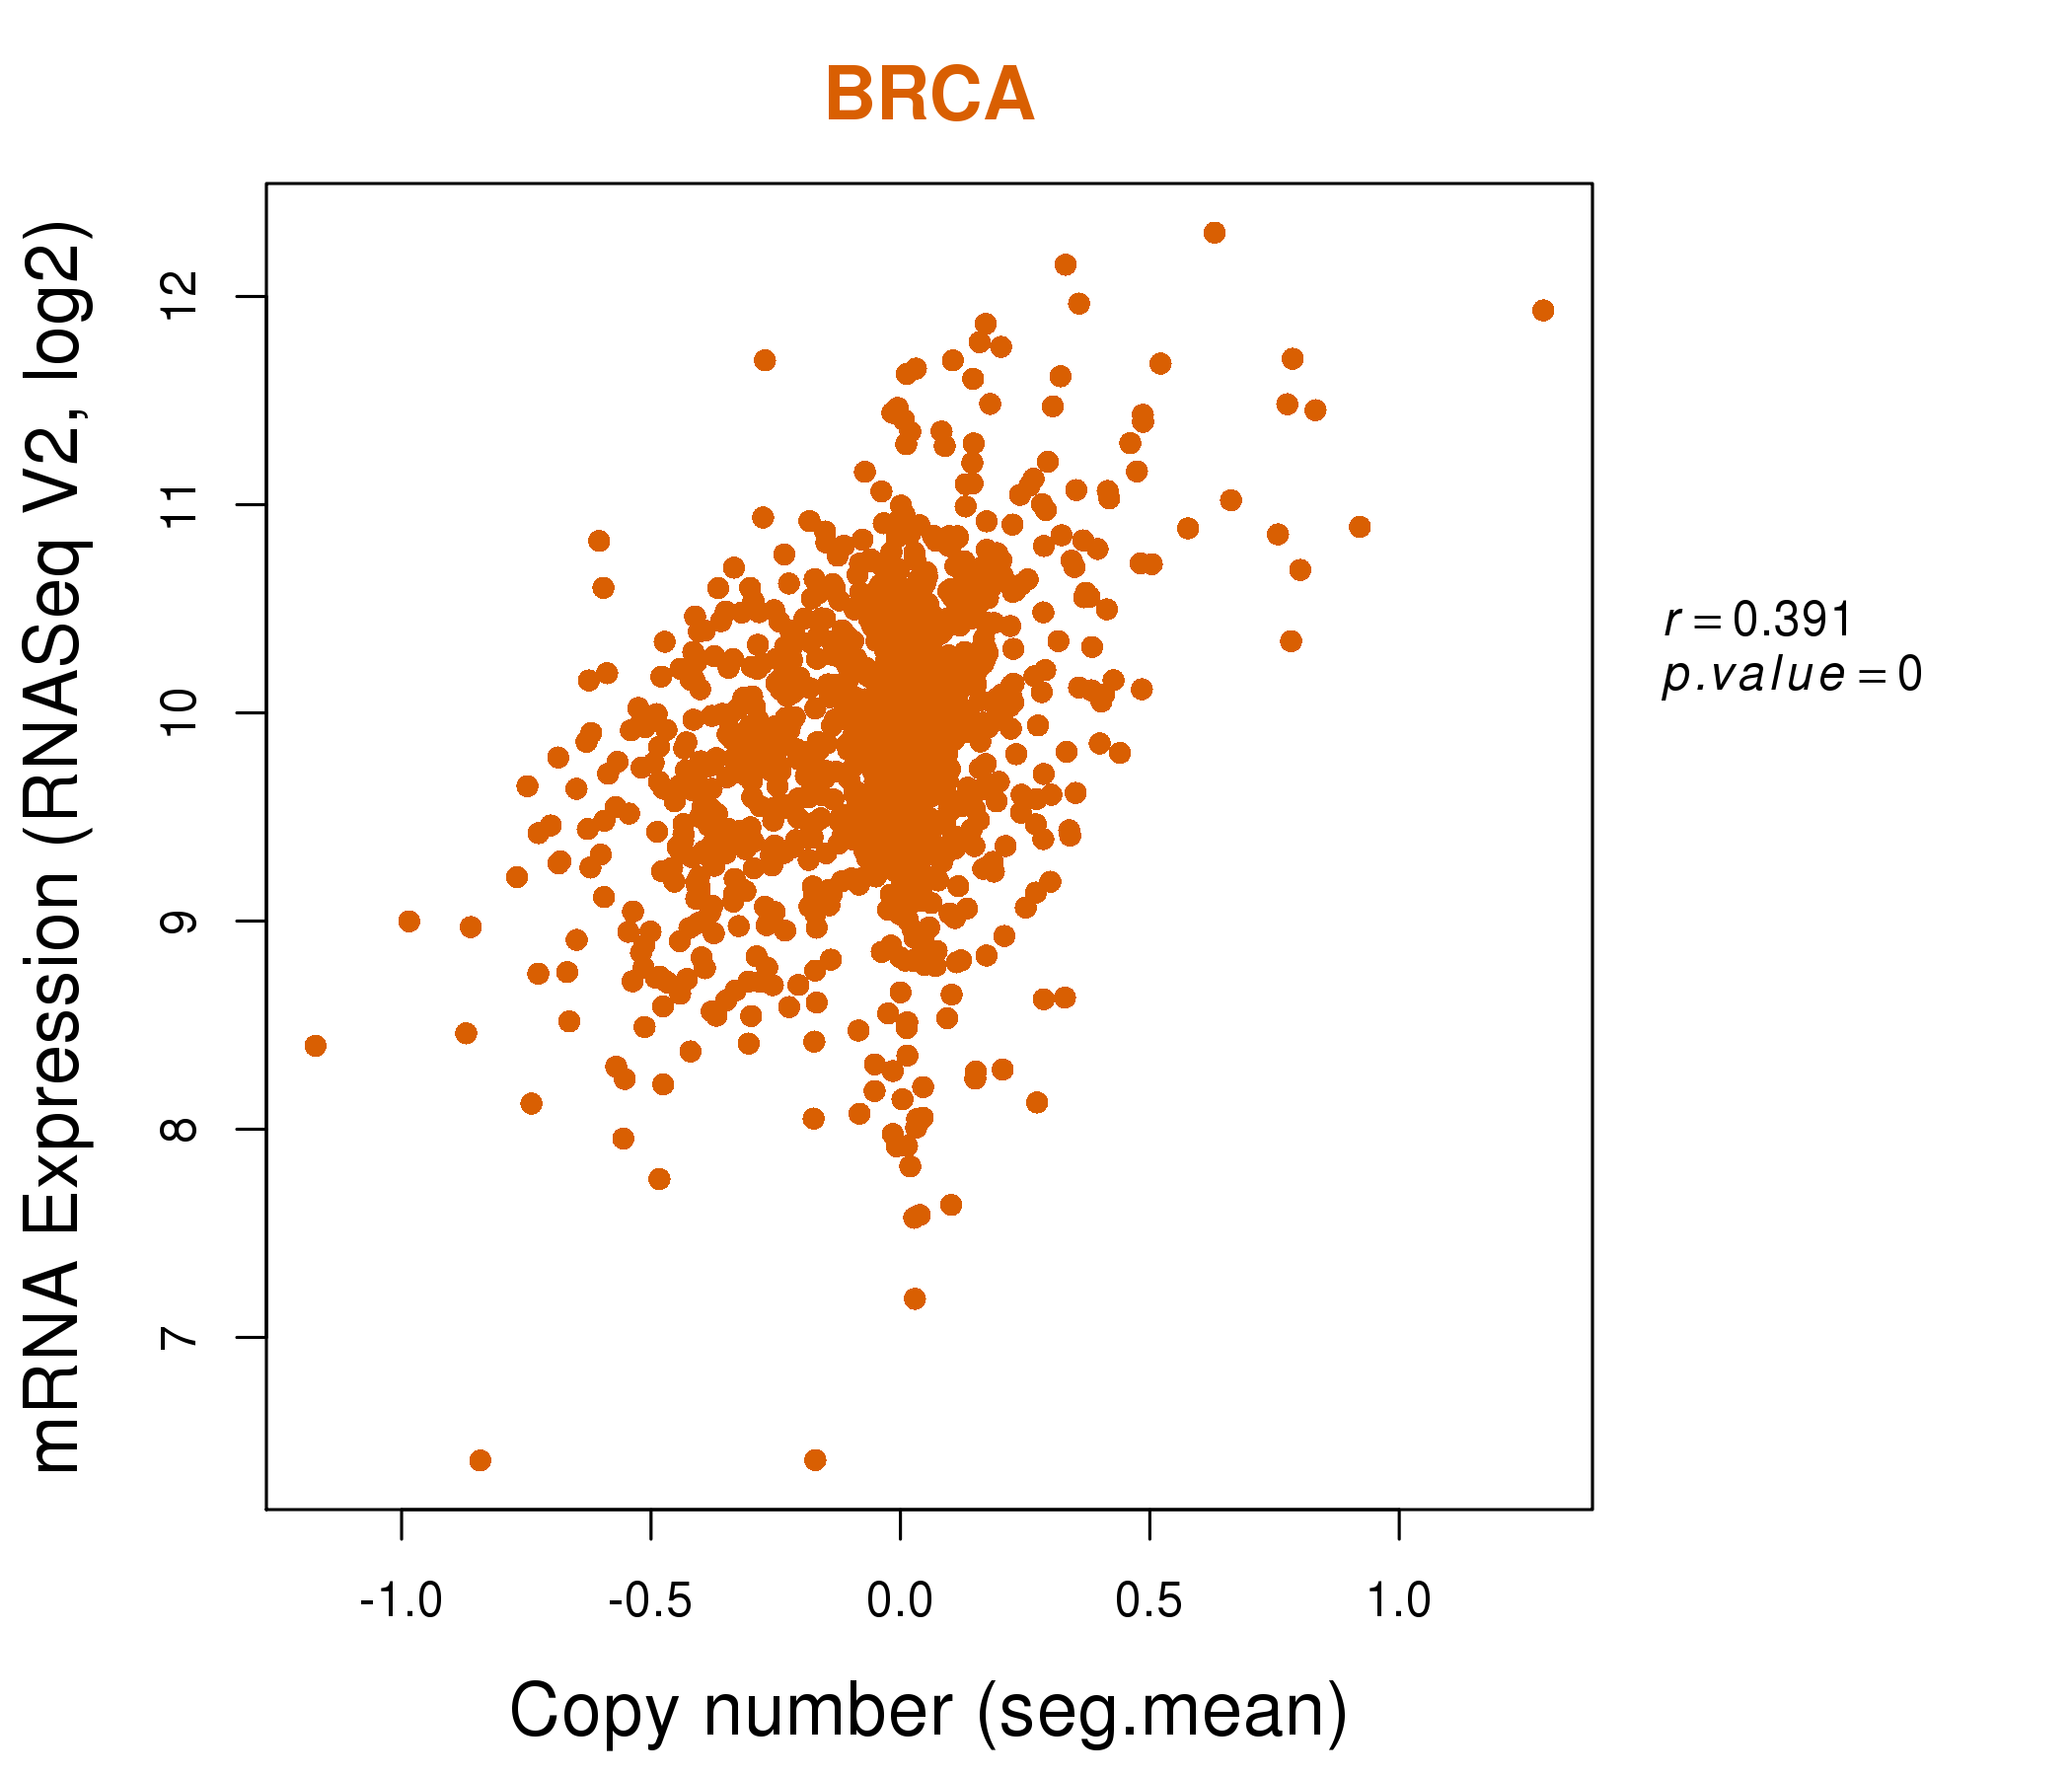
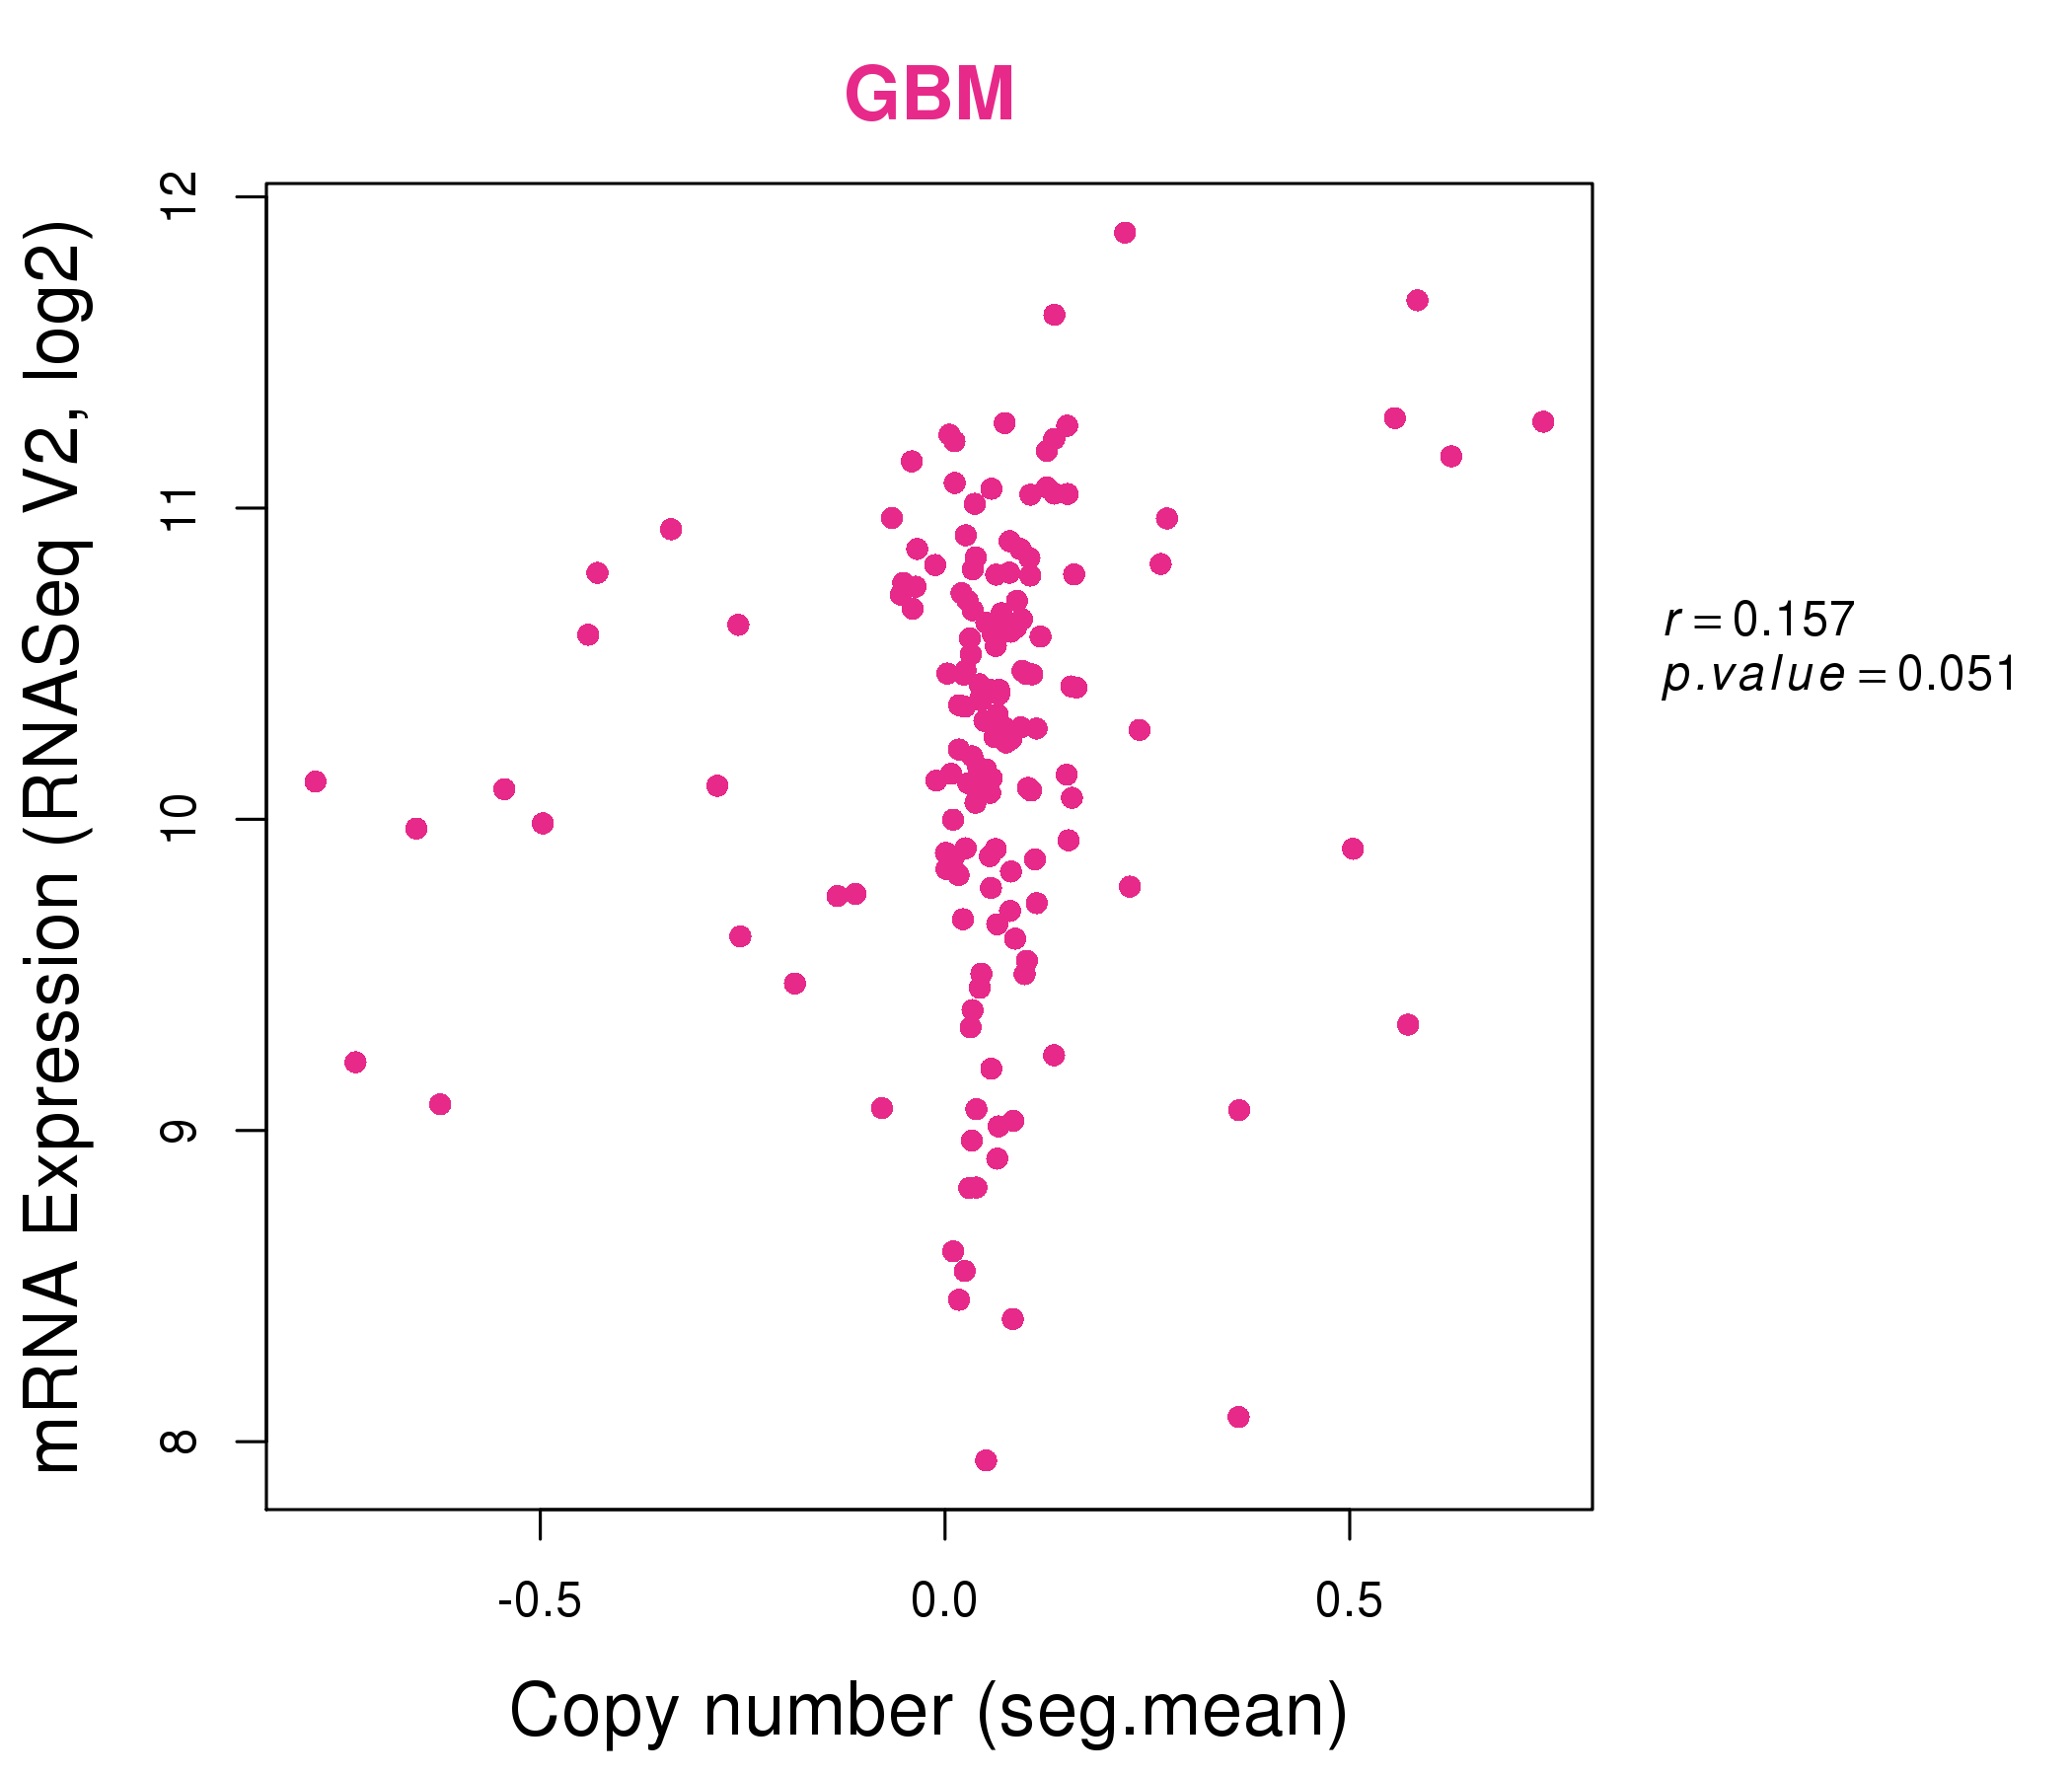
| * Copy number data were extracted from TCGA using R package TCGA-Assembler. The URLs of all public data files on TCGA DCC data server were gathered on Jan-05-2015. Function ProcessCNAData in TCGA-Assembler package was used to obtain gene-level copy number value which is calculated as the average copy number of the genomic region of a gene. |
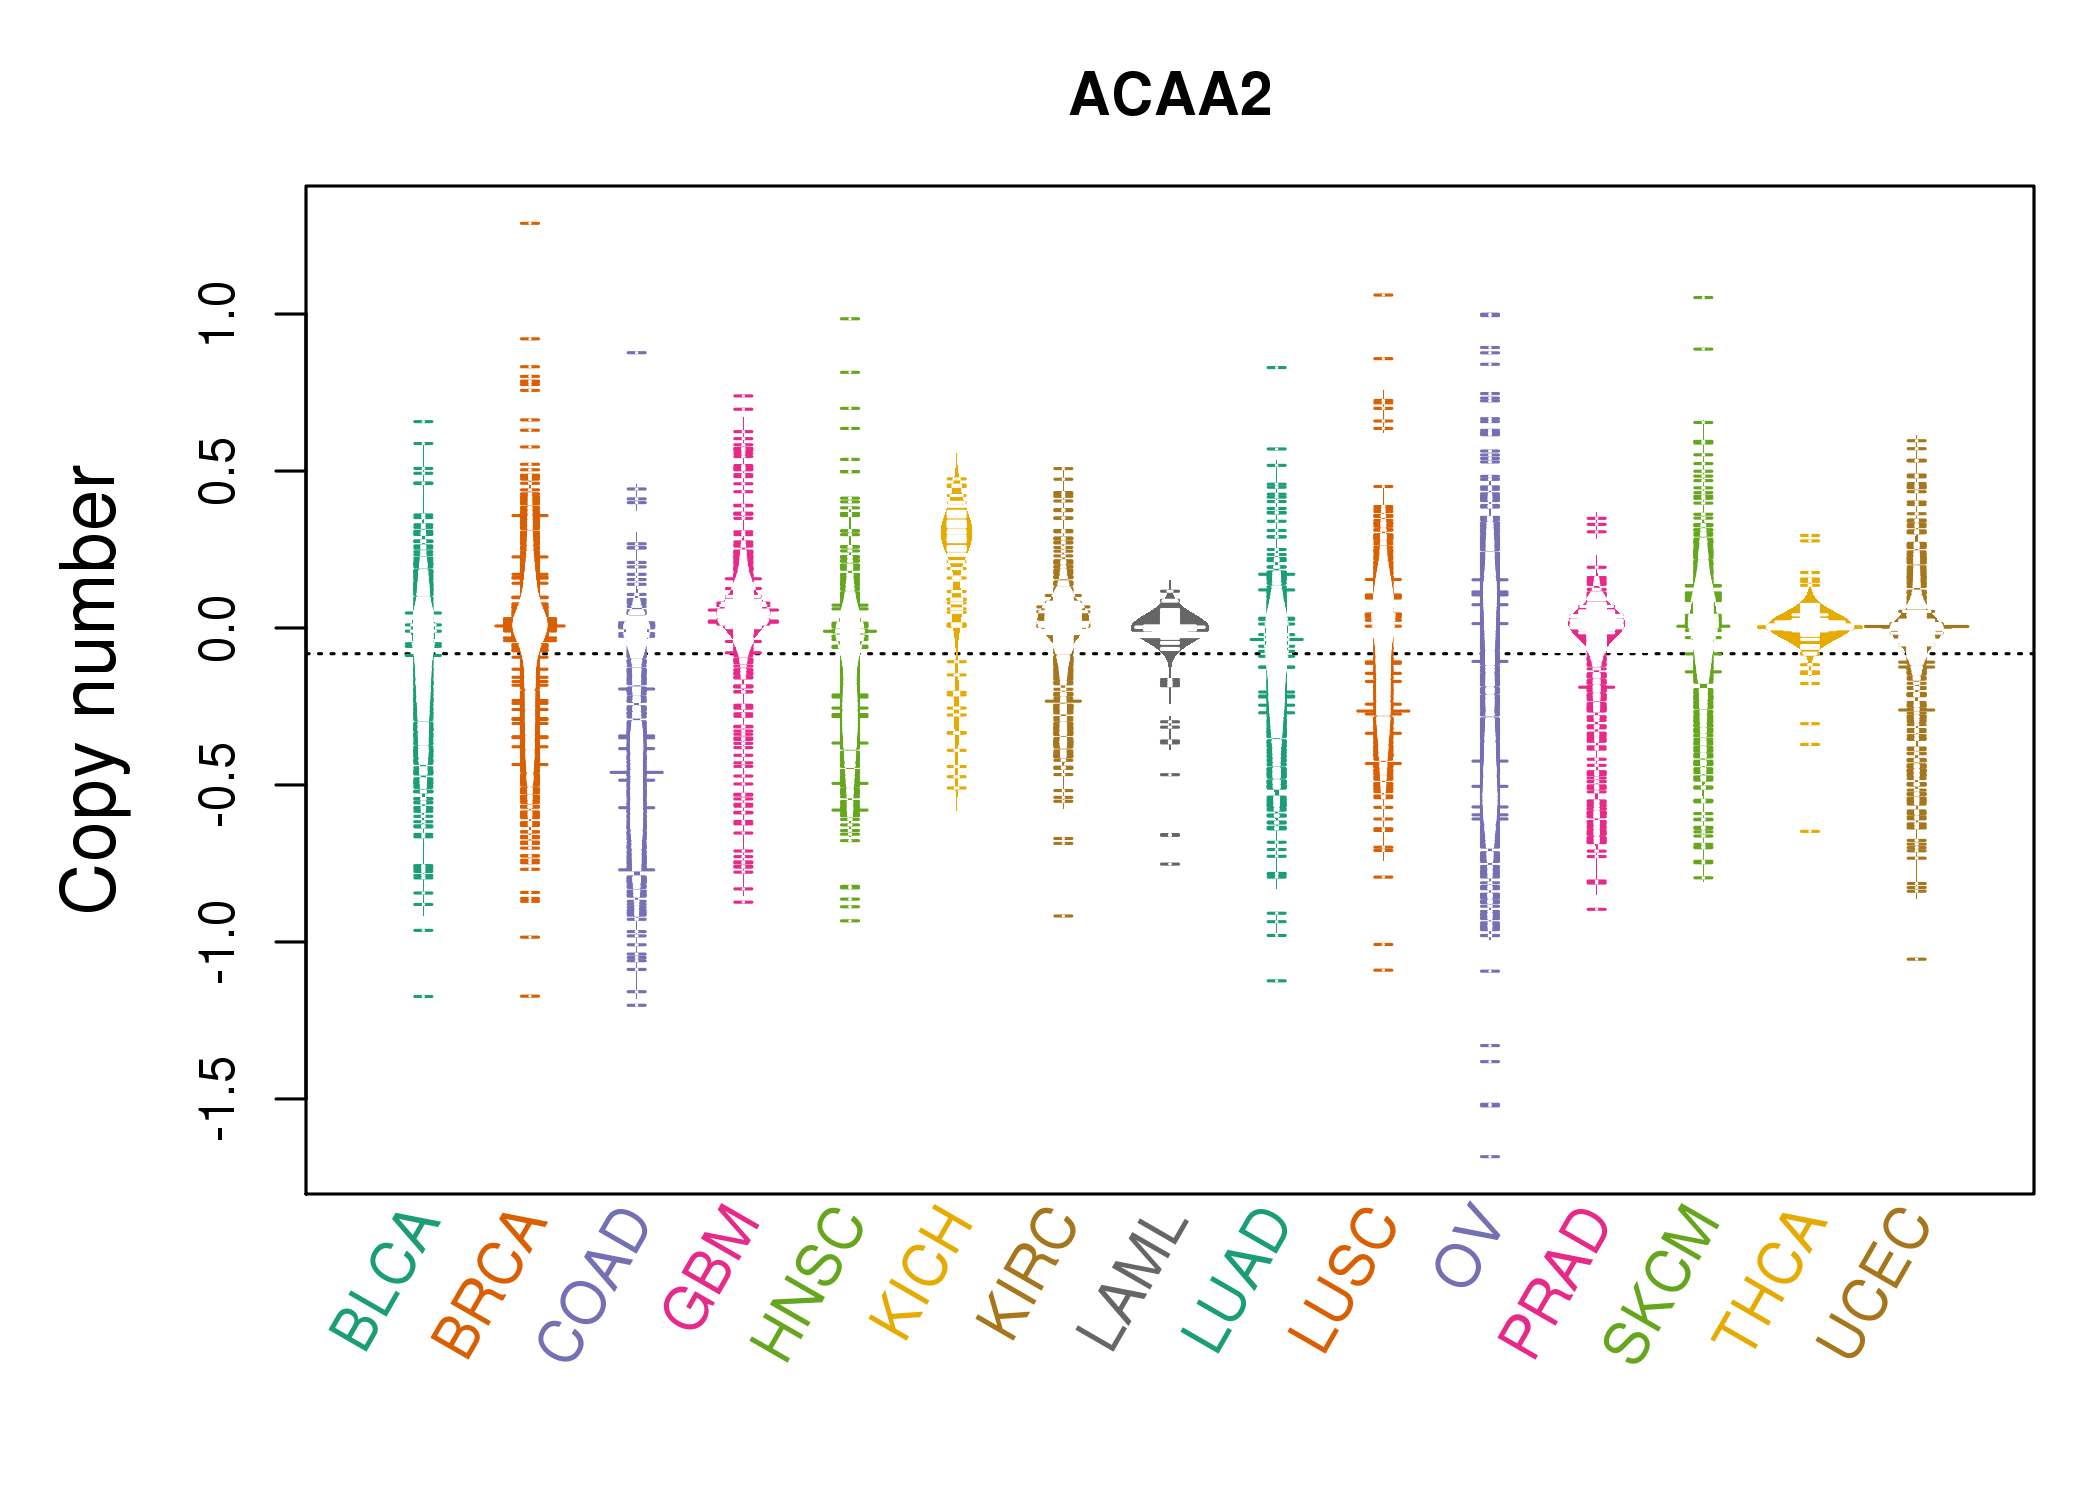 |
| cf) Tissue ID[Tissue type]: BLCA[Bladder Urothelial Carcinoma], BRCA[Breast invasive carcinoma], CESC[Cervical squamous cell carcinoma and endocervical adenocarcinoma], COAD[Colon adenocarcinoma], GBM[Glioblastoma multiforme], Glioma Low Grade, HNSC[Head and Neck squamous cell carcinoma], KICH[Kidney Chromophobe], KIRC[Kidney renal clear cell carcinoma], KIRP[Kidney renal papillary cell carcinoma], LAML[Acute Myeloid Leukemia], LUAD[Lung adenocarcinoma], LUSC[Lung squamous cell carcinoma], OV[Ovarian serous cystadenocarcinoma ], PAAD[Pancreatic adenocarcinoma], PRAD[Prostate adenocarcinoma], SKCM[Skin Cutaneous Melanoma], STAD[Stomach adenocarcinoma], THCA[Thyroid carcinoma], UCEC[Uterine Corpus Endometrial Carcinoma] |
| Top |
| Gene Expression for ACAA2 |
| * CCLE gene expression data were extracted from CCLE_Expression_Entrez_2012-10-18.res: Gene-centric RMA-normalized mRNA expression data. |
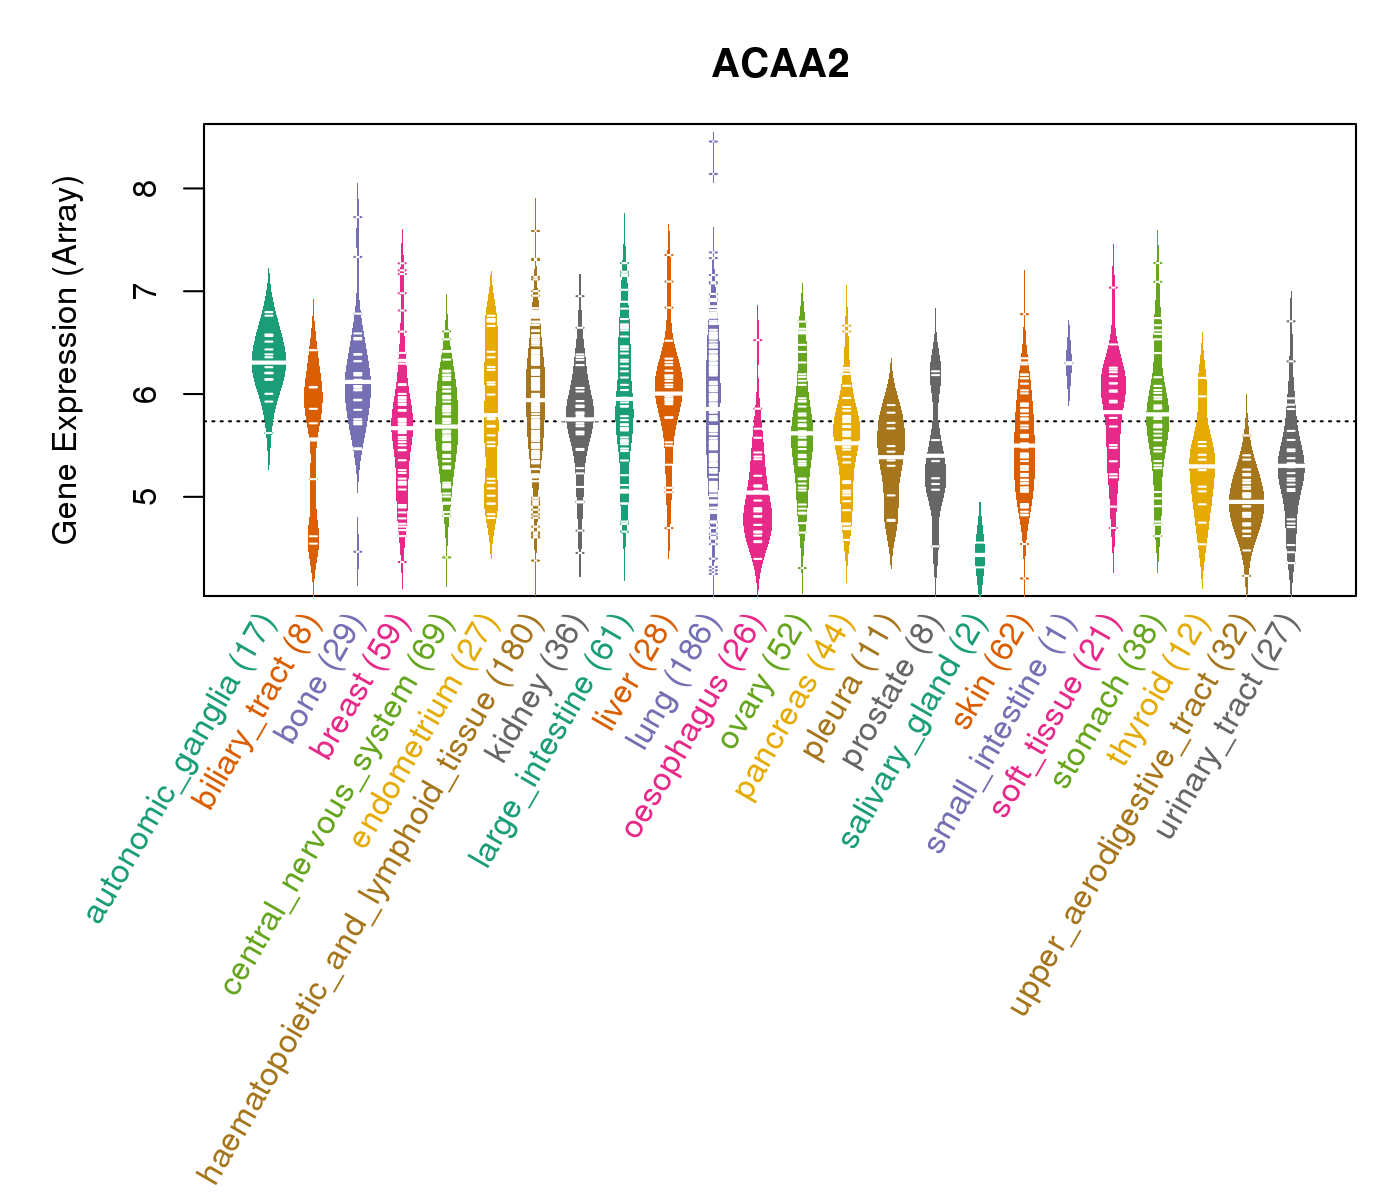 |
| * Normalized gene expression data of RNASeqV2 was extracted from TCGA using R package TCGA-Assembler. The URLs of all public data files on TCGA DCC data server were gathered at Jan-05-2015. Only eight cancer types have enough normal control samples for differential expression analysis. (t test, adjusted p<0.05 (using Benjamini-Hochberg FDR)) |
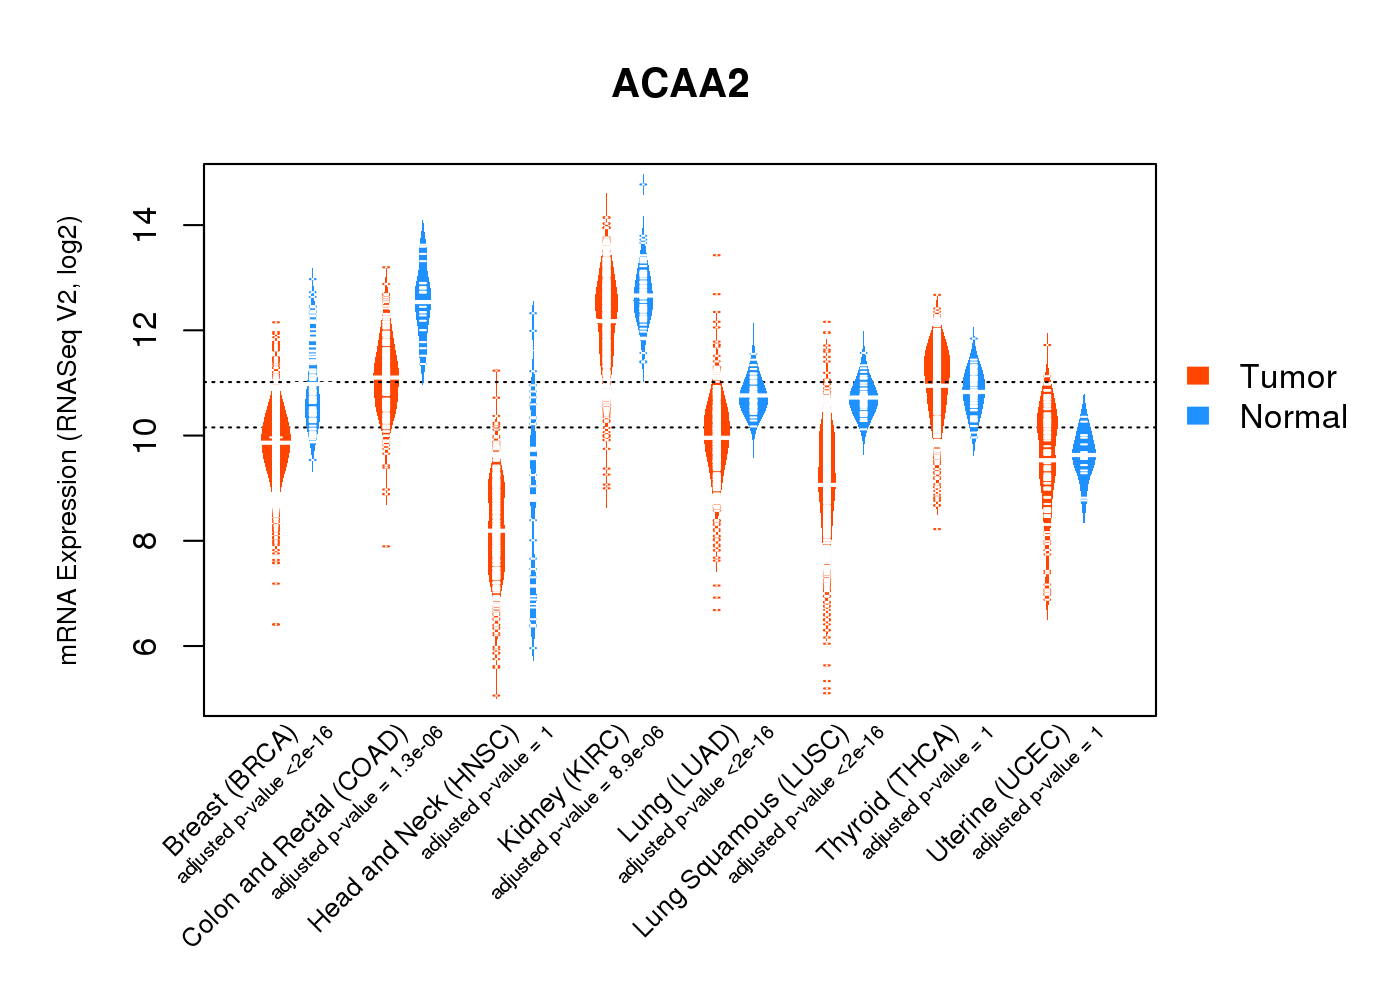 |
| Top |
| * This plots show the correlation between CNV and gene expression. |
: Open all plots for all cancer types
 |
|
 |
|
| Top |
| Gene-Gene Network Information |
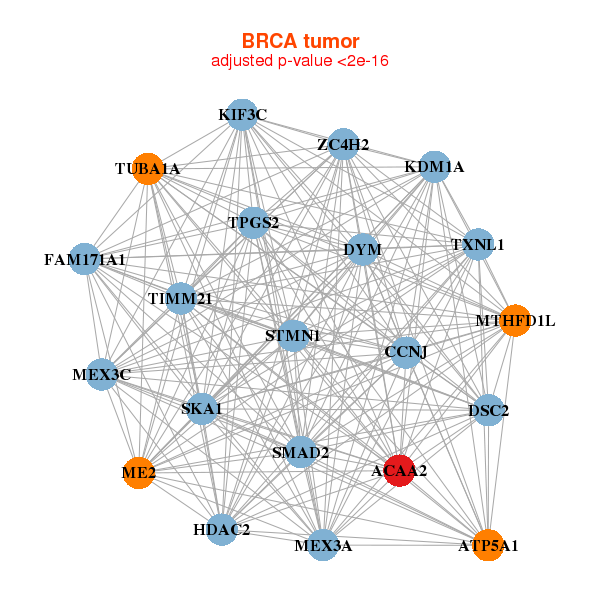
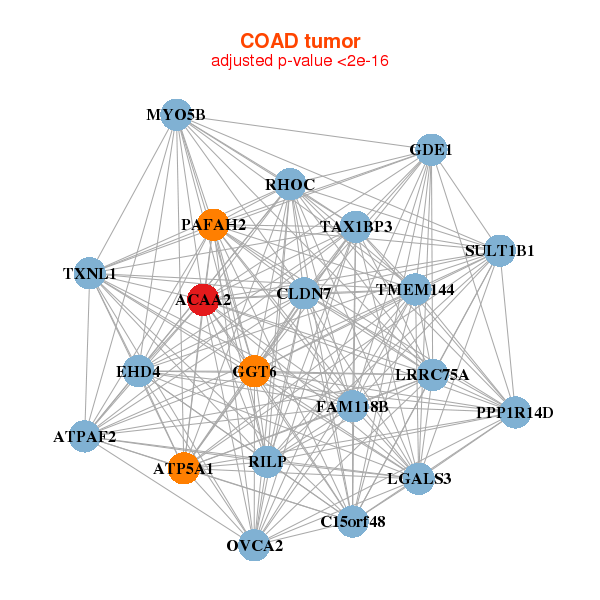
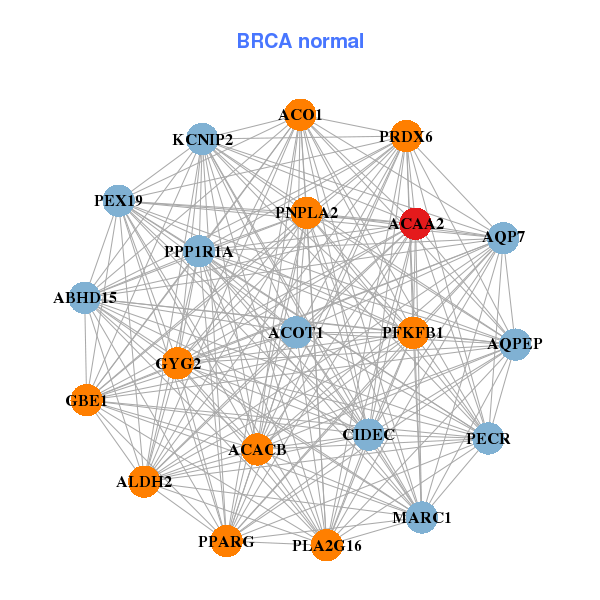
| * Co-Expression network figures were drawn using R package igraph. Only the top 20 genes with the highest correlations were shown. Red circle: input gene, orange circle: cell metabolism gene, sky circle: other gene |
: Open all plots for all cancer types
 |
|
| ACAA2,ATP5A1,TPGS2,TIMM21,CCNJ,DSC2,DYM, FAM171A1,HDAC2,KDM1A,KIF3C,ME2,MEX3A,MEX3C, MTHFD1L,SKA1,SMAD2,STMN1,TUBA1A,TXNL1,ZC4H2 | ABHD15,ACAA2,ACACB,ACO1,ACOT1,ALDH2,AQP7, AQPEP,CIDEC,GBE1,GYG2,KCNIP2,MARC1,PECR, PEX19,PFKFB1,PLA2G16,PNPLA2,PPARG,PPP1R1A,PRDX6 |
 |
|
| ACAA2,ATP5A1,ATPAF2,C15orf48,LRRC75A,CLDN7,EHD4, FAM118B,GDE1,GGT6,LGALS3,MYO5B,OVCA2,PAFAH2, PPP1R14D,RHOC,RILP,SULT1B1,TAX1BP3,TMEM144,TXNL1 | ACAA2,BCAS4,LINC00483,STPG1,CASP7,RHOV___CHP1,MARVELD3, MYL12A,PAPSS2,PKIB,PLAC8,PPP1R14D,RAB9A,RAC1, SFXN1,SPPL2A,TJP3,TMEM45B,TNK1,TPRN,TRIP4 |

| * Co-Expression network figures were drawn using R package igraph. Only the top 20 genes with the highest correlations were shown. Red circle: input gene, orange circle: cell metabolism gene, sky circle: other gene |
: Open all plots for all cancer types
| Top |
: Open all interacting genes' information including KEGG pathway for all interacting genes from DAVID
| Top |
| Pharmacological Information for ACAA2 |
| There's no related Drug. |
| Top |
| Cross referenced IDs for ACAA2 |
| * We obtained these cross-references from Uniprot database. It covers 150 different DBs, 18 categories. http://www.uniprot.org/help/cross_references_section |
: Open all cross reference information
|
Copyright © 2016-Present - The Univsersity of Texas Health Science Center at Houston @ |