|
||||||||||||||||||||||||||||||||||||||||||||||||||||||||||||||||||||||||||||||||||||||||||||||||||||||||||||||||||||||||||||||||||||||||||||||||||||||||||||||||||||||||||||||||||||||||||||||||||||||||||||||||||||||||||||||||||||||||||||||||||||||||||||||||||||||||||||||||||||||||||||||||||||||||||||||||||||||||||
| |
| Phenotypic Information (metabolism pathway, cancer, disease, phenome) |
| |
| |
| Gene-Gene Network Information: Co-Expression Network, Interacting Genes & KEGG |
| |
|


| Gene Summary for TOMM40 |
| Basic gene info. | Gene symbol | TOMM40 |
| Gene name | translocase of outer mitochondrial membrane 40 homolog (yeast) | |
| Synonyms | C19orf1|D19S1177E|PER-EC1|PEREC1|TOM40 | |
| Cytomap | UCSC genome browser: 19q13 | |
| Genomic location | chr19 :45394476-45406946 | |
| Type of gene | protein-coding | |
| RefGenes | NM_001128916.1, NM_001128917.1,NM_006114.2, | |
| Ensembl id | ENSG00000130204 | |
| Description | mitochondrial import receptor subunit TOM40 homologmitochondrial outer membrane proteinp38.5protein Haymakertranslocase of outer membrane 40 kDa subunit homolog | |
| Modification date | 20141207 | |
| dbXrefs | MIM : 608061 | |
| HGNC : HGNC | ||
| Ensembl : ENSG00000130204 | ||
| HPRD : 16274 | ||
| Vega : OTTHUMG00000180842 | ||
| Protein | UniProt: go to UniProt's Cross Reference DB Table | |
| Expression | CleanEX: HS_TOMM40 | |
| BioGPS: 10452 | ||
| Gene Expression Atlas: ENSG00000130204 | ||
| The Human Protein Atlas: ENSG00000130204 | ||
| Pathway | NCI Pathway Interaction Database: TOMM40 | |
| KEGG: TOMM40 | ||
| REACTOME: TOMM40 | ||
| ConsensusPathDB | ||
| Pathway Commons: TOMM40 | ||
| Metabolism | MetaCyc: TOMM40 | |
| HUMANCyc: TOMM40 | ||
| Regulation | Ensembl's Regulation: ENSG00000130204 | |
| miRBase: chr19 :45,394,476-45,406,946 | ||
| TargetScan: NM_001128916 | ||
| cisRED: ENSG00000130204 | ||
| Context | iHOP: TOMM40 | |
| cancer metabolism search in PubMed: TOMM40 | ||
| UCL Cancer Institute: TOMM40 | ||
| Assigned class in ccmGDB | C | |
| Top |
| Phenotypic Information for TOMM40(metabolism pathway, cancer, disease, phenome) |
| Cancer | CGAP: TOMM40 |
| Familial Cancer Database: TOMM40 | |
| * This gene is included in those cancer gene databases. |
|
|
|
|
|
| . | ||||||||||||||||||||||||||||||||||||||||||||||||||||||||||||||||||||||||||||||||||||||||||||||||||||||||||||||||||||||||||||||||||||||||||||||||||||||||||||||||||||||||||||||||||||||||||||||||||||||||||||||||||||||||||||||||||||||||||||||||||||||||||||||||||||||||||||||||||||||||||||||||||||||||||||||||||||
Oncogene 1 | Significant driver gene in | |||||||||||||||||||||||||||||||||||||||||||||||||||||||||||||||||||||||||||||||||||||||||||||||||||||||||||||||||||||||||||||||||||||||||||||||||||||||||||||||||||||||||||||||||||||||||||||||||||||||||||||||||||||||||||||||||||||||||||||||||||||||||||||||||||||||||||||||||||||||||||||||||||||||||||||||||||||||||
| cf) number; DB name 1 Oncogene; http://nar.oxfordjournals.org/content/35/suppl_1/D721.long, 2 Tumor Suppressor gene; https://bioinfo.uth.edu/TSGene/, 3 Cancer Gene Census; http://www.nature.com/nrc/journal/v4/n3/abs/nrc1299.html, 4 CancerGenes; http://nar.oxfordjournals.org/content/35/suppl_1/D721.long, 5 Network of Cancer Gene; http://ncg.kcl.ac.uk/index.php, 1Therapeutic Vulnerabilities in Cancer; http://cbio.mskcc.org/cancergenomics/statius/ |
| REACTOME_METABOLISM_OF_PROTEINS | |
| OMIM | |
| Orphanet | |
| Disease | KEGG Disease: TOMM40 |
| MedGen: TOMM40 (Human Medical Genetics with Condition) | |
| ClinVar: TOMM40 | |
| Phenotype | MGI: TOMM40 (International Mouse Phenotyping Consortium) |
| PhenomicDB: TOMM40 | |
| Mutations for TOMM40 |
| * Under tables are showing count per each tissue to give us broad intuition about tissue specific mutation patterns.You can go to the detailed page for each mutation database's web site. |
| There's no structural variation information in COSMIC data for this gene. |
| * From mRNA Sanger sequences, Chitars2.0 arranged chimeric transcripts. This table shows TOMM40 related fusion information. |
| ID | Head Gene | Tail Gene | Accession | Gene_a | qStart_a | qEnd_a | Chromosome_a | tStart_a | tEnd_a | Gene_a | qStart_a | qEnd_a | Chromosome_a | tStart_a | tEnd_a |
| BE908928 | TOMM40 | 1 | 130 | 19 | 45406783 | 45406913 | BCAP29 | 130 | 710 | 7 | 107259848 | 107260436 | |
| AW873110 | LRTOMT | 11 | 325 | 11 | 71808338 | 71808652 | TOMM40 | 316 | 481 | 19 | 45404332 | 45406319 | |
| Top |
| Mutation type/ Tissue ID | brca | cns | cerv | endome | haematopo | kidn | Lintest | liver | lung | ns | ovary | pancre | prost | skin | stoma | thyro | urina | |||
| Total # sample | 1 | |||||||||||||||||||
| GAIN (# sample) | 1 | |||||||||||||||||||
| LOSS (# sample) |
| cf) Tissue ID; Tissue type (1; Breast, 2; Central_nervous_system, 3; Cervix, 4; Endometrium, 5; Haematopoietic_and_lymphoid_tissue, 6; Kidney, 7; Large_intestine, 8; Liver, 9; Lung, 10; NS, 11; Ovary, 12; Pancreas, 13; Prostate, 14; Skin, 15; Stomach, 16; Thyroid, 17; Urinary_tract) |
| Top |
|
 |
| Top |
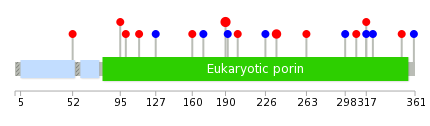
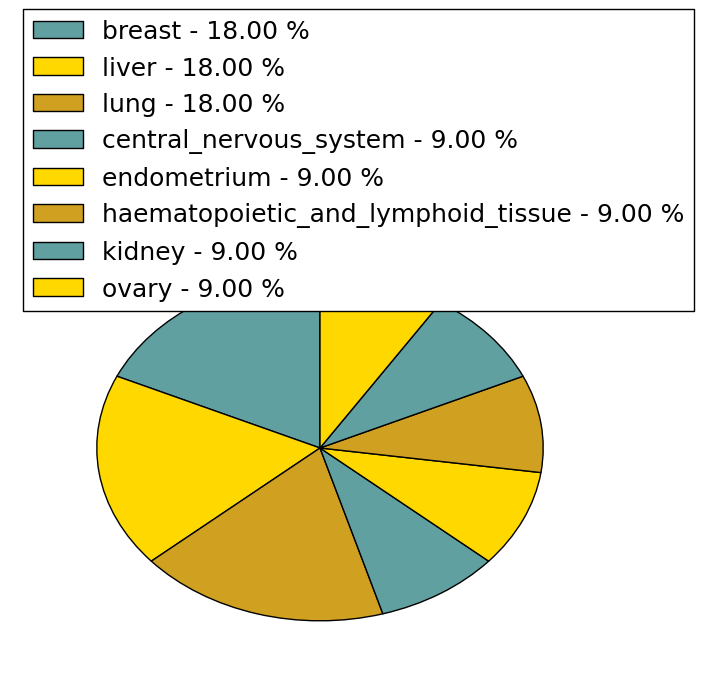
| Stat. for Non-Synonymous SNVs (# total SNVs=11) | (# total SNVs=5) |
 |  |
(# total SNVs=0) | (# total SNVs=0) |
| Top |
| * When you move the cursor on each content, you can see more deailed mutation information on the Tooltip. Those are primary_site,primary_histology,mutation(aa),pubmedID. |
| GRCh37 position | Mutation(aa) | Unique sampleID count |
| chr19:45397249-45397249 | p.V190G | 3 |
| chr19:45404050-45404050 | p.V236D | 2 |
| chr19:45397281-45397281 | p.A201T | 1 |
| chr19:45406424-45406424 | p.*362R | 1 |
| chr19:45404021-45404021 | p.T226T | 1 |
| chr19:45394827-45394827 | p.R52Q | 1 |
| chr19:45395659-45395659 | p.P95L | 1 |
| chr19:45404306-45404306 | p.V263A | 1 |
| chr19:45395673-45395673 | p.G100R | 1 |
| chr19:45404515-45404515 | p.S298S | 1 |
| Top |
|
 |
| Point Mutation/ Tissue ID | 1 | 2 | 3 | 4 | 5 | 6 | 7 | 8 | 9 | 10 | 11 | 12 | 13 | 14 | 15 | 16 | 17 | 18 | 19 | 20 |
| # sample | 1 | 1 | 2 | 2 | 2 | 1 | 4 | 1 | 1 | 2 | ||||||||||
| # mutation | 1 | 1 | 2 | 2 | 2 | 1 | 4 | 1 | 1 | 2 | ||||||||||
| nonsynonymous SNV | 1 | 1 | 2 | 1 | 1 | |||||||||||||||
| synonymous SNV | 1 | 1 | 2 | 1 | 1 | 1 | 2 | 1 | 1 |
| cf) Tissue ID; Tissue type (1; BLCA[Bladder Urothelial Carcinoma], 2; BRCA[Breast invasive carcinoma], 3; CESC[Cervical squamous cell carcinoma and endocervical adenocarcinoma], 4; COAD[Colon adenocarcinoma], 5; GBM[Glioblastoma multiforme], 6; Glioma Low Grade, 7; HNSC[Head and Neck squamous cell carcinoma], 8; KICH[Kidney Chromophobe], 9; KIRC[Kidney renal clear cell carcinoma], 10; KIRP[Kidney renal papillary cell carcinoma], 11; LAML[Acute Myeloid Leukemia], 12; LUAD[Lung adenocarcinoma], 13; LUSC[Lung squamous cell carcinoma], 14; OV[Ovarian serous cystadenocarcinoma ], 15; PAAD[Pancreatic adenocarcinoma], 16; PRAD[Prostate adenocarcinoma], 17; SKCM[Skin Cutaneous Melanoma], 18:STAD[Stomach adenocarcinoma], 19:THCA[Thyroid carcinoma], 20:UCEC[Uterine Corpus Endometrial Carcinoma]) |
| Top |
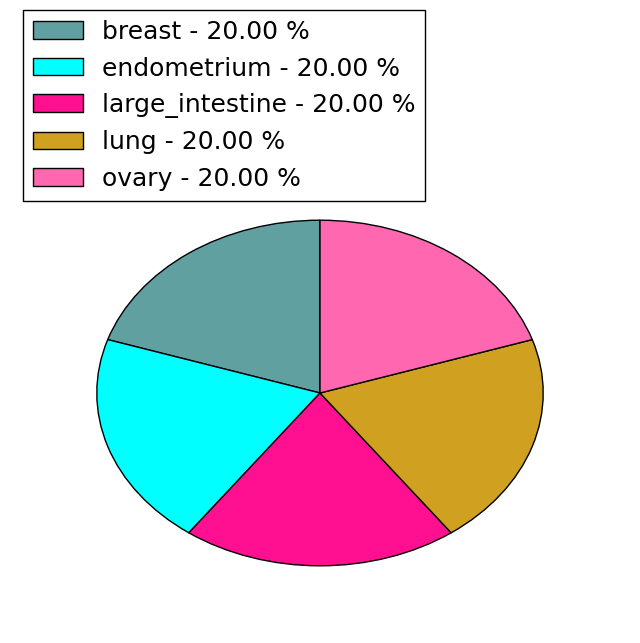
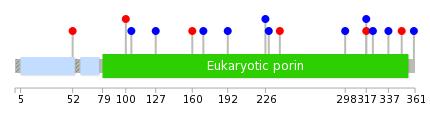
| * We represented just top 10 SNVs. When you move the cursor on each content, you can see more deailed mutation information on the Tooltip. Those are primary_site, primary_histology, mutation(aa), pubmedID. |
| Genomic Position | Mutation(aa) | Unique sampleID count |
| chr19:45404058 | p.G100R,TOMM40 | 1 |
| chr19:45404515 | p.V105V,TOMM40 | 1 |
| chr19:45394827 | p.S127S,TOMM40 | 1 |
| chr19:45406290 | p.L160V,TOMM40 | 1 |
| chr19:45395673 | p.P170P,TOMM40 | 1 |
| chr19:45406291 | p.G192G,TOMM40 | 1 |
| chr19:45395690 | p.T226T,TOMM40 | 1 |
| chr19:45406309 | p.L229L,TOMM40 | 1 |
| chr19:45396132 | p.R239W,TOMM40 | 1 |
| chr19:45406351 | p.S298S,TOMM40 | 1 |
| * Copy number data were extracted from TCGA using R package TCGA-Assembler. The URLs of all public data files on TCGA DCC data server were gathered on Jan-05-2015. Function ProcessCNAData in TCGA-Assembler package was used to obtain gene-level copy number value which is calculated as the average copy number of the genomic region of a gene. |
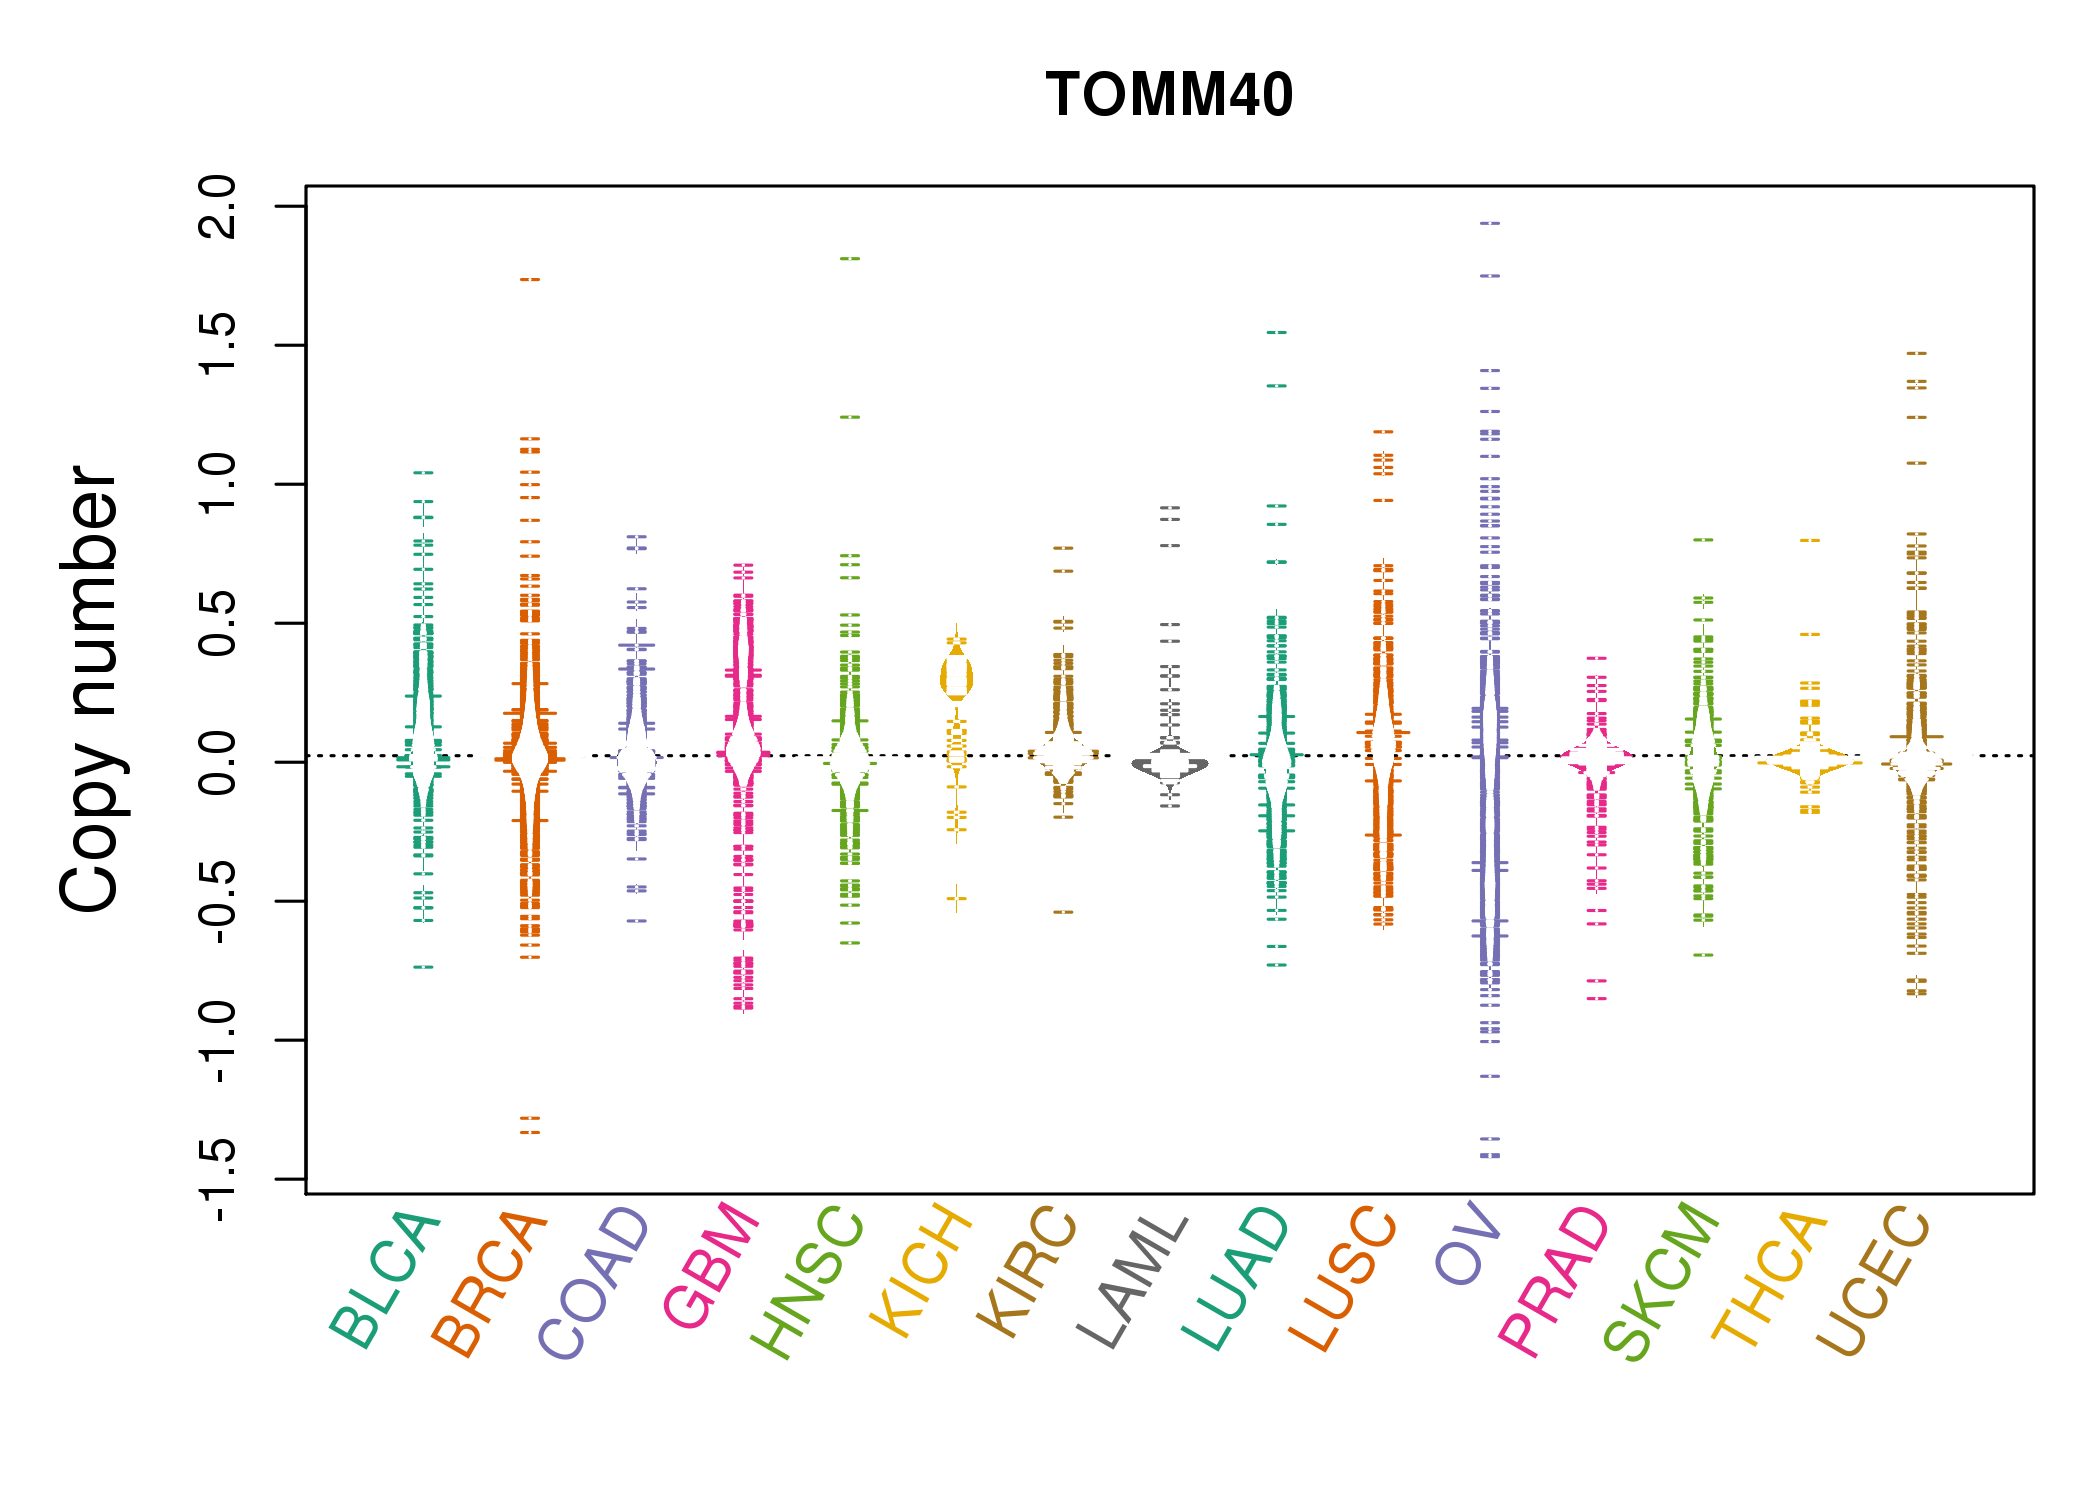 |
| cf) Tissue ID[Tissue type]: BLCA[Bladder Urothelial Carcinoma], BRCA[Breast invasive carcinoma], CESC[Cervical squamous cell carcinoma and endocervical adenocarcinoma], COAD[Colon adenocarcinoma], GBM[Glioblastoma multiforme], Glioma Low Grade, HNSC[Head and Neck squamous cell carcinoma], KICH[Kidney Chromophobe], KIRC[Kidney renal clear cell carcinoma], KIRP[Kidney renal papillary cell carcinoma], LAML[Acute Myeloid Leukemia], LUAD[Lung adenocarcinoma], LUSC[Lung squamous cell carcinoma], OV[Ovarian serous cystadenocarcinoma ], PAAD[Pancreatic adenocarcinoma], PRAD[Prostate adenocarcinoma], SKCM[Skin Cutaneous Melanoma], STAD[Stomach adenocarcinoma], THCA[Thyroid carcinoma], UCEC[Uterine Corpus Endometrial Carcinoma] |
| Top |
| Gene Expression for TOMM40 |
| * CCLE gene expression data were extracted from CCLE_Expression_Entrez_2012-10-18.res: Gene-centric RMA-normalized mRNA expression data. |
 |
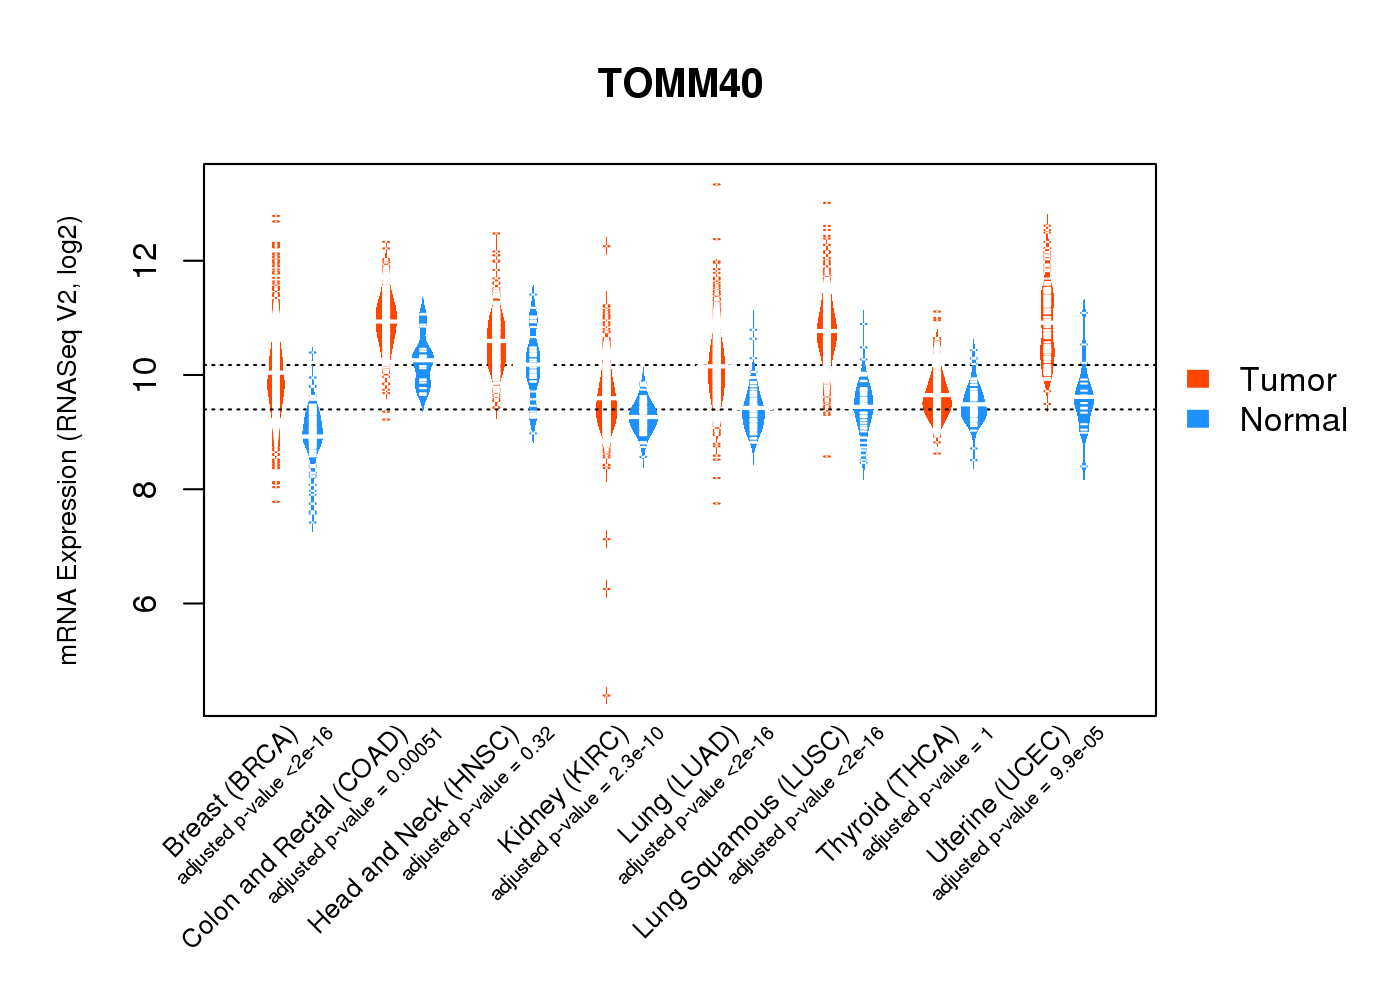
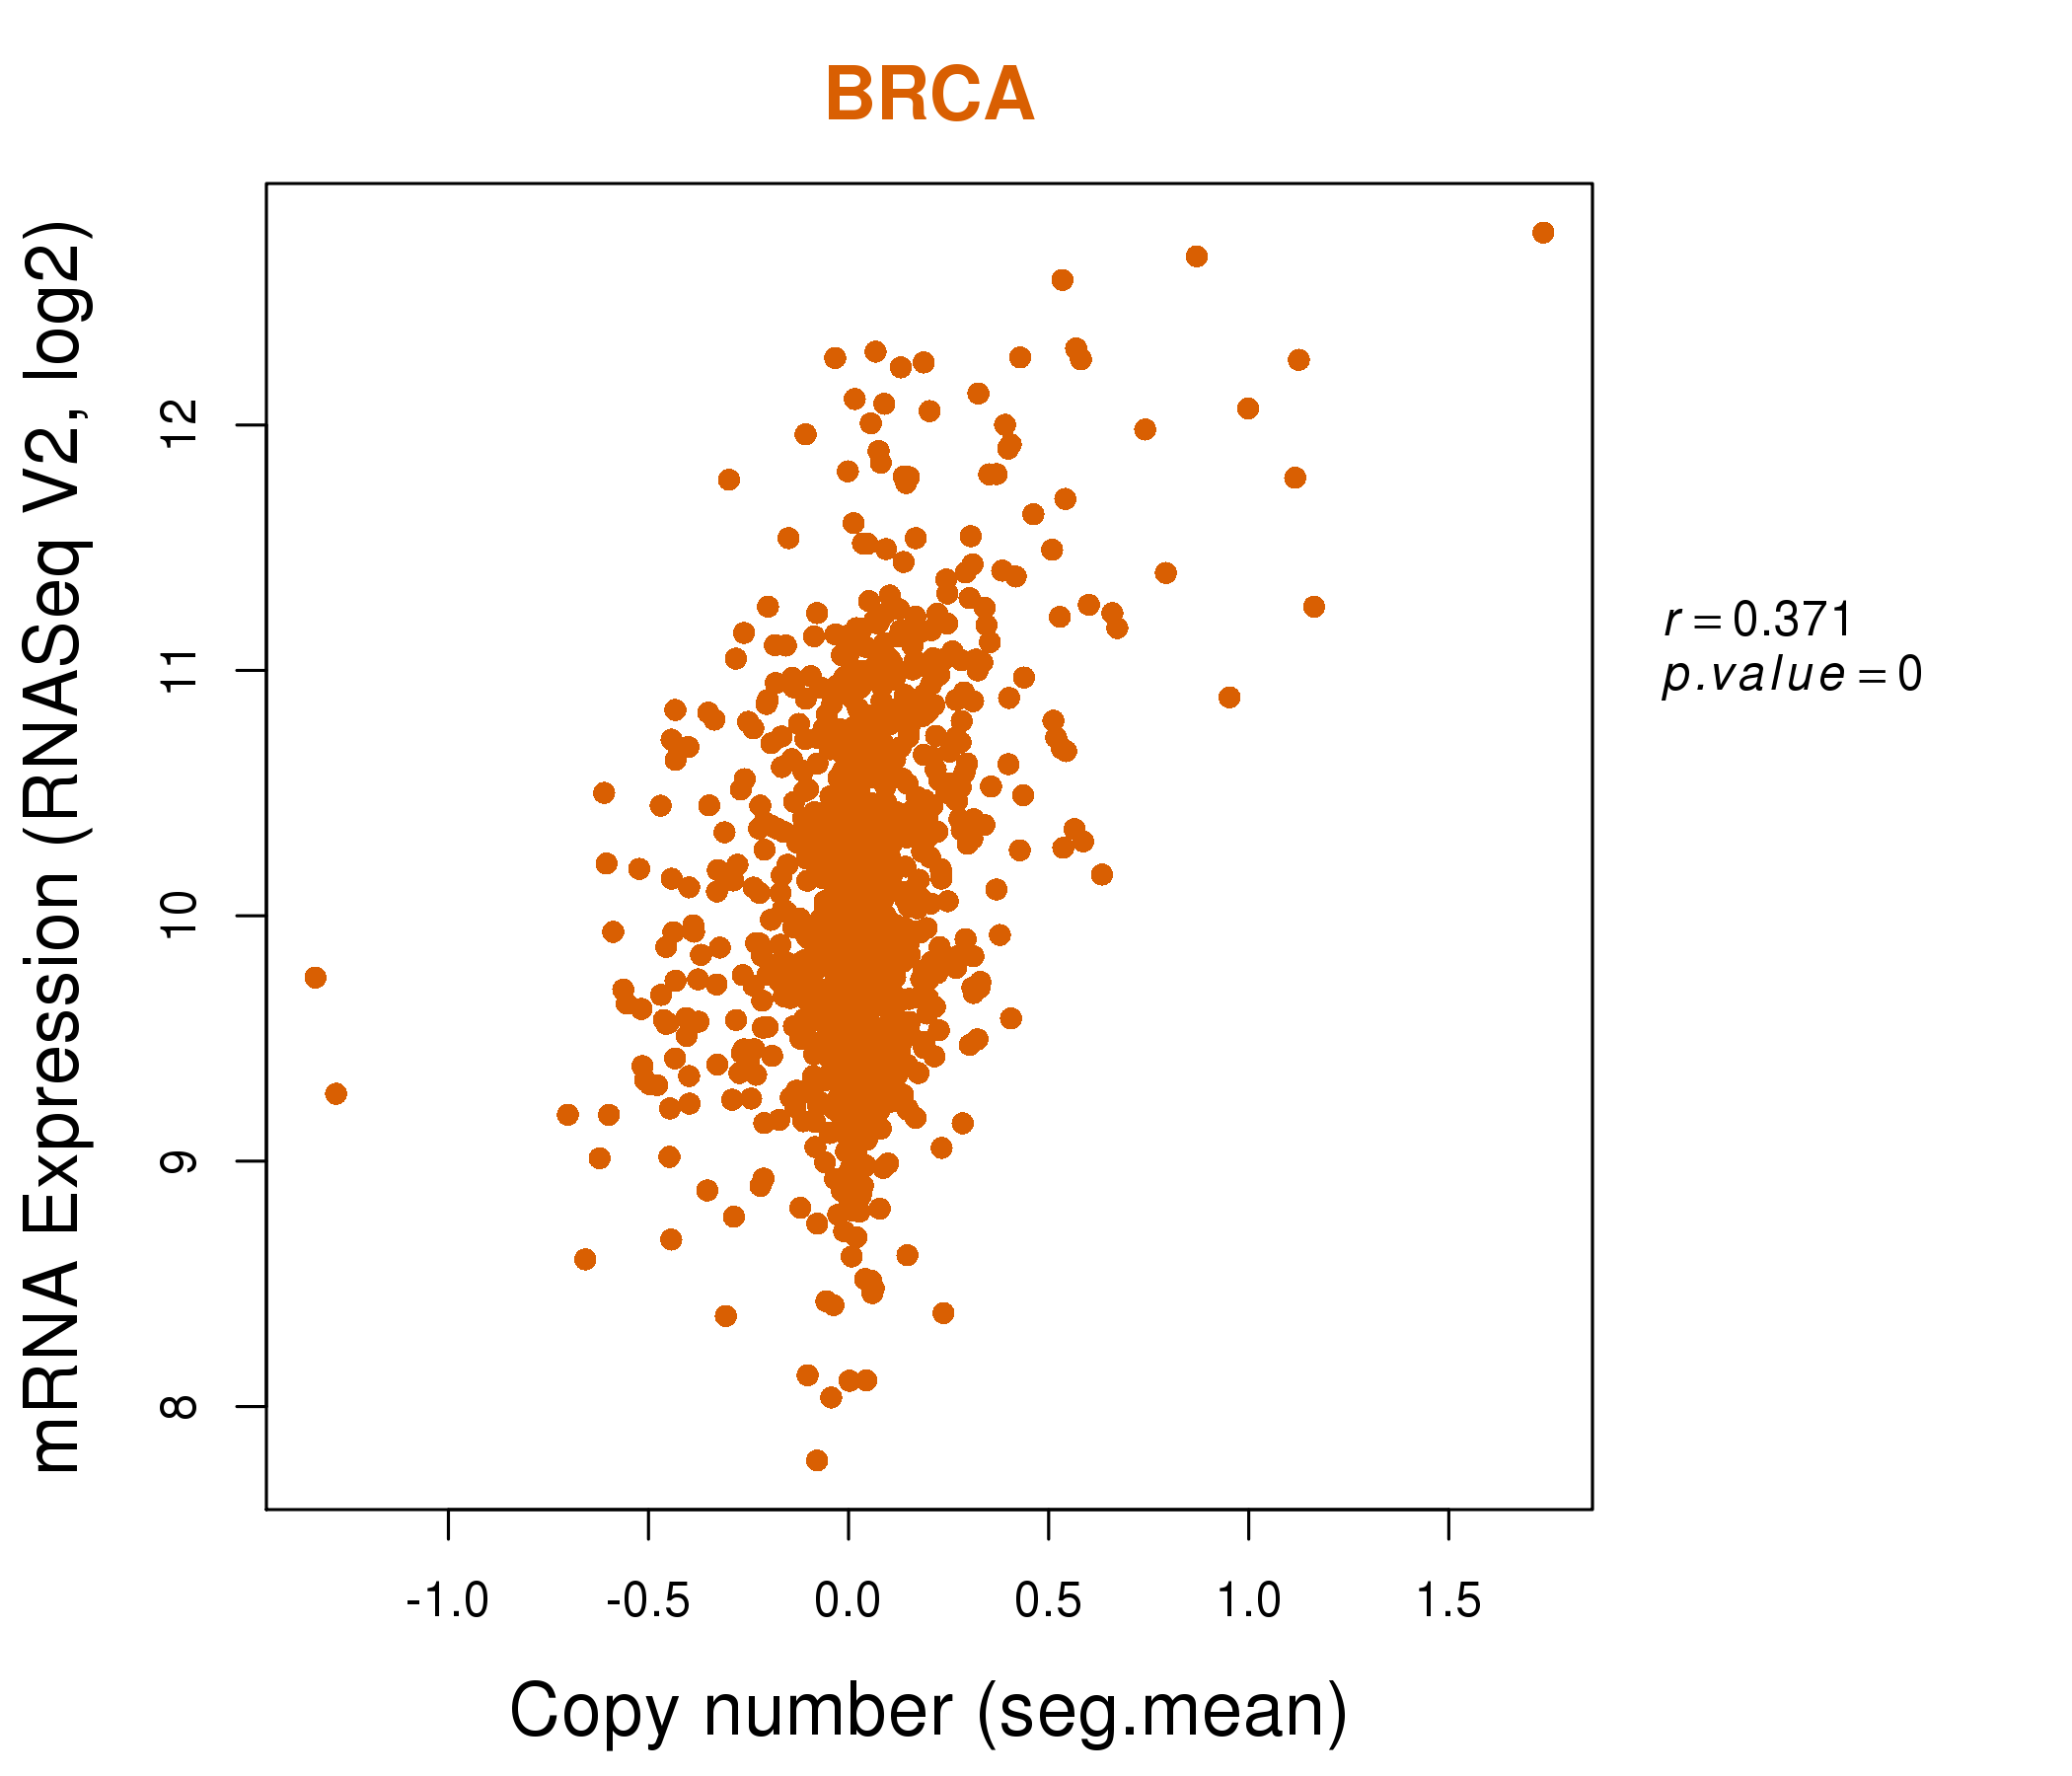
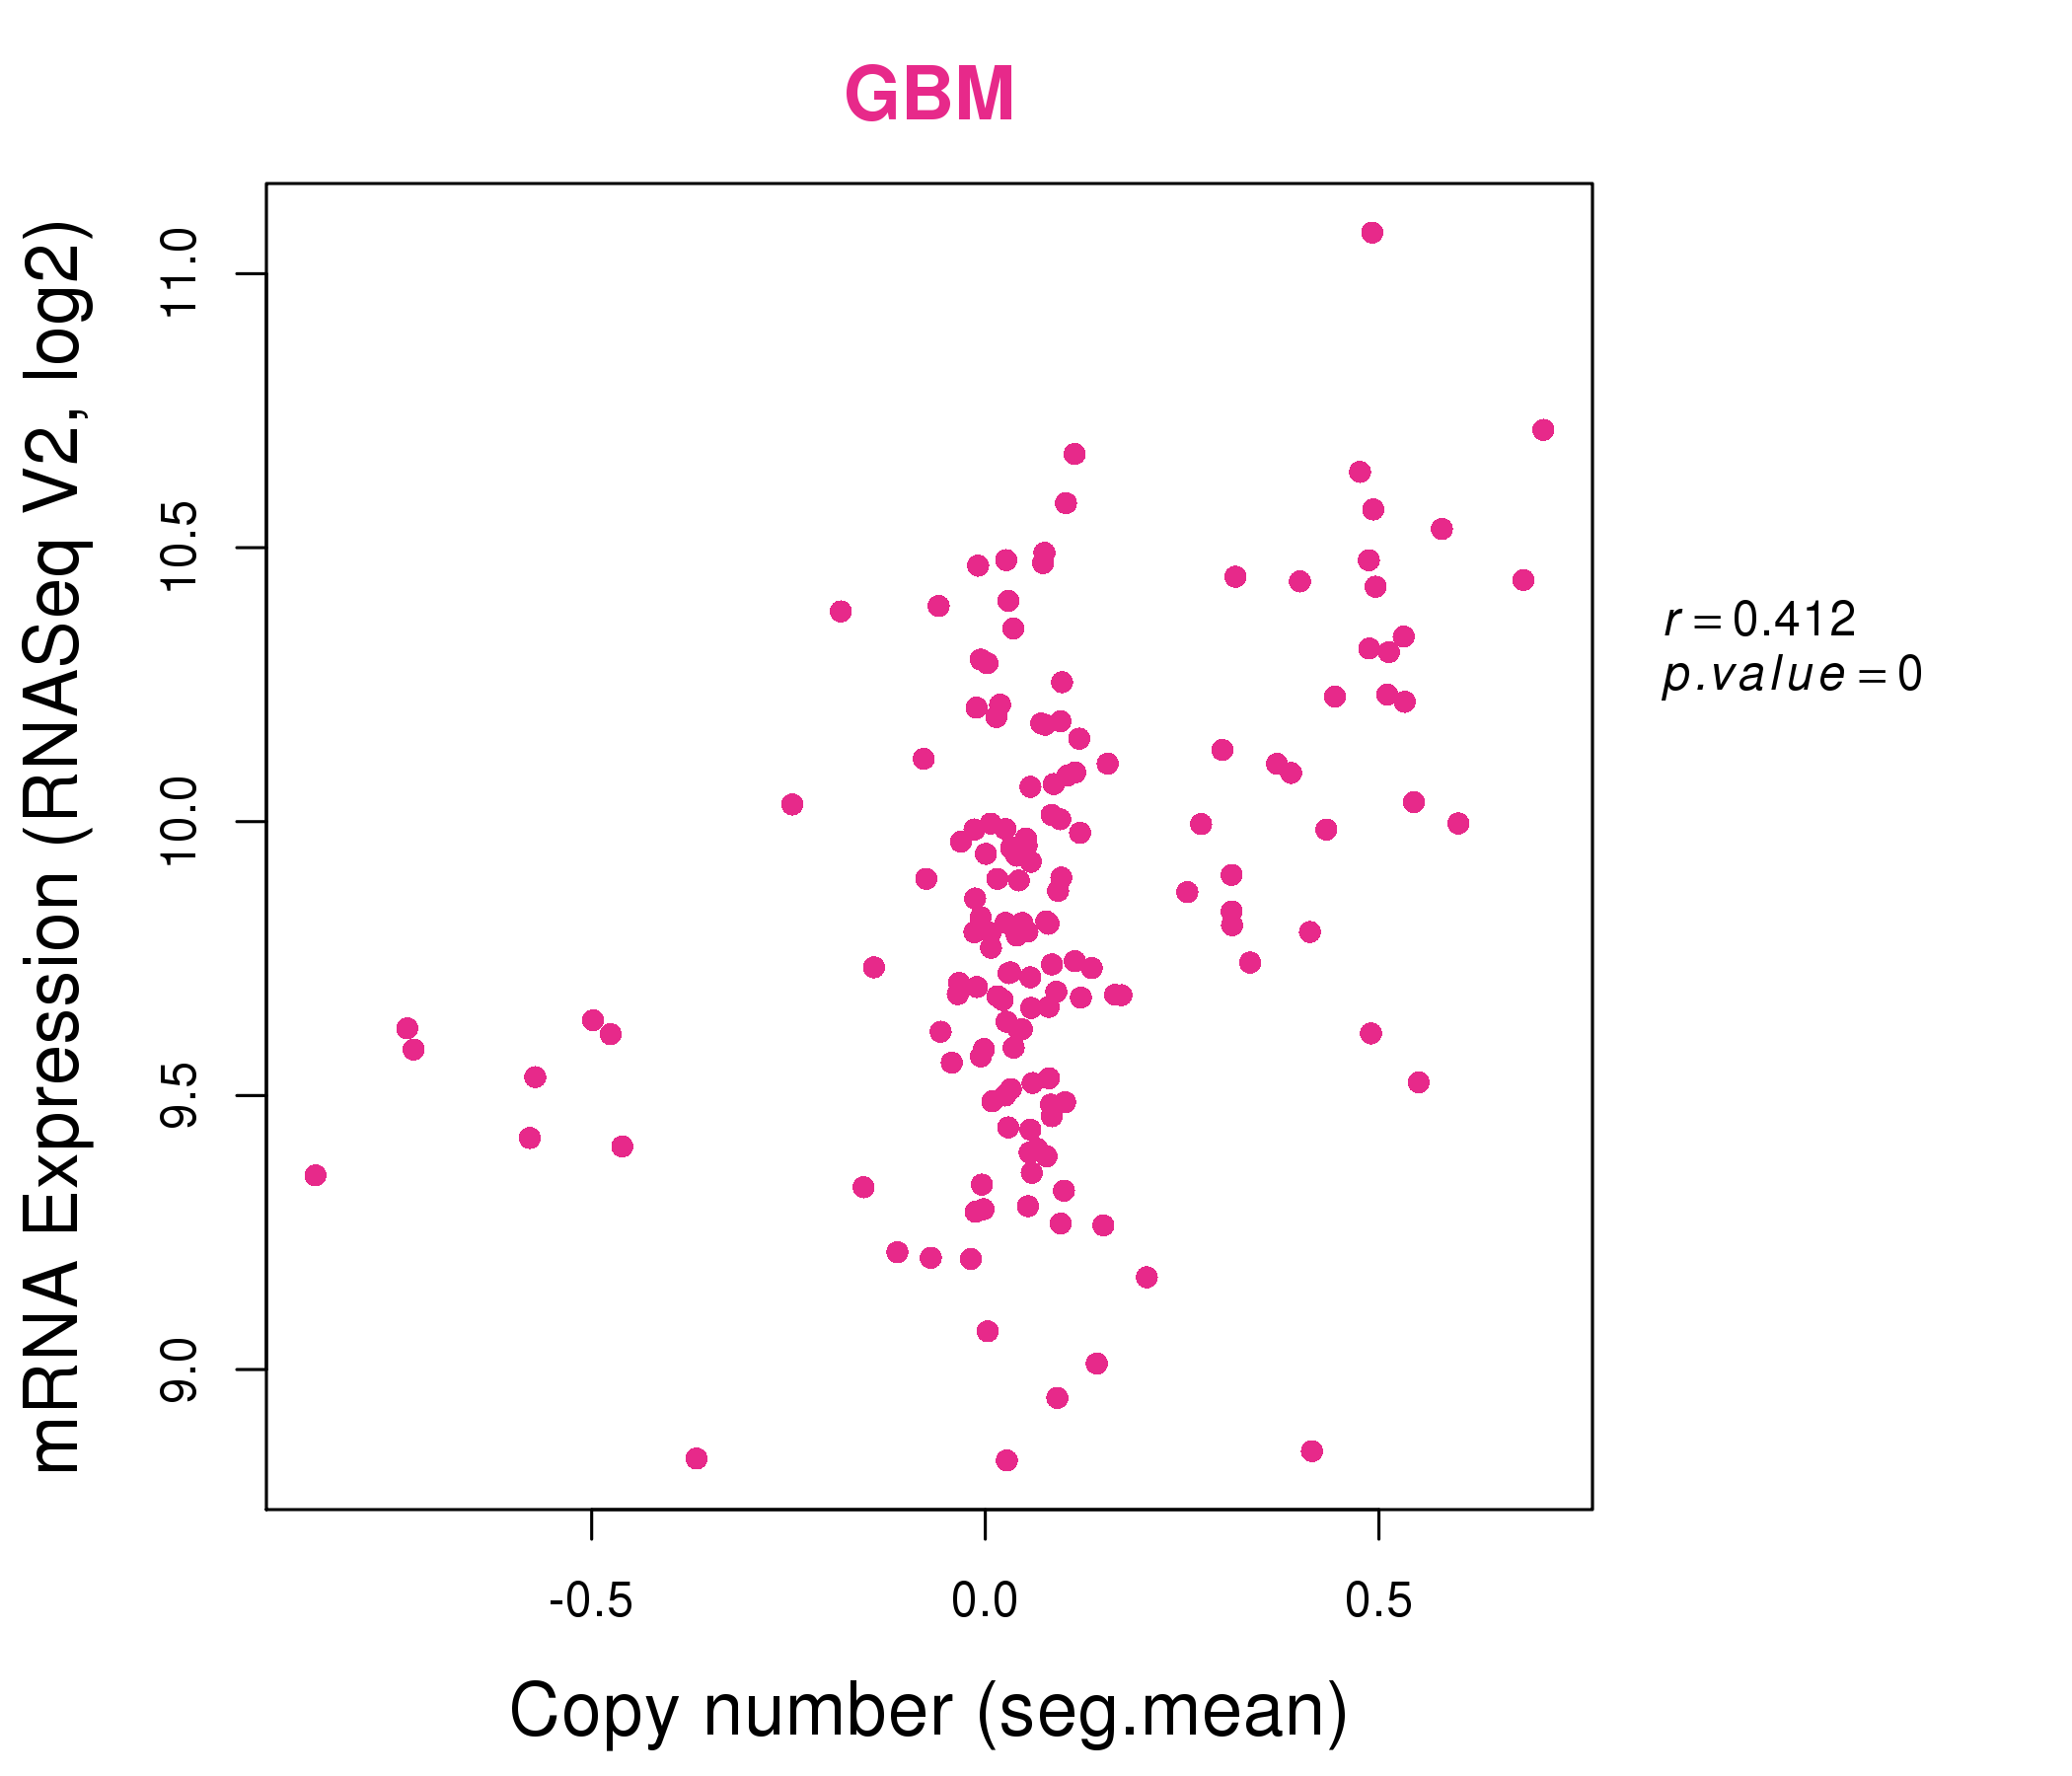
| * Normalized gene expression data of RNASeqV2 was extracted from TCGA using R package TCGA-Assembler. The URLs of all public data files on TCGA DCC data server were gathered at Jan-05-2015. Only eight cancer types have enough normal control samples for differential expression analysis. (t test, adjusted p<0.05 (using Benjamini-Hochberg FDR)) |
 |
| Top |
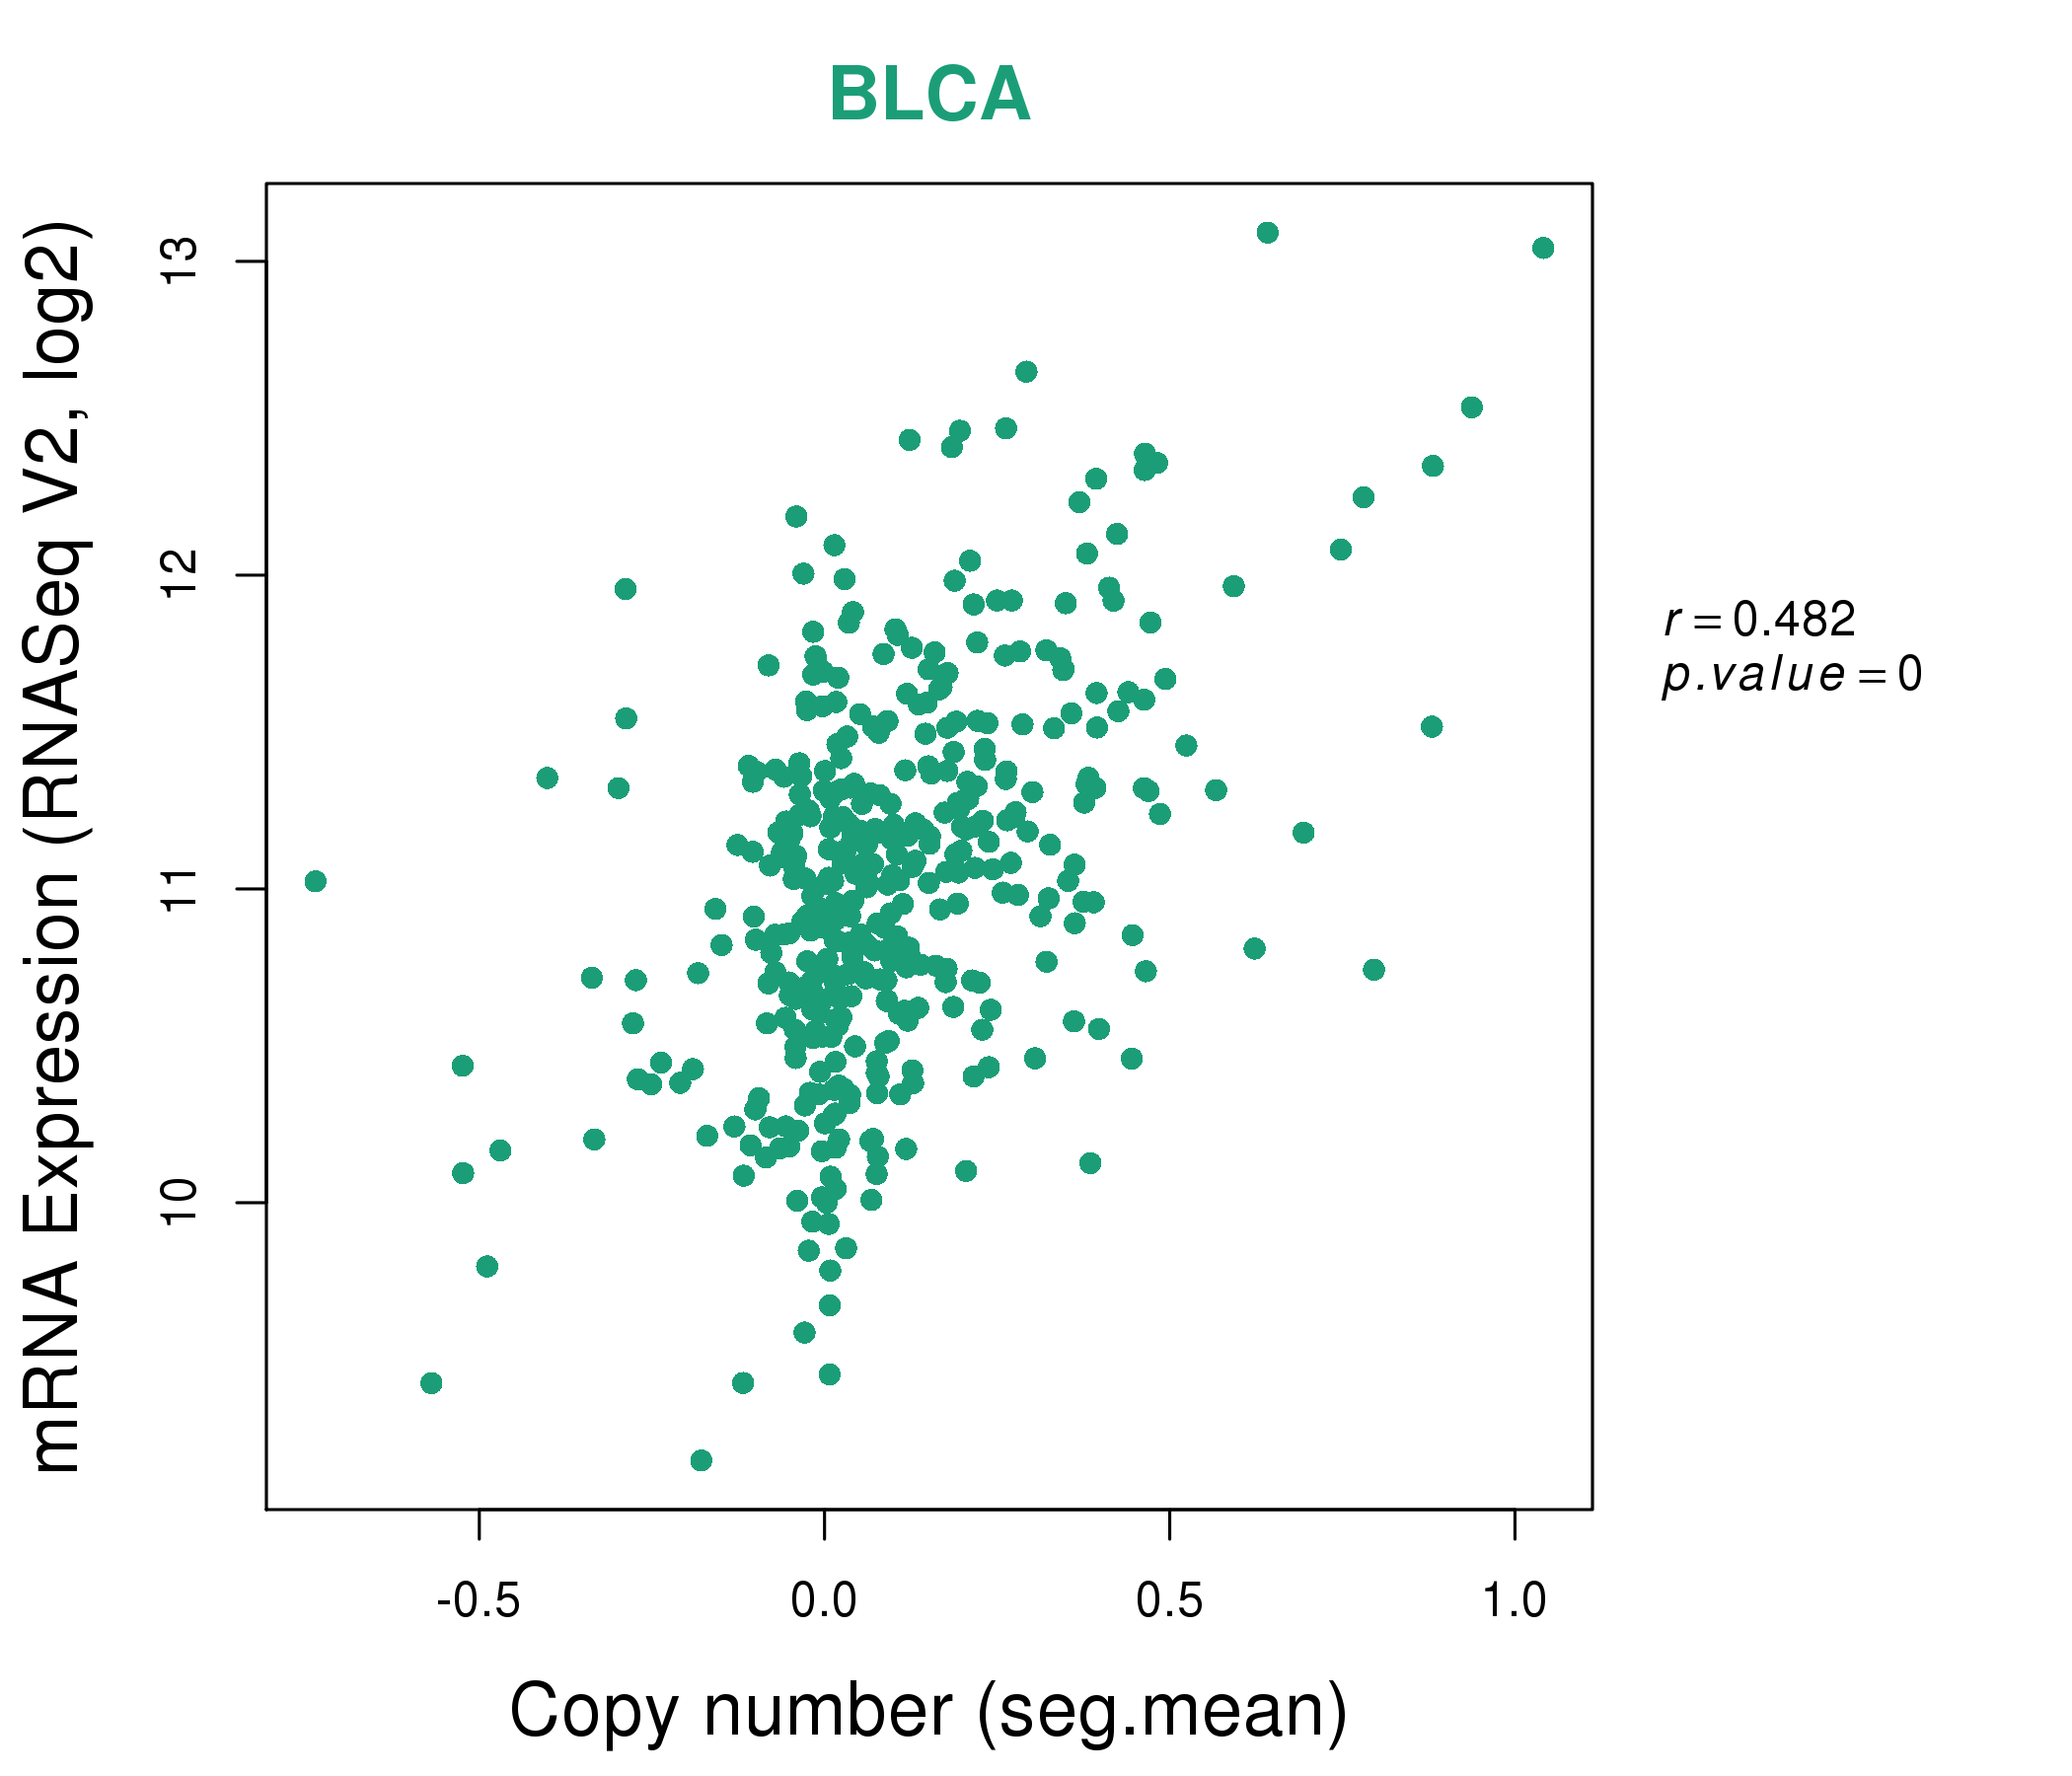
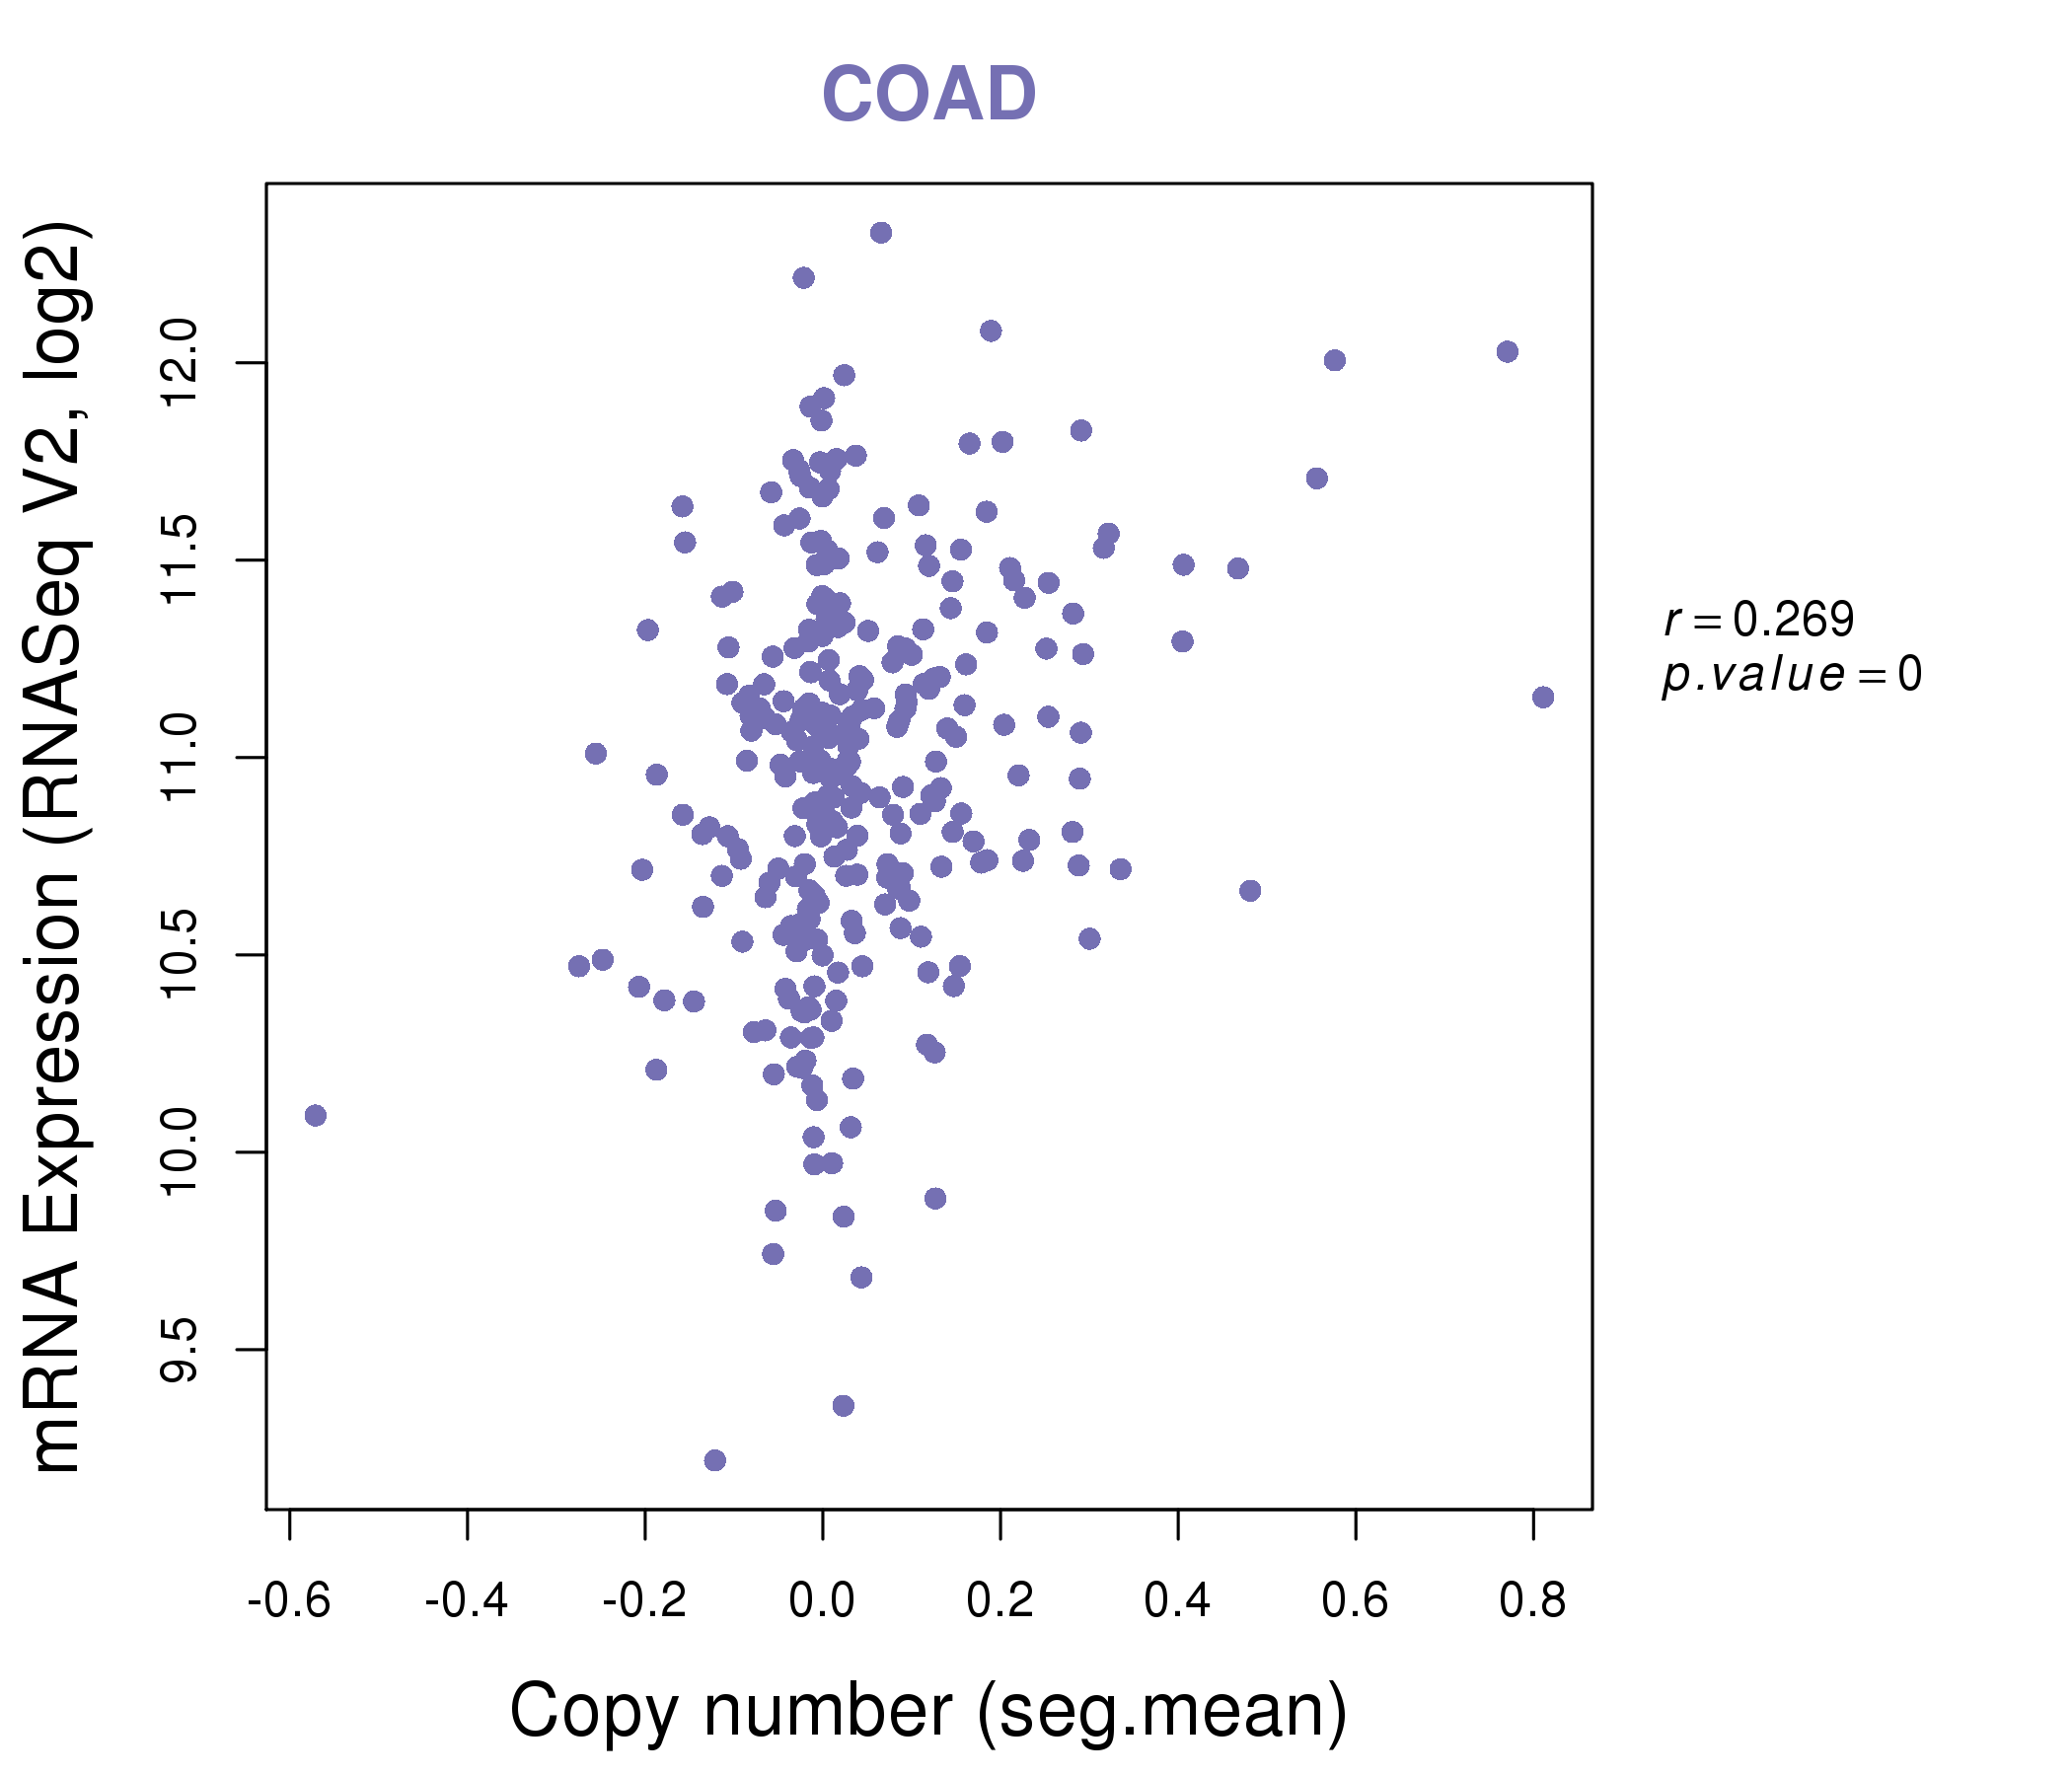
| * This plots show the correlation between CNV and gene expression. |
: Open all plots for all cancer types
 |
|
 |
|
| Top |
| Gene-Gene Network Information |
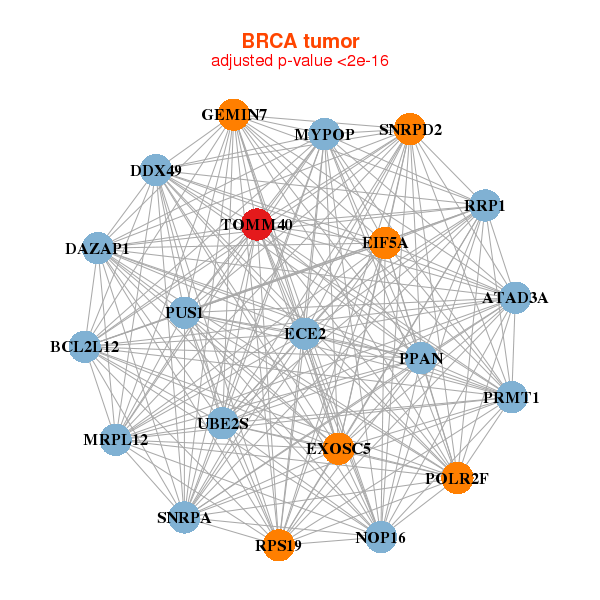
| * Co-Expression network figures were drawn using R package igraph. Only the top 20 genes with the highest correlations were shown. Red circle: input gene, orange circle: cell metabolism gene, sky circle: other gene |
: Open all plots for all cancer types
 |
|
| ATAD3A,BCL2L12,DAZAP1,DDX49,ECE2,EIF5A,EXOSC5, GEMIN7,MRPL12,MYPOP,NOP16,POLR2F,PPAN,PRMT1, PUS1,RPS19,RRP1,SNRPA,SNRPD2,TOMM40,UBE2S | ASPSCR1,ATAD3A,CTU2,DAZAP1,DDX54,FARSA,HDGFRP2, LRWD1,MPND,NOC2L,NUBP2,PES1,PNKP,PRPF31, RRP1,RRP9,RUVBL2,TIMM13,TMED1,TOMM40,ZNF787 |
 |
|
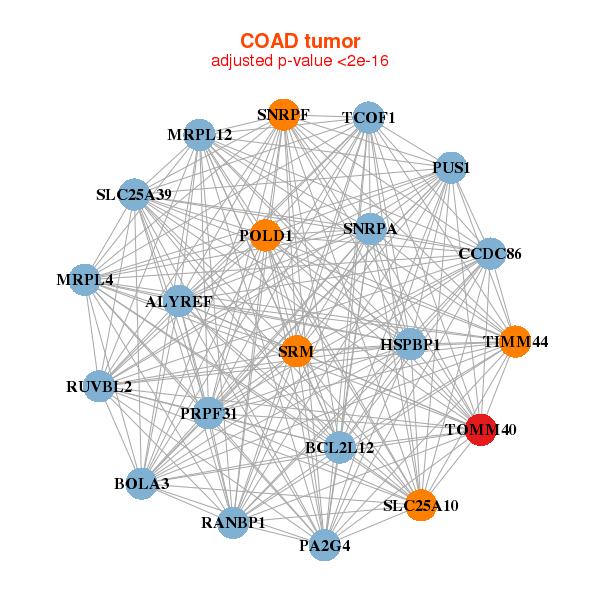
| BCL2L12,BOLA3,CCDC86,HSPBP1,MRPL12,MRPL4,PA2G4, POLD1,PRPF31,PUS1,RANBP1,RUVBL2,SLC25A10,SLC25A39, SNRPA,SNRPF,SRM,TCOF1,ALYREF,TIMM44,TOMM40 | ATAD3A,BYSL,CCDC86,DPH2,FARSA,GRWD1,NOP14, NOP2,PDF,PPAN,PPIF,PUS1,PYCRL,RRP1, RRP9,SRSF2,SLC25A19,ALYREF,TOMM40,WDR4,ZMYND19 |
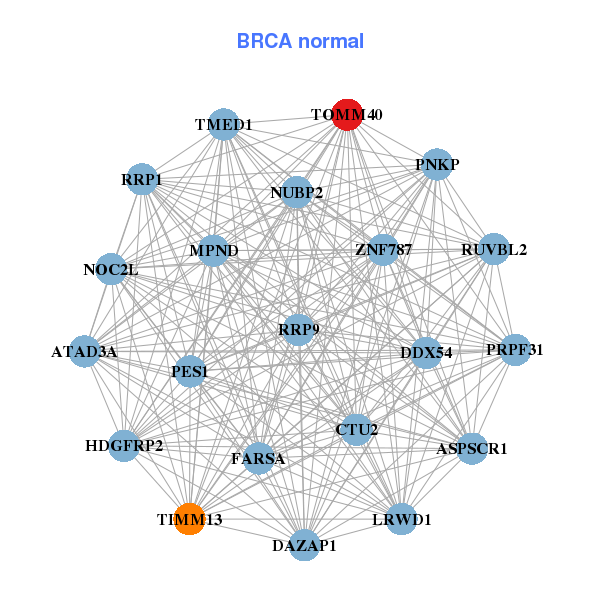
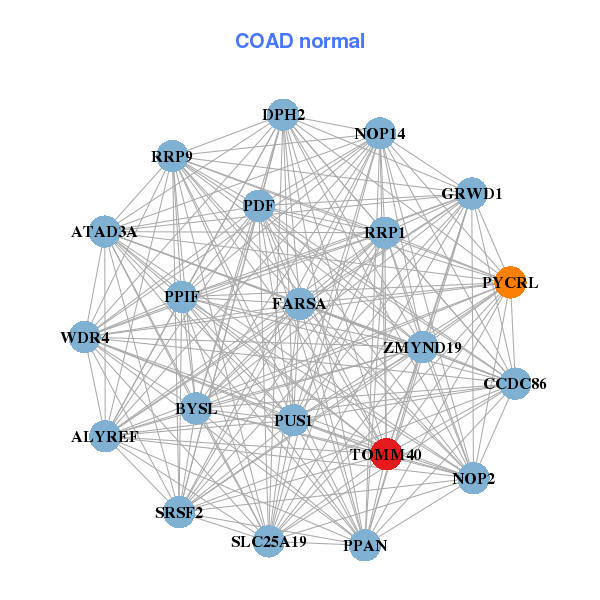
| * Co-Expression network figures were drawn using R package igraph. Only the top 20 genes with the highest correlations were shown. Red circle: input gene, orange circle: cell metabolism gene, sky circle: other gene |
: Open all plots for all cancer types
| Top |
: Open all interacting genes' information including KEGG pathway for all interacting genes from DAVID
| Top |
| Pharmacological Information for TOMM40 |
| There's no related Drug. |
| Top |
| Cross referenced IDs for TOMM40 |
| * We obtained these cross-references from Uniprot database. It covers 150 different DBs, 18 categories. http://www.uniprot.org/help/cross_references_section |
: Open all cross reference information
|
Copyright © 2016-Present - The Univsersity of Texas Health Science Center at Houston @ |