|
||||||||||||||||||||
| |
| Phenotypic Information (metabolism pathway, cancer, disease, phenome) |
| |
| |
| Gene-Gene Network Information: Co-Expression Network, Interacting Genes & KEGG |
| |
|


| Gene Summary for ECI2 |
| Basic gene info. | Gene symbol | ECI2 |
| Gene name | enoyl-CoA delta isomerase 2 | |
| Synonyms | ACBD2|DRS-1|DRS1|HCA88|PECI|dJ1013A10.3 | |
| Cytomap | UCSC genome browser: 6p24.3 | |
| Genomic location | chr6 :4115926-4135831 | |
| Type of gene | protein-coding | |
| RefGenes | NM_001166010.1, NM_006117.2,NM_206836.2,NR_028588.1, | |
| Ensembl id | ENSG00000198721 | |
| Description | D3,D2-enoyl-CoA isomeraseDBI-related protein 1acyl-Coenzyme A binding domain containing 2delta(3),delta(2)-enoyl-CoA isomerasediazepam-binding inhibitor-related protein 1dodecenoyl-CoA isomeraseenoyl-CoA delta isomerase 2, mitochondrialhepatocellul | |
| Modification date | 20141211 | |
| dbXrefs | MIM : 608024 | |
| HGNC : HGNC | ||
| Ensembl : ENSG00000198721 | ||
| HPRD : 16269 | ||
| Vega : OTTHUMG00000014158 | ||
| Protein | UniProt: go to UniProt's Cross Reference DB Table | |
| Expression | CleanEX: HS_ECI2 | |
| BioGPS: 10455 | ||
| Gene Expression Atlas: ENSG00000198721 | ||
| The Human Protein Atlas: ENSG00000198721 | ||
| Pathway | NCI Pathway Interaction Database: ECI2 | |
| KEGG: ECI2 | ||
| REACTOME: ECI2 | ||
| ConsensusPathDB | ||
| Pathway Commons: ECI2 | ||
| Metabolism | MetaCyc: ECI2 | |
| HUMANCyc: ECI2 | ||
| Regulation | Ensembl's Regulation: ENSG00000198721 | |
| miRBase: chr6 :4,115,926-4,135,831 | ||
| TargetScan: NM_001166010 | ||
| cisRED: ENSG00000198721 | ||
| Context | iHOP: ECI2 | |
| cancer metabolism search in PubMed: ECI2 | ||
| UCL Cancer Institute: ECI2 | ||
| Assigned class in ccmGDB | C | |
| Top |
| Phenotypic Information for ECI2(metabolism pathway, cancer, disease, phenome) |
| Cancer | CGAP: ECI2 |
| Familial Cancer Database: ECI2 | |
| * This gene is included in those cancer gene databases. |
|
|
|
|
|
|
| ||||||||||||||
Oncogene 1 | Significant driver gene in | |||||||||||||||||||
| cf) number; DB name 1 Oncogene; http://nar.oxfordjournals.org/content/35/suppl_1/D721.long, 2 Tumor Suppressor gene; https://bioinfo.uth.edu/TSGene/, 3 Cancer Gene Census; http://www.nature.com/nrc/journal/v4/n3/abs/nrc1299.html, 4 CancerGenes; http://nar.oxfordjournals.org/content/35/suppl_1/D721.long, 5 Network of Cancer Gene; http://ncg.kcl.ac.uk/index.php, 1Therapeutic Vulnerabilities in Cancer; http://cbio.mskcc.org/cancergenomics/statius/ |
| KEGG_FATTY_ACID_METABOLISM | |
| OMIM | |
| Orphanet | |
| Disease | KEGG Disease: ECI2 |
| MedGen: ECI2 (Human Medical Genetics with Condition) | |
| ClinVar: ECI2 | |
| Phenotype | MGI: ECI2 (International Mouse Phenotyping Consortium) |
| PhenomicDB: ECI2 | |
| Mutations for ECI2 |
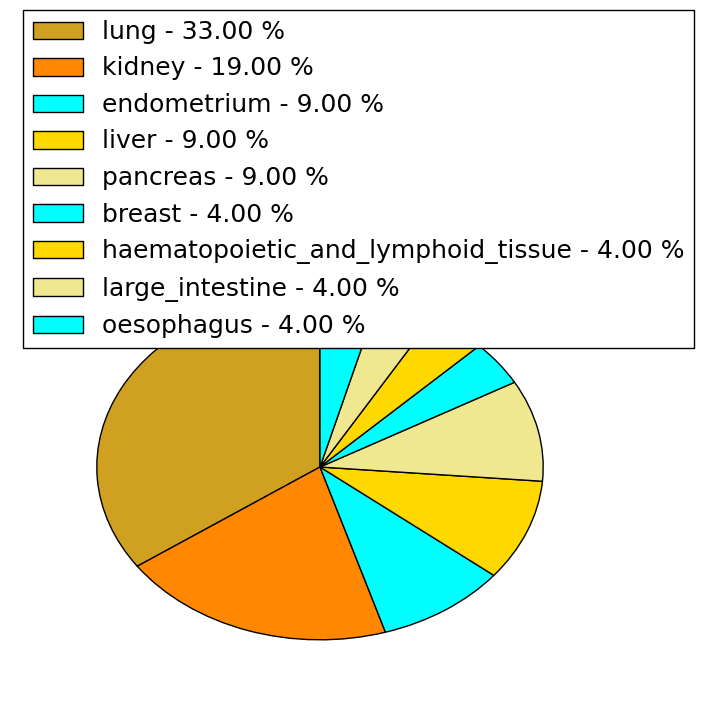
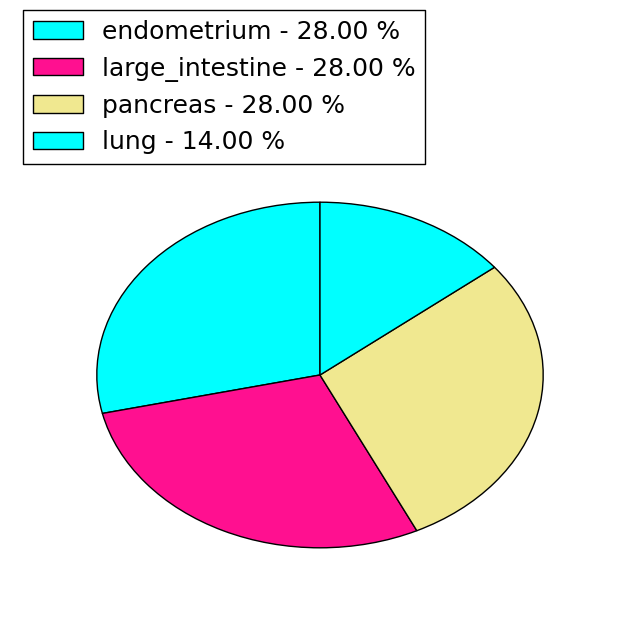
| * Under tables are showing count per each tissue to give us broad intuition about tissue specific mutation patterns.You can go to the detailed page for each mutation database's web site. |
| There's no structural variation information in COSMIC data for this gene. |
| * From mRNA Sanger sequences, Chitars2.0 arranged chimeric transcripts. This table shows ECI2 related fusion information. |
| ID | Head Gene | Tail Gene | Accession | Gene_a | qStart_a | qEnd_a | Chromosome_a | tStart_a | tEnd_a | Gene_a | qStart_a | qEnd_a | Chromosome_a | tStart_a | tEnd_a |
| Top |
| There's no copy number variation information in COSMIC data for this gene. |
| Top |
|
 |
| Top |
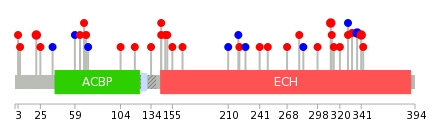
| Stat. for Non-Synonymous SNVs (# total SNVs=21) | (# total SNVs=7) |
 |  |
(# total SNVs=0) | (# total SNVs=0) |
| Top |
| * When you move the cursor on each content, you can see more deailed mutation information on the Tooltip. Those are primary_site,primary_histology,mutation(aa),pubmedID. |
| GRCh37 position | Mutation(aa) | Unique sampleID count |
| chr6:4130803-4130803 | p.? | 2 |
| chr6:4116182-4116182 | p.L341F | 2 |
| chr6:4116192-4116192 | p.E337E | 2 |
| chr6:4128046-4128046 | p.R144H | 2 |
| chr6:4133844-4133844 | p.K21I | 2 |
| chr6:4117549-4117549 | p.P311L | 2 |
| chr6:4116175-4116175 | p.G343E | 1 |
| chr6:4117587-4117587 | p.K298N | 1 |
| chr6:4126460-4126460 | p.Y165D | 1 |
| chr6:4131009-4131009 | p.L72L | 1 |
| Top |
|
 |
| Point Mutation/ Tissue ID | 1 | 2 | 3 | 4 | 5 | 6 | 7 | 8 | 9 | 10 | 11 | 12 | 13 | 14 | 15 | 16 | 17 | 18 | 19 | 20 |
| # sample | 3 | 2 | 1 | 3 | 1 | 2 | 2 | 1 | 2 | 2 | 4 | |||||||||
| # mutation | 3 | 2 | 1 | 3 | 1 | 3 | 2 | 1 | 2 | 2 | 4 | |||||||||
| nonsynonymous SNV | 2 | 1 | 1 | 3 | 1 | 1 | 1 | 2 | 1 | 2 | ||||||||||
| synonymous SNV | 1 | 1 | 1 | 2 | 1 | 1 | 2 |
| cf) Tissue ID; Tissue type (1; BLCA[Bladder Urothelial Carcinoma], 2; BRCA[Breast invasive carcinoma], 3; CESC[Cervical squamous cell carcinoma and endocervical adenocarcinoma], 4; COAD[Colon adenocarcinoma], 5; GBM[Glioblastoma multiforme], 6; Glioma Low Grade, 7; HNSC[Head and Neck squamous cell carcinoma], 8; KICH[Kidney Chromophobe], 9; KIRC[Kidney renal clear cell carcinoma], 10; KIRP[Kidney renal papillary cell carcinoma], 11; LAML[Acute Myeloid Leukemia], 12; LUAD[Lung adenocarcinoma], 13; LUSC[Lung squamous cell carcinoma], 14; OV[Ovarian serous cystadenocarcinoma ], 15; PAAD[Pancreatic adenocarcinoma], 16; PRAD[Prostate adenocarcinoma], 17; SKCM[Skin Cutaneous Melanoma], 18:STAD[Stomach adenocarcinoma], 19:THCA[Thyroid carcinoma], 20:UCEC[Uterine Corpus Endometrial Carcinoma]) |
| Top |
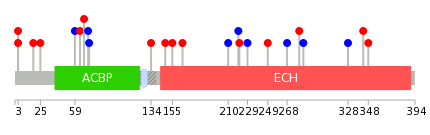
| * We represented just top 10 SNVs. When you move the cursor on each content, you can see more deailed mutation information on the Tooltip. Those are primary_site, primary_histology, mutation(aa), pubmedID. |
| Genomic Position | Mutation(aa) | Unique sampleID count |
| chr6:4116219 | p.D64N,ECI2 | 1 |
| chr6:4128035 | p.E328E,ECI2 | 1 |
| chr6:4117629 | p.N59N,ECI2 | 1 |
| chr6:4130615 | p.Q284Q,ECI2 | 1 |
| chr6:4117641 | p.K25R,ECI2 | 1 |
| chr6:4131004 | p.E280D,ECI2 | 1 |
| chr6:4117677 | p.R3K,ECI2 | 1 |
| chr6:4131009 | p.E268E,ECI2 | 1 |
| chr6:4119470 | p.P249T,ECI2 | 1 |
| chr6:4131020 | p.S18Y | 1 |
| * Copy number data were extracted from TCGA using R package TCGA-Assembler. The URLs of all public data files on TCGA DCC data server were gathered on Jan-05-2015. Function ProcessCNAData in TCGA-Assembler package was used to obtain gene-level copy number value which is calculated as the average copy number of the genomic region of a gene. |
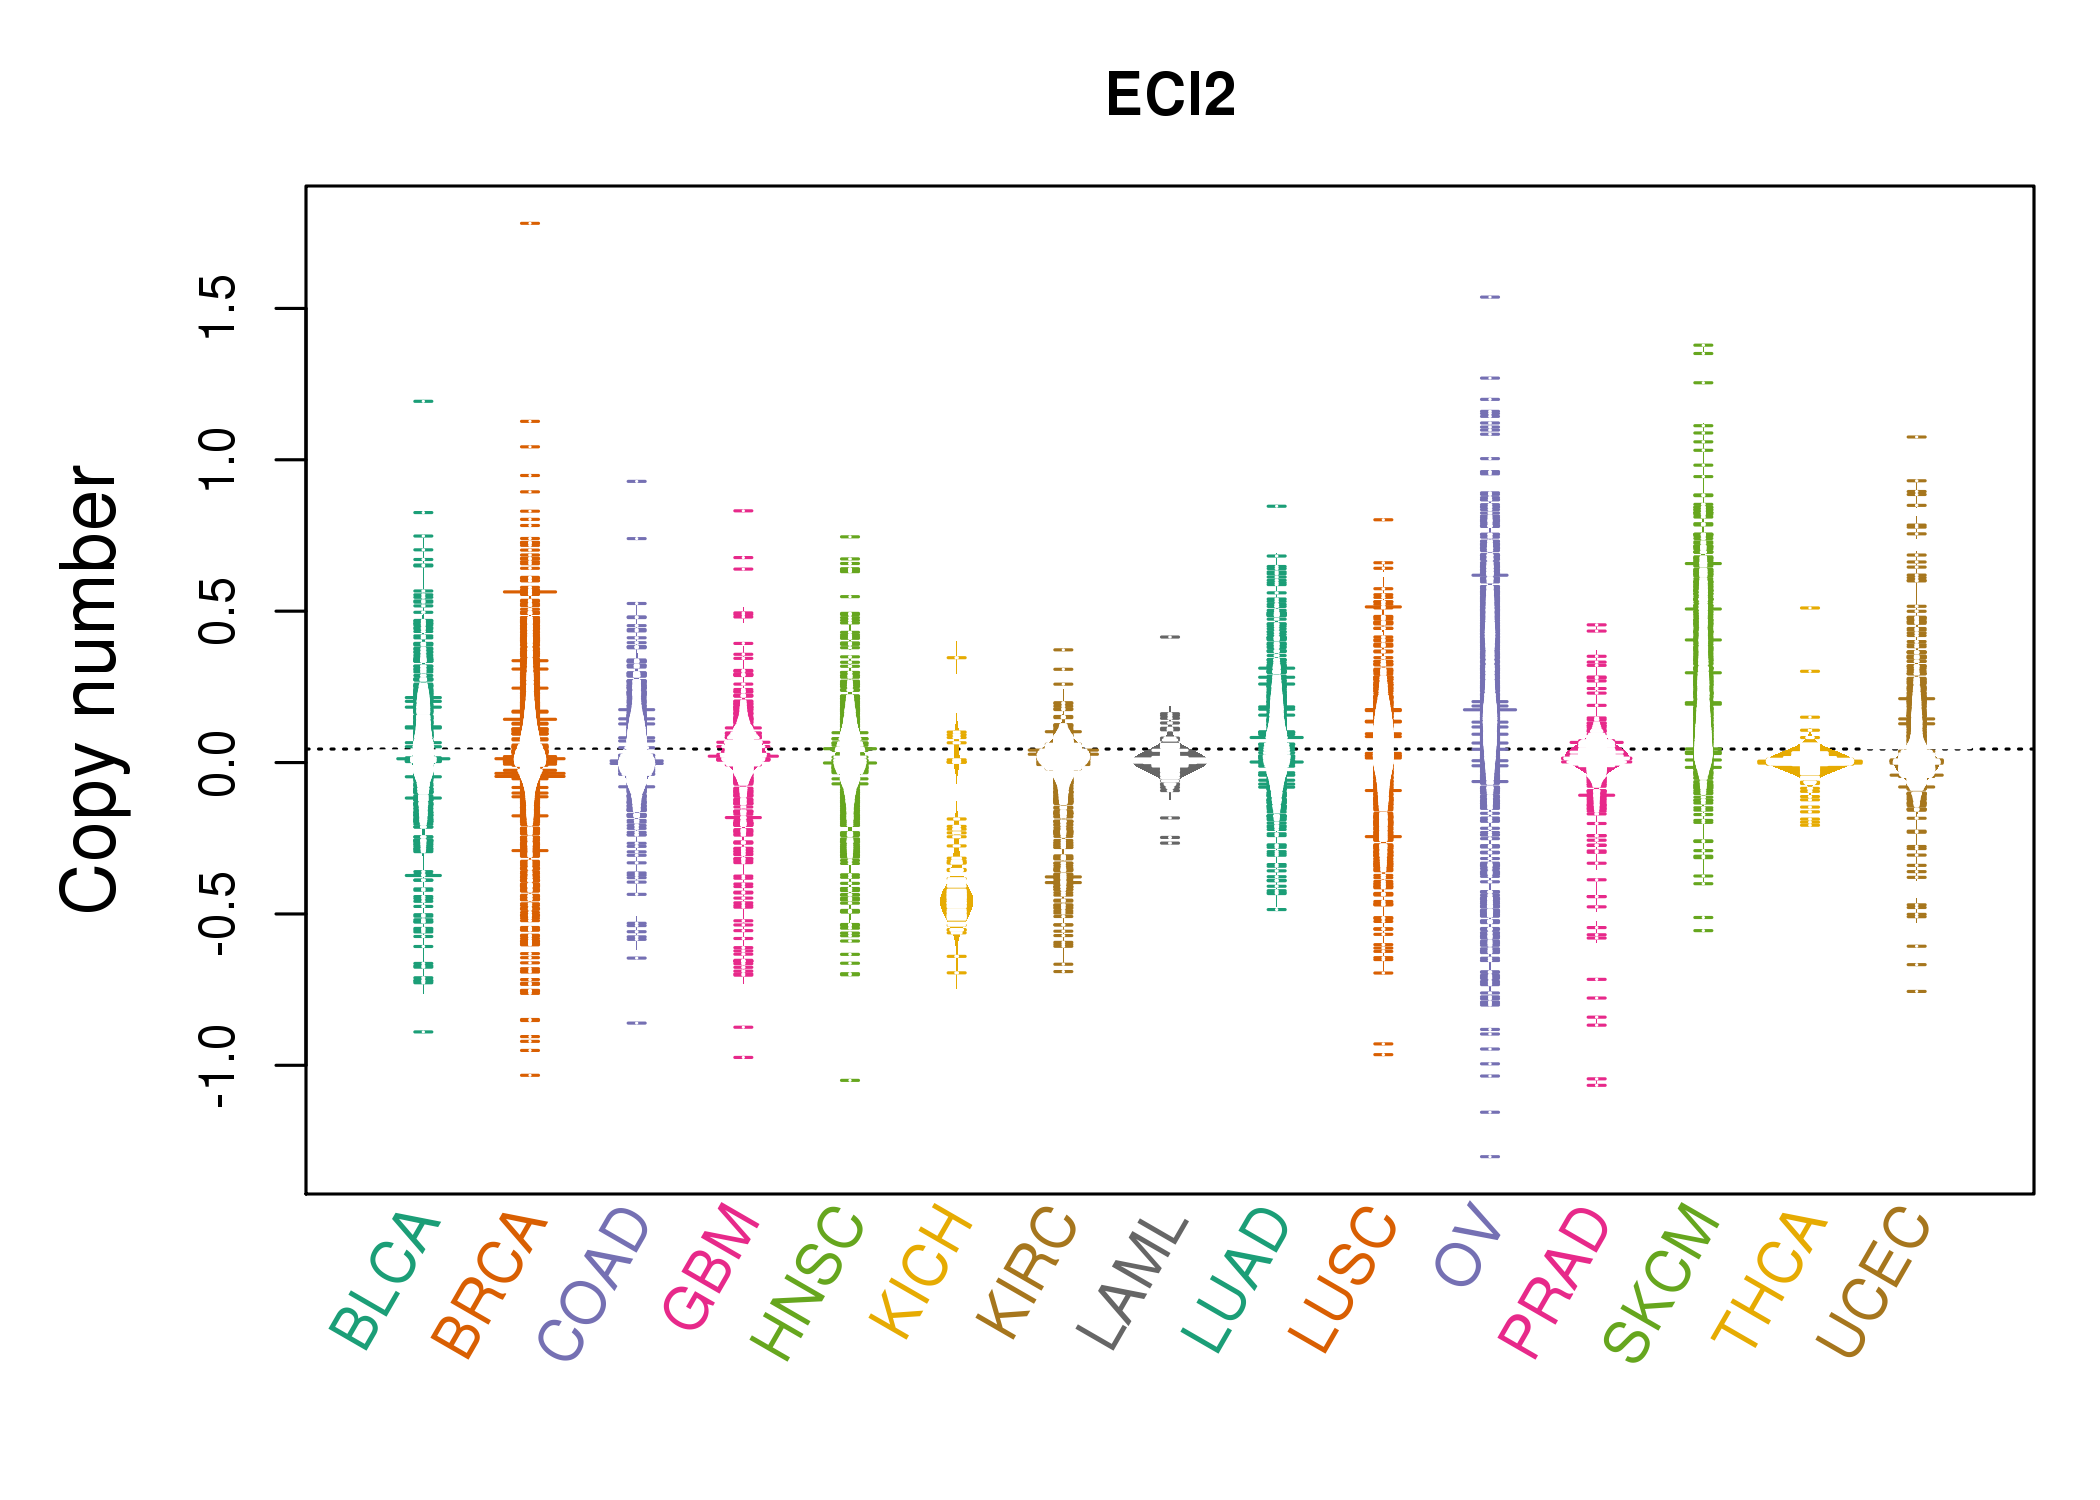 |
| cf) Tissue ID[Tissue type]: BLCA[Bladder Urothelial Carcinoma], BRCA[Breast invasive carcinoma], CESC[Cervical squamous cell carcinoma and endocervical adenocarcinoma], COAD[Colon adenocarcinoma], GBM[Glioblastoma multiforme], Glioma Low Grade, HNSC[Head and Neck squamous cell carcinoma], KICH[Kidney Chromophobe], KIRC[Kidney renal clear cell carcinoma], KIRP[Kidney renal papillary cell carcinoma], LAML[Acute Myeloid Leukemia], LUAD[Lung adenocarcinoma], LUSC[Lung squamous cell carcinoma], OV[Ovarian serous cystadenocarcinoma ], PAAD[Pancreatic adenocarcinoma], PRAD[Prostate adenocarcinoma], SKCM[Skin Cutaneous Melanoma], STAD[Stomach adenocarcinoma], THCA[Thyroid carcinoma], UCEC[Uterine Corpus Endometrial Carcinoma] |
| Top |
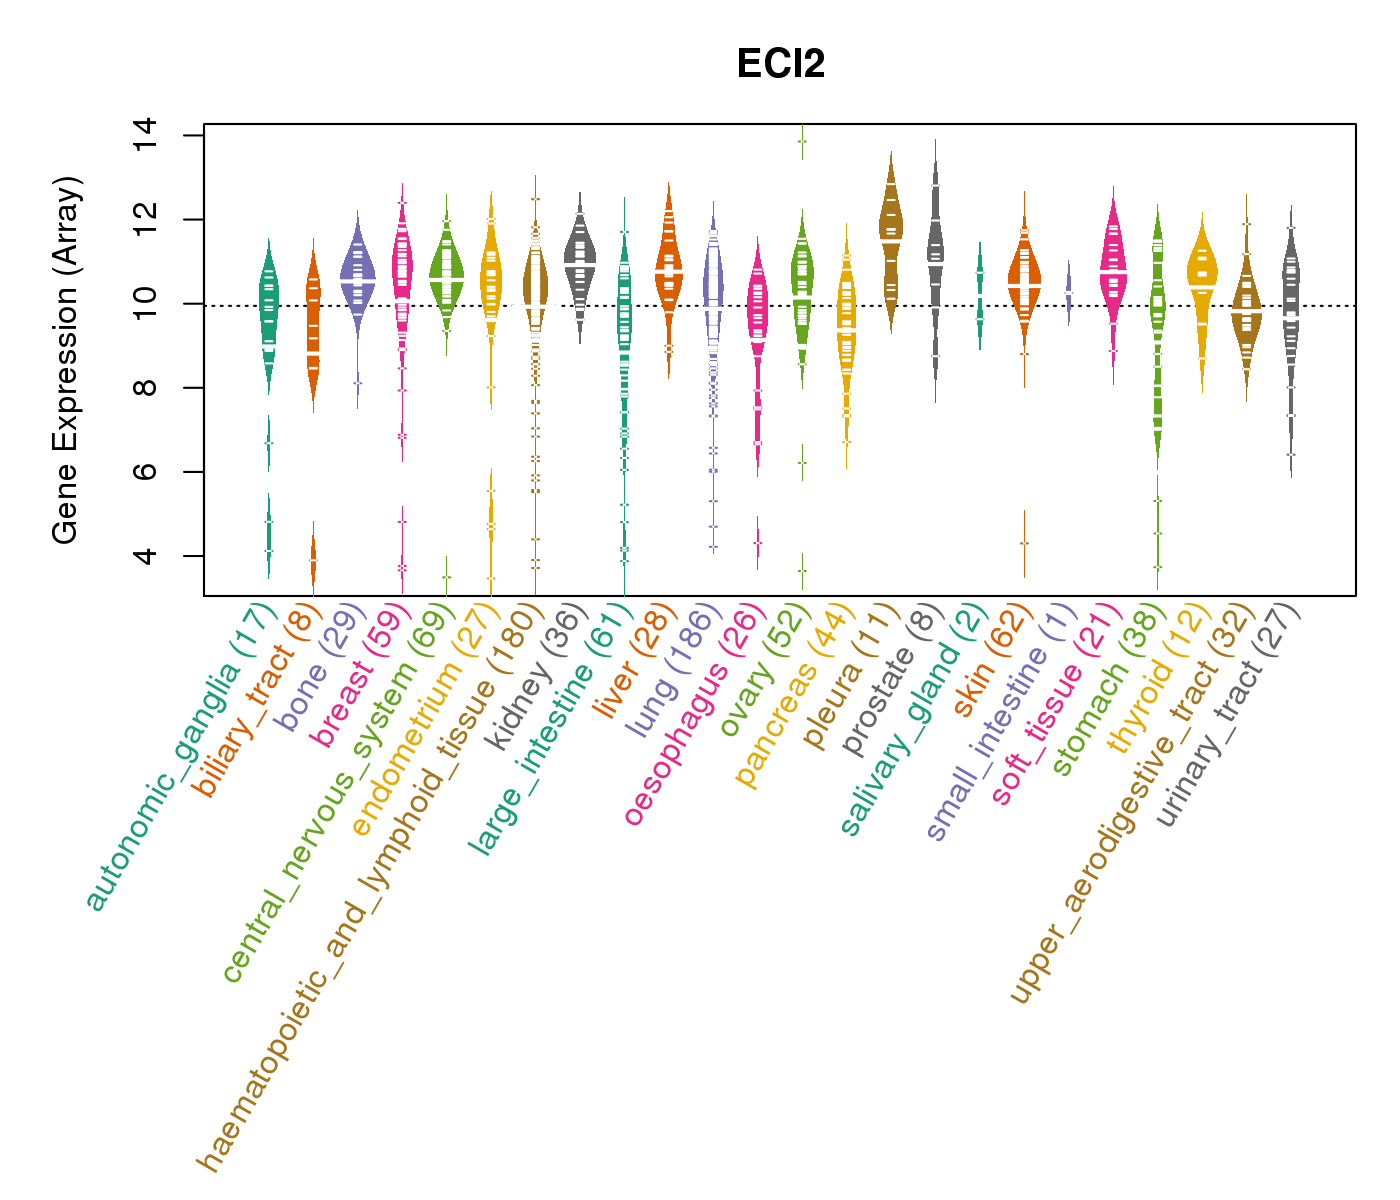
| Gene Expression for ECI2 |
| * CCLE gene expression data were extracted from CCLE_Expression_Entrez_2012-10-18.res: Gene-centric RMA-normalized mRNA expression data. |
 |
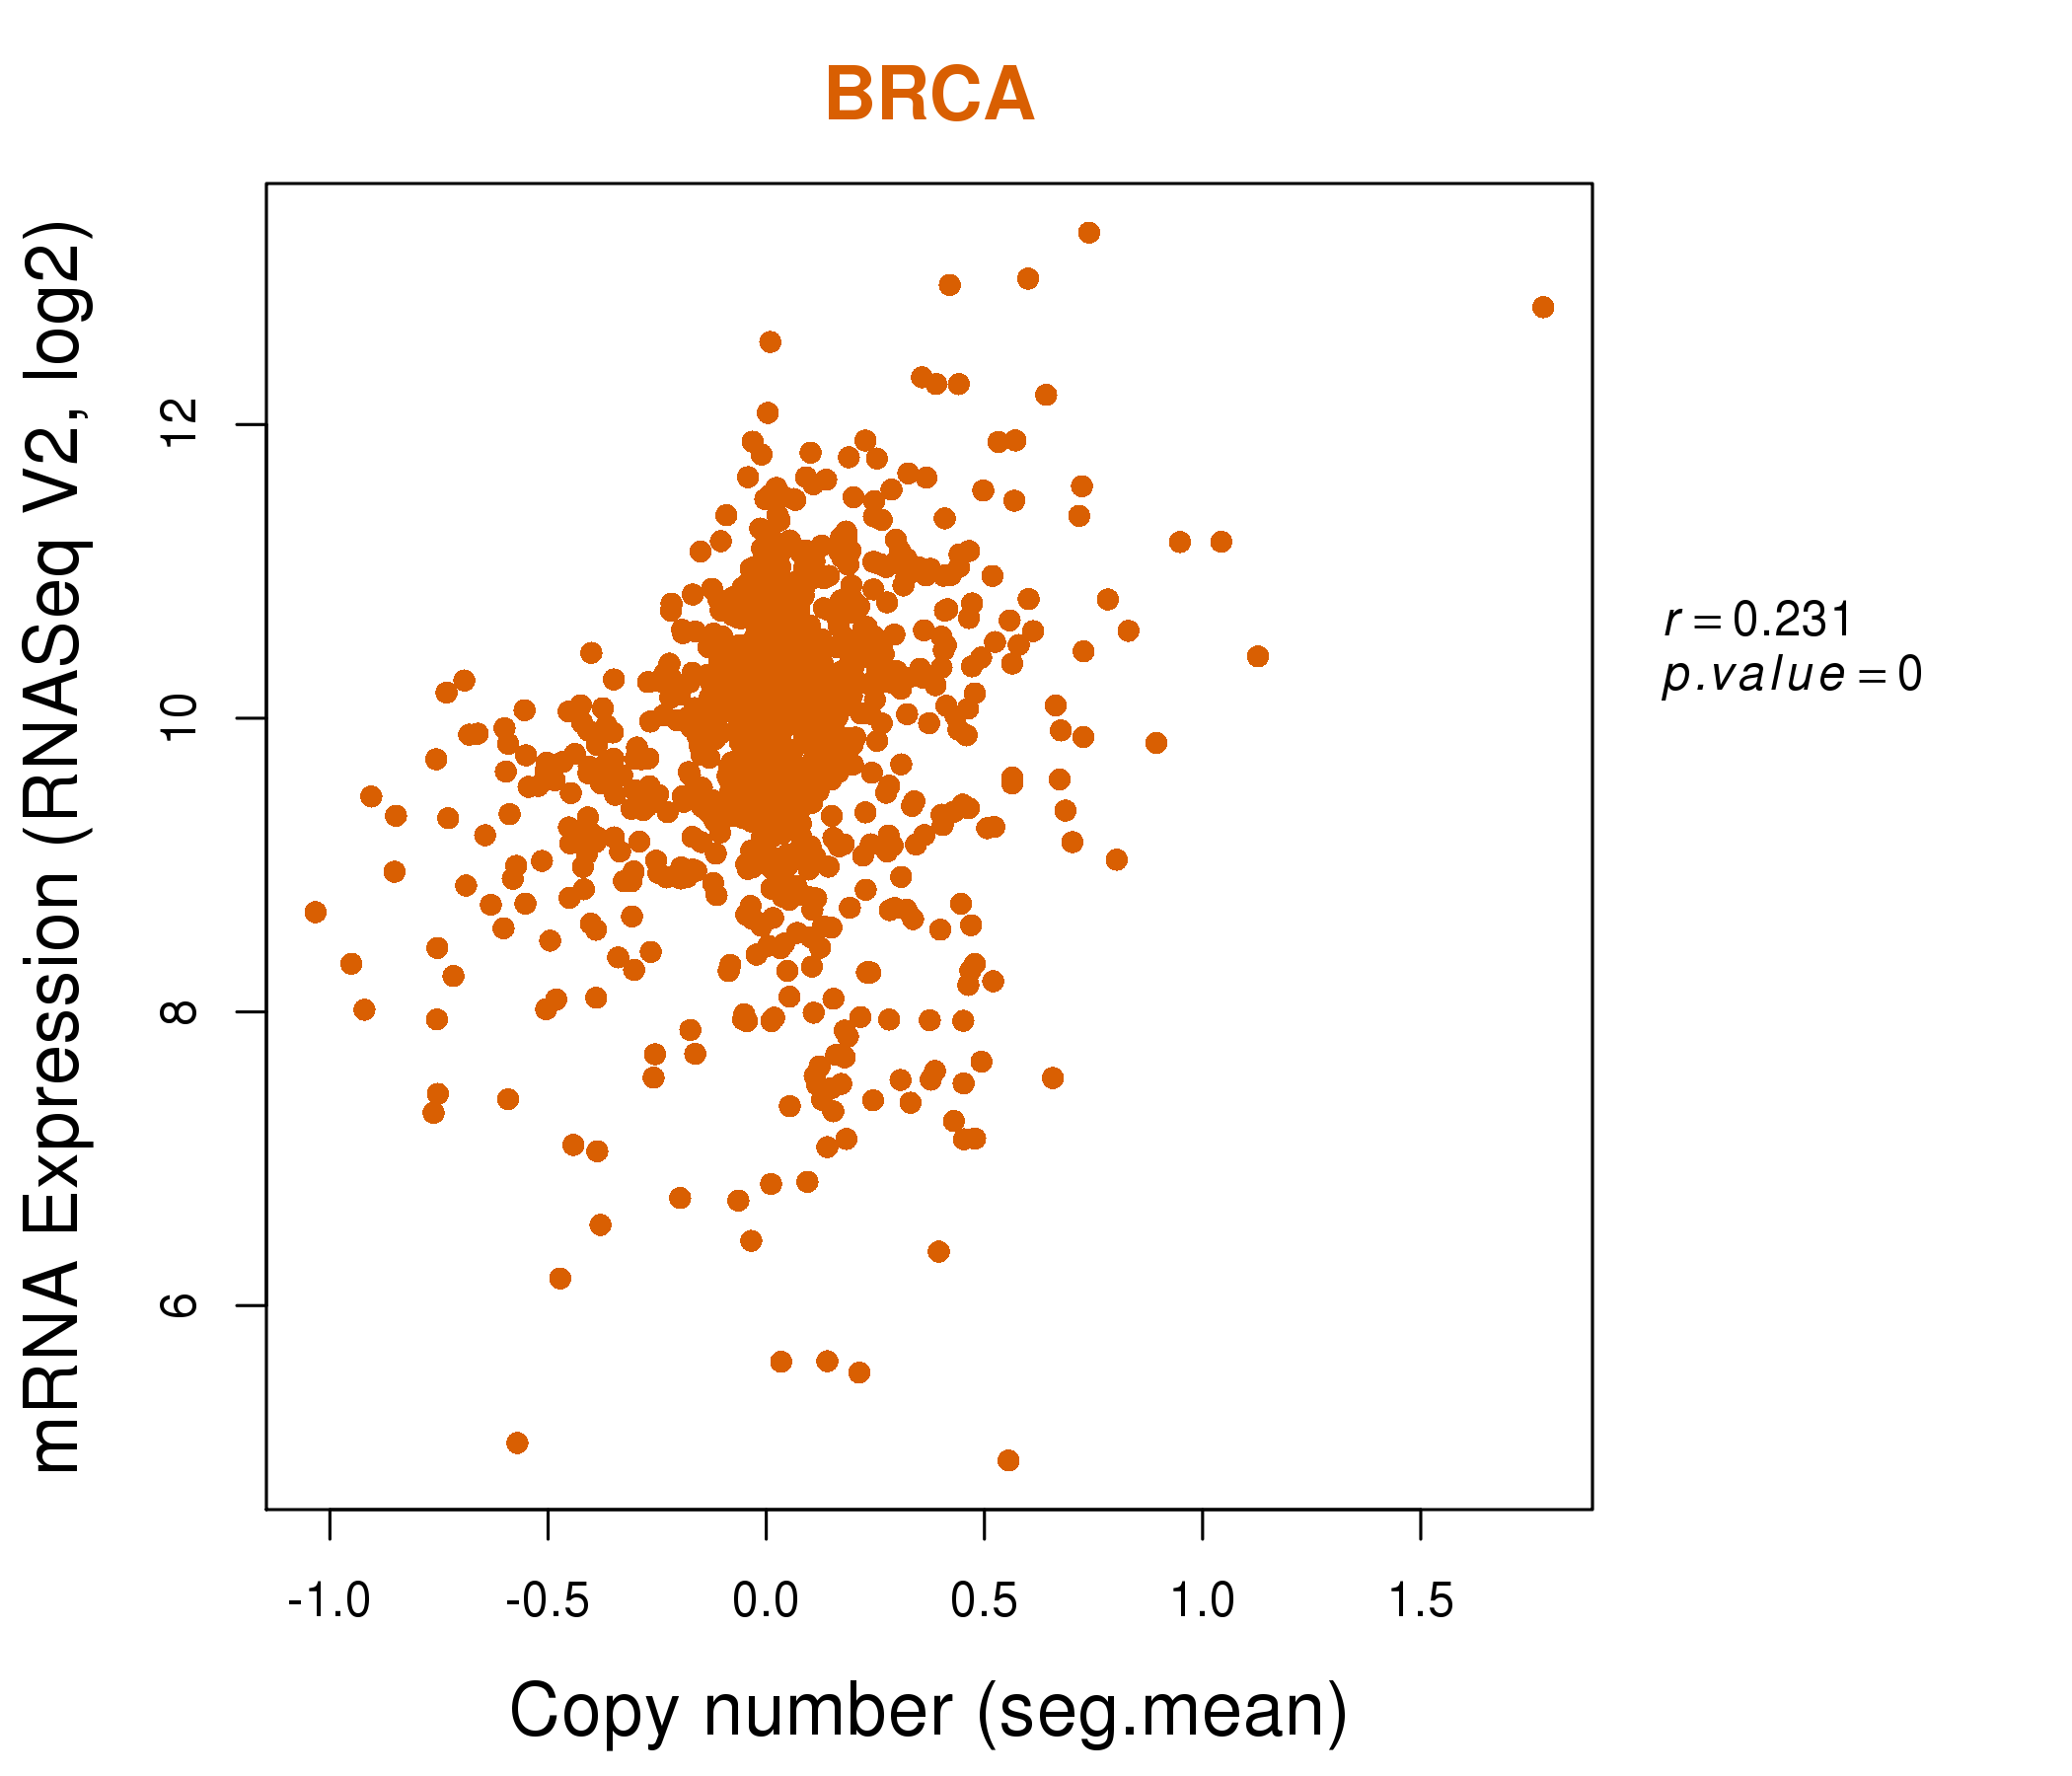
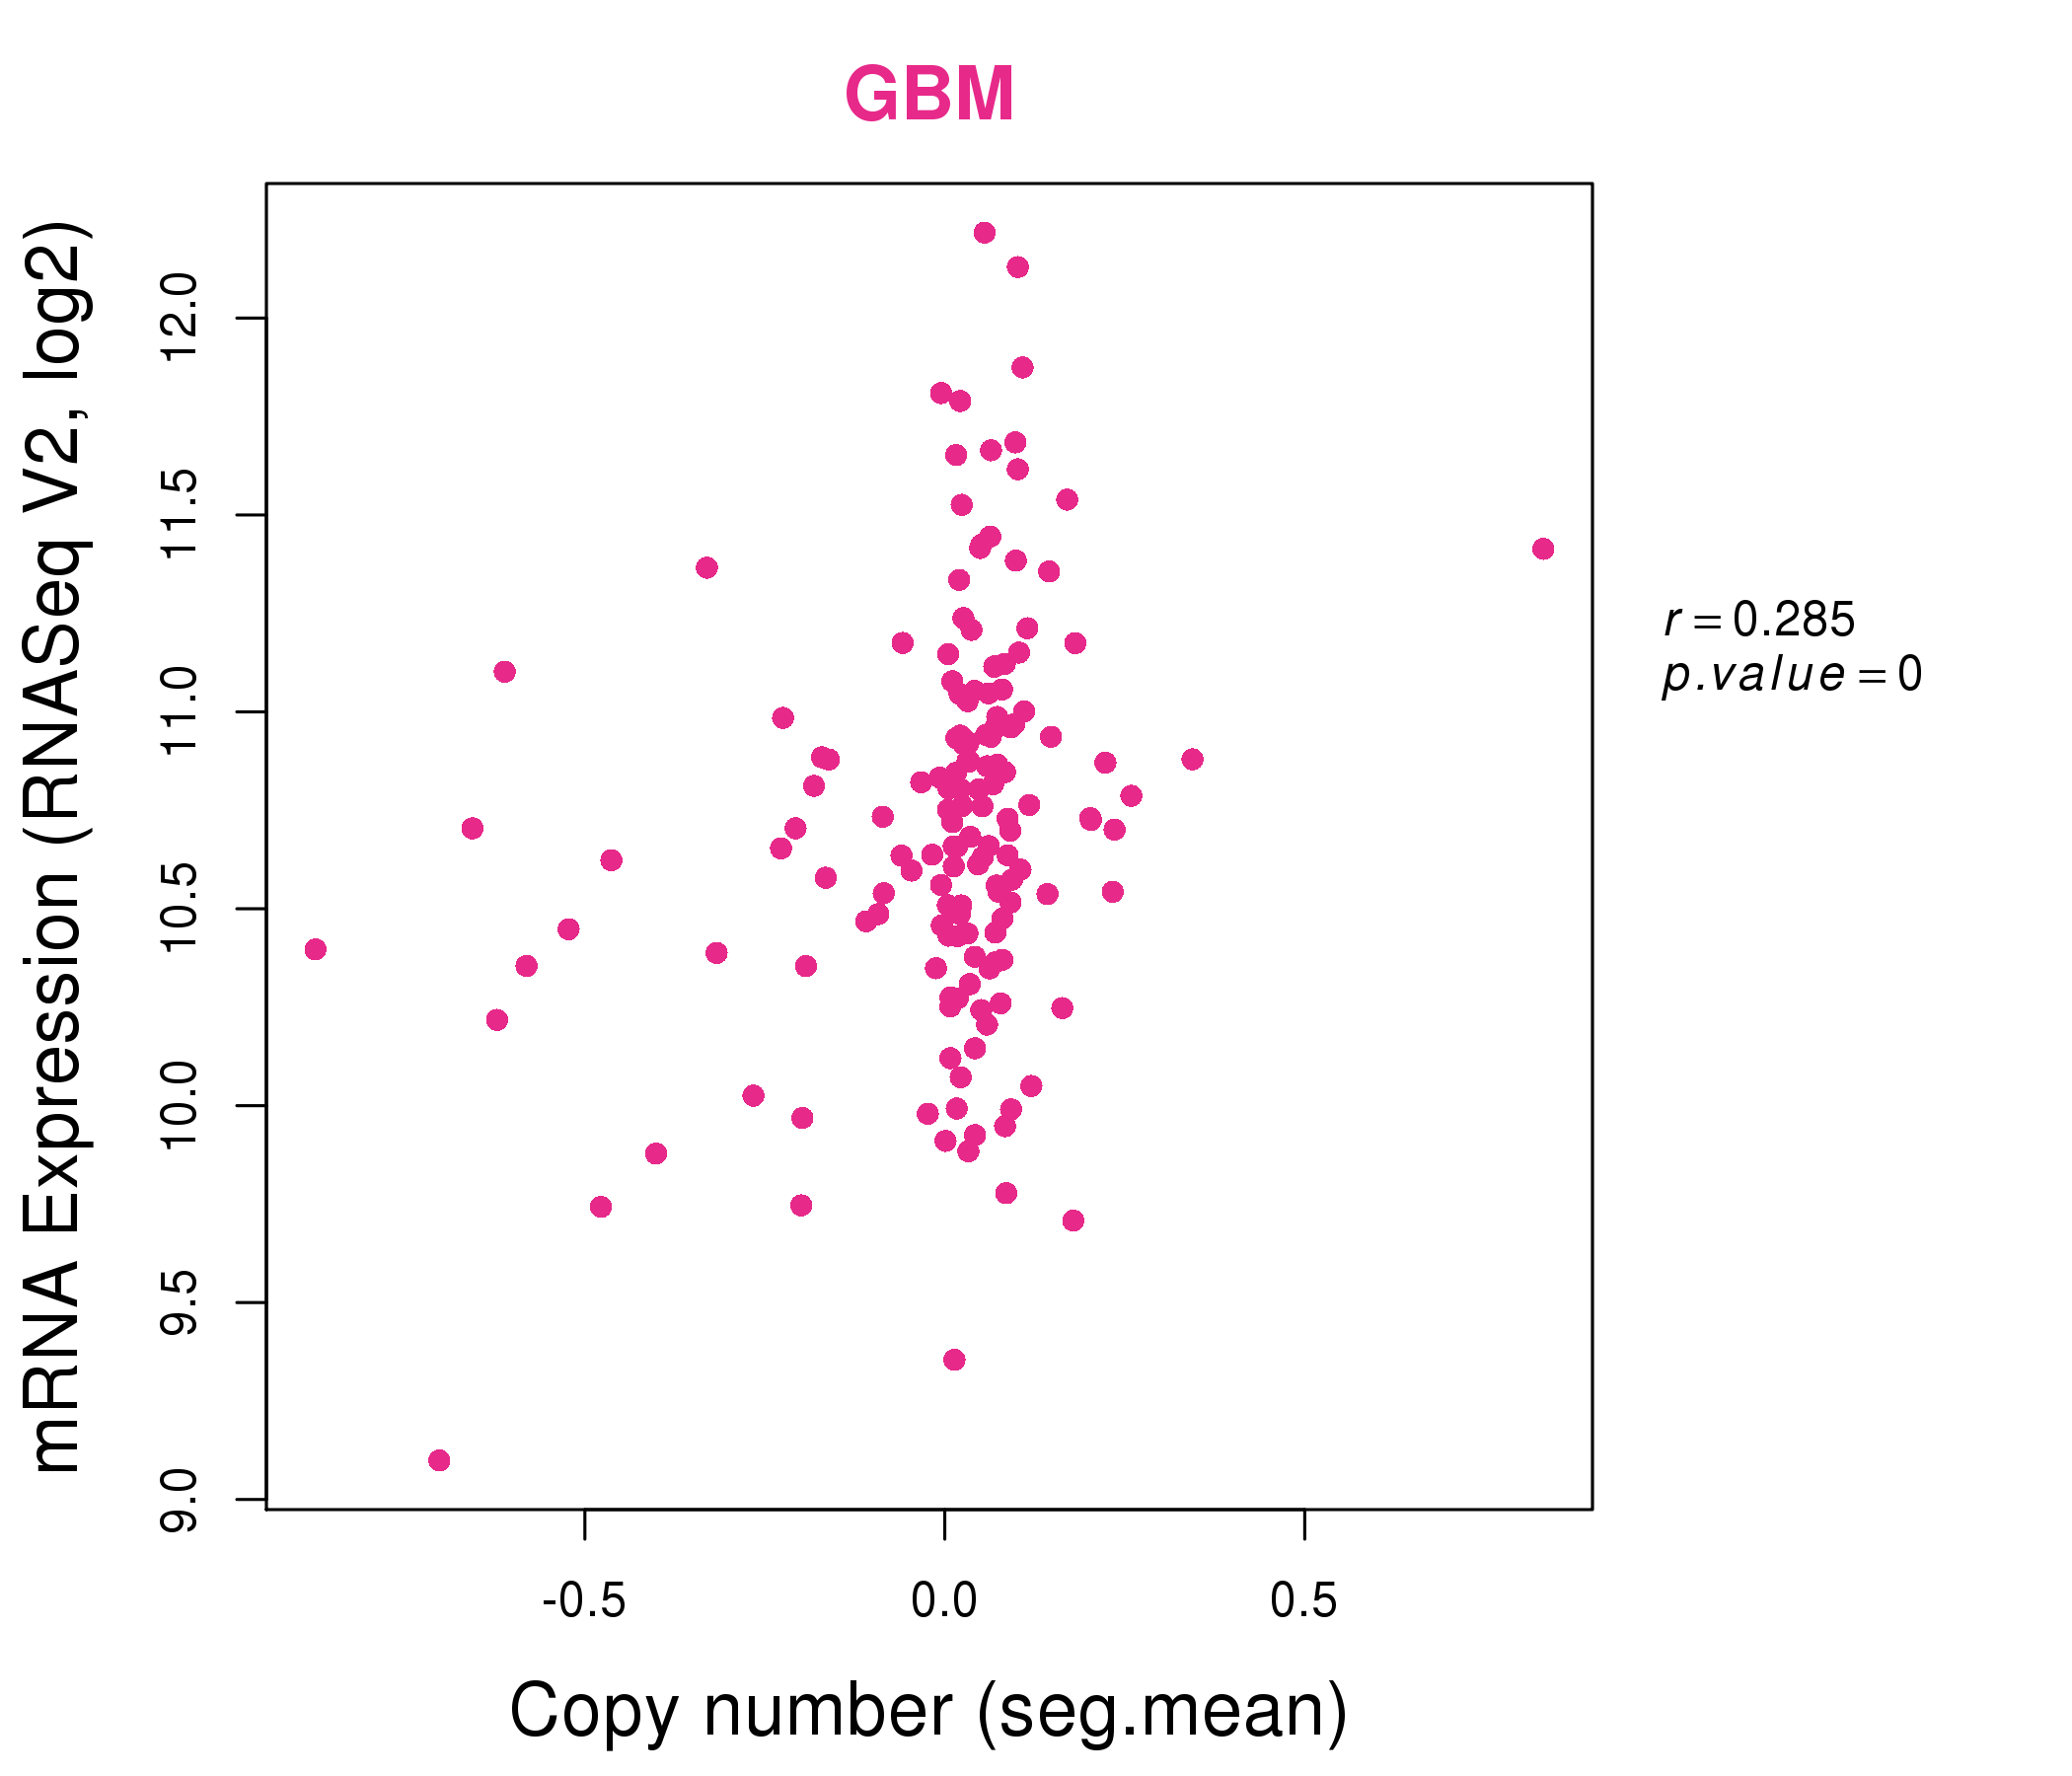
| * Normalized gene expression data of RNASeqV2 was extracted from TCGA using R package TCGA-Assembler. The URLs of all public data files on TCGA DCC data server were gathered at Jan-05-2015. Only eight cancer types have enough normal control samples for differential expression analysis. (t test, adjusted p<0.05 (using Benjamini-Hochberg FDR)) |
 |
| Top |
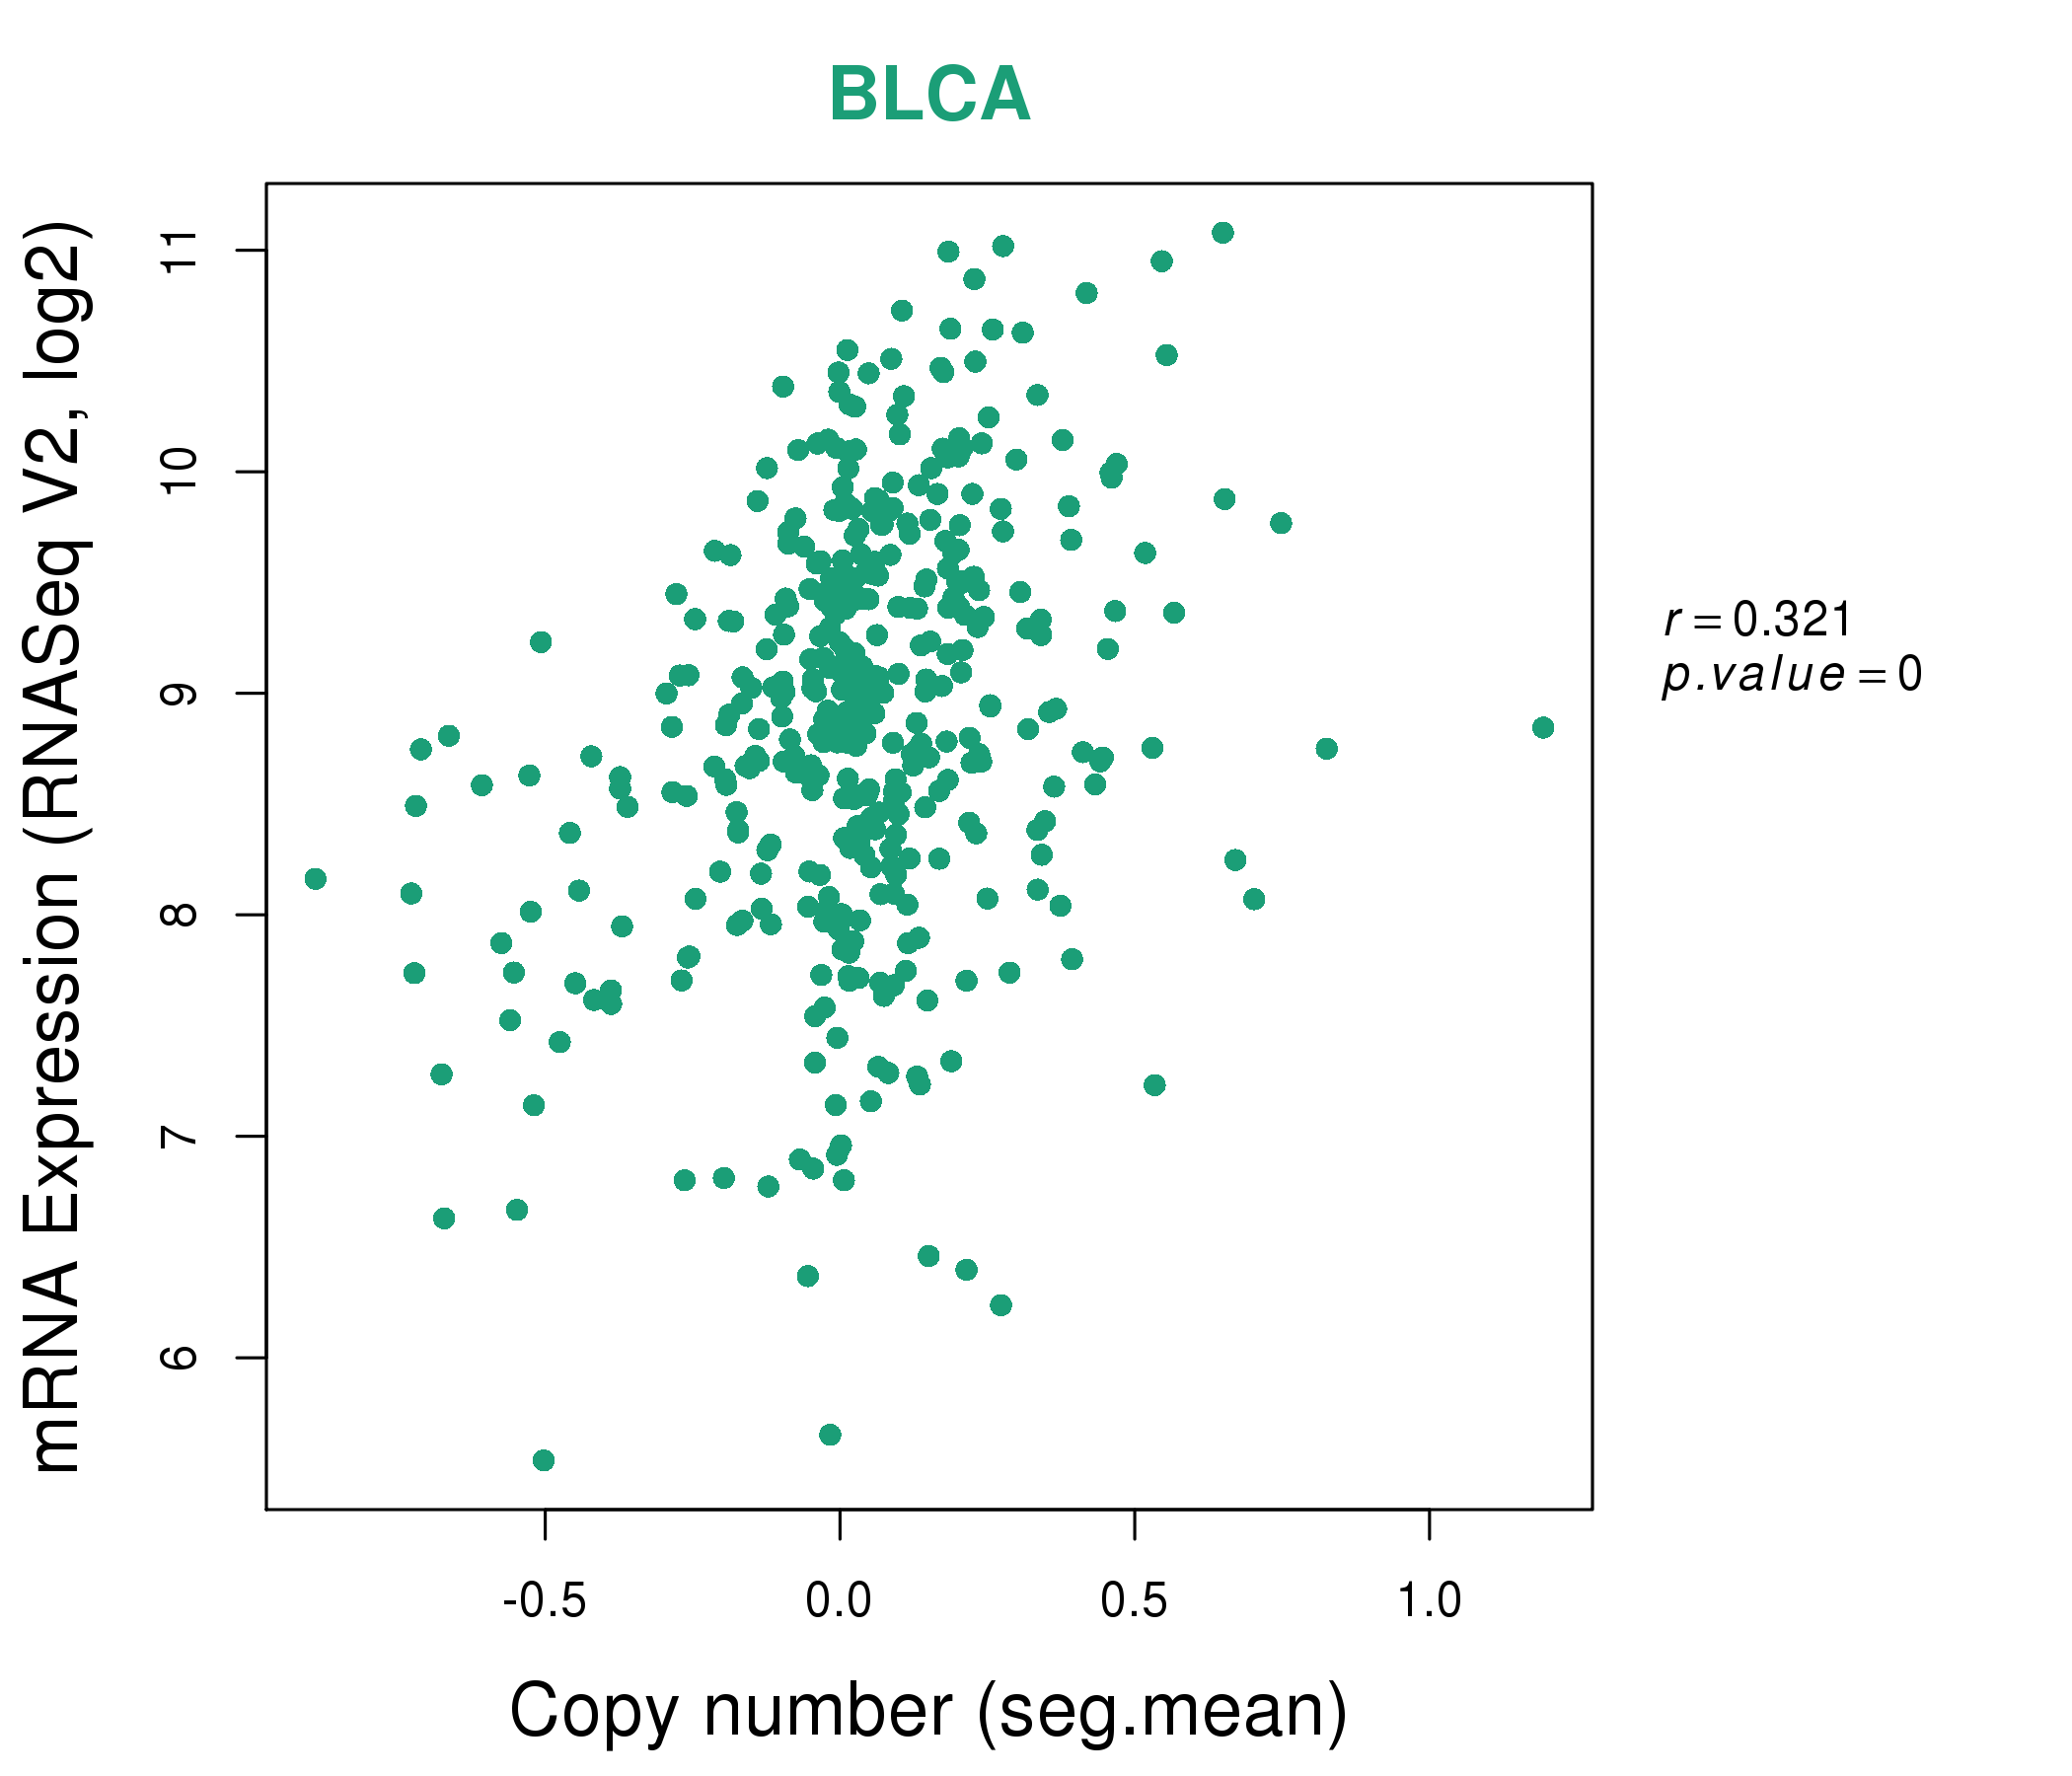
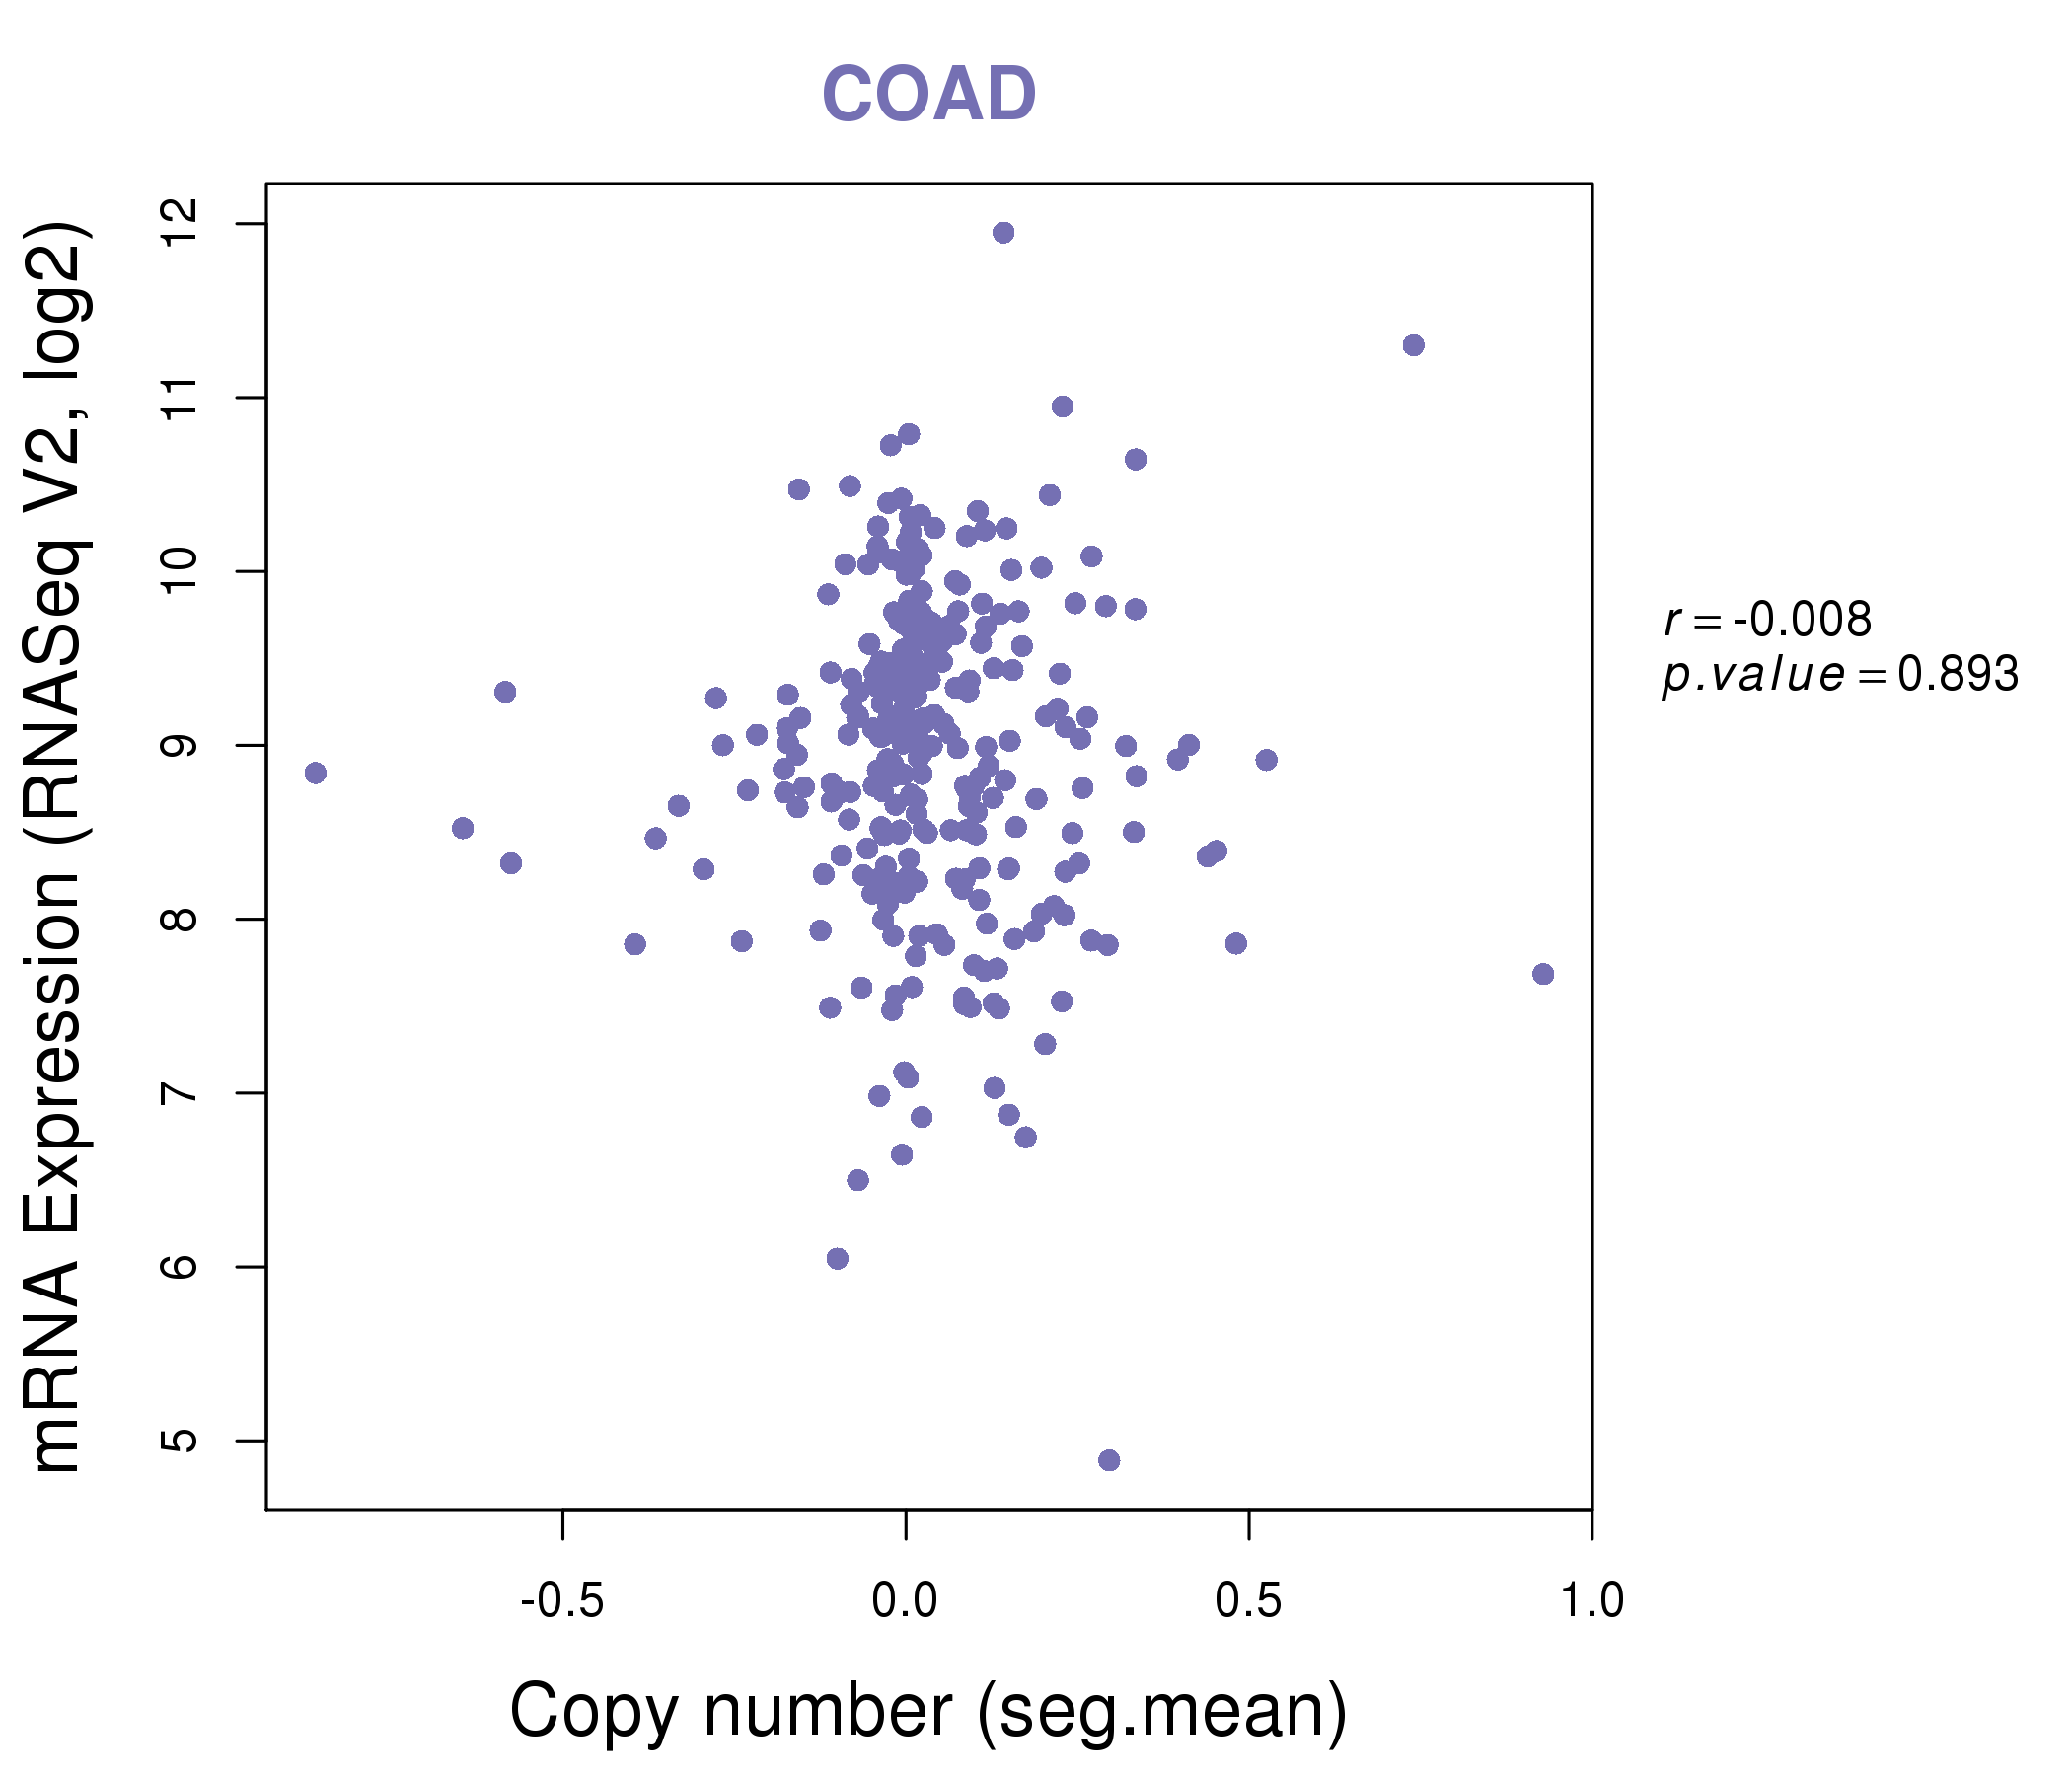
| * This plots show the correlation between CNV and gene expression. |
: Open all plots for all cancer types
 |
|
 |
|
| Top |
| Gene-Gene Network Information |
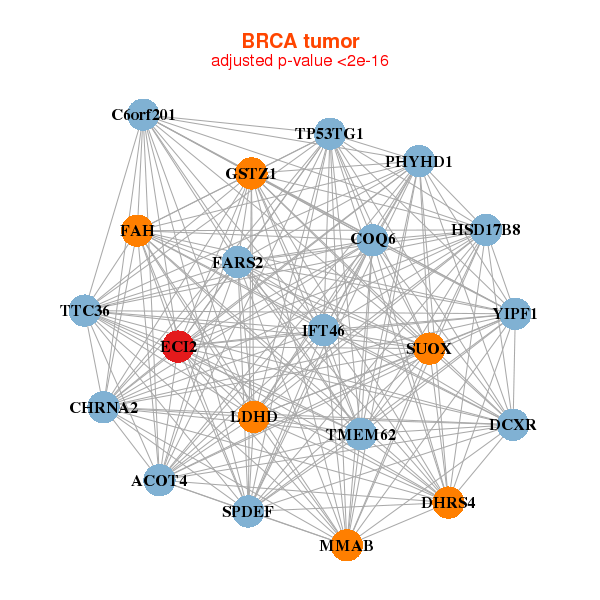
| * Co-Expression network figures were drawn using R package igraph. Only the top 20 genes with the highest correlations were shown. Red circle: input gene, orange circle: cell metabolism gene, sky circle: other gene |
: Open all plots for all cancer types
 |
| ||||
| ACOT4,C6orf201,CHRNA2,COQ6,DCXR,DHRS4,FAH, FARS2,GSTZ1,HSD17B8,IFT46,LDHD,MMAB,ECI2, PHYHD1,SPDEF,SUOX,TMEM62,TP53TG1,TTC36,YIPF1 | ACADM,AIFM1,MPC2,IDI2-AS1,GUCD1,CECR2,COQ6, CPT2,CRADD,CRAT,DNAJA4,ETFA,MTFR1L,GRPEL1, LDHD,NDUFAF1,NDUFV2,PCCB,ECI2,SAR1B,SIX1 | ||||
 |
| ||||
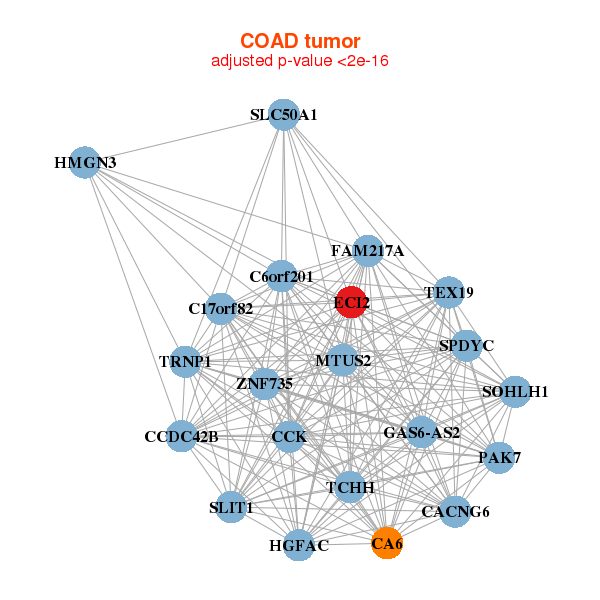
| C17orf82,FAM217A,C6orf201,CA6,CACNG6,CCDC42B,CCK, GAS6-AS2,HGFAC,HMGN3,MTUS2,PAK7,ECI2,SLC50A1, SLIT1,SOHLH1,SPDYC,TCHH,TEX19,TRNP1,ZNF735 | AKR1C3,ARHGAP18,AUH,BDH2,C2orf47,CAT,CMBL, FGGY,GPR160,HADH,HRSP12,HSDL2,IMP3,MRPS18B, ECI2,PHYH,PPP1CC,SAMM50,SUCLG1,TMEM19,TP53TG1 |
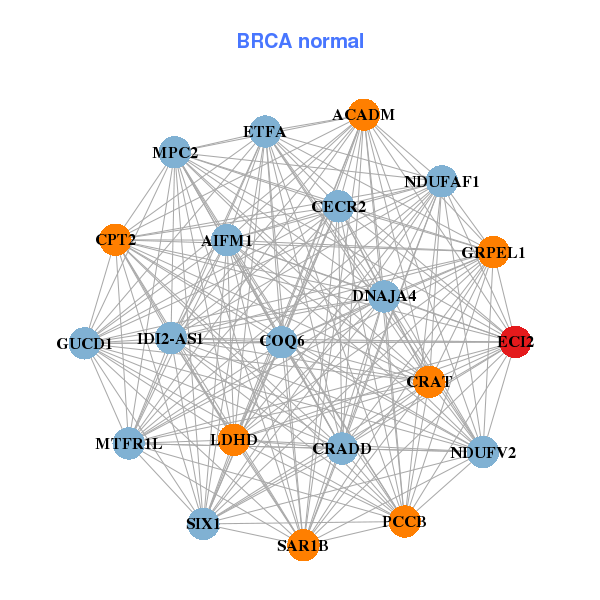
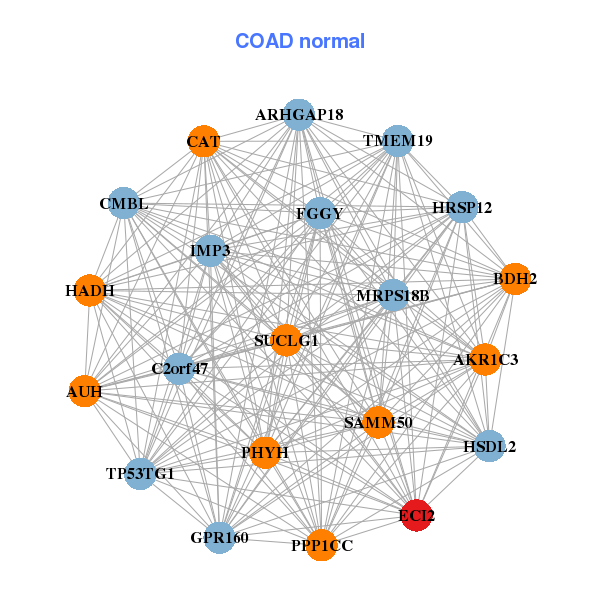
| * Co-Expression network figures were drawn using R package igraph. Only the top 20 genes with the highest correlations were shown. Red circle: input gene, orange circle: cell metabolism gene, sky circle: other gene |
: Open all plots for all cancer types
| Top |
: Open all interacting genes' information including KEGG pathway for all interacting genes from DAVID
| Top |
| Pharmacological Information for ECI2 |
| DB Category | DB Name | DB's ID and Url link |
| * Gene Centered Interaction Network. |
 |
| * Drug Centered Interaction Network. |
| DrugBank ID | Target Name | Drug Groups | Generic Name | Drug Centered Network | Drug Structure |
| DB08231 | enoyl-CoA delta isomerase 2 | experimental | MYRISTIC ACID |  | 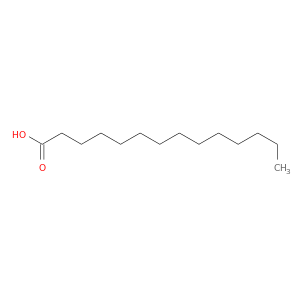 |
| Top |
| Cross referenced IDs for ECI2 |
| * We obtained these cross-references from Uniprot database. It covers 150 different DBs, 18 categories. http://www.uniprot.org/help/cross_references_section |
: Open all cross reference information
|
Copyright © 2016-Present - The Univsersity of Texas Health Science Center at Houston @ |