|
||||||||||||||||||||||||||||||||||||||||||||||||||||||||||||||||||||||||||||||||||||||||||||||||||||||||||||||||||||||||||||||||||||||||||||||||||||||||||||||||||||||||||||||||||||||||||||||||||||||||||||||||||||||||||||||||||||||||||||||||||||||||||||||||||||||||||||||||||||||||||||||||||||||||||||||||||||||||||
| |
| Phenotypic Information (metabolism pathway, cancer, disease, phenome) |
| |
| |
| Gene-Gene Network Information: Co-Expression Network, Interacting Genes & KEGG |
| |
|


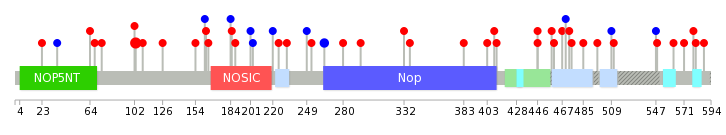
| Gene Summary for NOP56 |
| Top |
| Phenotypic Information for NOP56(metabolism pathway, cancer, disease, phenome) |
| Cancer | CGAP: NOP56 |
| Familial Cancer Database: NOP56 | |
| * This gene is included in those cancer gene databases. |
|
|
|
|
|
| . | ||||||||||||||||||||||||||||||||||||||||||||||||||||||||||||||||||||||||||||||||||||||||||||||||||||||||||||||||||||||||||||||||||||||||||||||||||||||||||||||||||||||||||||||||||||||||||||||||||||||||||||||||||||||||||||||||||||||||||||||||||||||||||||||||||||||||||||||||||||||||||||||||||||||||||||||||||||
Oncogene 1 | Significant driver gene in | |||||||||||||||||||||||||||||||||||||||||||||||||||||||||||||||||||||||||||||||||||||||||||||||||||||||||||||||||||||||||||||||||||||||||||||||||||||||||||||||||||||||||||||||||||||||||||||||||||||||||||||||||||||||||||||||||||||||||||||||||||||||||||||||||||||||||||||||||||||||||||||||||||||||||||||||||||||||||
| cf) number; DB name 1 Oncogene; http://nar.oxfordjournals.org/content/35/suppl_1/D721.long, 2 Tumor Suppressor gene; https://bioinfo.uth.edu/TSGene/, 3 Cancer Gene Census; http://www.nature.com/nrc/journal/v4/n3/abs/nrc1299.html, 4 CancerGenes; http://nar.oxfordjournals.org/content/35/suppl_1/D721.long, 5 Network of Cancer Gene; http://ncg.kcl.ac.uk/index.php, 1Therapeutic Vulnerabilities in Cancer; http://cbio.mskcc.org/cancergenomics/statius/ |
| REACTOME_METABOLISM_OF_PROTEINS | |
| OMIM | |
| Orphanet | |
| Disease | KEGG Disease: NOP56 |
| MedGen: NOP56 (Human Medical Genetics with Condition) | |
| ClinVar: NOP56 | |
| Phenotype | MGI: NOP56 (International Mouse Phenotyping Consortium) |
| PhenomicDB: NOP56 | |
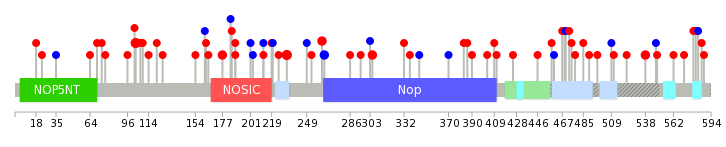
| Mutations for NOP56 |
| * Under tables are showing count per each tissue to give us broad intuition about tissue specific mutation patterns.You can go to the detailed page for each mutation database's web site. |
| There's no structural variation information in COSMIC data for this gene. |
| * From mRNA Sanger sequences, Chitars2.0 arranged chimeric transcripts. This table shows NOP56 related fusion information. |
| ID | Head Gene | Tail Gene | Accession | Gene_a | qStart_a | qEnd_a | Chromosome_a | tStart_a | tEnd_a | Gene_a | qStart_a | qEnd_a | Chromosome_a | tStart_a | tEnd_a |
| DA801918 | NOP56 | 1 | 53 | 20 | 2637288 | 2637340 | SLC44A2 | 54 | 450 | 19 | 10713131 | 10741815 | |
| CN266780 | NASP | 9 | 445 | 1 | 46049744 | 46072216 | NOP56 | 442 | 704 | 20 | 2637494 | 2638650 | |
| W23530 | NOP56 | 1 | 61 | 20 | 2637724 | 2637784 | PPAP2B | 47 | 359 | 1 | 56961999 | 56962311 | |
| DB044831 | UBL4B | 1 | 417 | 1 | 110655085 | 110655501 | NOP56 | 406 | 571 | 20 | 2635553 | 2636096 | |
| AV759376 | NOP56 | 1 | 65 | 20 | 2637588 | 2637652 | RBPMS | 60 | 398 | 8 | 30385662 | 30386067 | |
| Top |
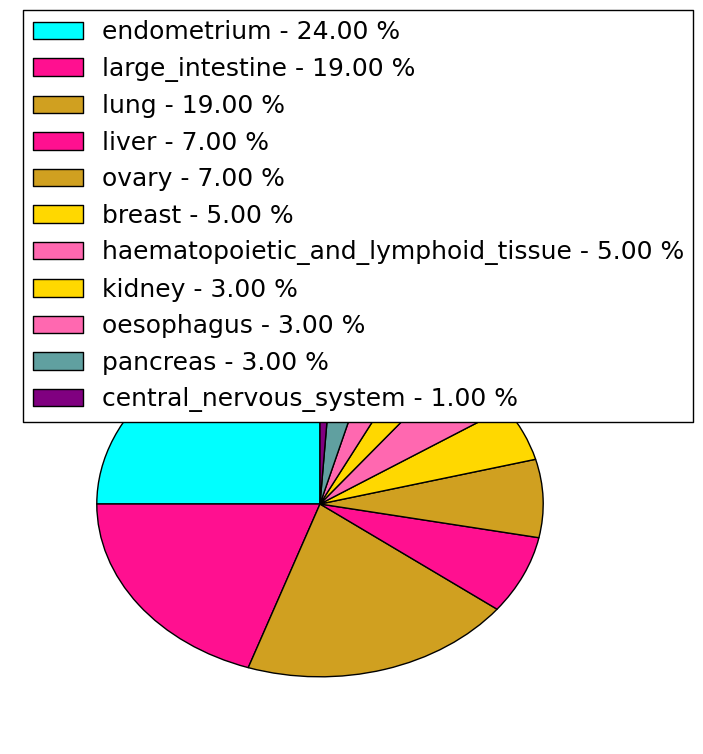
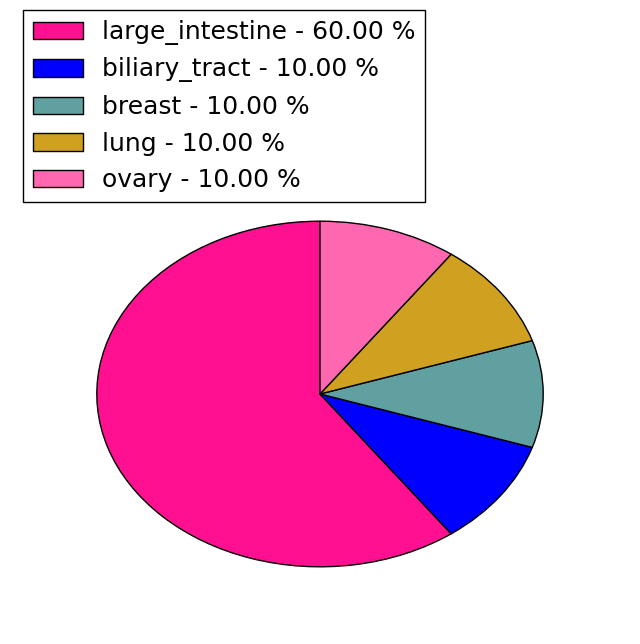
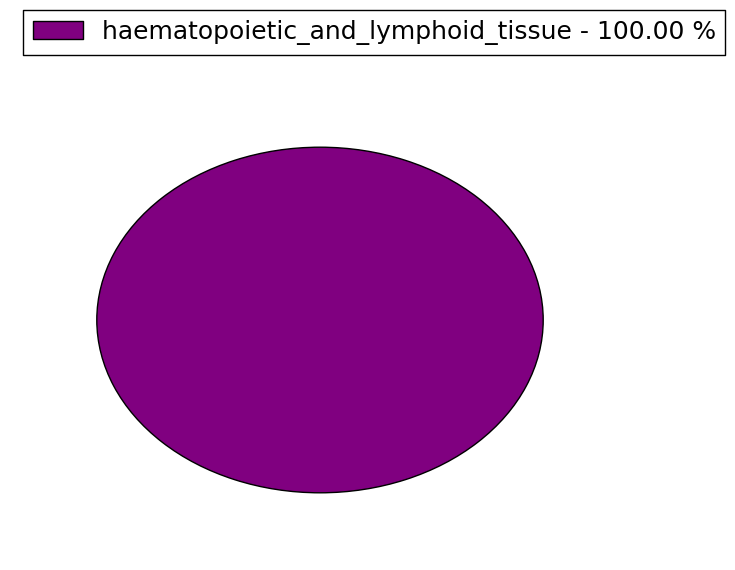
| Mutation type/ Tissue ID | brca | cns | cerv | endome | haematopo | kidn | Lintest | liver | lung | ns | ovary | pancre | prost | skin | stoma | thyro | urina | |||
| Total # sample | 1 | 1 | 1 | |||||||||||||||||
| GAIN (# sample) | 1 | 1 | ||||||||||||||||||
| LOSS (# sample) | 1 |
| cf) Tissue ID; Tissue type (1; Breast, 2; Central_nervous_system, 3; Cervix, 4; Endometrium, 5; Haematopoietic_and_lymphoid_tissue, 6; Kidney, 7; Large_intestine, 8; Liver, 9; Lung, 10; NS, 11; Ovary, 12; Pancreas, 13; Prostate, 14; Skin, 15; Stomach, 16; Thyroid, 17; Urinary_tract) |
| Top |
|
 |
| Top |
| Stat. for Non-Synonymous SNVs (# total SNVs=57) | (# total SNVs=10) |
 |  |
(# total SNVs=1) | (# total SNVs=0) |
 |
| Top |
| * When you move the cursor on each content, you can see more deailed mutation information on the Tooltip. Those are primary_site,primary_histology,mutation(aa),pubmedID. |
| GRCh37 position | Mutation(aa) | Unique sampleID count |
| chr20:2636095-2636095 | p.E232K | 3 |
| chr20:2635158-2635158 | p.A103T | 3 |
| chr20:2638767-2638767 | p.T538A | 2 |
| chr20:2635554-2635554 | p.Q177L | 2 |
| chr20:2637470-2637470 | p.R404* | 2 |
| chr20:2636584-2636584 | p.G305D | 2 |
| chr20:2636268-2636268 | p.I262R | 2 |
| chr20:2636275-2636275 | p.I264I | 2 |
| chr20:2637452-2637452 | p.R398* | 2 |
| chr20:2636057-2636057 | p.N219T | 1 |
| Top |
|
 |
| Point Mutation/ Tissue ID | 1 | 2 | 3 | 4 | 5 | 6 | 7 | 8 | 9 | 10 | 11 | 12 | 13 | 14 | 15 | 16 | 17 | 18 | 19 | 20 |
| # sample | 2 | 2 | 11 | 1 | 1 | 2 | 4 | 3 | 3 | 1 | 6 | 3 | 10 | |||||||
| # mutation | 3 | 2 | 13 | 1 | 1 | 2 | 4 | 3 | 3 | 1 | 6 | 3 | 11 | |||||||
| nonsynonymous SNV | 2 | 1 | 8 | 1 | 1 | 2 | 4 | 3 | 2 | 1 | 2 | 3 | 11 | |||||||
| synonymous SNV | 1 | 1 | 5 | 1 | 4 |
| cf) Tissue ID; Tissue type (1; BLCA[Bladder Urothelial Carcinoma], 2; BRCA[Breast invasive carcinoma], 3; CESC[Cervical squamous cell carcinoma and endocervical adenocarcinoma], 4; COAD[Colon adenocarcinoma], 5; GBM[Glioblastoma multiforme], 6; Glioma Low Grade, 7; HNSC[Head and Neck squamous cell carcinoma], 8; KICH[Kidney Chromophobe], 9; KIRC[Kidney renal clear cell carcinoma], 10; KIRP[Kidney renal papillary cell carcinoma], 11; LAML[Acute Myeloid Leukemia], 12; LUAD[Lung adenocarcinoma], 13; LUSC[Lung squamous cell carcinoma], 14; OV[Ovarian serous cystadenocarcinoma ], 15; PAAD[Pancreatic adenocarcinoma], 16; PRAD[Prostate adenocarcinoma], 17; SKCM[Skin Cutaneous Melanoma], 18:STAD[Stomach adenocarcinoma], 19:THCA[Thyroid carcinoma], 20:UCEC[Uterine Corpus Endometrial Carcinoma]) |
| Top |
| * We represented just top 10 SNVs. When you move the cursor on each content, you can see more deailed mutation information on the Tooltip. Those are primary_site, primary_histology, mutation(aa), pubmedID. |
| Genomic Position | Mutation(aa) | Unique sampleID count |
| chr20:2635158 | p.A103T | 5 |
| chr20:2636275 | p.I264I | 2 |
| chr20:2637781 | p.V201V | 1 |
| chr20:2633552 | p.R446C | 1 |
| chr20:2635512 | p.S579R | 1 |
| chr20:2638687 | p.E23V | 1 |
| chr20:2636241 | p.I203I | 1 |
| chr20:2637782 | p.R446H | 1 |
| chr20:2633939 | p.S581F | 1 |
| chr20:2635517 | p.V36V | 1 |
| * Copy number data were extracted from TCGA using R package TCGA-Assembler. The URLs of all public data files on TCGA DCC data server were gathered on Jan-05-2015. Function ProcessCNAData in TCGA-Assembler package was used to obtain gene-level copy number value which is calculated as the average copy number of the genomic region of a gene. |
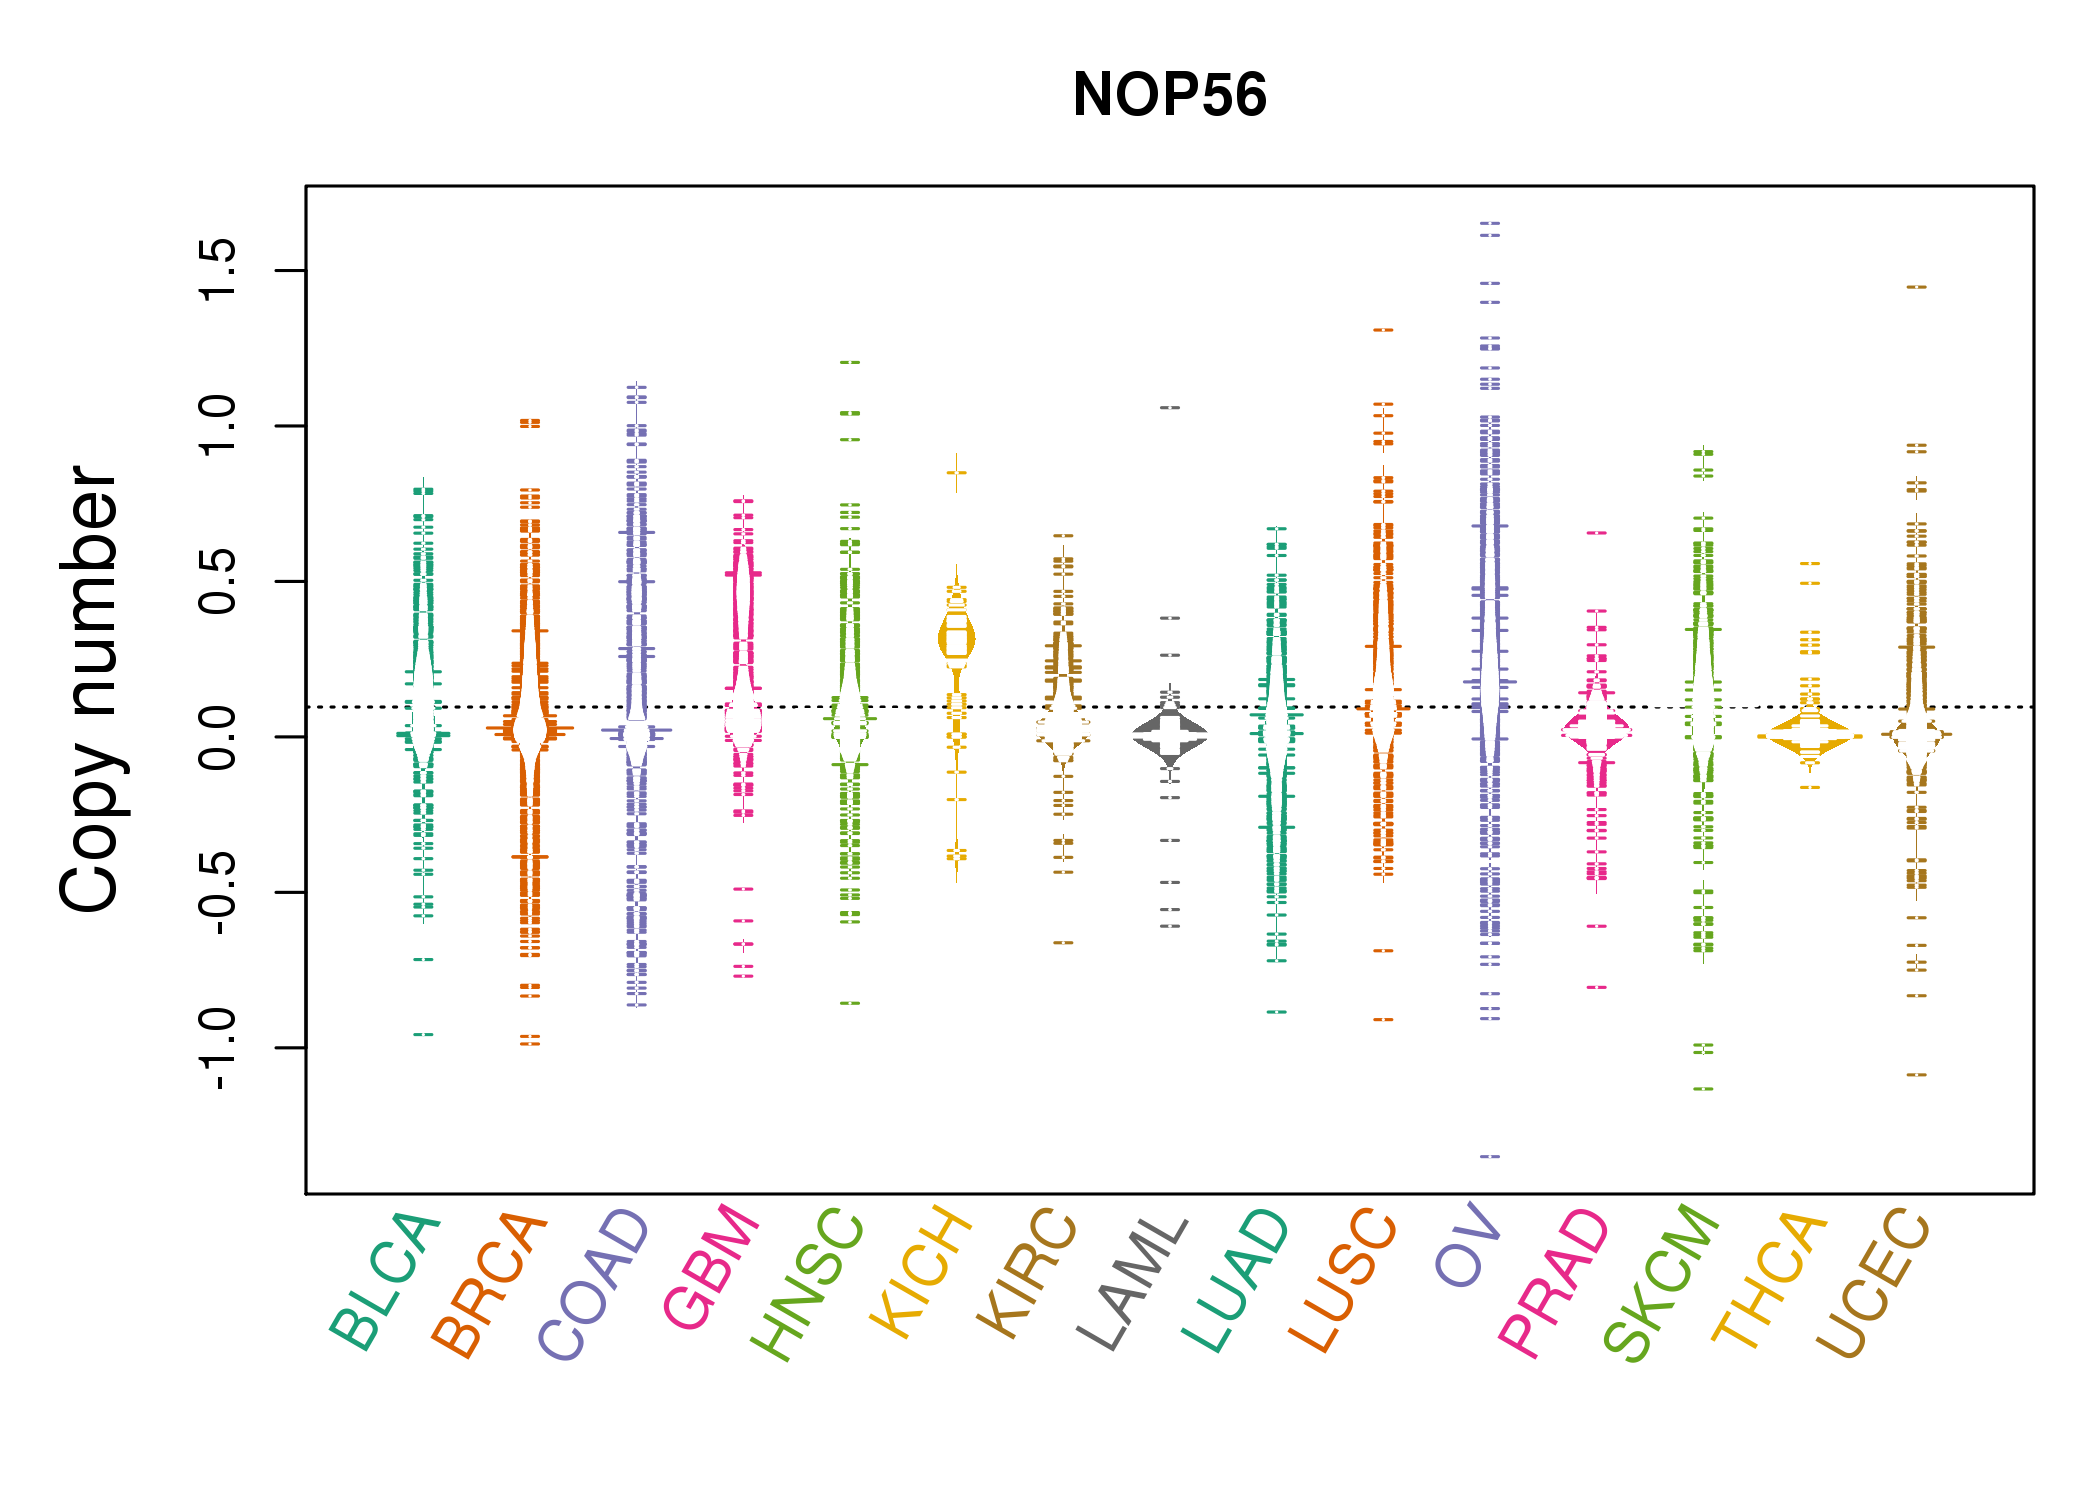 |
| cf) Tissue ID[Tissue type]: BLCA[Bladder Urothelial Carcinoma], BRCA[Breast invasive carcinoma], CESC[Cervical squamous cell carcinoma and endocervical adenocarcinoma], COAD[Colon adenocarcinoma], GBM[Glioblastoma multiforme], Glioma Low Grade, HNSC[Head and Neck squamous cell carcinoma], KICH[Kidney Chromophobe], KIRC[Kidney renal clear cell carcinoma], KIRP[Kidney renal papillary cell carcinoma], LAML[Acute Myeloid Leukemia], LUAD[Lung adenocarcinoma], LUSC[Lung squamous cell carcinoma], OV[Ovarian serous cystadenocarcinoma ], PAAD[Pancreatic adenocarcinoma], PRAD[Prostate adenocarcinoma], SKCM[Skin Cutaneous Melanoma], STAD[Stomach adenocarcinoma], THCA[Thyroid carcinoma], UCEC[Uterine Corpus Endometrial Carcinoma] |
| Top |
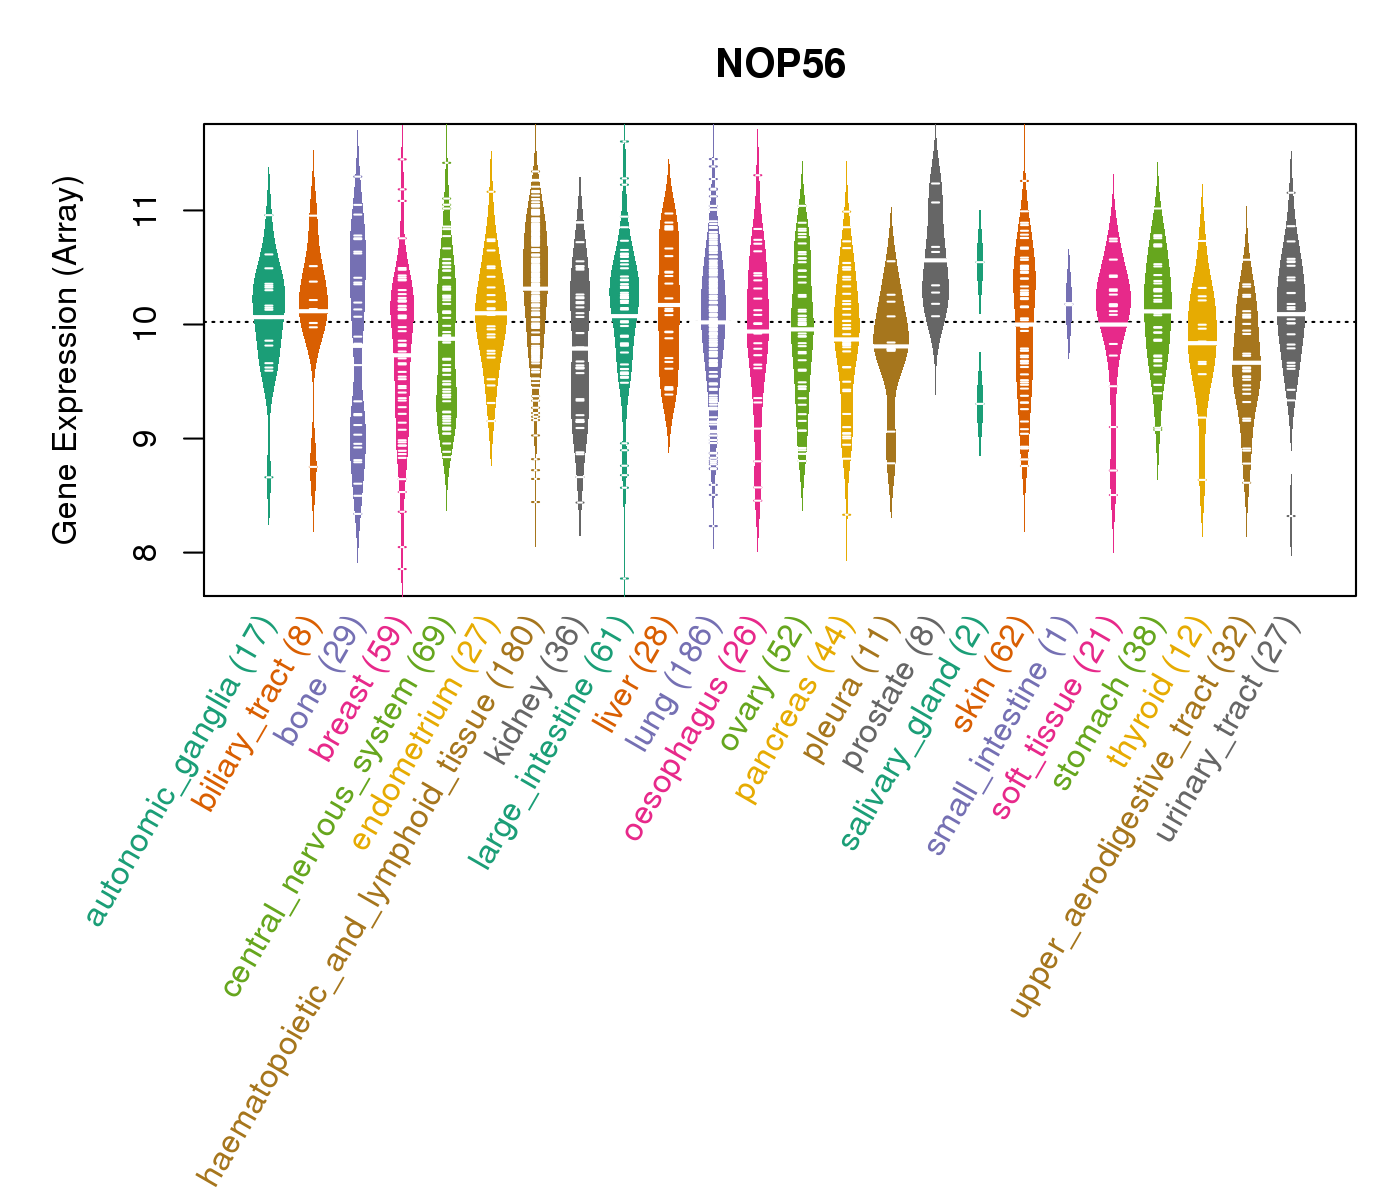
| Gene Expression for NOP56 |
| * CCLE gene expression data were extracted from CCLE_Expression_Entrez_2012-10-18.res: Gene-centric RMA-normalized mRNA expression data. |
 |
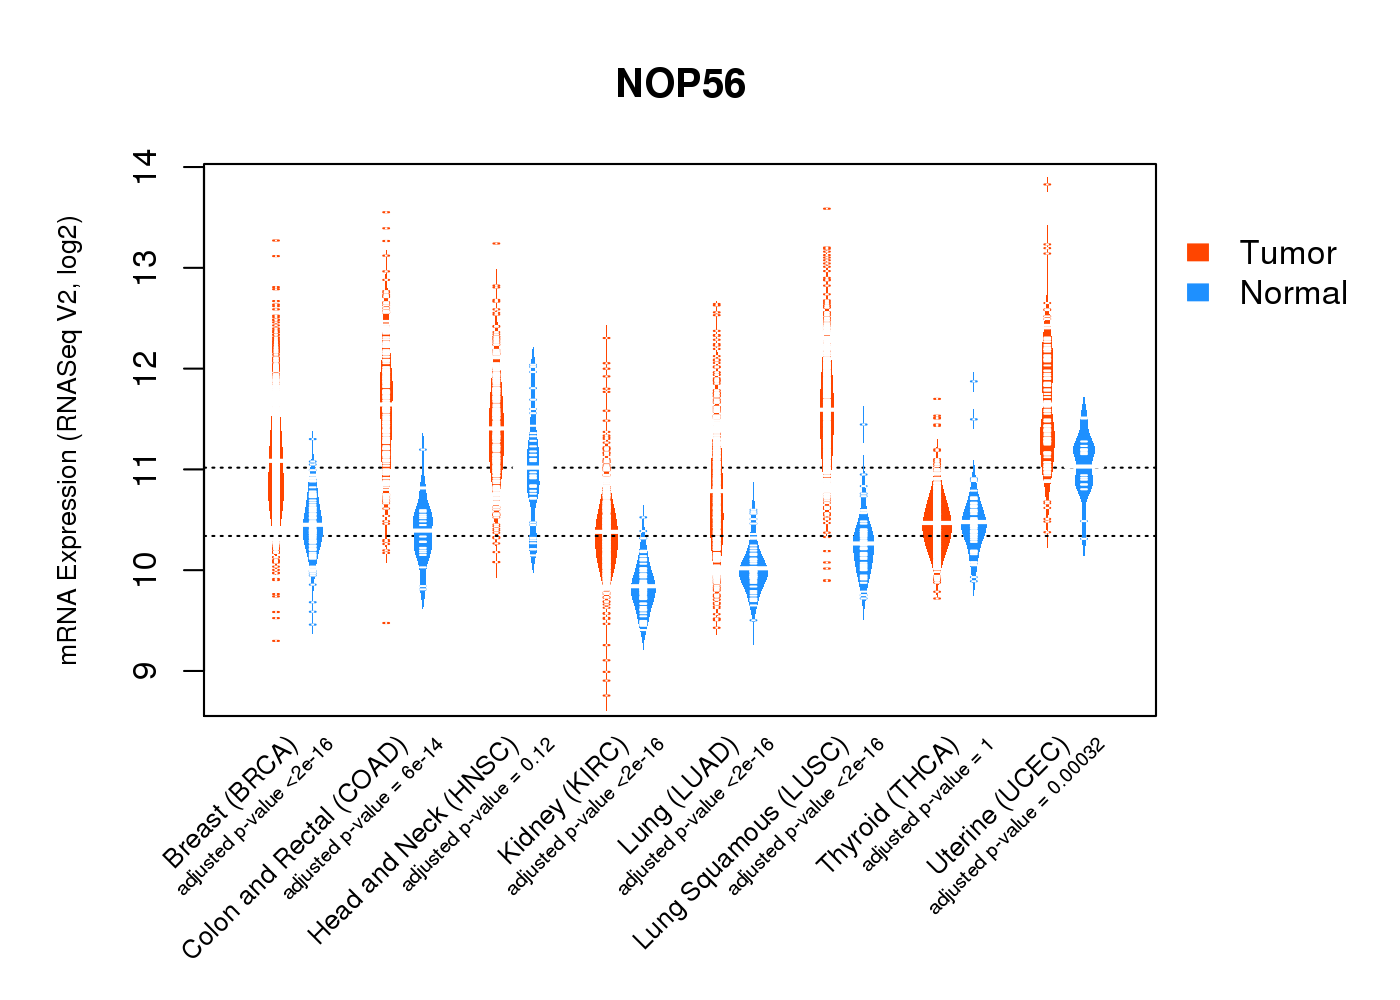
| * Normalized gene expression data of RNASeqV2 was extracted from TCGA using R package TCGA-Assembler. The URLs of all public data files on TCGA DCC data server were gathered at Jan-05-2015. Only eight cancer types have enough normal control samples for differential expression analysis. (t test, adjusted p<0.05 (using Benjamini-Hochberg FDR)) |
 |
| Top |
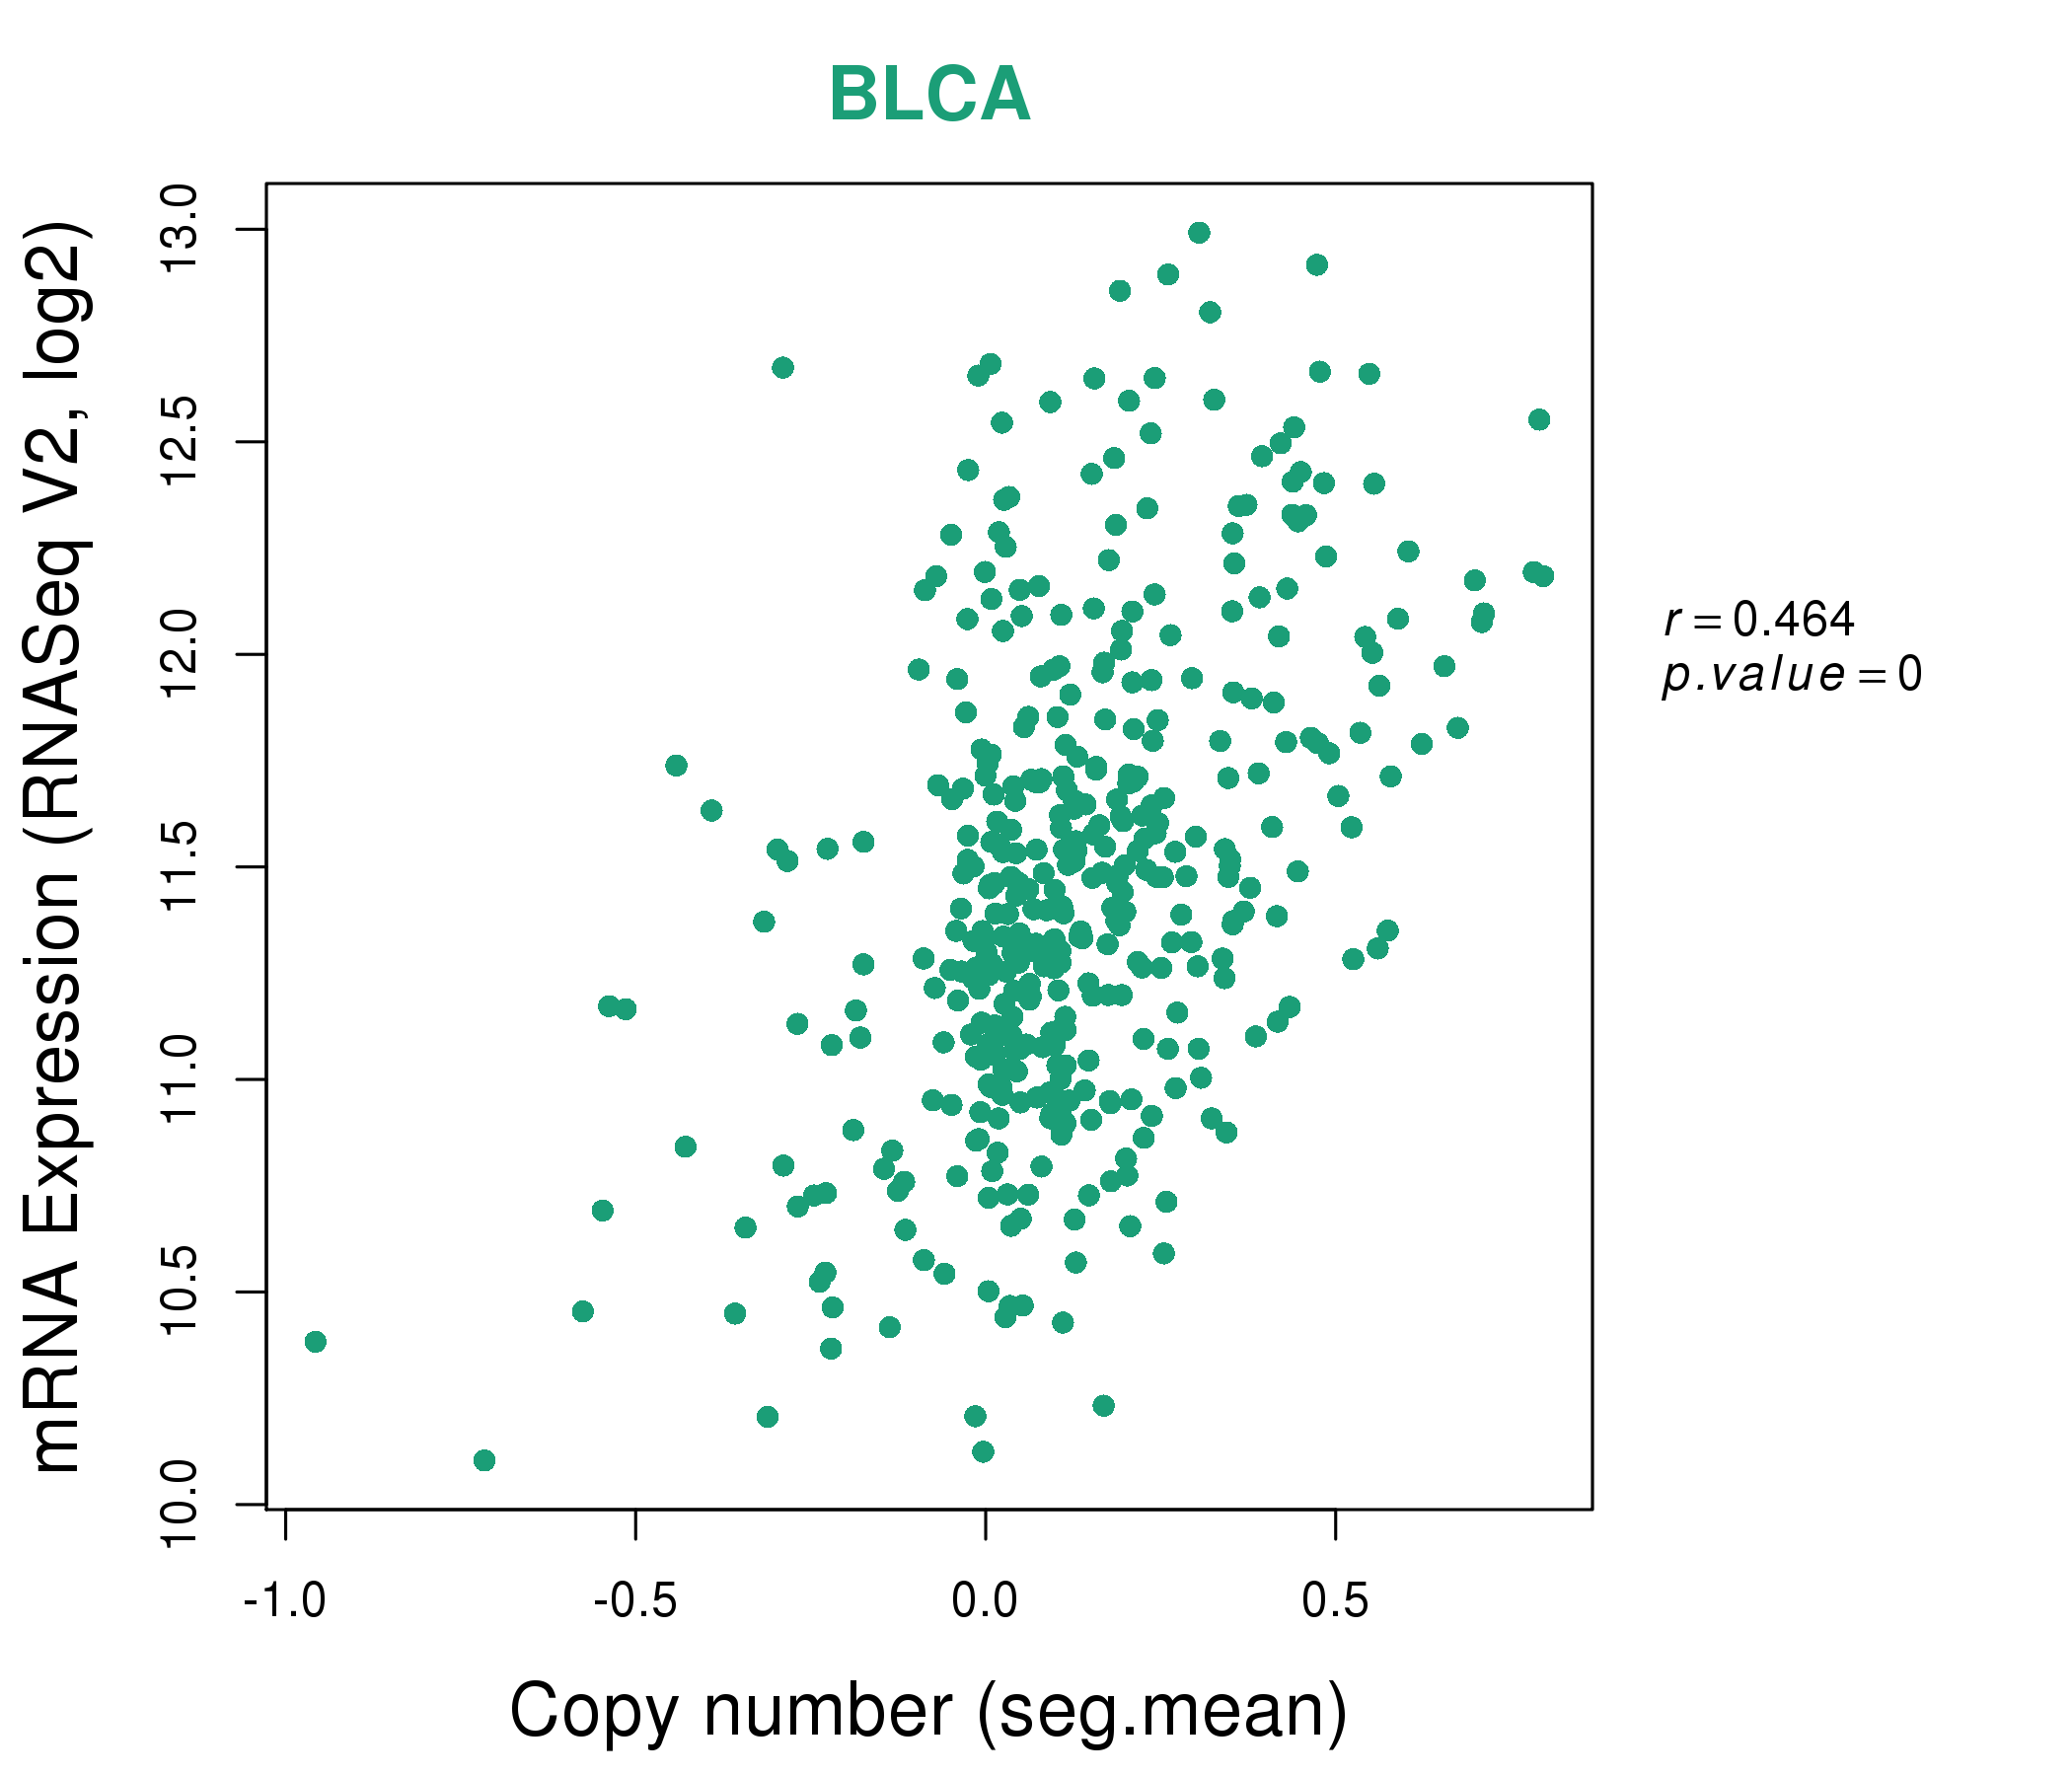
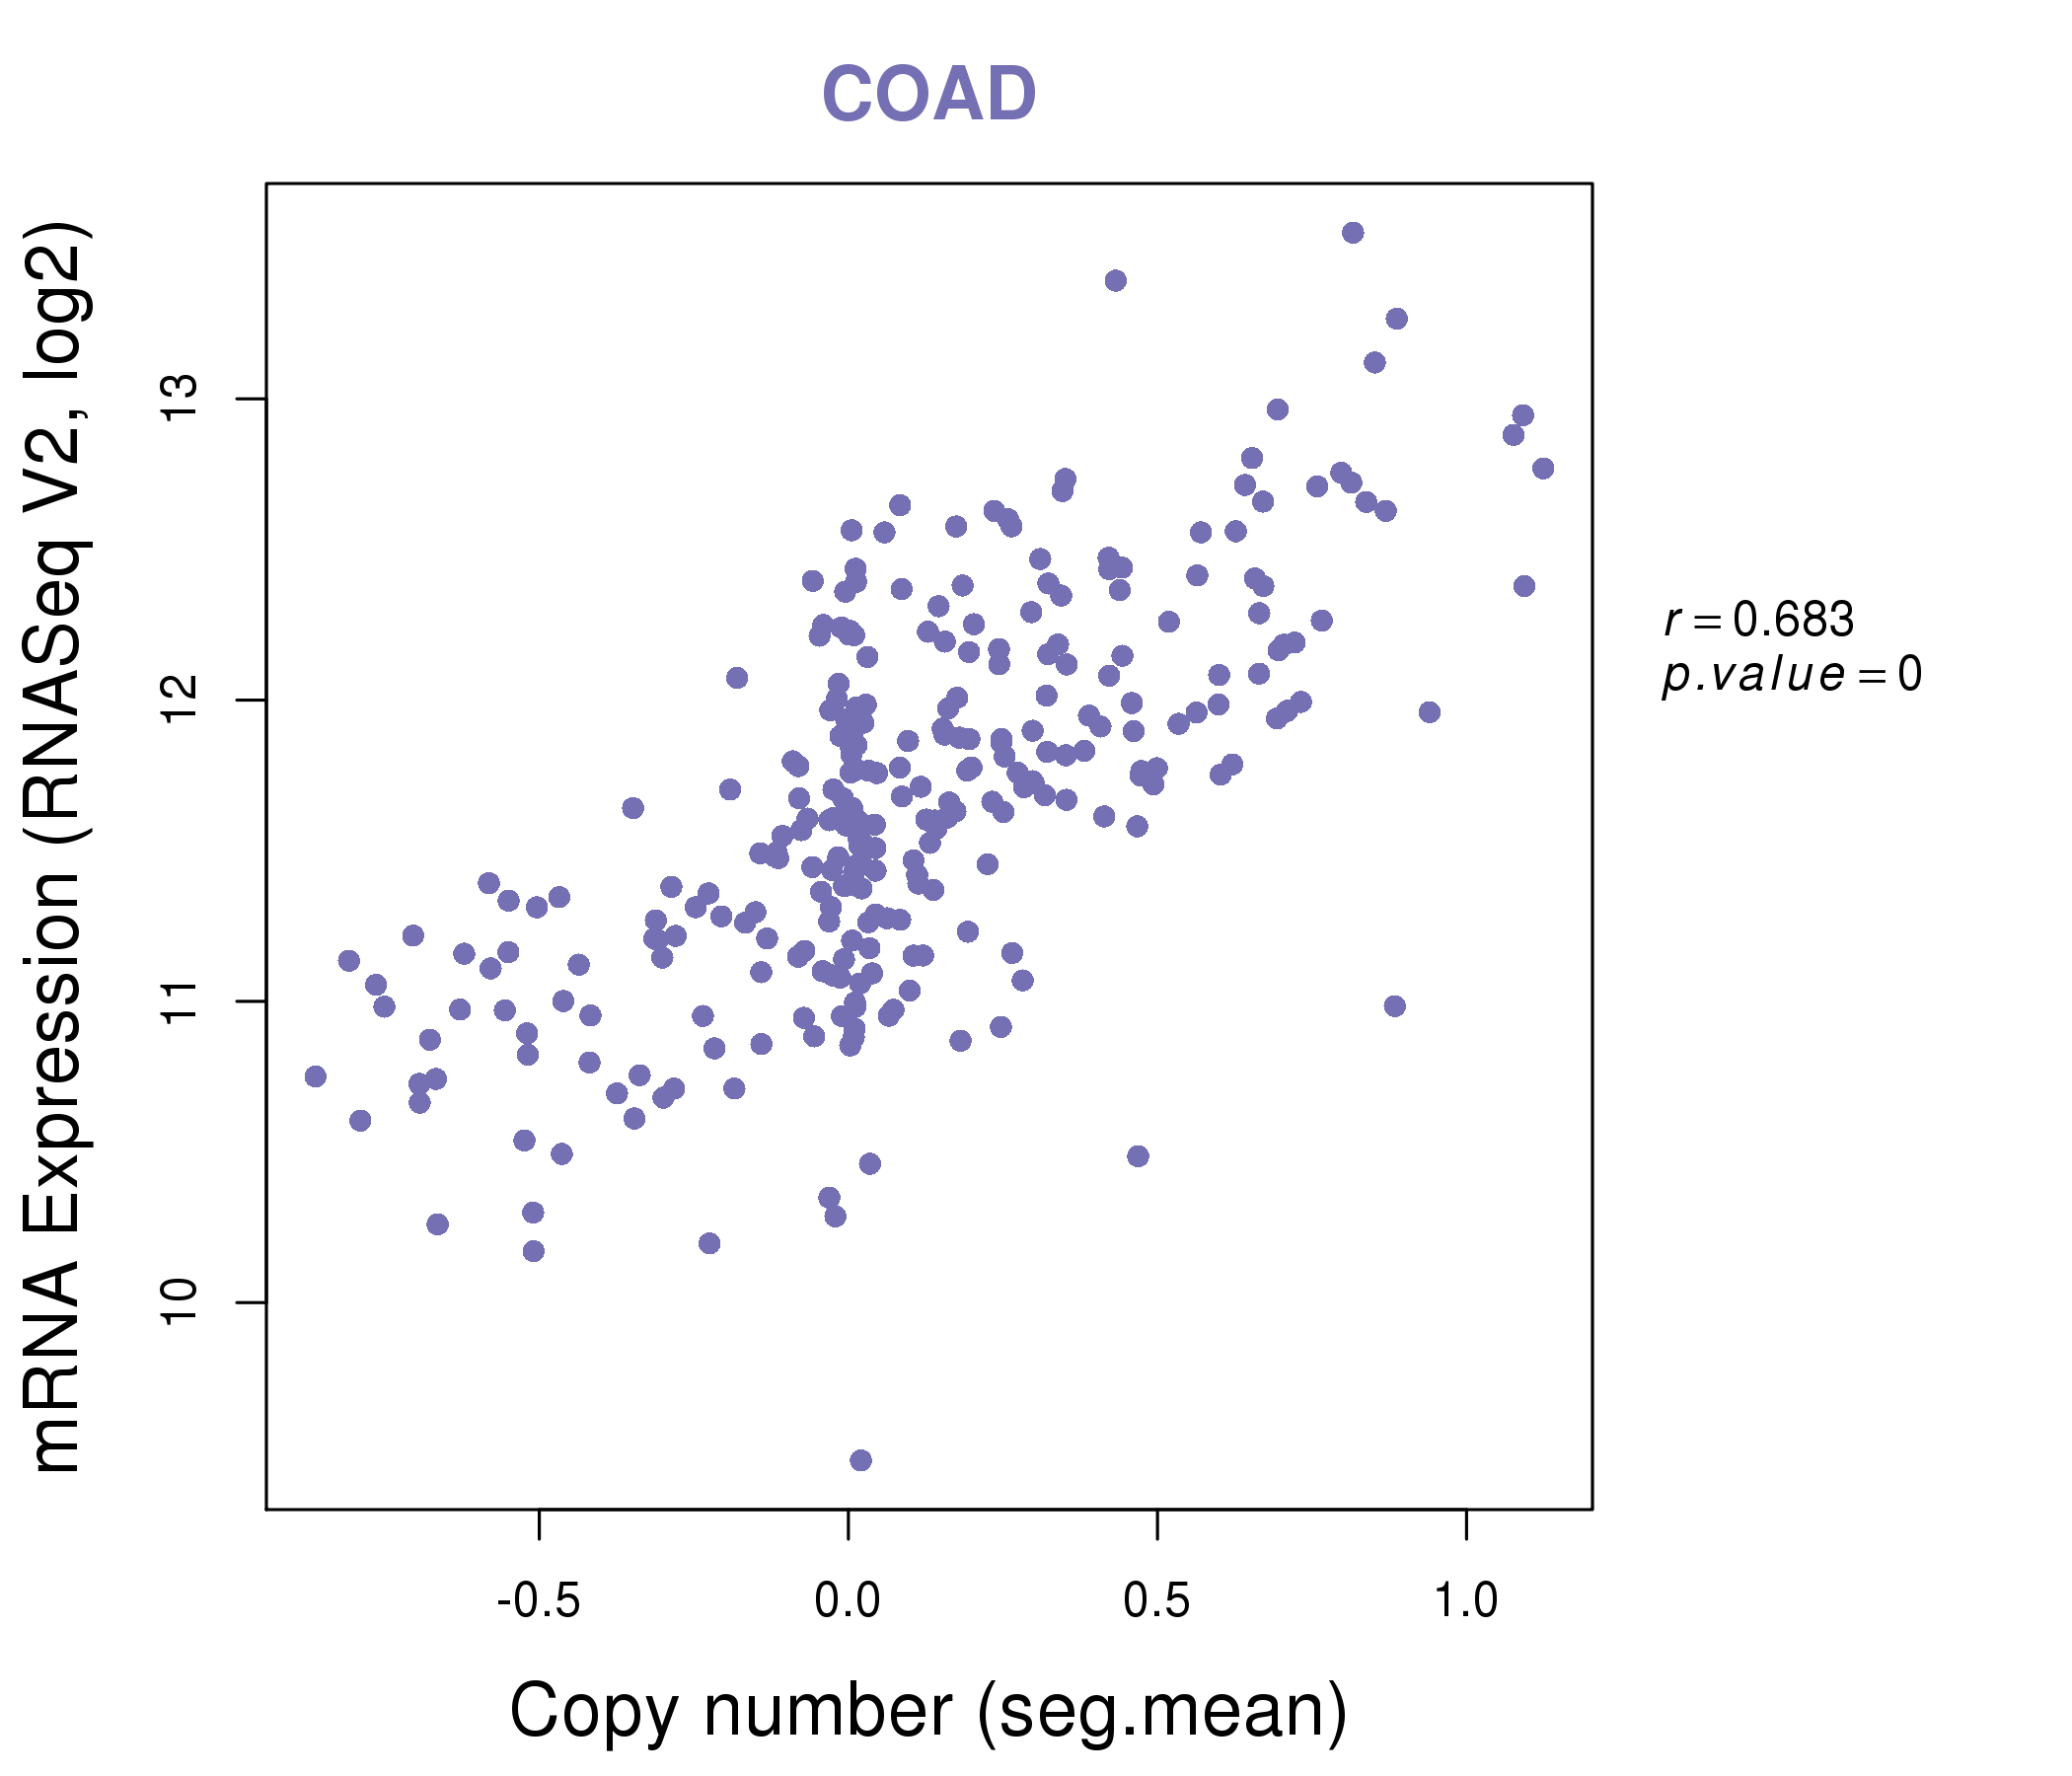
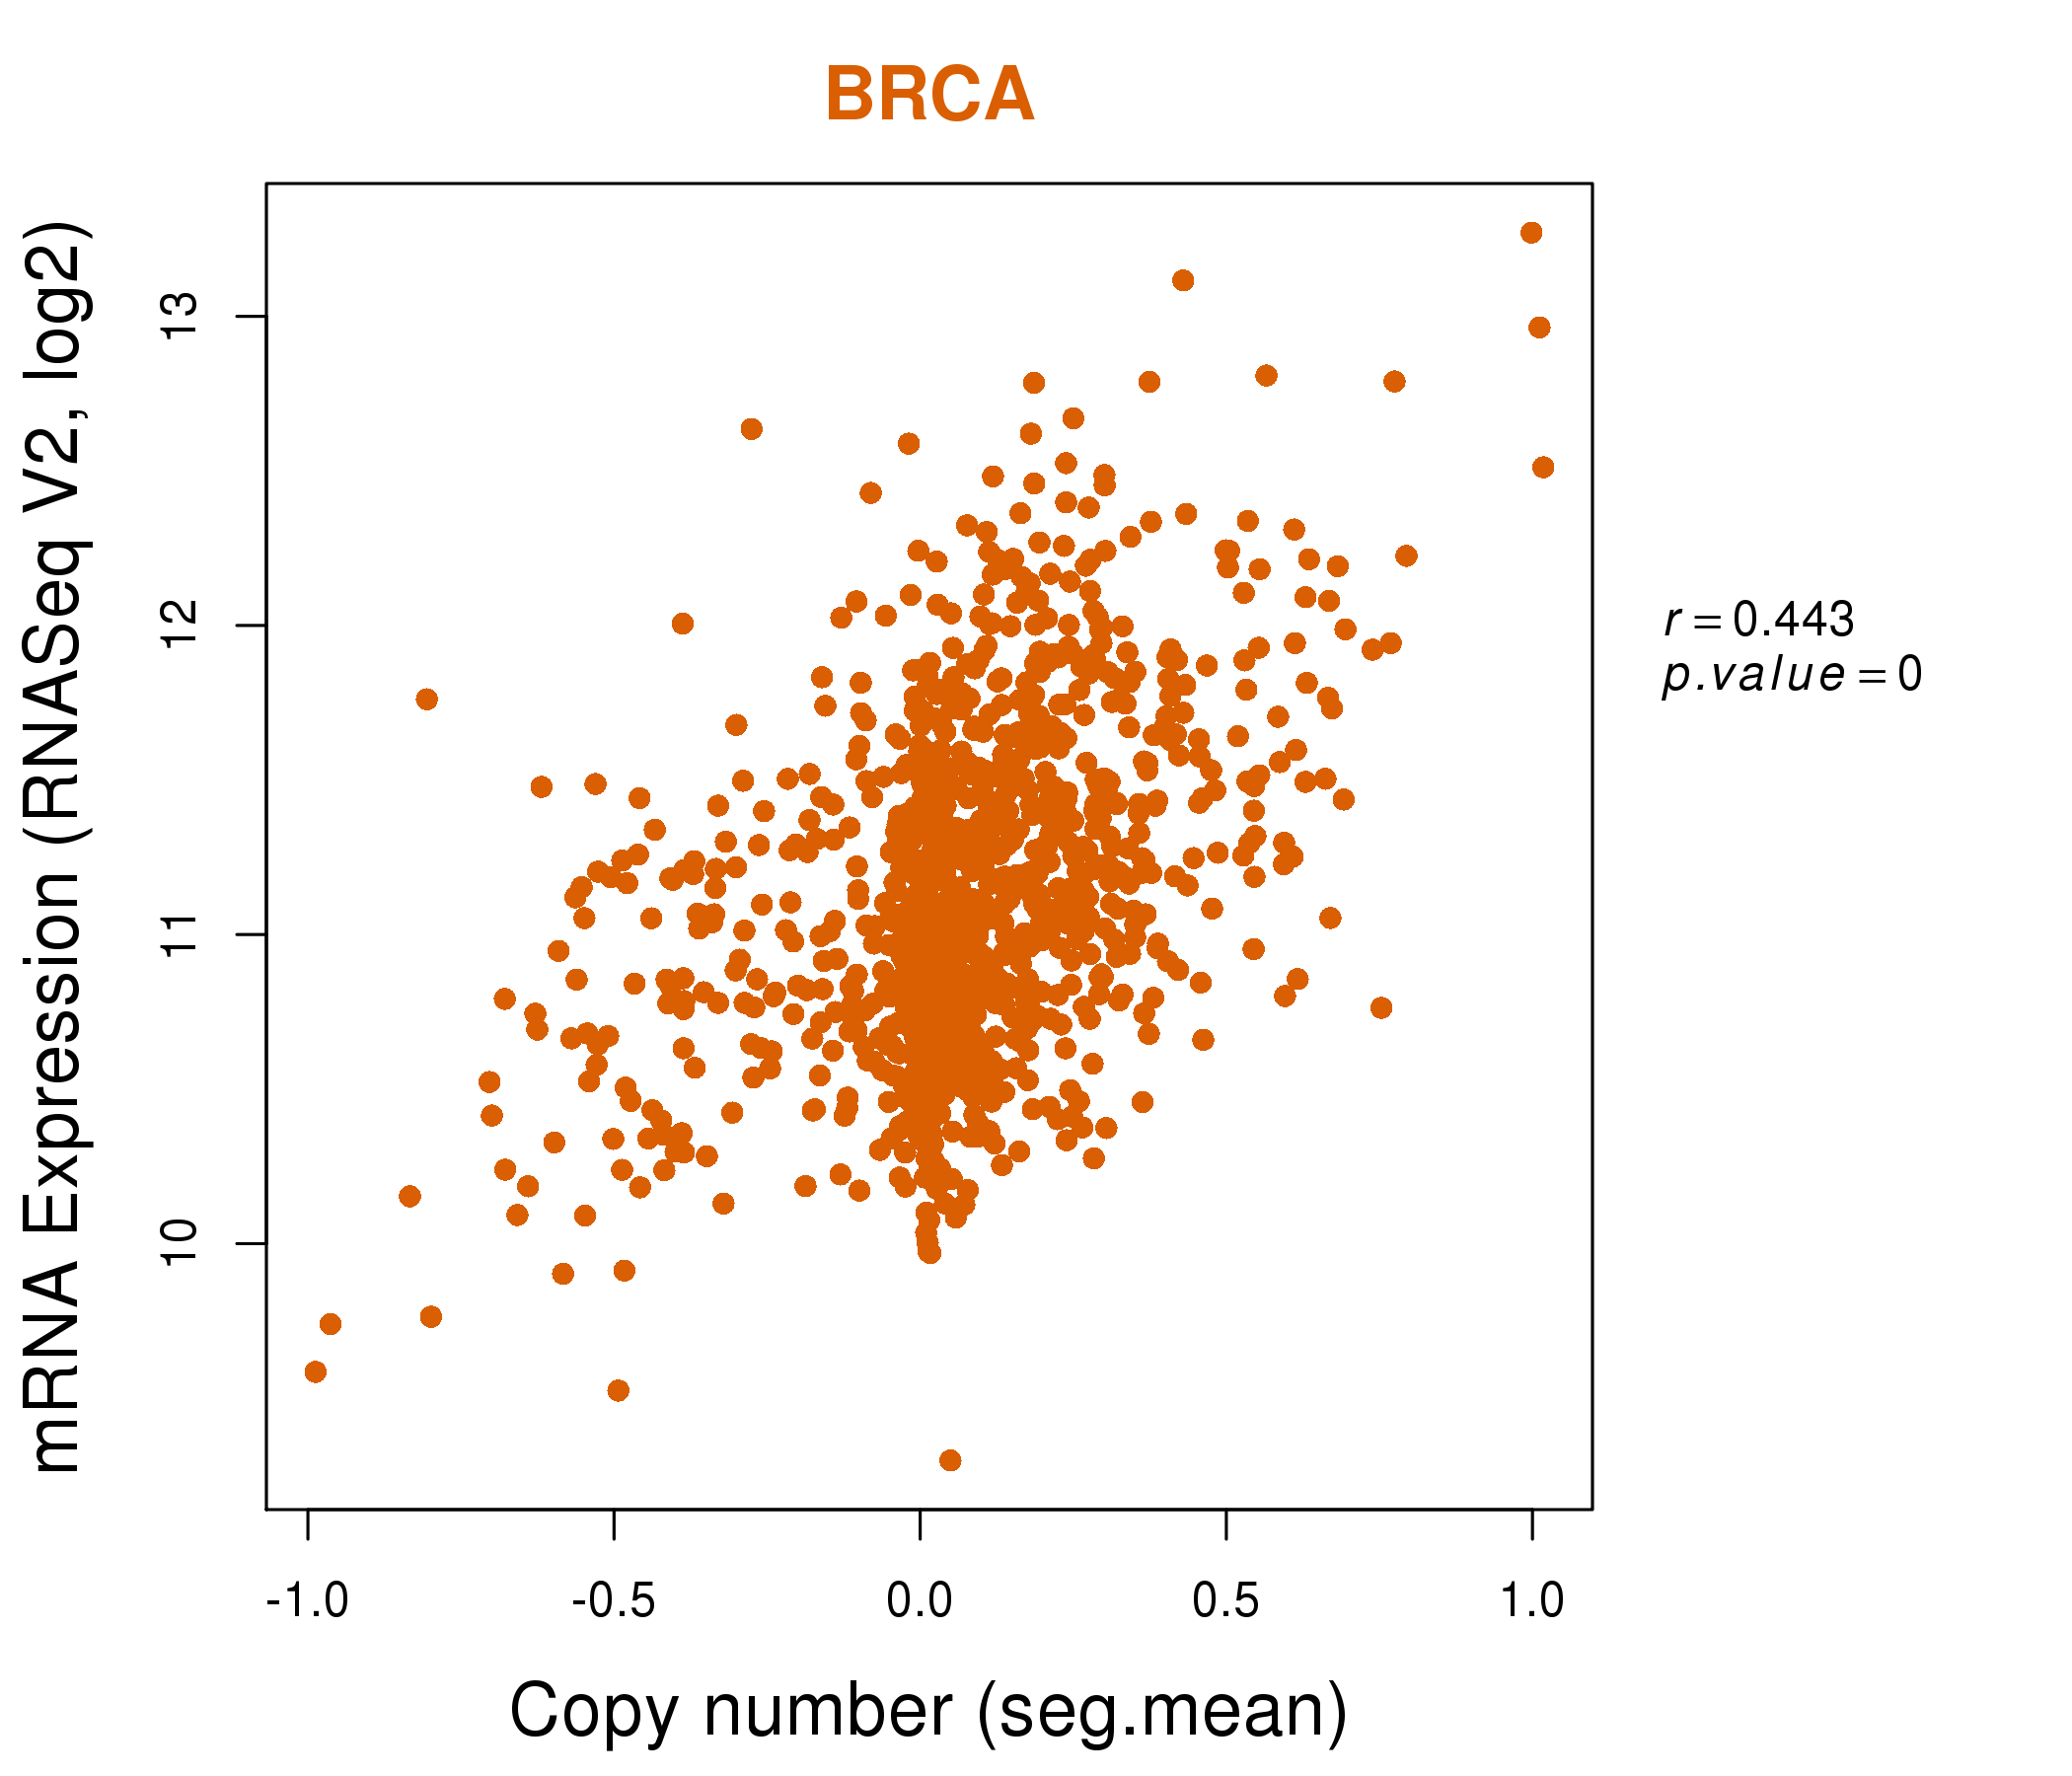
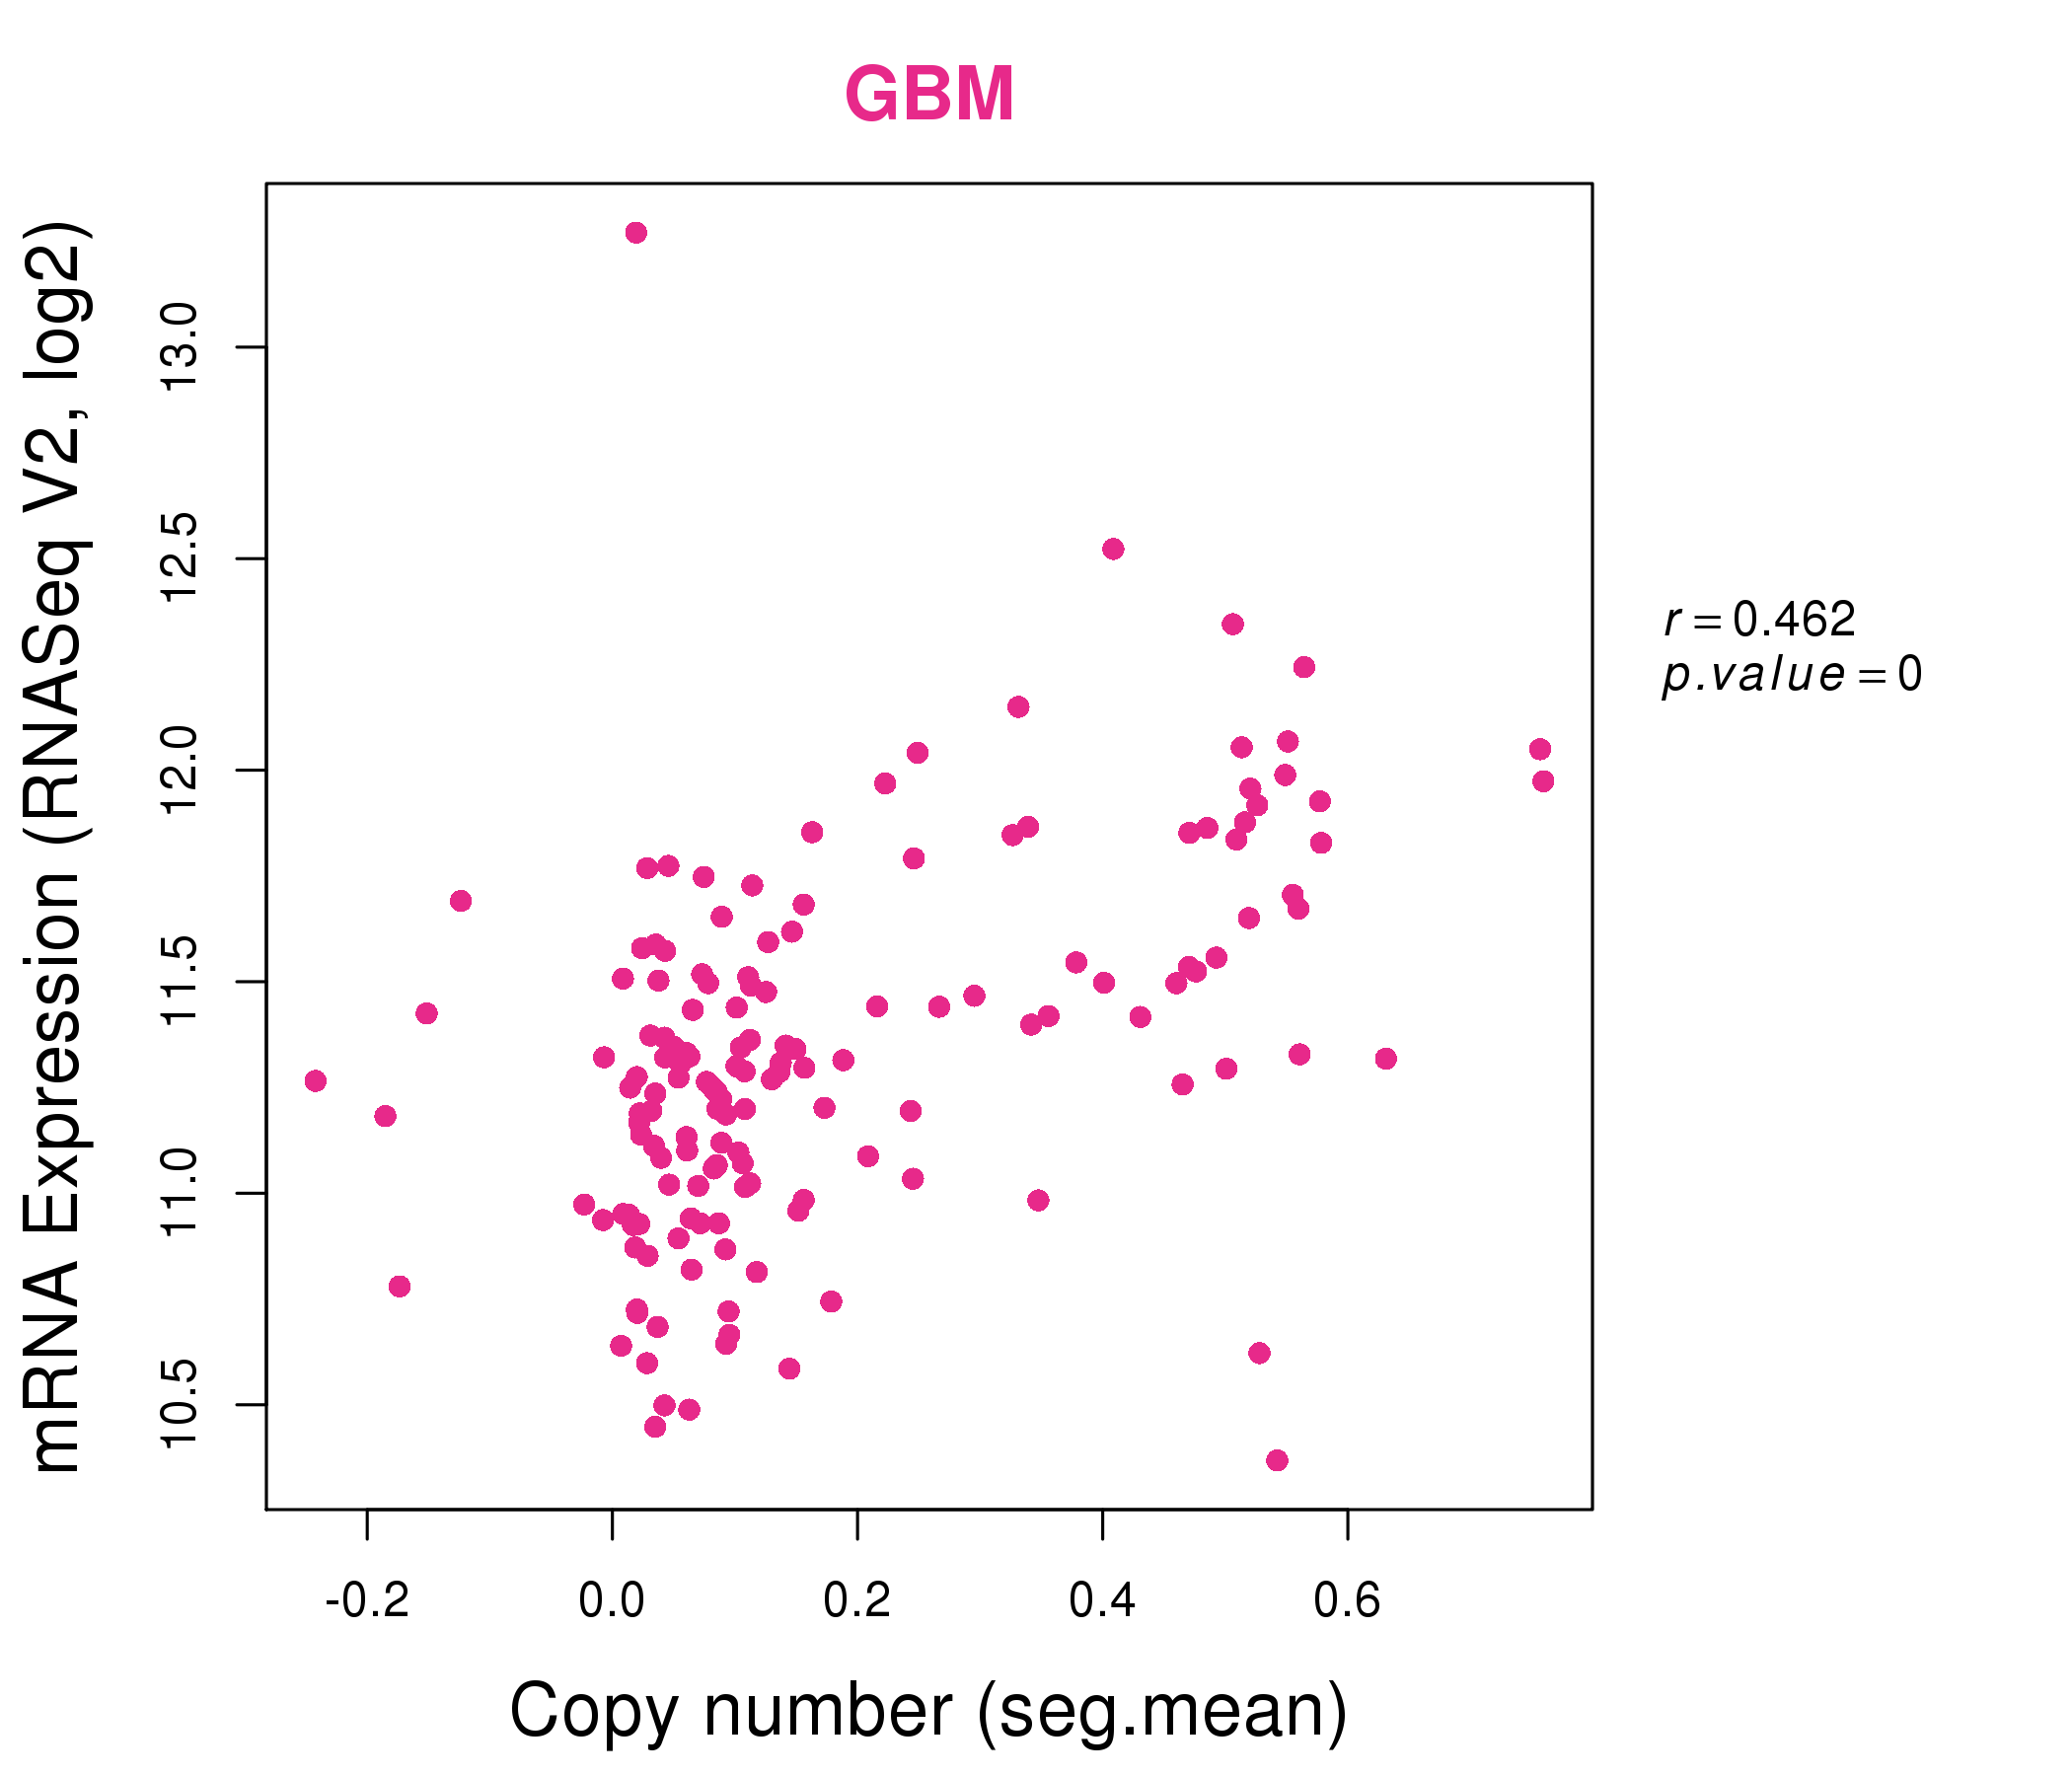
| * This plots show the correlation between CNV and gene expression. |
: Open all plots for all cancer types
 |
|
 |
|
| Top |
| Gene-Gene Network Information |
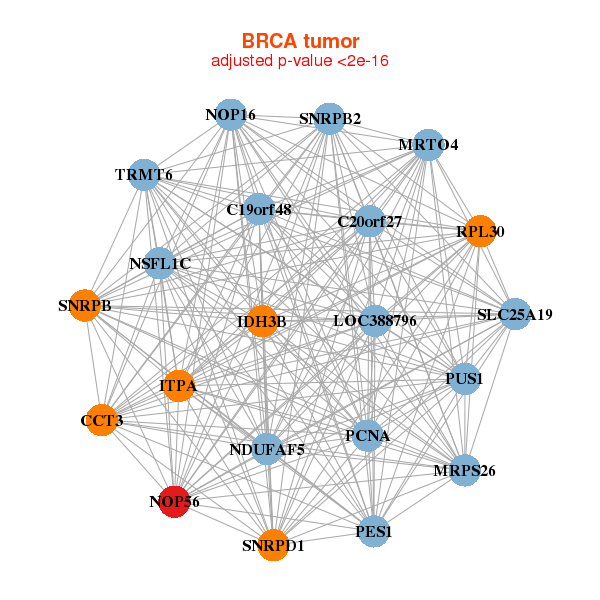
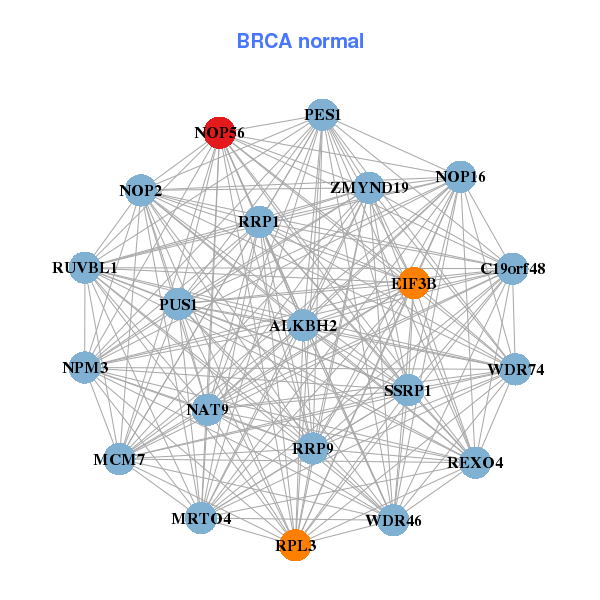
| * Co-Expression network figures were drawn using R package igraph. Only the top 20 genes with the highest correlations were shown. Red circle: input gene, orange circle: cell metabolism gene, sky circle: other gene |
: Open all plots for all cancer types
 |
|
| C19orf48,C20orf27,NDUFAF5,CCT3,IDH3B,ITPA,LOC388796, MRPS26,MRTO4,NOP16,NOP56,NSFL1C,PCNA,PES1, PUS1,RPL30,SLC25A19,SNRPB2,SNRPB,SNRPD1,TRMT6 | ALKBH2,C19orf48,EIF3B,MCM7,MRTO4,NAT9,NOP16, NOP2,NOP56,NPM3,PES1,PUS1,REXO4,RPL3, RRP1,RRP9,RUVBL1,SSRP1,WDR46,WDR74,ZMYND19 |
 |
|
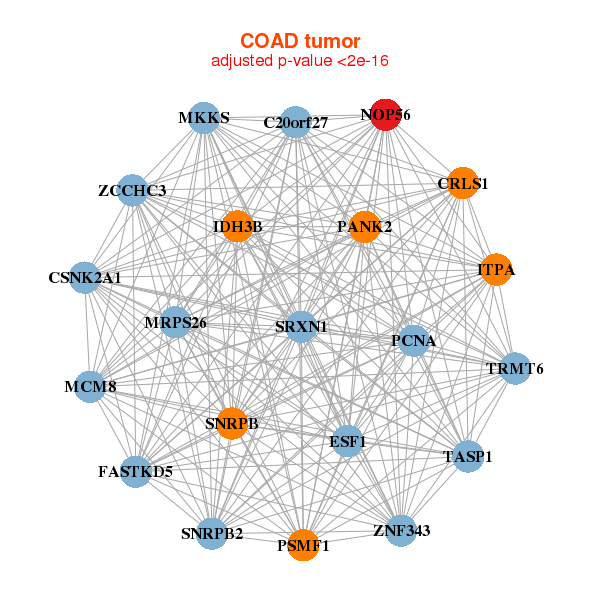
| C20orf27,CRLS1,CSNK2A1,ESF1,FASTKD5,IDH3B,ITPA, MCM8,MKKS,MRPS26,NOP56,PANK2,PCNA,PSMF1, SNRPB2,SNRPB,SRXN1,TASP1,TRMT6,ZCCHC3,ZNF343 | ABCE1,CCT2,EBNA1BP2,EEF2KMT,FTSJ1,IFRD2,LTV1, LYAR,METTL1,MRTO4,NME1,NOC3L,NOP56,PA2G4, PPIL1,PRMT1,PRMT5,RRP9,RUVBL1,STIP1,WDR77 |
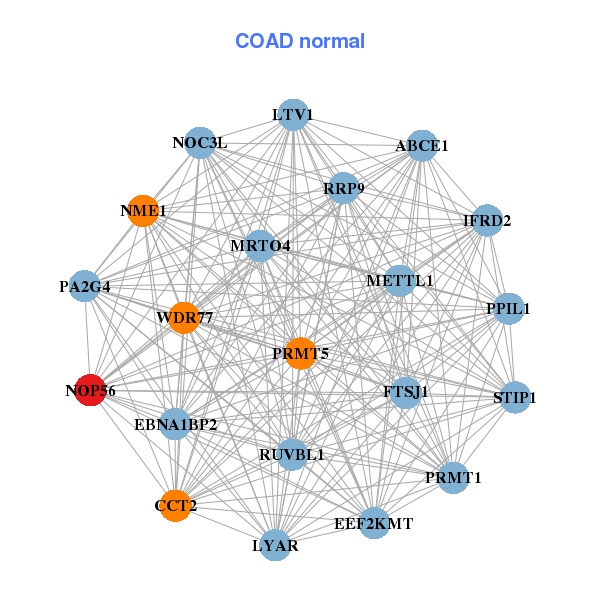
| * Co-Expression network figures were drawn using R package igraph. Only the top 20 genes with the highest correlations were shown. Red circle: input gene, orange circle: cell metabolism gene, sky circle: other gene |
: Open all plots for all cancer types
| Top |
: Open all interacting genes' information including KEGG pathway for all interacting genes from DAVID
| Top |
| Pharmacological Information for NOP56 |
| There's no related Drug. |
| Top |
| Cross referenced IDs for NOP56 |
| * We obtained these cross-references from Uniprot database. It covers 150 different DBs, 18 categories. http://www.uniprot.org/help/cross_references_section |
: Open all cross reference information
|
Copyright © 2016-Present - The Univsersity of Texas Health Science Center at Houston @ |