|
||||||||||||||||||||
| |
| Phenotypic Information (metabolism pathway, cancer, disease, phenome) |
| |
| |
| Gene-Gene Network Information: Co-Expression Network, Interacting Genes & KEGG |
| |
|


| Gene Summary for AGPAT2 |
| Basic gene info. | Gene symbol | AGPAT2 |
| Gene name | 1-acylglycerol-3-phosphate O-acyltransferase 2 | |
| Synonyms | 1-AGPAT2|BSCL|BSCL1|LPAAB|LPAAT-beta | |
| Cytomap | UCSC genome browser: 9q34.3 | |
| Genomic location | chr9 :139567594-139581911 | |
| Type of gene | protein-coding | |
| RefGenes | NM_001012727.1, NM_006412.3, | |
| Ensembl id | ENSG00000169692 | |
| Description | 1-AGP acyltransferase 21-AGPAT 21-acyl-sn-glycerol-3-phosphate acyltransferase beta1-acylglycerol-3-phosphate O-acyltransferase 2 (lysophosphatidic acid acyltransferase, beta)lysophosphatidic acid acyltransferase betalysophosphatidic acid acyltransfe | |
| Modification date | 20141219 | |
| dbXrefs | MIM : 603100 | |
| HGNC : HGNC | ||
| Ensembl : ENSG00000169692 | ||
| HPRD : 04373 | ||
| Vega : OTTHUMG00000020936 | ||
| Protein | UniProt: go to UniProt's Cross Reference DB Table | |
| Expression | CleanEX: HS_AGPAT2 | |
| BioGPS: 10555 | ||
| Gene Expression Atlas: ENSG00000169692 | ||
| The Human Protein Atlas: ENSG00000169692 | ||
| Pathway | NCI Pathway Interaction Database: AGPAT2 | |
| KEGG: AGPAT2 | ||
| REACTOME: AGPAT2 | ||
| ConsensusPathDB | ||
| Pathway Commons: AGPAT2 | ||
| Metabolism | MetaCyc: AGPAT2 | |
| HUMANCyc: AGPAT2 | ||
| Regulation | Ensembl's Regulation: ENSG00000169692 | |
| miRBase: chr9 :139,567,594-139,581,911 | ||
| TargetScan: NM_001012727 | ||
| cisRED: ENSG00000169692 | ||
| Context | iHOP: AGPAT2 | |
| cancer metabolism search in PubMed: AGPAT2 | ||
| UCL Cancer Institute: AGPAT2 | ||
| Assigned class in ccmGDB | C | |
| Top |
| Phenotypic Information for AGPAT2(metabolism pathway, cancer, disease, phenome) |
| Cancer | CGAP: AGPAT2 |
| Familial Cancer Database: AGPAT2 | |
| * This gene is included in those cancer gene databases. |
|
|
|
|
|
| . | ||||||||||||||
Oncogene 1 | Significant driver gene in | |||||||||||||||||||
| cf) number; DB name 1 Oncogene; http://nar.oxfordjournals.org/content/35/suppl_1/D721.long, 2 Tumor Suppressor gene; https://bioinfo.uth.edu/TSGene/, 3 Cancer Gene Census; http://www.nature.com/nrc/journal/v4/n3/abs/nrc1299.html, 4 CancerGenes; http://nar.oxfordjournals.org/content/35/suppl_1/D721.long, 5 Network of Cancer Gene; http://ncg.kcl.ac.uk/index.php, 1Therapeutic Vulnerabilities in Cancer; http://cbio.mskcc.org/cancergenomics/statius/ |
| KEGG_GLYCEROLIPID_METABOLISM KEGG_GLYCEROPHOSPHOLIPID_METABOLISM REACTOME_PHOSPHOLIPID_METABOLISM REACTOME_METABOLISM_OF_LIPIDS_AND_LIPOPROTEINS | |
| OMIM | |
| Orphanet | |
| Disease | KEGG Disease: AGPAT2 |
| MedGen: AGPAT2 (Human Medical Genetics with Condition) | |
| ClinVar: AGPAT2 | |
| Phenotype | MGI: AGPAT2 (International Mouse Phenotyping Consortium) |
| PhenomicDB: AGPAT2 | |
| Mutations for AGPAT2 |
| * Under tables are showing count per each tissue to give us broad intuition about tissue specific mutation patterns.You can go to the detailed page for each mutation database's web site. |
| There's no structural variation information in COSMIC data for this gene. |
| * From mRNA Sanger sequences, Chitars2.0 arranged chimeric transcripts. This table shows AGPAT2 related fusion information. |
| ID | Head Gene | Tail Gene | Accession | Gene_a | qStart_a | qEnd_a | Chromosome_a | tStart_a | tEnd_a | Gene_a | qStart_a | qEnd_a | Chromosome_a | tStart_a | tEnd_a |
| Top |
| There's no copy number variation information in COSMIC data for this gene. |
| Top |
|
 |
| Top |
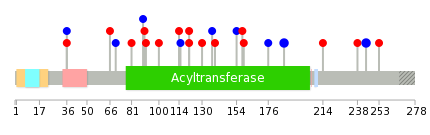
| Stat. for Non-Synonymous SNVs (# total SNVs=11) | (# total SNVs=6) |
 |  |
(# total SNVs=0) | (# total SNVs=0) |
| Top |
| * When you move the cursor on each content, you can see more deailed mutation information on the Tooltip. Those are primary_site,primary_histology,mutation(aa),pubmedID. |
| GRCh37 position | Mutation(aa) | Unique sampleID count |
| chr9:139568309-139568309 | p.L244L | 2 |
| chr9:139571064-139571064 | p.G187G | 2 |
| chr9:139571949-139571949 | p.R81Q | 1 |
| chr9:139571543-139571543 | p.R121P | 1 |
| chr9:139571981-139571981 | p.F70F | 1 |
| chr9:139568328-139568328 | p.A238V | 1 |
| chr9:139571544-139571544 | p.R121W | 1 |
| chr9:139571989-139571989 | p.R68* | 1 |
| chr9:139569207-139569207 | p.K214M | 1 |
| chr9:139571560-139571560 | p.C115C | 1 |
| Top |
|
 |
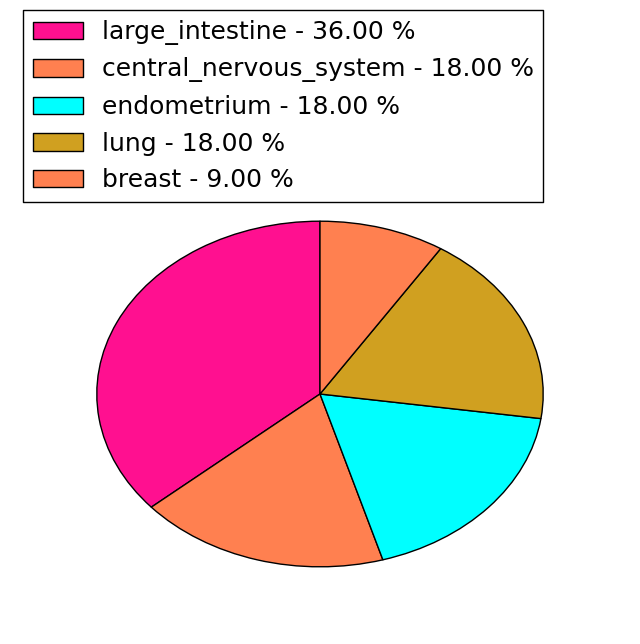
| Point Mutation/ Tissue ID | 1 | 2 | 3 | 4 | 5 | 6 | 7 | 8 | 9 | 10 | 11 | 12 | 13 | 14 | 15 | 16 | 17 | 18 | 19 | 20 |
| # sample | 1 | 4 | 1 | 1 | 1 | 2 | 1 | 4 | 3 | 3 | ||||||||||
| # mutation | 1 | 4 | 1 | 1 | 1 | 2 | 1 | 4 | 3 | 3 | ||||||||||
| nonsynonymous SNV | 2 | 1 | 1 | 2 | 1 | 2 | 2 | |||||||||||||
| synonymous SNV | 1 | 2 | 1 | 2 | 3 | 1 |
| cf) Tissue ID; Tissue type (1; BLCA[Bladder Urothelial Carcinoma], 2; BRCA[Breast invasive carcinoma], 3; CESC[Cervical squamous cell carcinoma and endocervical adenocarcinoma], 4; COAD[Colon adenocarcinoma], 5; GBM[Glioblastoma multiforme], 6; Glioma Low Grade, 7; HNSC[Head and Neck squamous cell carcinoma], 8; KICH[Kidney Chromophobe], 9; KIRC[Kidney renal clear cell carcinoma], 10; KIRP[Kidney renal papillary cell carcinoma], 11; LAML[Acute Myeloid Leukemia], 12; LUAD[Lung adenocarcinoma], 13; LUSC[Lung squamous cell carcinoma], 14; OV[Ovarian serous cystadenocarcinoma ], 15; PAAD[Pancreatic adenocarcinoma], 16; PRAD[Prostate adenocarcinoma], 17; SKCM[Skin Cutaneous Melanoma], 18:STAD[Stomach adenocarcinoma], 19:THCA[Thyroid carcinoma], 20:UCEC[Uterine Corpus Endometrial Carcinoma]) |
| Top |
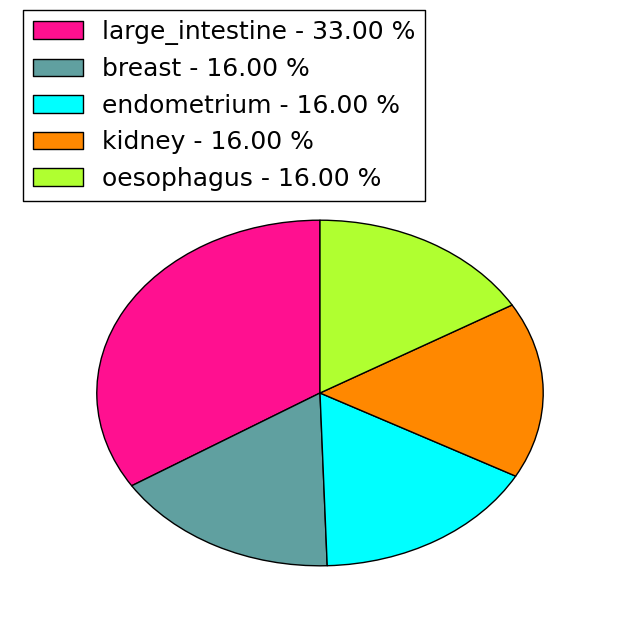
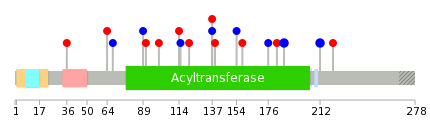
| * We represented just top 10 SNVs. When you move the cursor on each content, you can see more deailed mutation information on the Tooltip. Those are primary_site, primary_histology, mutation(aa), pubmedID. |
| Genomic Position | Mutation(aa) | Unique sampleID count |
| chr9:139568309 | p.L212L,AGPAT2 | 2 |
| chr9:139571064 | p.G187G | 2 |
| chr9:139571543 | p.R221M,AGPAT2 | 1 |
| chr9:139568283 | p.R68R,AGPAT2 | 1 |
| chr9:139571560 | p.G64C,AGPAT2 | 1 |
| chr9:139571564 | p.K182M,AGPAT2 | 1 |
| chr9:139569207 | p.L36Q,AGPAT2 | 1 |
| chr9:139571892 | p.N176N | 1 |
| chr9:139571920 | p.E158D,AGPAT2 | 1 |
| chr9:139571097 | p.A154A,AGPAT2 | 1 |
| * Copy number data were extracted from TCGA using R package TCGA-Assembler. The URLs of all public data files on TCGA DCC data server were gathered on Jan-05-2015. Function ProcessCNAData in TCGA-Assembler package was used to obtain gene-level copy number value which is calculated as the average copy number of the genomic region of a gene. |
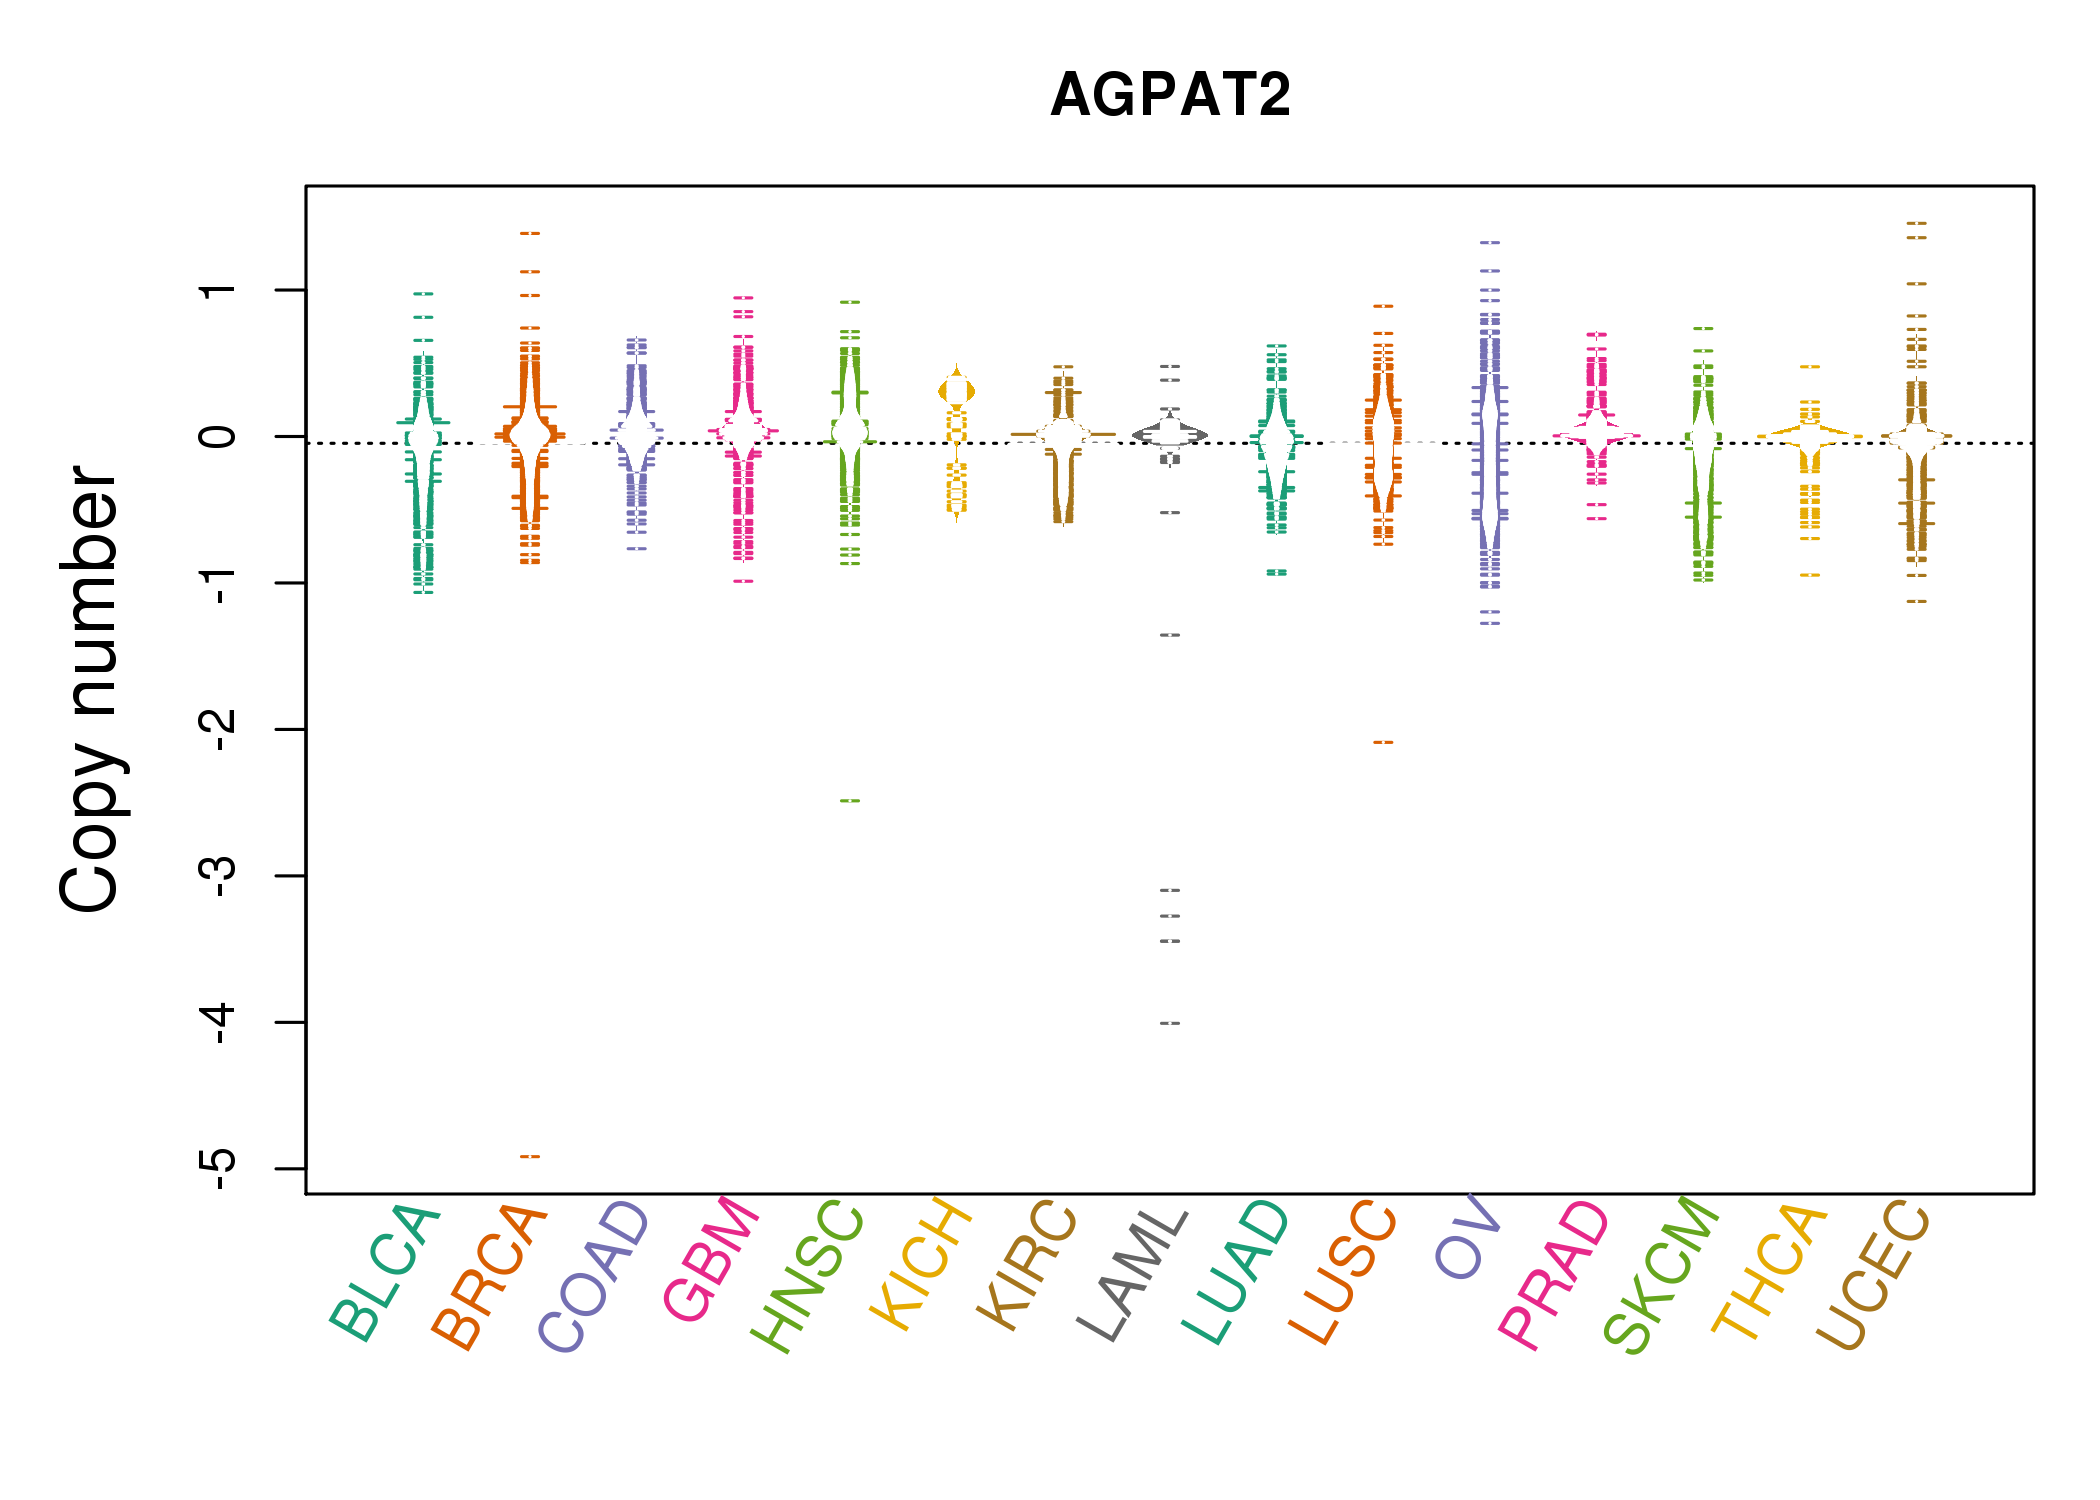 |
| cf) Tissue ID[Tissue type]: BLCA[Bladder Urothelial Carcinoma], BRCA[Breast invasive carcinoma], CESC[Cervical squamous cell carcinoma and endocervical adenocarcinoma], COAD[Colon adenocarcinoma], GBM[Glioblastoma multiforme], Glioma Low Grade, HNSC[Head and Neck squamous cell carcinoma], KICH[Kidney Chromophobe], KIRC[Kidney renal clear cell carcinoma], KIRP[Kidney renal papillary cell carcinoma], LAML[Acute Myeloid Leukemia], LUAD[Lung adenocarcinoma], LUSC[Lung squamous cell carcinoma], OV[Ovarian serous cystadenocarcinoma ], PAAD[Pancreatic adenocarcinoma], PRAD[Prostate adenocarcinoma], SKCM[Skin Cutaneous Melanoma], STAD[Stomach adenocarcinoma], THCA[Thyroid carcinoma], UCEC[Uterine Corpus Endometrial Carcinoma] |
| Top |
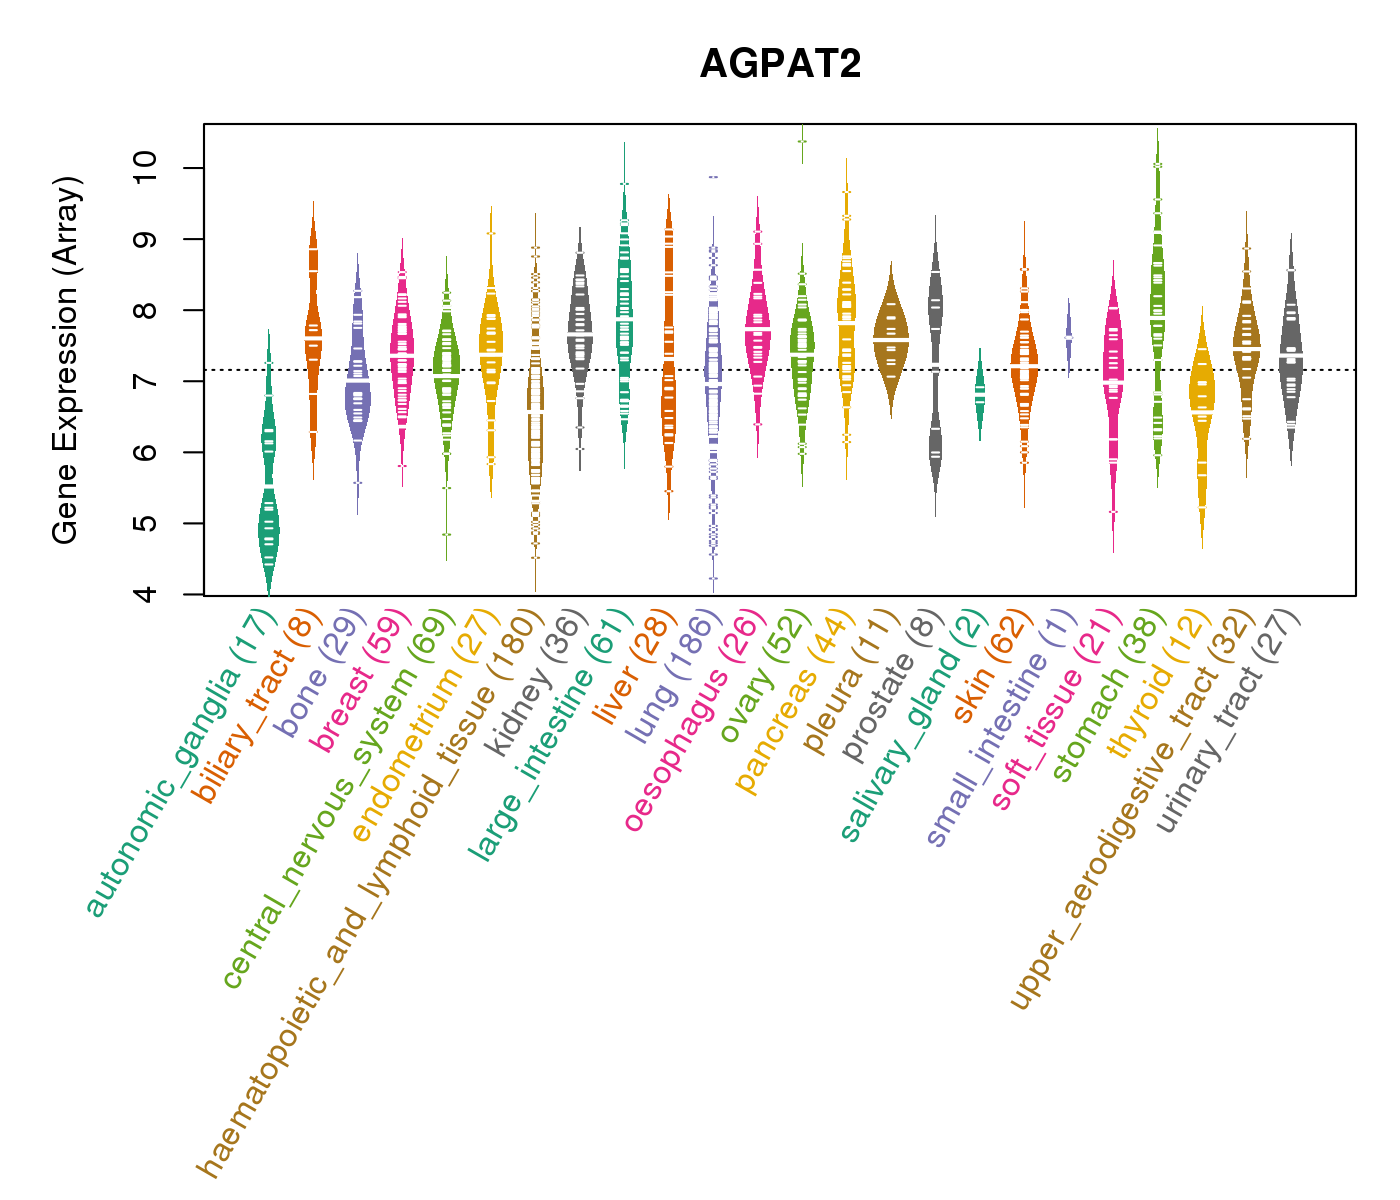
| Gene Expression for AGPAT2 |
| * CCLE gene expression data were extracted from CCLE_Expression_Entrez_2012-10-18.res: Gene-centric RMA-normalized mRNA expression data. |
 |
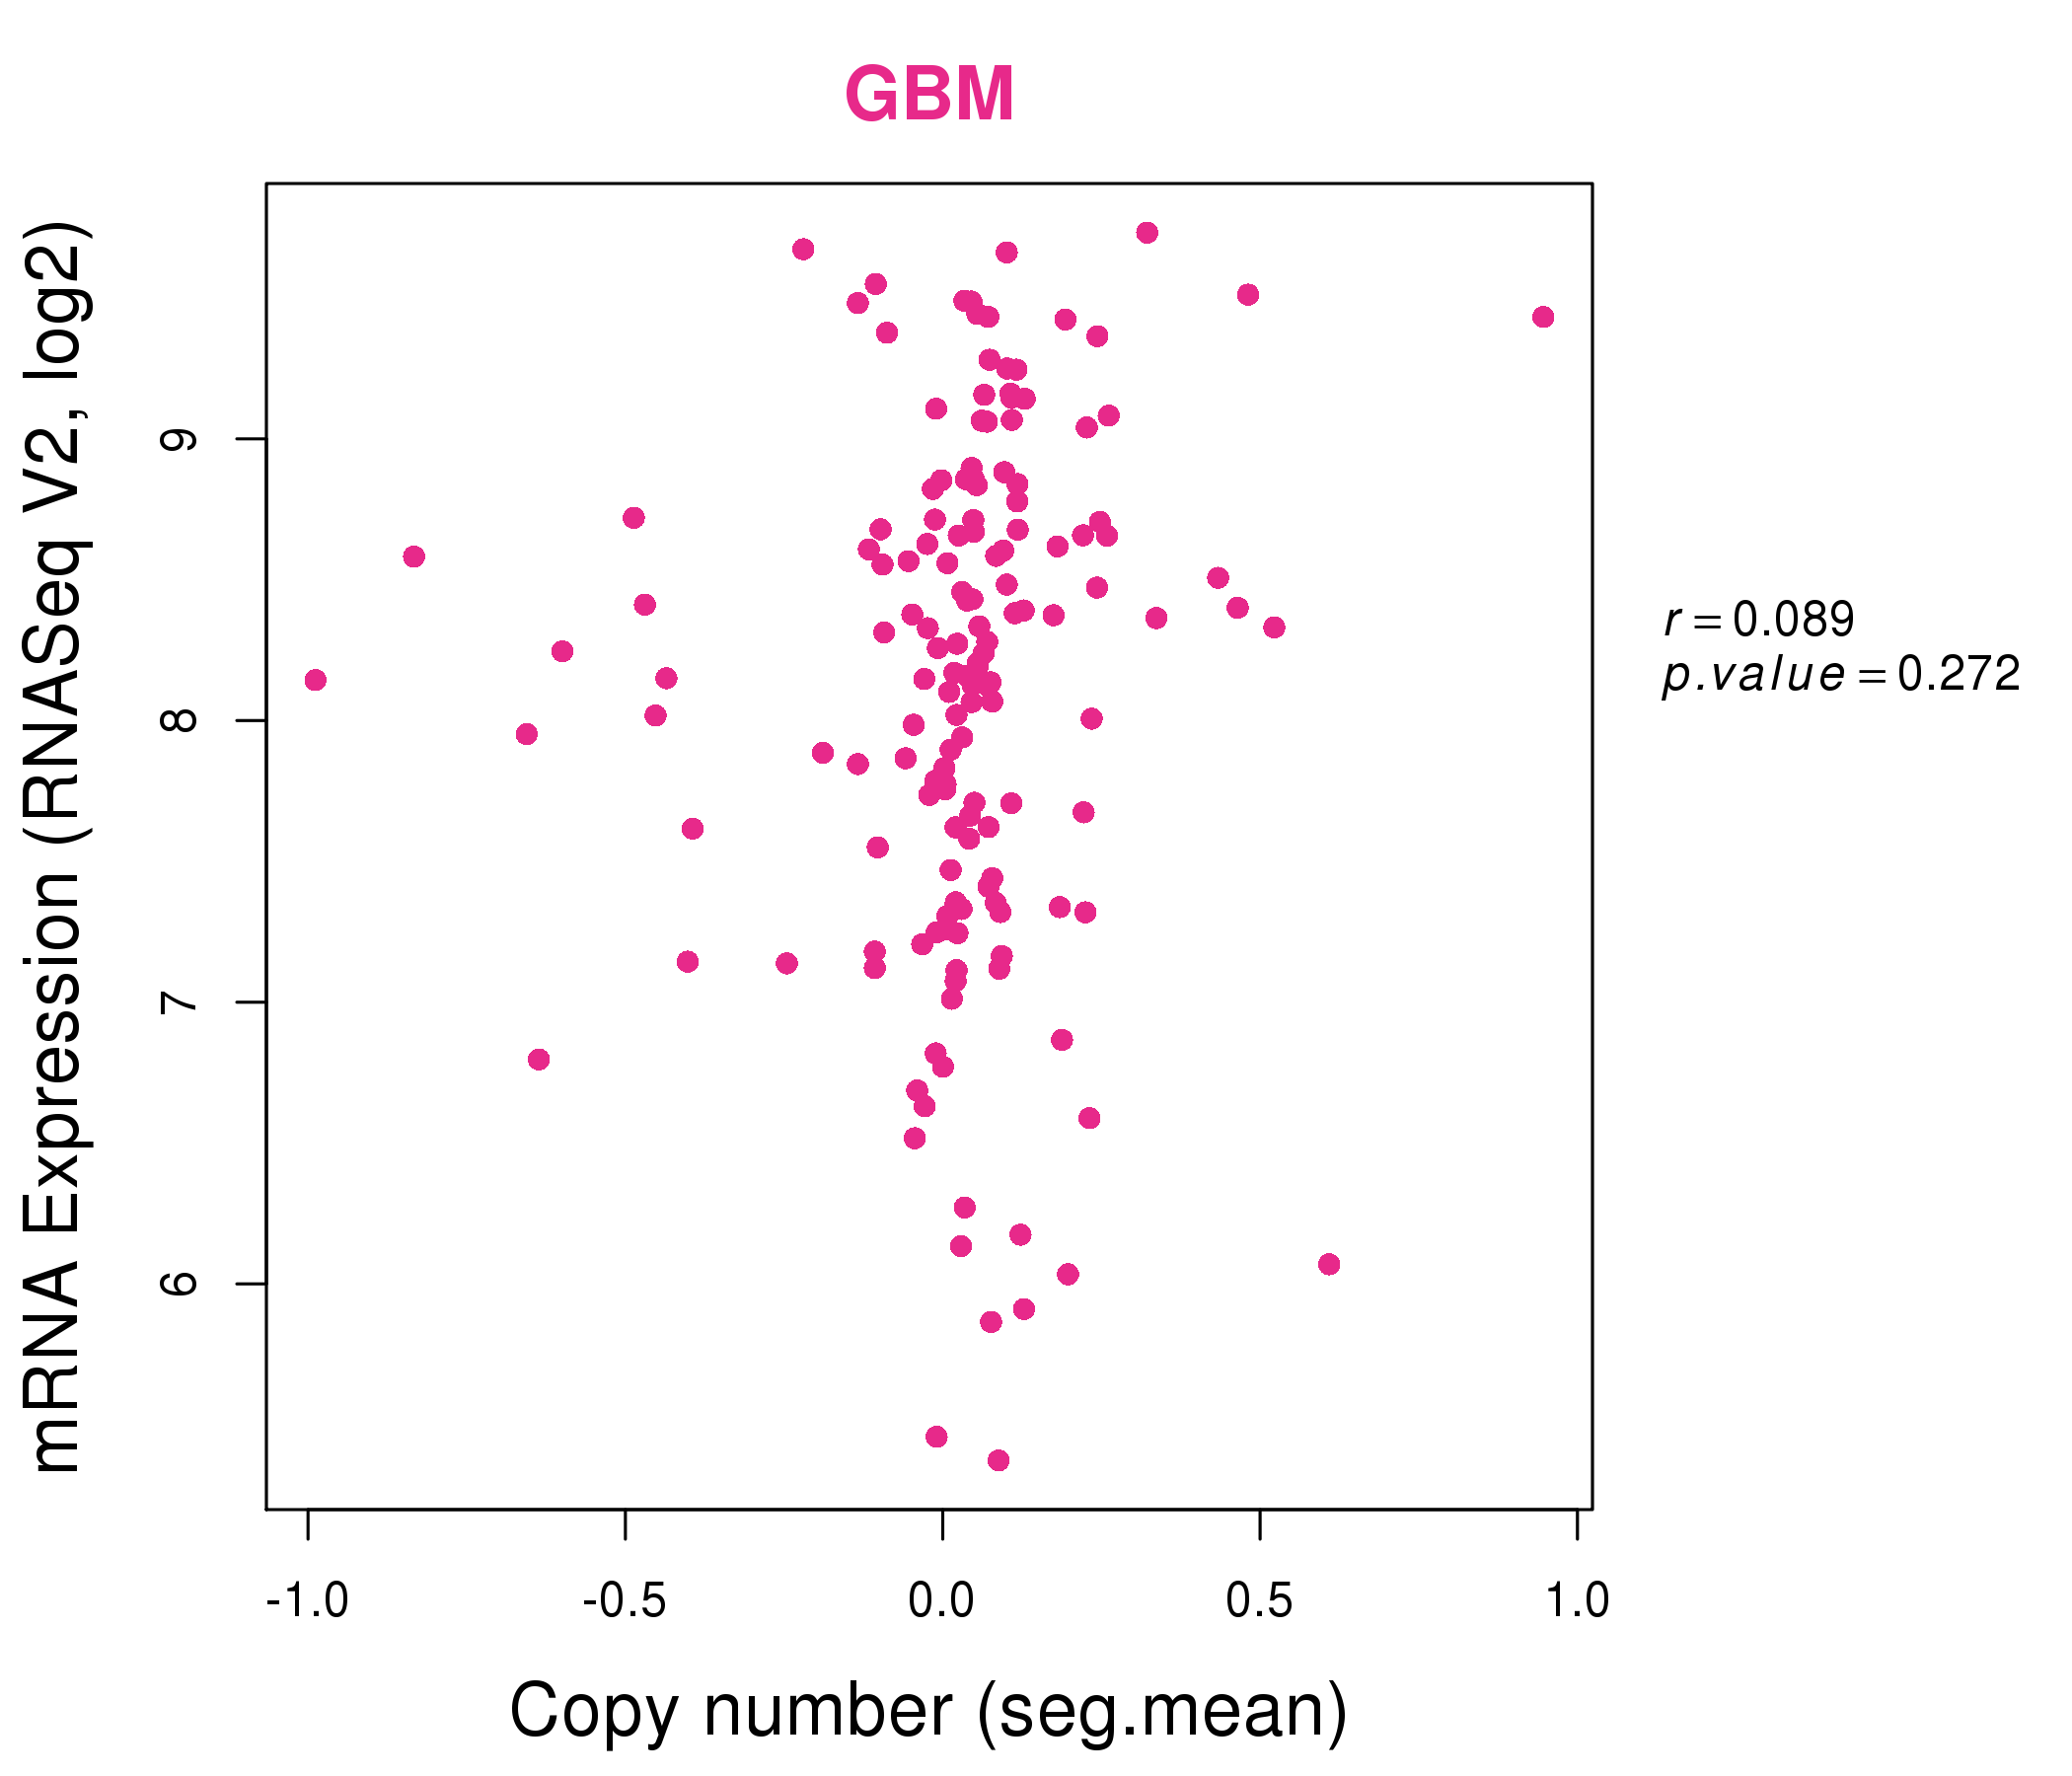
| * Normalized gene expression data of RNASeqV2 was extracted from TCGA using R package TCGA-Assembler. The URLs of all public data files on TCGA DCC data server were gathered at Jan-05-2015. Only eight cancer types have enough normal control samples for differential expression analysis. (t test, adjusted p<0.05 (using Benjamini-Hochberg FDR)) |
 |
| Top |
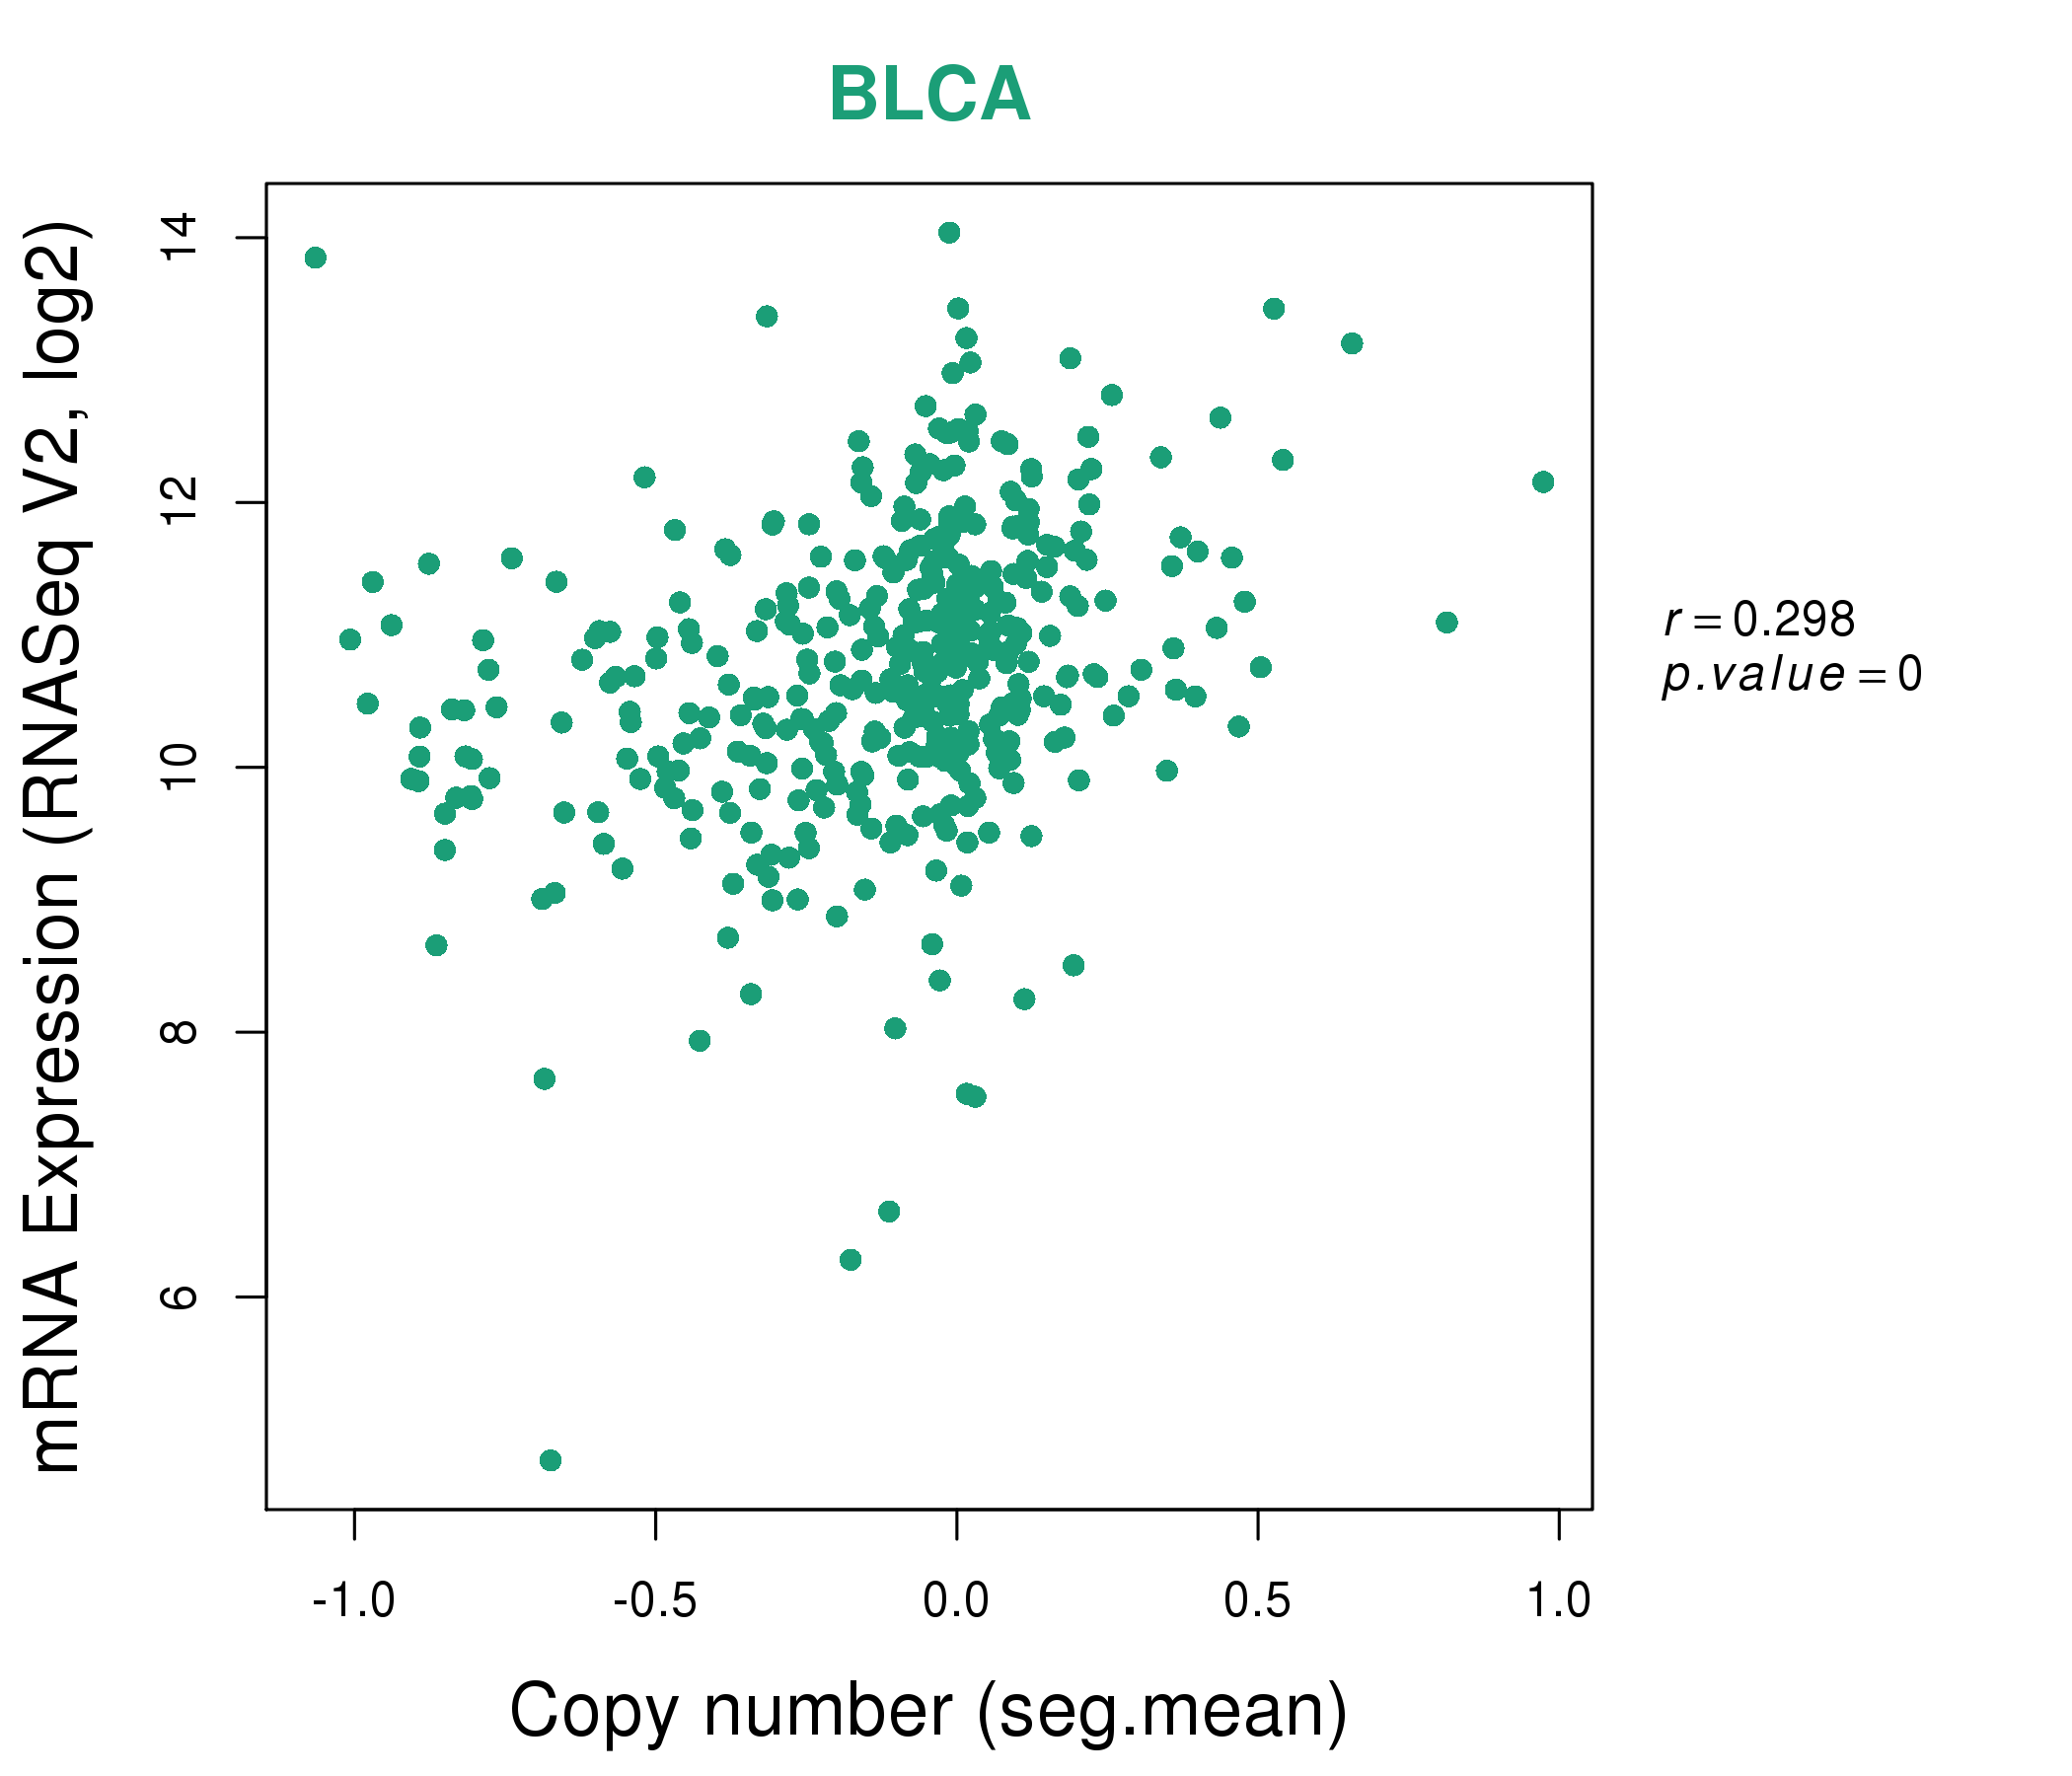
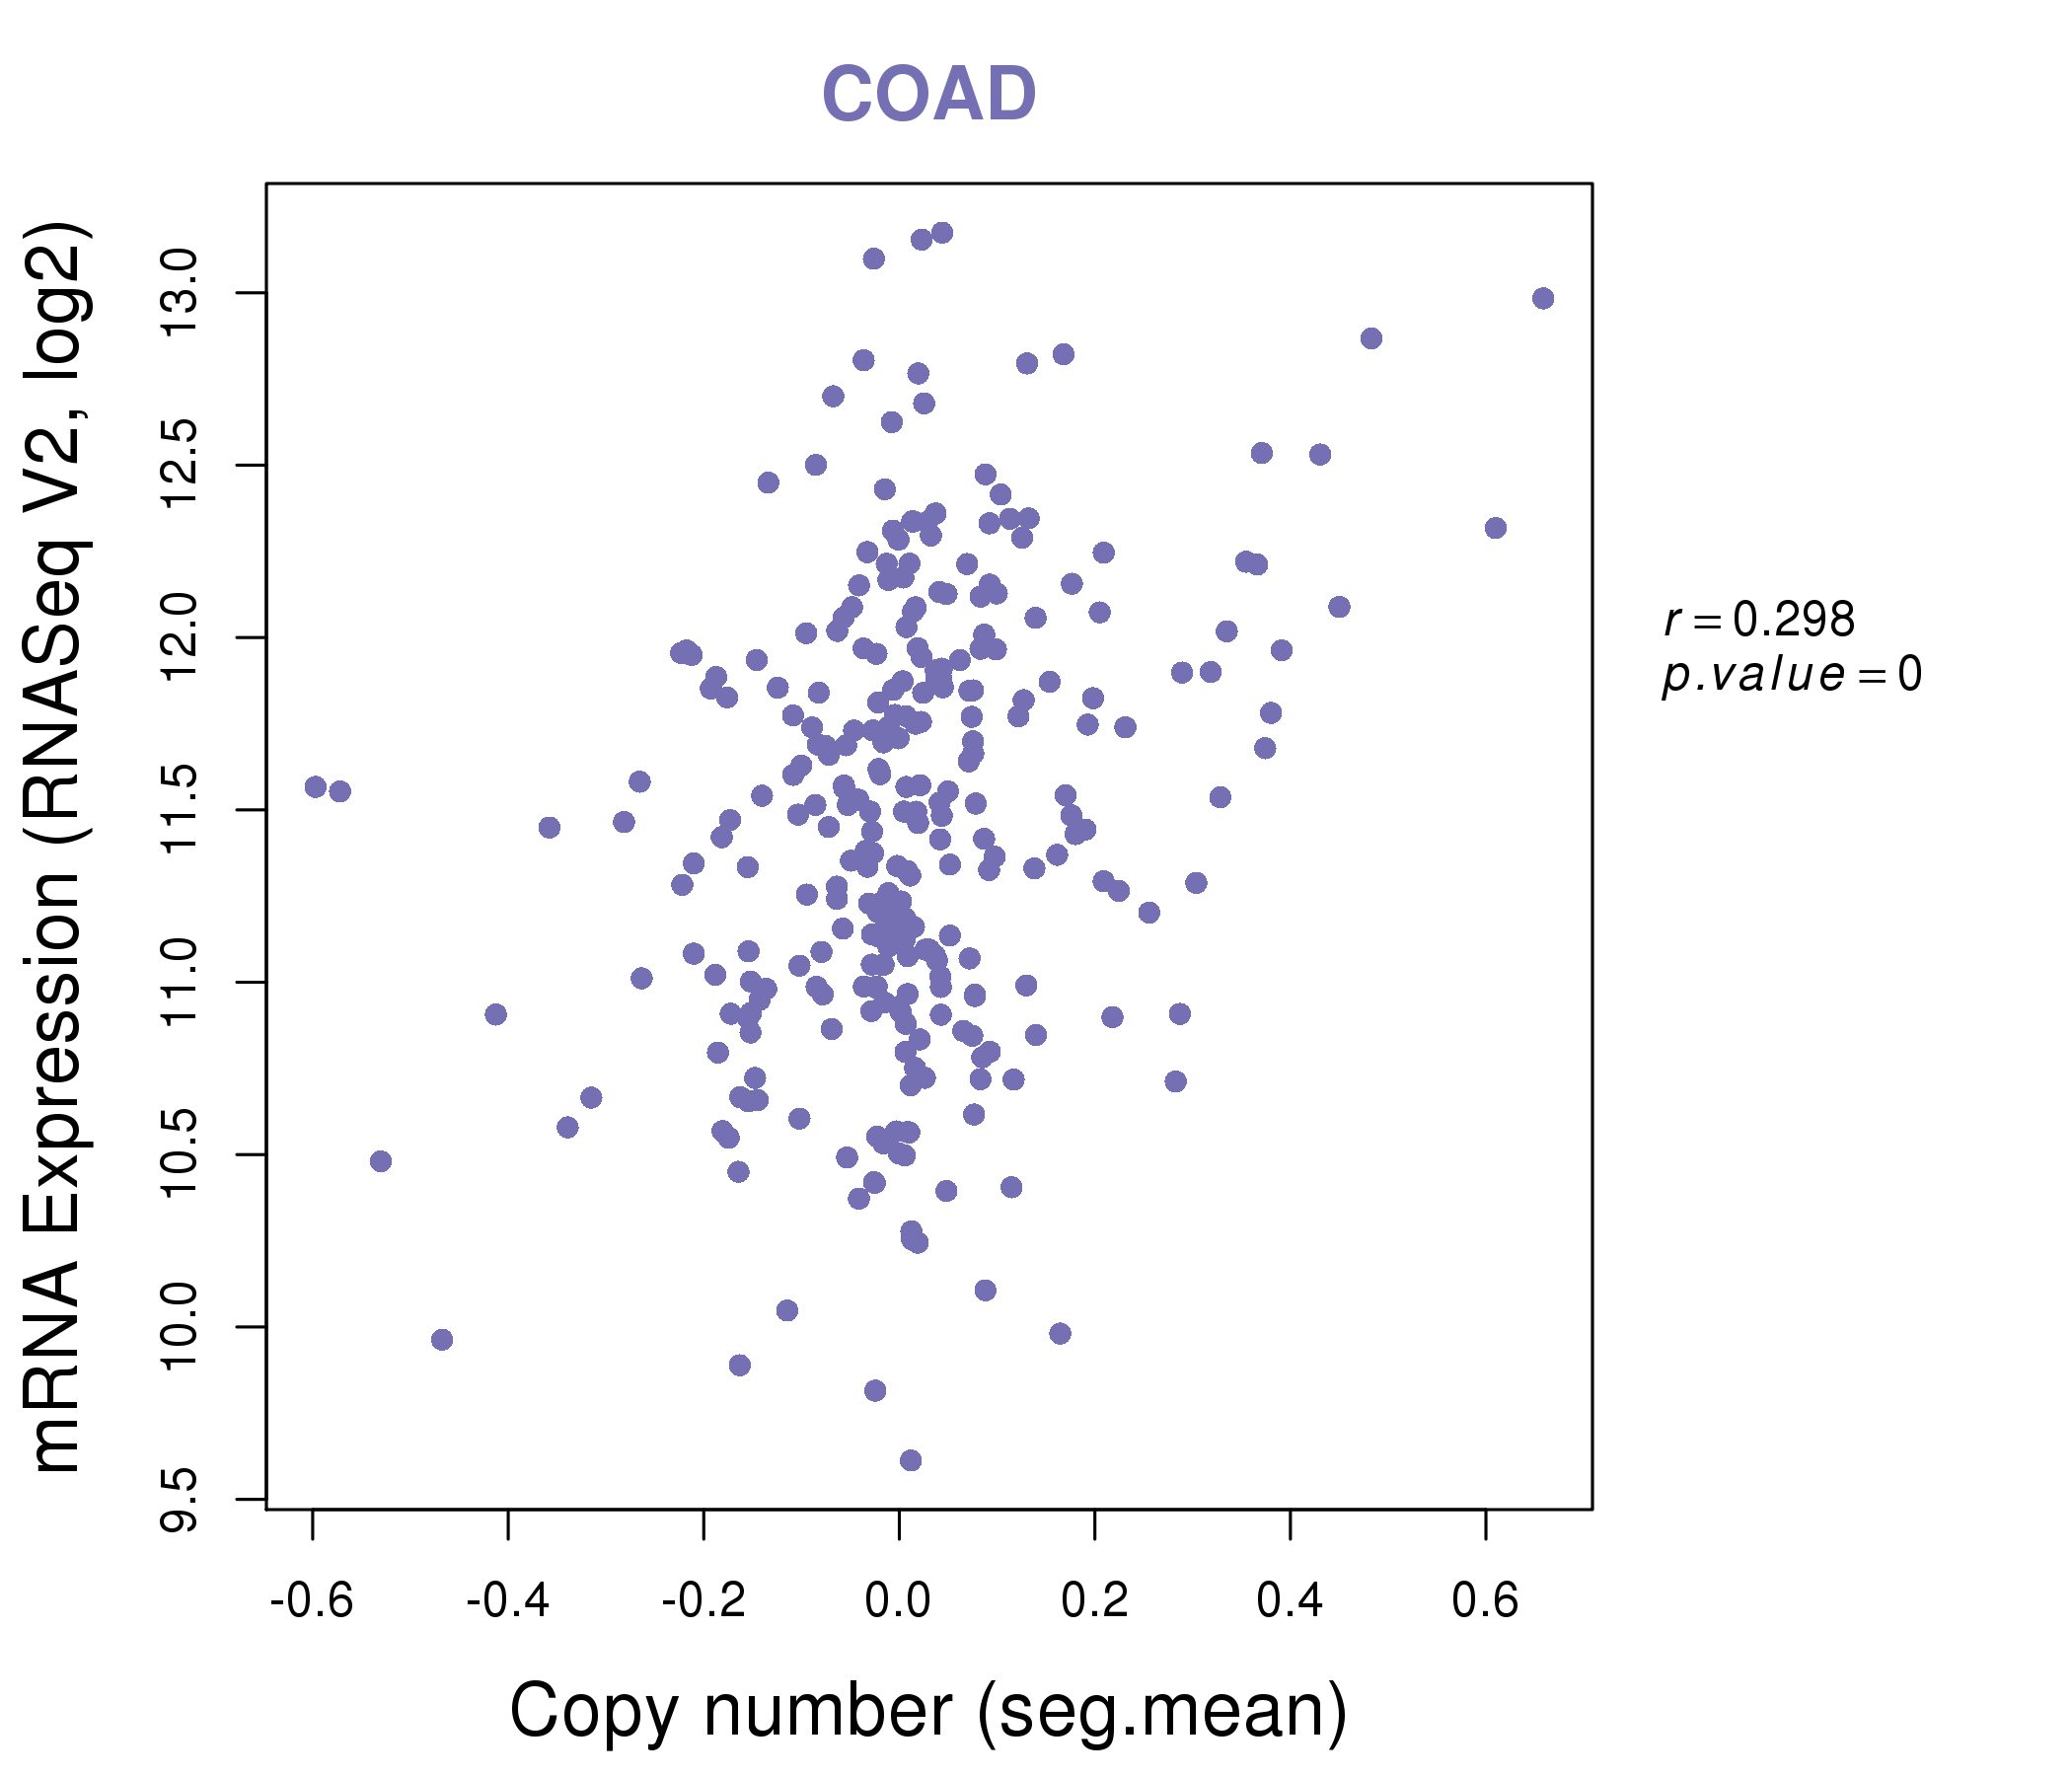
| * This plots show the correlation between CNV and gene expression. |
: Open all plots for all cancer types
 |
|
 |
|

| Top |
| Gene-Gene Network Information |
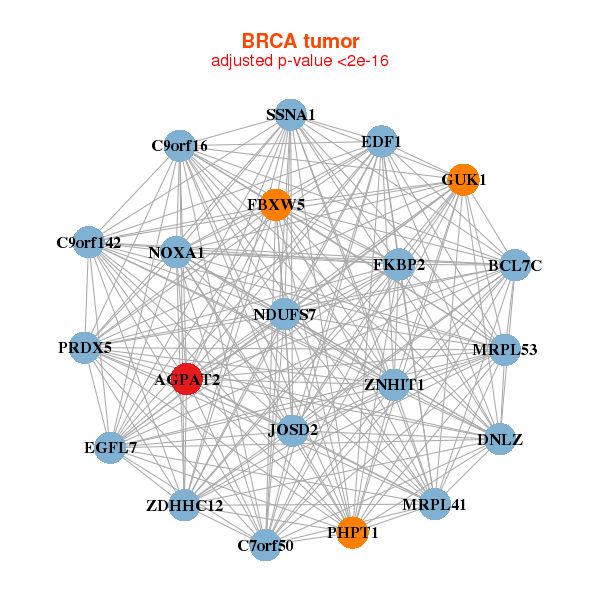
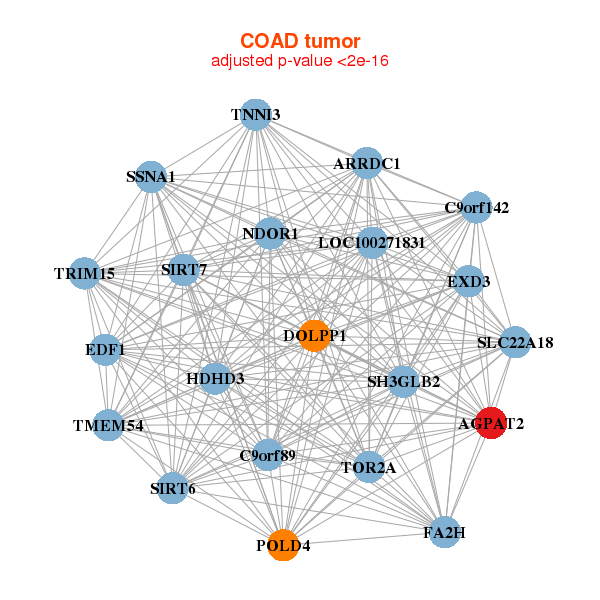
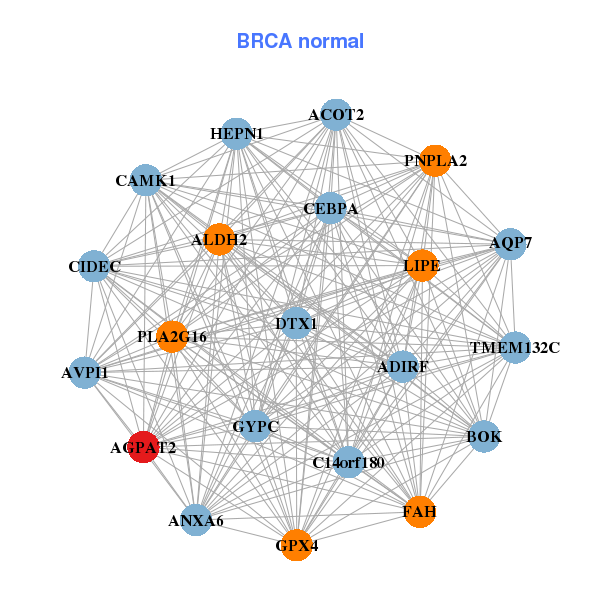
| * Co-Expression network figures were drawn using R package igraph. Only the top 20 genes with the highest correlations were shown. Red circle: input gene, orange circle: cell metabolism gene, sky circle: other gene |
: Open all plots for all cancer types
 |
|
| AGPAT2,BCL7C,C7orf50,C9orf142,C9orf16,DNLZ,EDF1, EGFL7,FBXW5,FKBP2,GUK1,JOSD2,MRPL41,MRPL53, NDUFS7,NOXA1,PHPT1,PRDX5,SSNA1,ZDHHC12,ZNHIT1 | ACOT2,AGPAT2,ALDH2,ANXA6,AQP7,AVPI1,BOK, ADIRF,C14orf180,CAMK1,CEBPA,CIDEC,DTX1,FAH, GPX4,GYPC,HEPN1,LIPE,PLA2G16,PNPLA2,TMEM132C |
 |
|
| AGPAT2,ARRDC1,C9orf142,C9orf89,DOLPP1,EDF1,EXD3, FA2H,HDHD3,LOC100271831,NDOR1,POLD4,SH3GLB2,SIRT6, SIRT7,SLC22A18,SSNA1,TMEM54,TNNI3,TOR2A,TRIM15 | ABHD12,ACAA1,AGPAT2,MISP,C1orf106,CEBPG,CLRN3, DOLPP1,EZR,GDPD2,KALRN,MALL,MOGAT3,POR, PRR13,PTPRH,RAB8A,SLC9A3R1,SULT1A2,TMEM82,TOM1 |
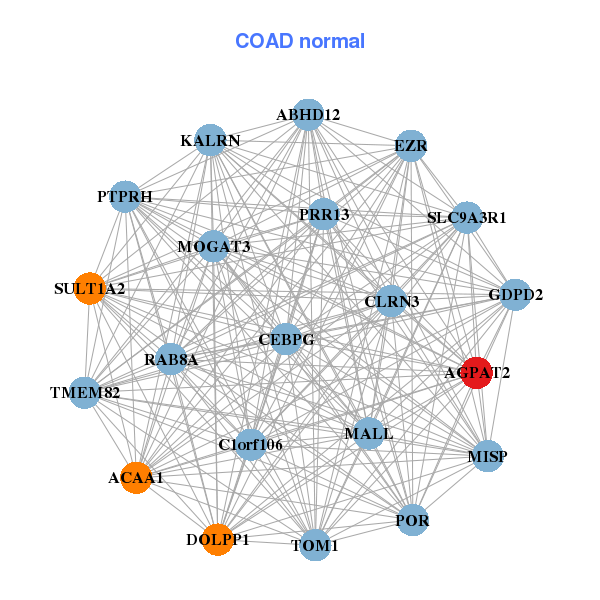
| * Co-Expression network figures were drawn using R package igraph. Only the top 20 genes with the highest correlations were shown. Red circle: input gene, orange circle: cell metabolism gene, sky circle: other gene |
: Open all plots for all cancer types
| Top |
: Open all interacting genes' information including KEGG pathway for all interacting genes from DAVID
| Top |
| Pharmacological Information for AGPAT2 |
| There's no related Drug. |
| Top |
| Cross referenced IDs for AGPAT2 |
| * We obtained these cross-references from Uniprot database. It covers 150 different DBs, 18 categories. http://www.uniprot.org/help/cross_references_section |
: Open all cross reference information
|
Copyright © 2016-Present - The Univsersity of Texas Health Science Center at Houston @ |