|
||||||||||||||||||||
| |
| Phenotypic Information (metabolism pathway, cancer, disease, phenome) |
| |
| |
| Gene-Gene Network Information: Co-Expression Network, Interacting Genes & KEGG |
| |
|


| Gene Summary for CEL |
| Basic gene info. | Gene symbol | CEL |
| Gene name | carboxyl ester lipase | |
| Synonyms | BAL|BSDL|BSSL|CELL|CEase|FAP|FAPP|LIPA|MODY8 | |
| Cytomap | UCSC genome browser: 9q34.3 | |
| Genomic location | chr9 :135937364-135947248 | |
| Type of gene | protein-coding | |
| RefGenes | NM_001807.4, | |
| Ensembl id | ENSG00000170835 | |
| Description | bile salt-activated lipasebile salt-dependent lipase, oncofetal isoformbucelipasecarboxyl ester hydrolasecarboxyl ester lipase (bile salt-stimulated lipase)cholesterol esterasefetoacinar pancreatic proteinlysophospholipase, pancreaticsterol estera | |
| Modification date | 20141207 | |
| dbXrefs | MIM : 114840 | |
| HGNC : HGNC | ||
| Ensembl : ENSG00000170835 | ||
| HPRD : 07509 | ||
| Vega : OTTHUMG00000020855 | ||
| Protein | UniProt: go to UniProt's Cross Reference DB Table | |
| Expression | CleanEX: HS_CEL | |
| BioGPS: 1056 | ||
| Gene Expression Atlas: ENSG00000170835 | ||
| The Human Protein Atlas: ENSG00000170835 | ||
| Pathway | NCI Pathway Interaction Database: CEL | |
| KEGG: CEL | ||
| REACTOME: CEL | ||
| ConsensusPathDB | ||
| Pathway Commons: CEL | ||
| Metabolism | MetaCyc: CEL | |
| HUMANCyc: CEL | ||
| Regulation | Ensembl's Regulation: ENSG00000170835 | |
| miRBase: chr9 :135,937,364-135,947,248 | ||
| TargetScan: NM_001807 | ||
| cisRED: ENSG00000170835 | ||
| Context | iHOP: CEL | |
| cancer metabolism search in PubMed: CEL | ||
| UCL Cancer Institute: CEL | ||
| Assigned class in ccmGDB | C | |
| Top |
| Phenotypic Information for CEL(metabolism pathway, cancer, disease, phenome) |
| Cancer | CGAP: CEL |
| Familial Cancer Database: CEL | |
| * This gene is included in those cancer gene databases. |
|
|
|
|
|
|
| ||||||||||||||
Oncogene 1 | Significant driver gene in | |||||||||||||||||||
| cf) number; DB name 1 Oncogene; http://nar.oxfordjournals.org/content/35/suppl_1/D721.long, 2 Tumor Suppressor gene; https://bioinfo.uth.edu/TSGene/, 3 Cancer Gene Census; http://www.nature.com/nrc/journal/v4/n3/abs/nrc1299.html, 4 CancerGenes; http://nar.oxfordjournals.org/content/35/suppl_1/D721.long, 5 Network of Cancer Gene; http://ncg.kcl.ac.uk/index.php, 1Therapeutic Vulnerabilities in Cancer; http://cbio.mskcc.org/cancergenomics/statius/ |
| KEGG_GLYCEROLIPID_METABOLISM | |
| OMIM | |
| Orphanet | |
| Disease | KEGG Disease: CEL |
| MedGen: CEL (Human Medical Genetics with Condition) | |
| ClinVar: CEL | |
| Phenotype | MGI: CEL (International Mouse Phenotyping Consortium) |
| PhenomicDB: CEL | |
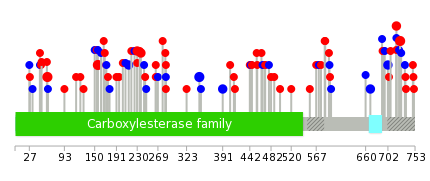
| Mutations for CEL |
| * Under tables are showing count per each tissue to give us broad intuition about tissue specific mutation patterns.You can go to the detailed page for each mutation database's web site. |
| There's no structural variation information in COSMIC data for this gene. |
| * From mRNA Sanger sequences, Chitars2.0 arranged chimeric transcripts. This table shows CEL related fusion information. |
| ID | Head Gene | Tail Gene | Accession | Gene_a | qStart_a | qEnd_a | Chromosome_a | tStart_a | tEnd_a | Gene_a | qStart_a | qEnd_a | Chromosome_a | tStart_a | tEnd_a |
| M54994 | PCYOX1 | 1 | 667 | 2 | 70488361 | 70504008 | CEL | 654 | 3004 | 9 | 135937365 | 135947248 | |
| Top |
| There's no copy number variation information in COSMIC data for this gene. |
| Top |
|
 |
| Top |
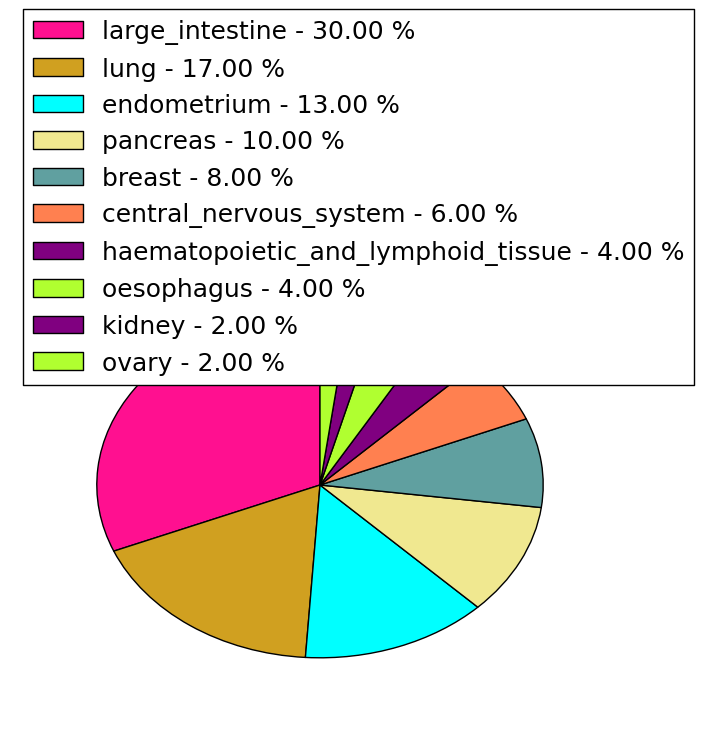
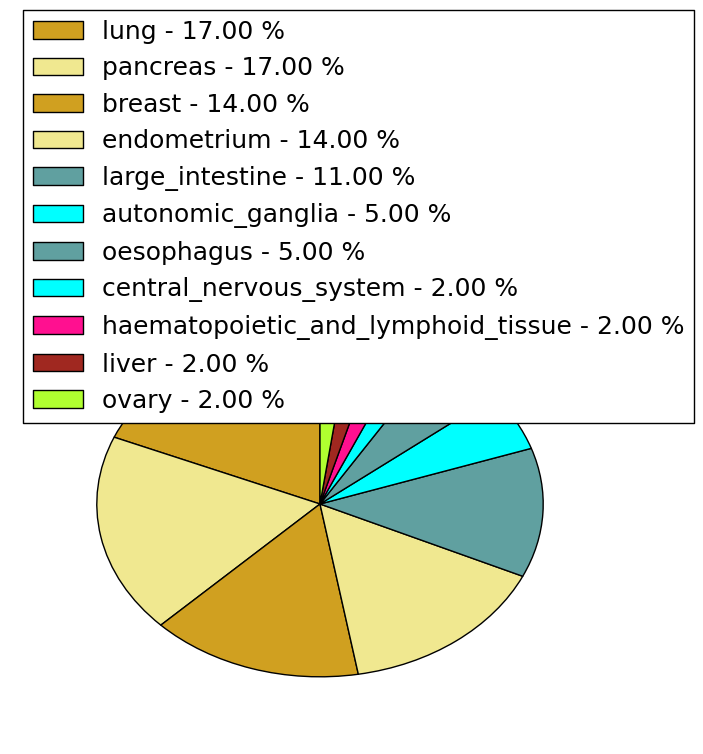
| Stat. for Non-Synonymous SNVs (# total SNVs=46) | (# total SNVs=34) |
 |  |
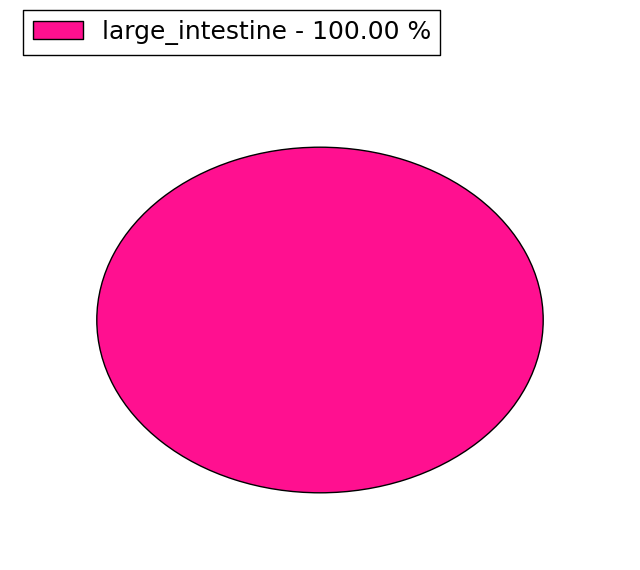
(# total SNVs=8) | (# total SNVs=1) |
 |  |
| Top |
| * When you move the cursor on each content, you can see more deailed mutation information on the Tooltip. Those are primary_site,primary_histology,mutation(aa),pubmedID. |
| GRCh37 position | Mutation(aa) | Unique sampleID count |
| chr9:135940544-135940544 | p.R156H | 3 |
| chr9:135939897-135939897 | p.P61L | 3 |
| chr9:135947032-135947032 | p.P718T | 3 |
| chr9:135944195-135944195 | p.F347F | 3 |
| chr9:135947053-135947053 | p.A725P | 3 |
| chr9:135947054-135947054 | p.P727fs*>30 | 3 |
| chr9:135942011-135942011 | p.F214F | 2 |
| chr9:135947125-135947125 | p.Q749* | 2 |
| chr9:135942481-135942481 | p.E265Q | 2 |
| chr9:135946887-135946887 | p.G669G | 2 |
| Top |
|
 |
| Point Mutation/ Tissue ID | 1 | 2 | 3 | 4 | 5 | 6 | 7 | 8 | 9 | 10 | 11 | 12 | 13 | 14 | 15 | 16 | 17 | 18 | 19 | 20 |
| # sample | 2 | 2 | 9 | 3 | 1 | 1 | 6 | 3 | 2 | 1 | 14 | 7 | 1 | 9 | ||||||
| # mutation | 2 | 2 | 9 | 3 | 1 | 1 | 6 | 3 | 2 | 1 | 14 | 8 | 1 | 11 | ||||||
| nonsynonymous SNV | 1 | 2 | 5 | 2 | 1 | 1 | 4 | 1 | 1 | 11 | 7 | 1 | 6 | |||||||
| synonymous SNV | 1 | 4 | 1 | 2 | 2 | 1 | 1 | 3 | 1 | 5 |
| cf) Tissue ID; Tissue type (1; BLCA[Bladder Urothelial Carcinoma], 2; BRCA[Breast invasive carcinoma], 3; CESC[Cervical squamous cell carcinoma and endocervical adenocarcinoma], 4; COAD[Colon adenocarcinoma], 5; GBM[Glioblastoma multiforme], 6; Glioma Low Grade, 7; HNSC[Head and Neck squamous cell carcinoma], 8; KICH[Kidney Chromophobe], 9; KIRC[Kidney renal clear cell carcinoma], 10; KIRP[Kidney renal papillary cell carcinoma], 11; LAML[Acute Myeloid Leukemia], 12; LUAD[Lung adenocarcinoma], 13; LUSC[Lung squamous cell carcinoma], 14; OV[Ovarian serous cystadenocarcinoma ], 15; PAAD[Pancreatic adenocarcinoma], 16; PRAD[Prostate adenocarcinoma], 17; SKCM[Skin Cutaneous Melanoma], 18:STAD[Stomach adenocarcinoma], 19:THCA[Thyroid carcinoma], 20:UCEC[Uterine Corpus Endometrial Carcinoma]) |
| Top |
| * We represented just top 10 SNVs. When you move the cursor on each content, you can see more deailed mutation information on the Tooltip. Those are primary_site, primary_histology, mutation(aa), pubmedID. |
| Genomic Position | Mutation(aa) | Unique sampleID count |
| chr9:135947053 | p.A725P | 3 |
| chr9:135942011 | p.T516M | 2 |
| chr9:135947032 | p.F214F | 2 |
| chr9:135946427 | p.P718T | 2 |
| chr9:135940593 | p.G150G | 1 |
| chr9:135946607 | p.R237W | 1 |
| chr9:135942255 | p.R477Q | 1 |
| chr9:135947083 | p.E735K | 1 |
| chr9:135939927 | p.R156H | 1 |
| chr9:135945884 | p.S243S | 1 |
| * Copy number data were extracted from TCGA using R package TCGA-Assembler. The URLs of all public data files on TCGA DCC data server were gathered on Jan-05-2015. Function ProcessCNAData in TCGA-Assembler package was used to obtain gene-level copy number value which is calculated as the average copy number of the genomic region of a gene. |
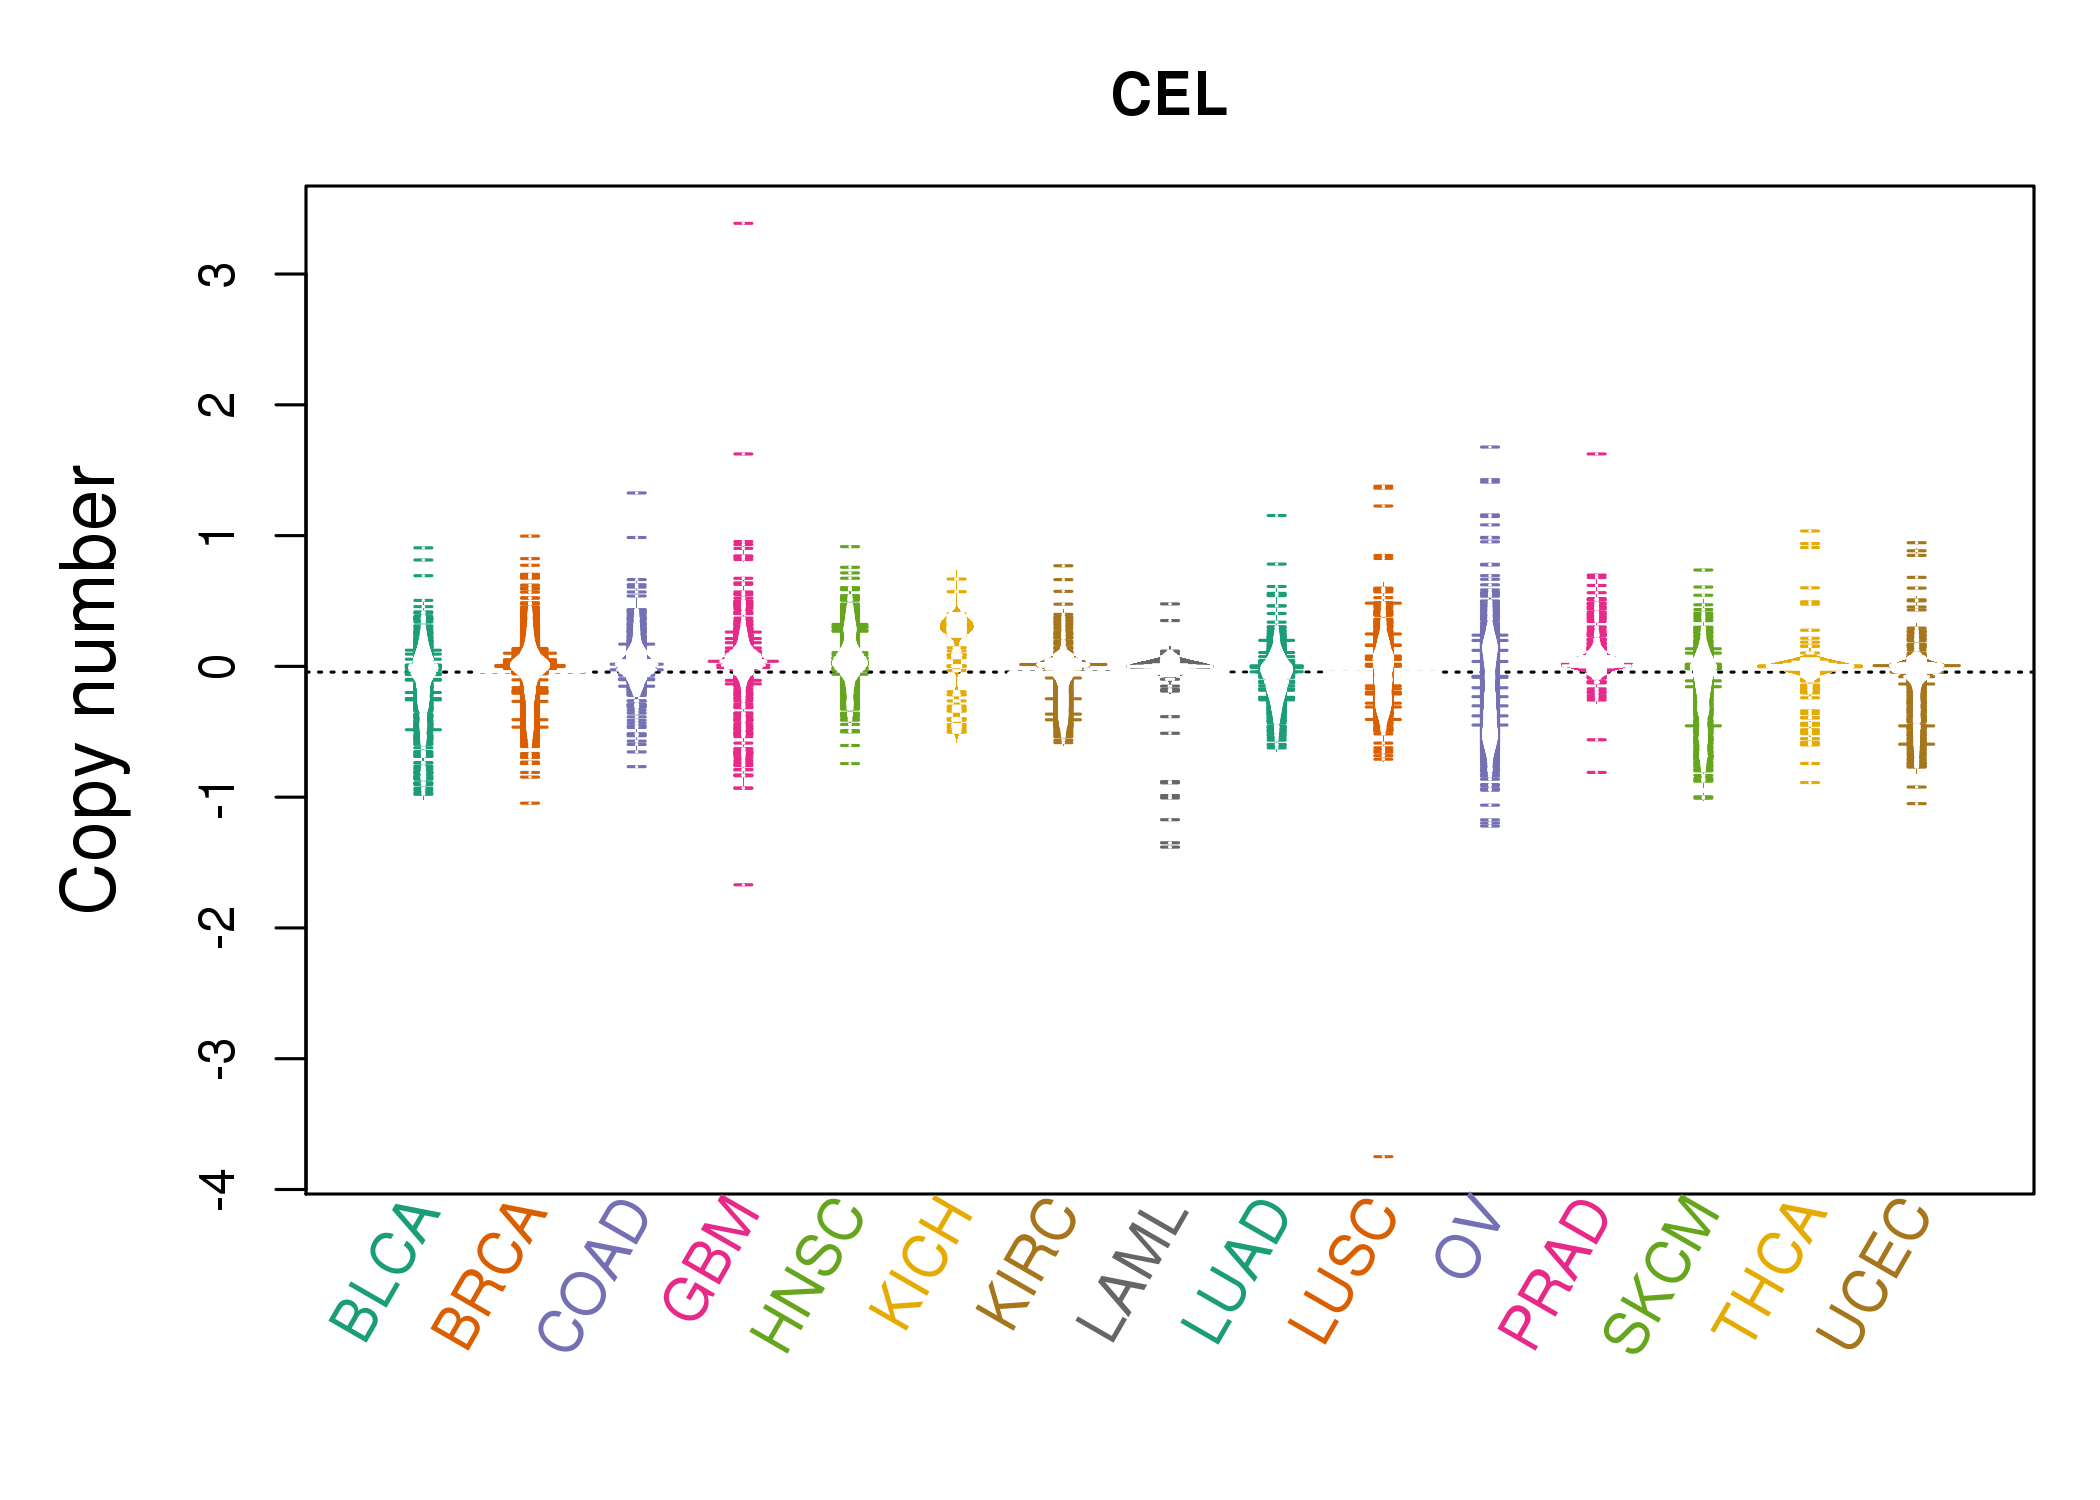 |
| cf) Tissue ID[Tissue type]: BLCA[Bladder Urothelial Carcinoma], BRCA[Breast invasive carcinoma], CESC[Cervical squamous cell carcinoma and endocervical adenocarcinoma], COAD[Colon adenocarcinoma], GBM[Glioblastoma multiforme], Glioma Low Grade, HNSC[Head and Neck squamous cell carcinoma], KICH[Kidney Chromophobe], KIRC[Kidney renal clear cell carcinoma], KIRP[Kidney renal papillary cell carcinoma], LAML[Acute Myeloid Leukemia], LUAD[Lung adenocarcinoma], LUSC[Lung squamous cell carcinoma], OV[Ovarian serous cystadenocarcinoma ], PAAD[Pancreatic adenocarcinoma], PRAD[Prostate adenocarcinoma], SKCM[Skin Cutaneous Melanoma], STAD[Stomach adenocarcinoma], THCA[Thyroid carcinoma], UCEC[Uterine Corpus Endometrial Carcinoma] |
| Top |
| Gene Expression for CEL |
| * CCLE gene expression data were extracted from CCLE_Expression_Entrez_2012-10-18.res: Gene-centric RMA-normalized mRNA expression data. |
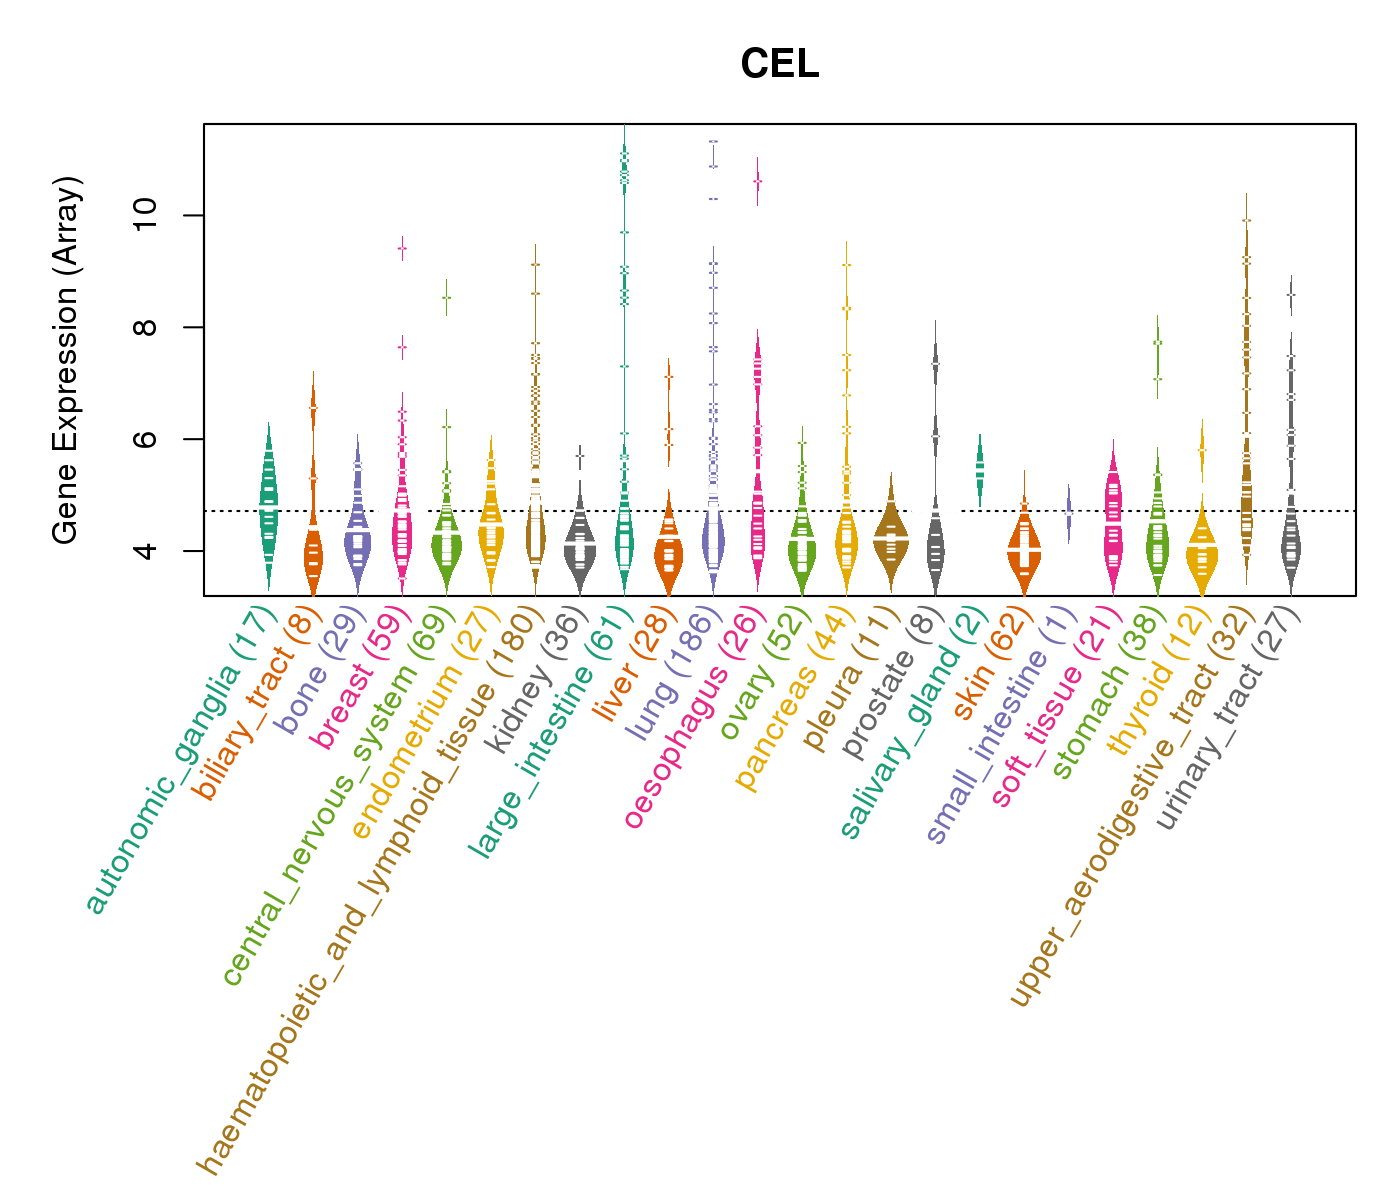 |
| * Normalized gene expression data of RNASeqV2 was extracted from TCGA using R package TCGA-Assembler. The URLs of all public data files on TCGA DCC data server were gathered at Jan-05-2015. Only eight cancer types have enough normal control samples for differential expression analysis. (t test, adjusted p<0.05 (using Benjamini-Hochberg FDR)) |
 |
| Top |
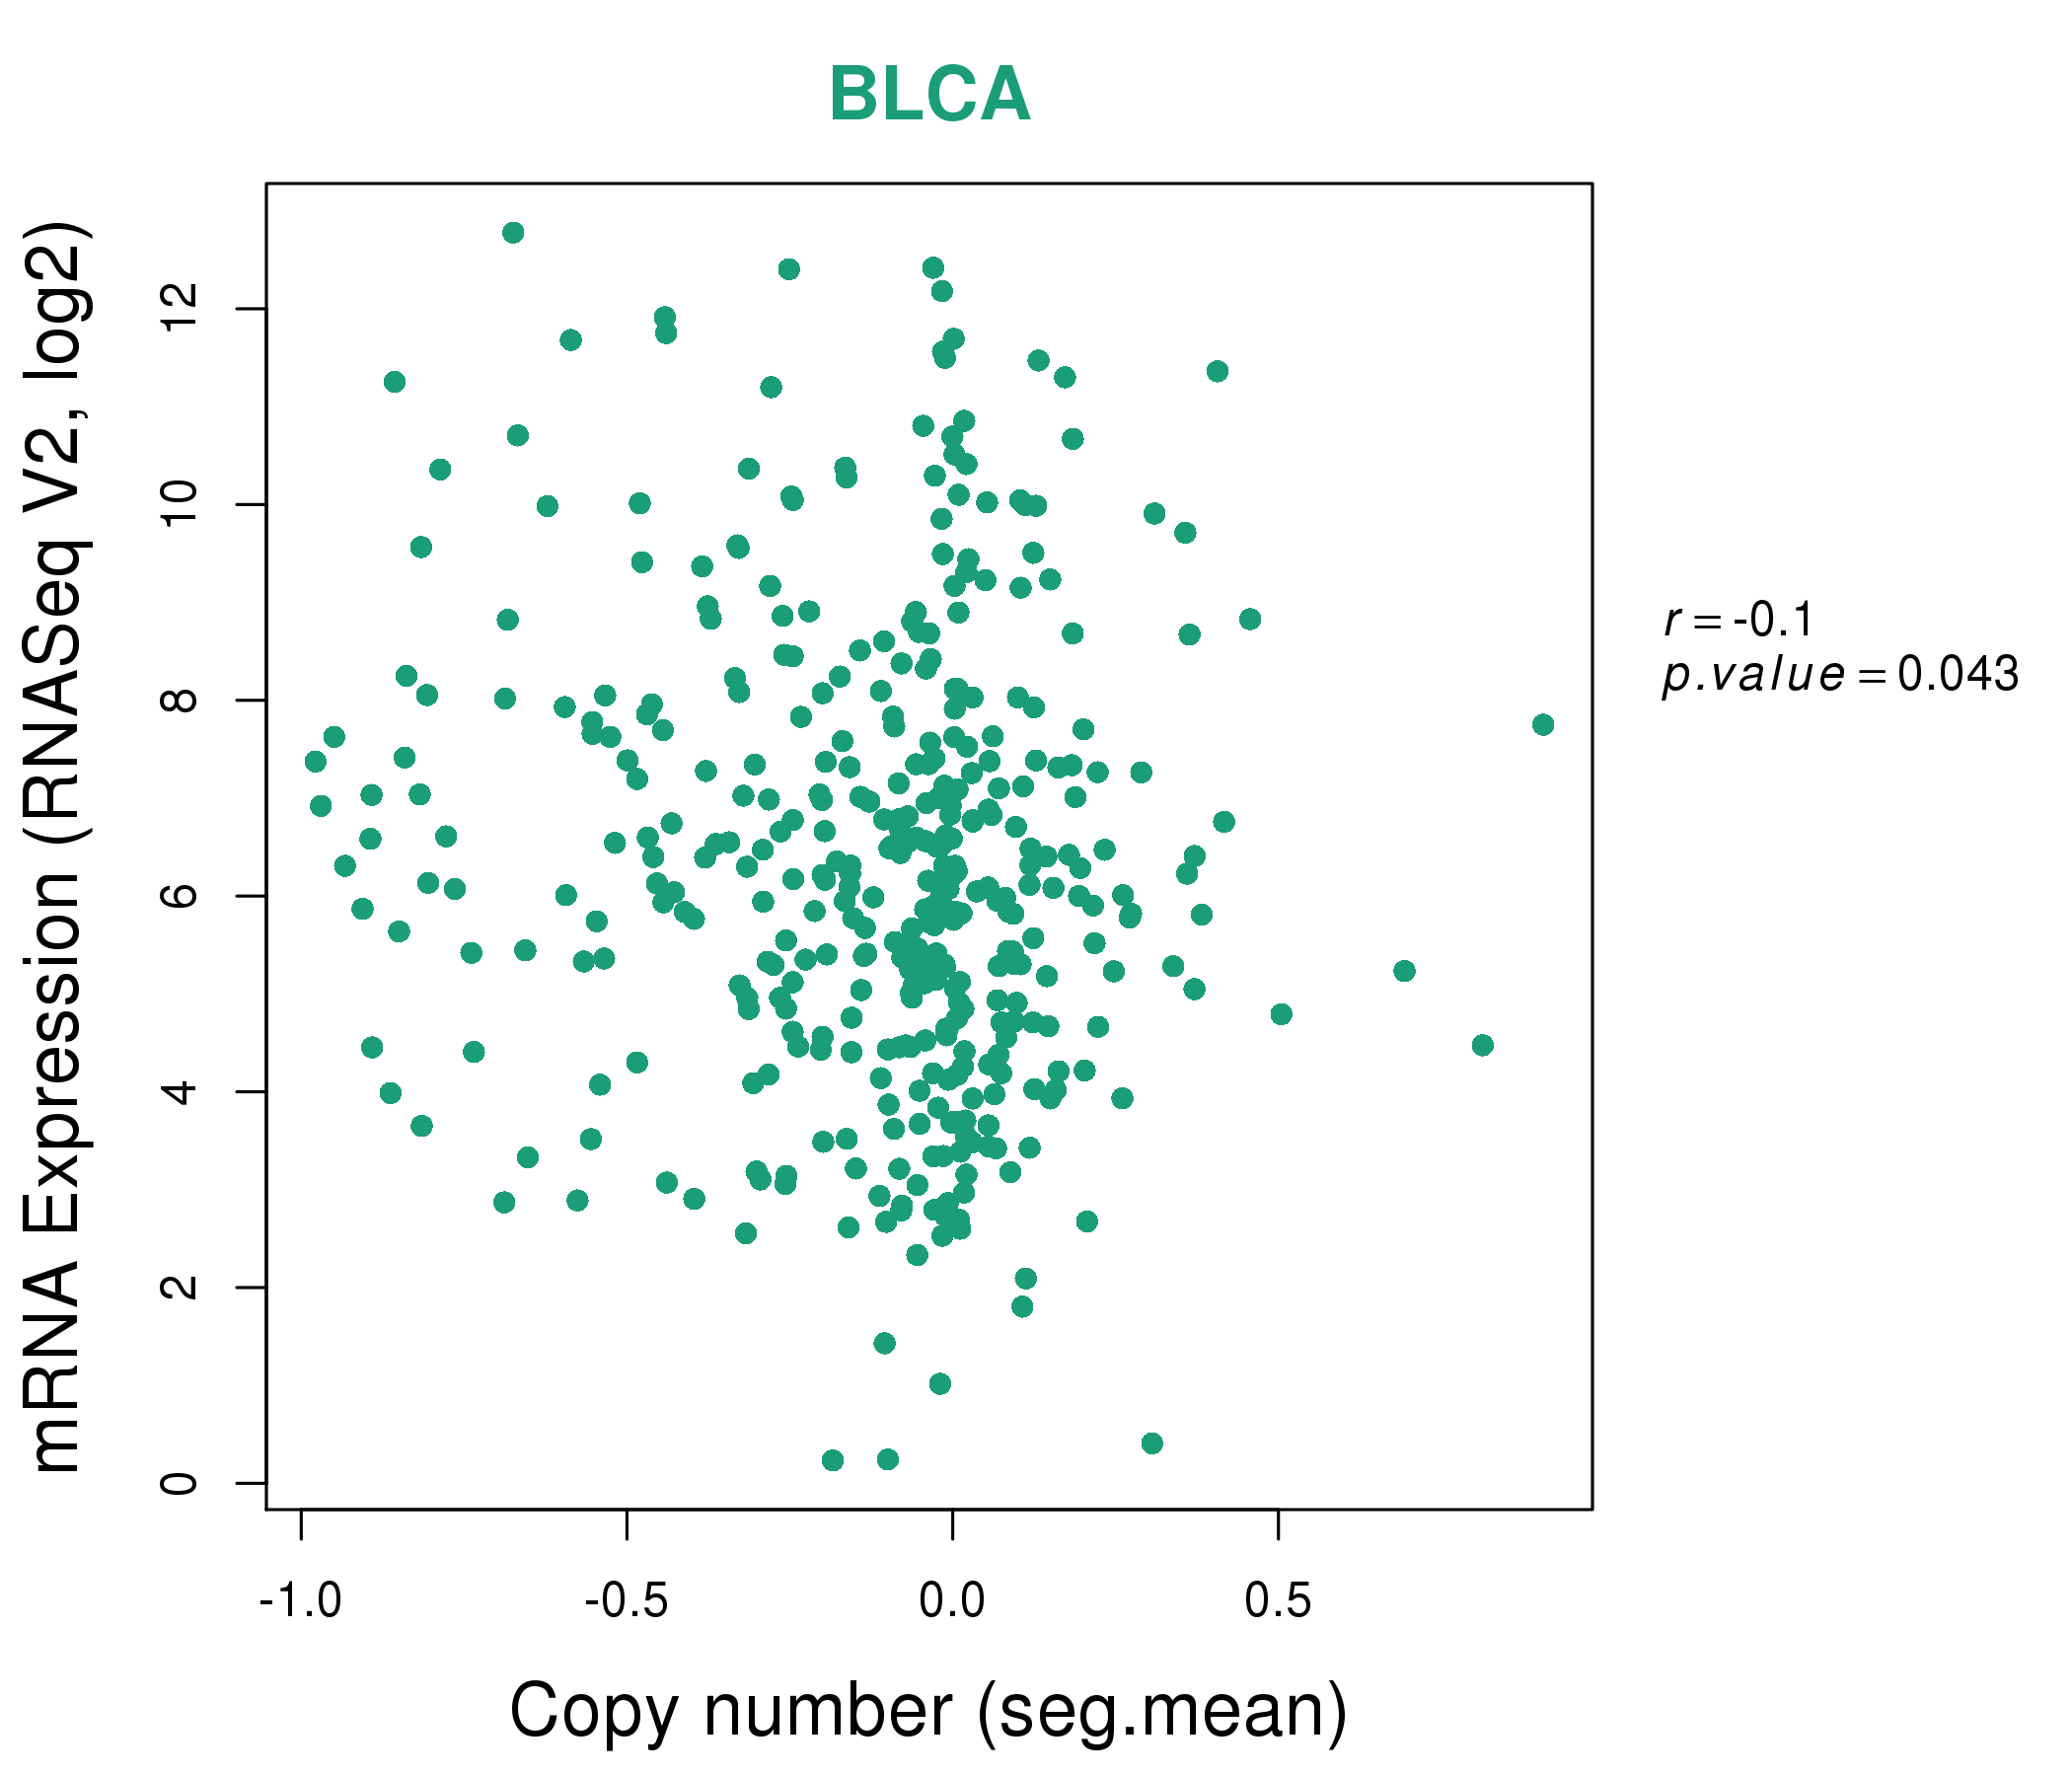
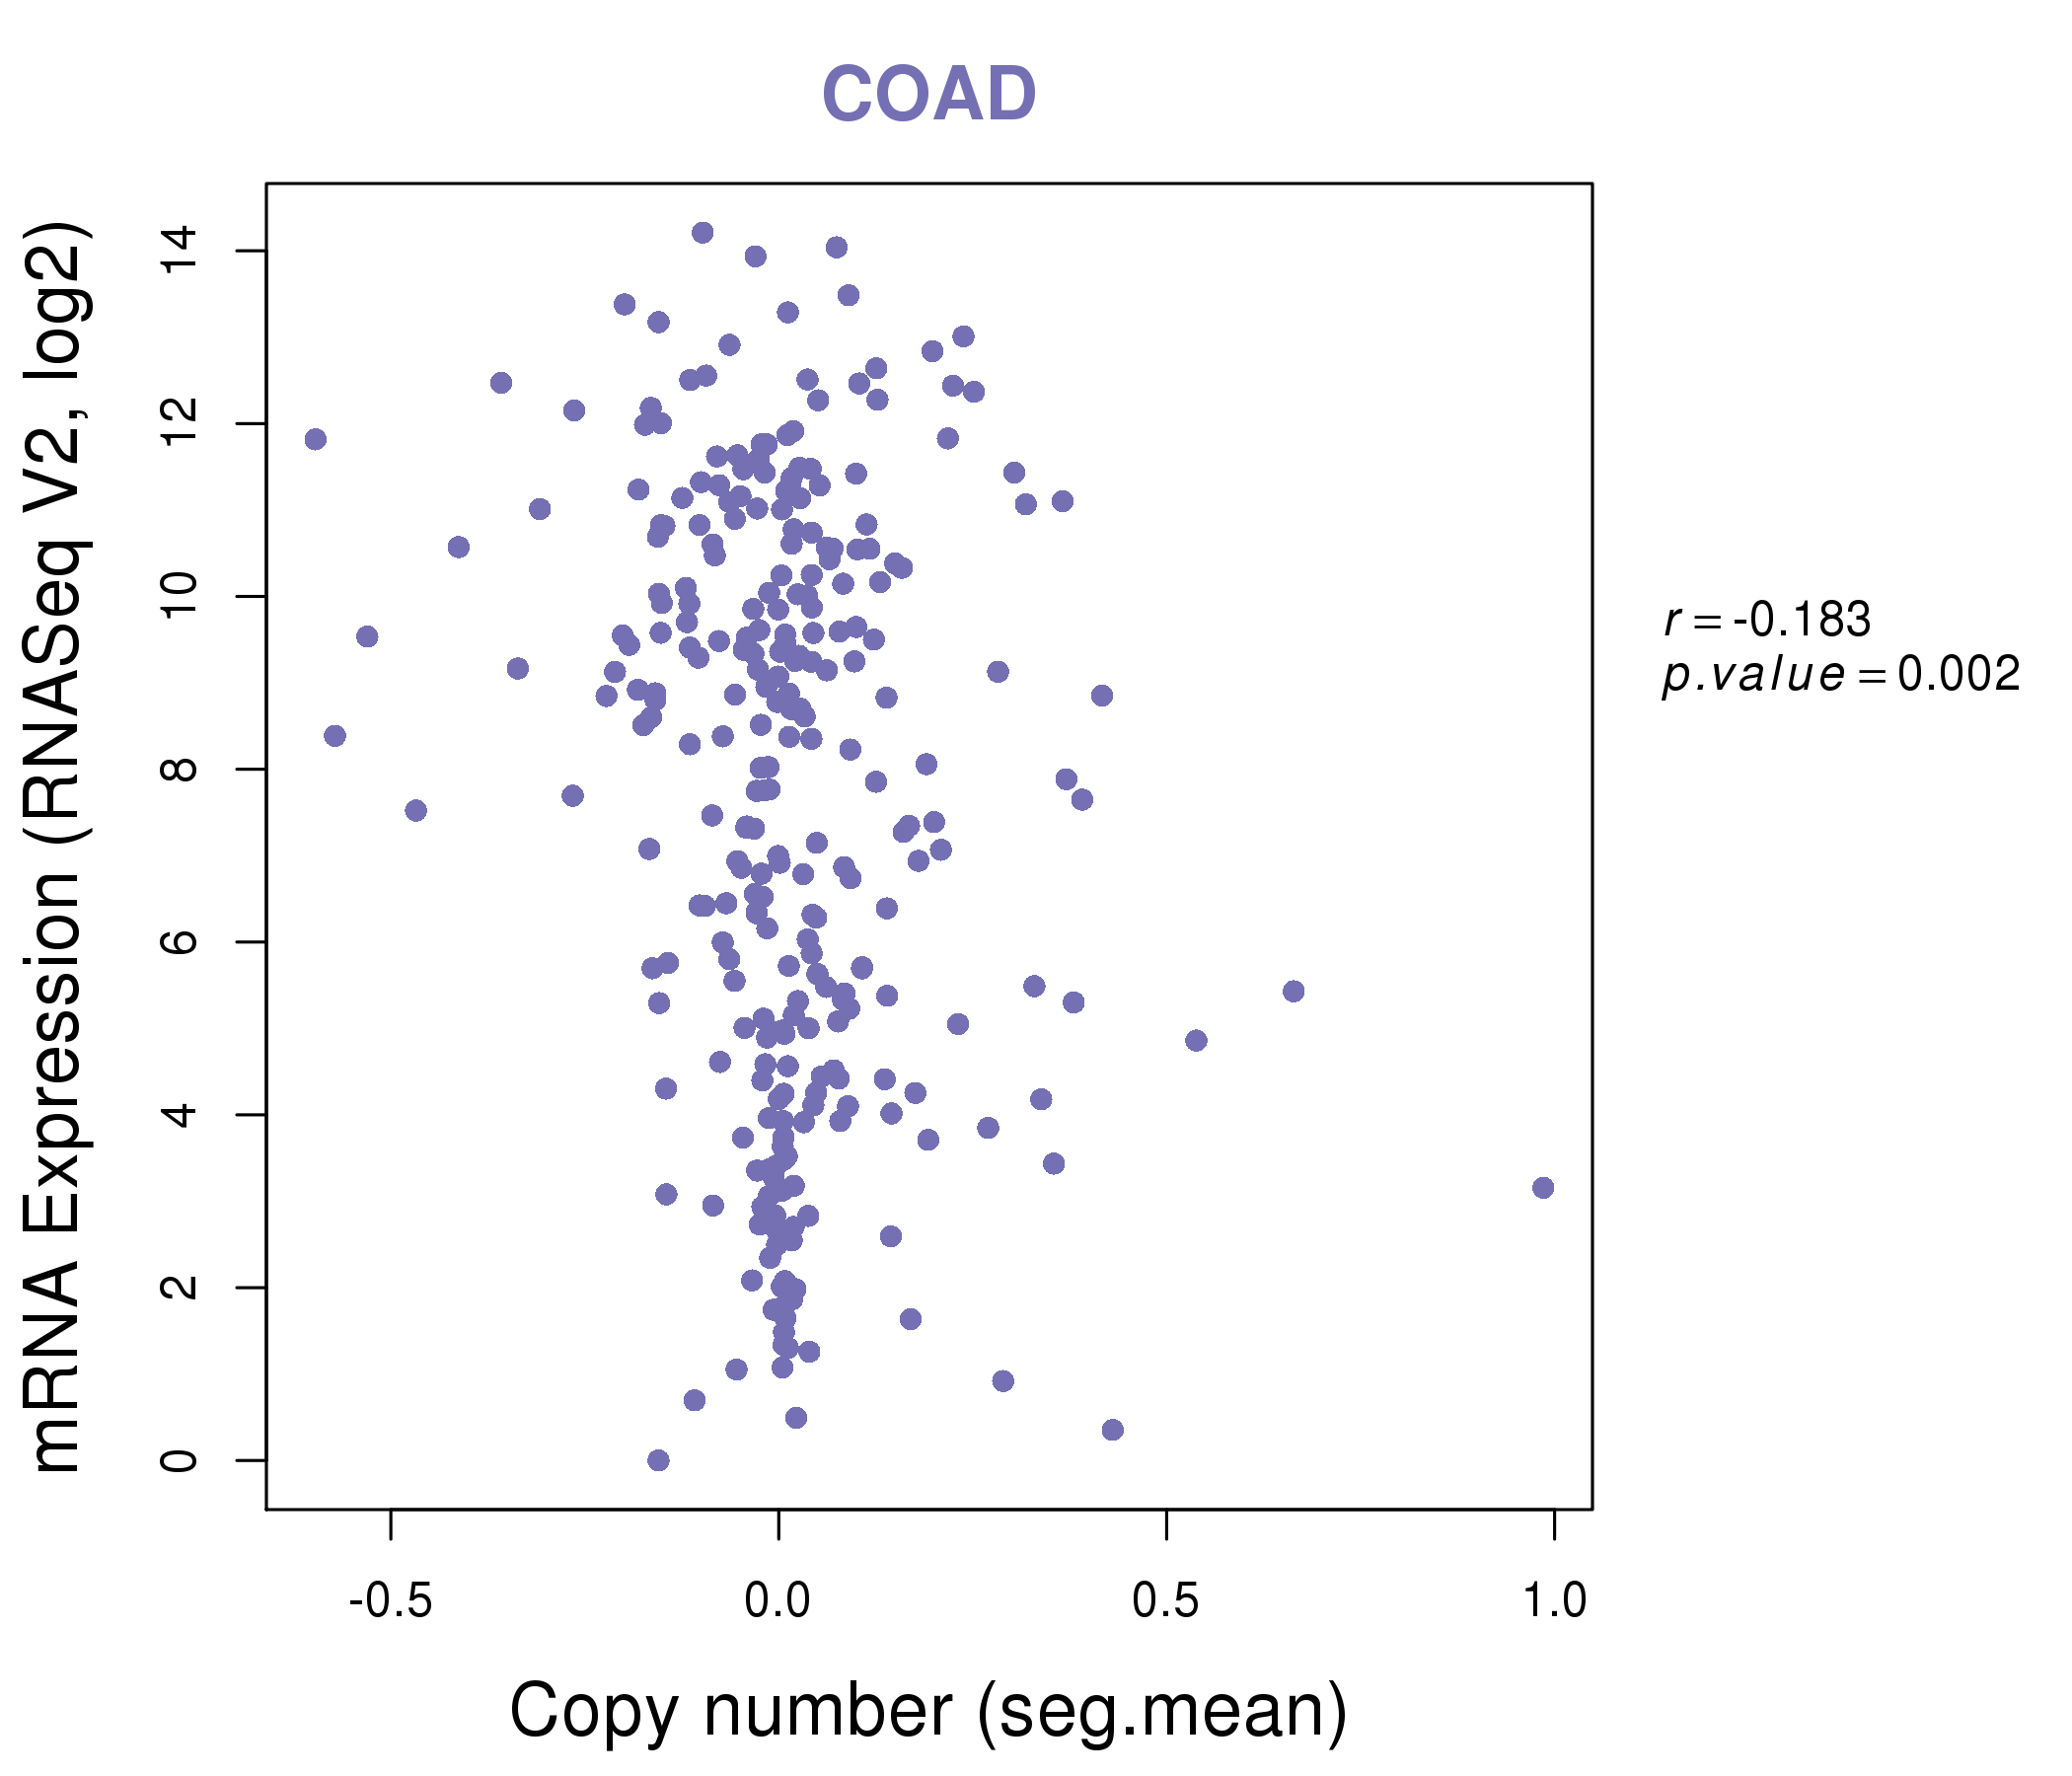
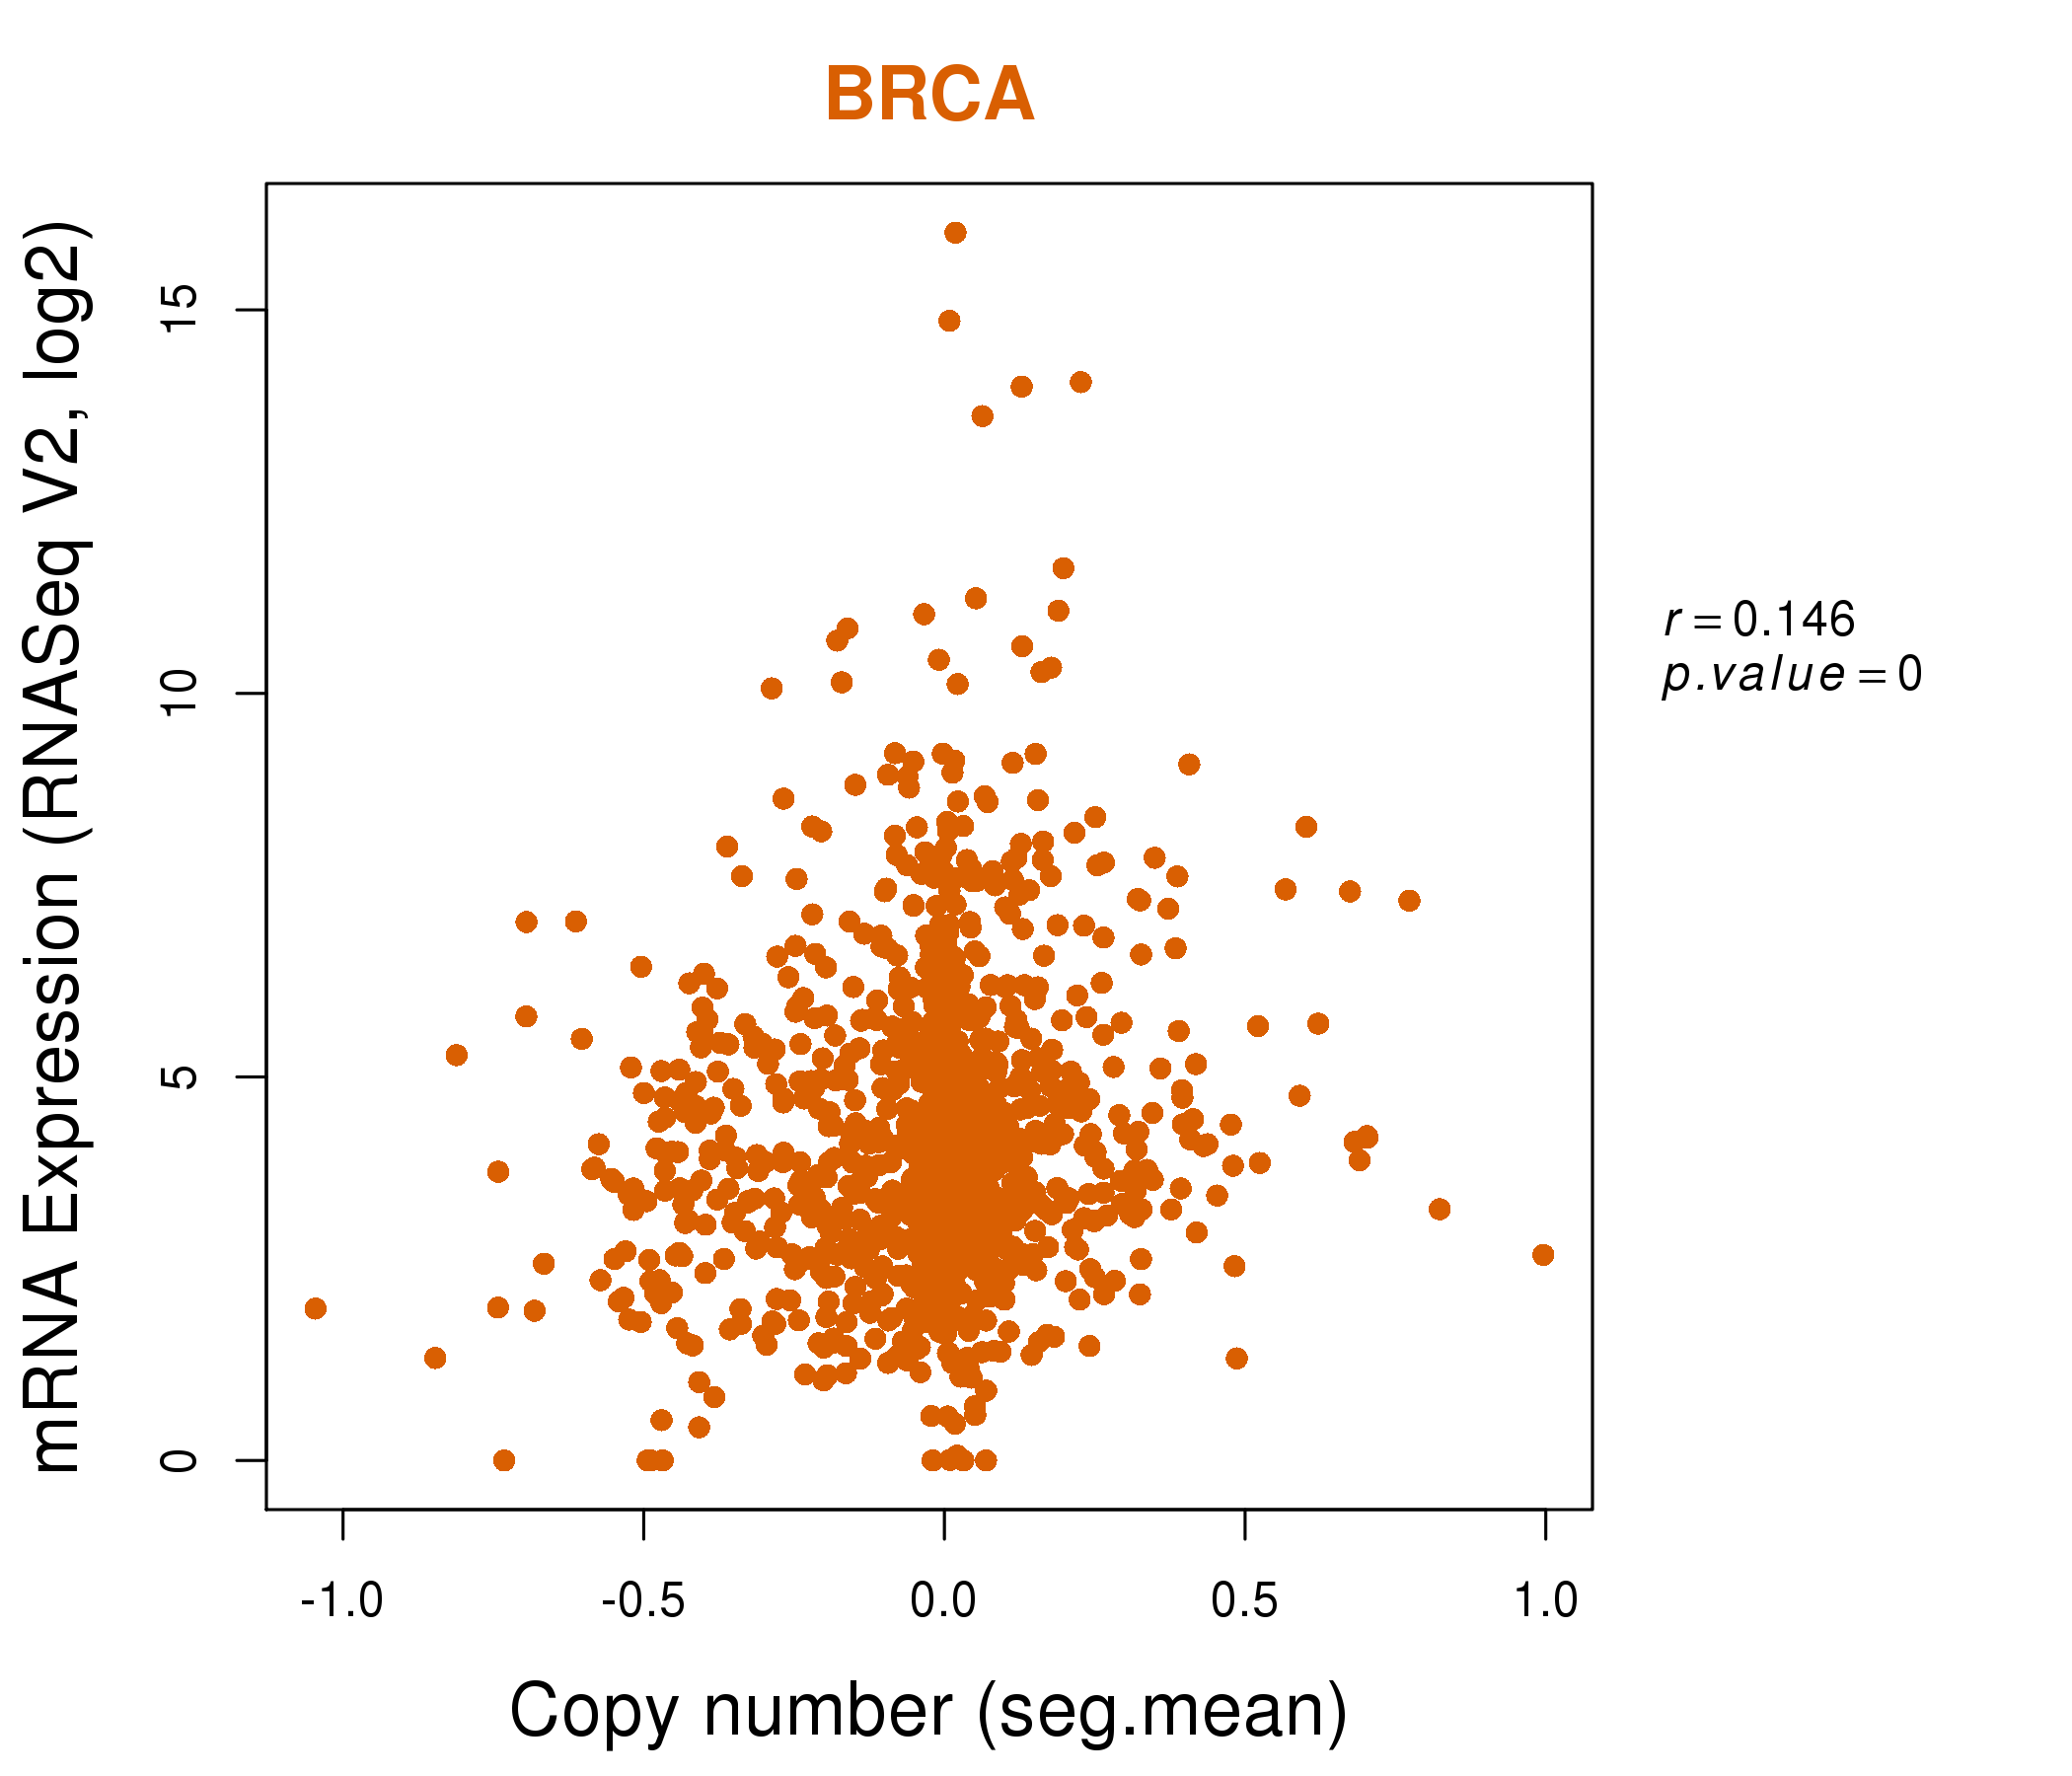
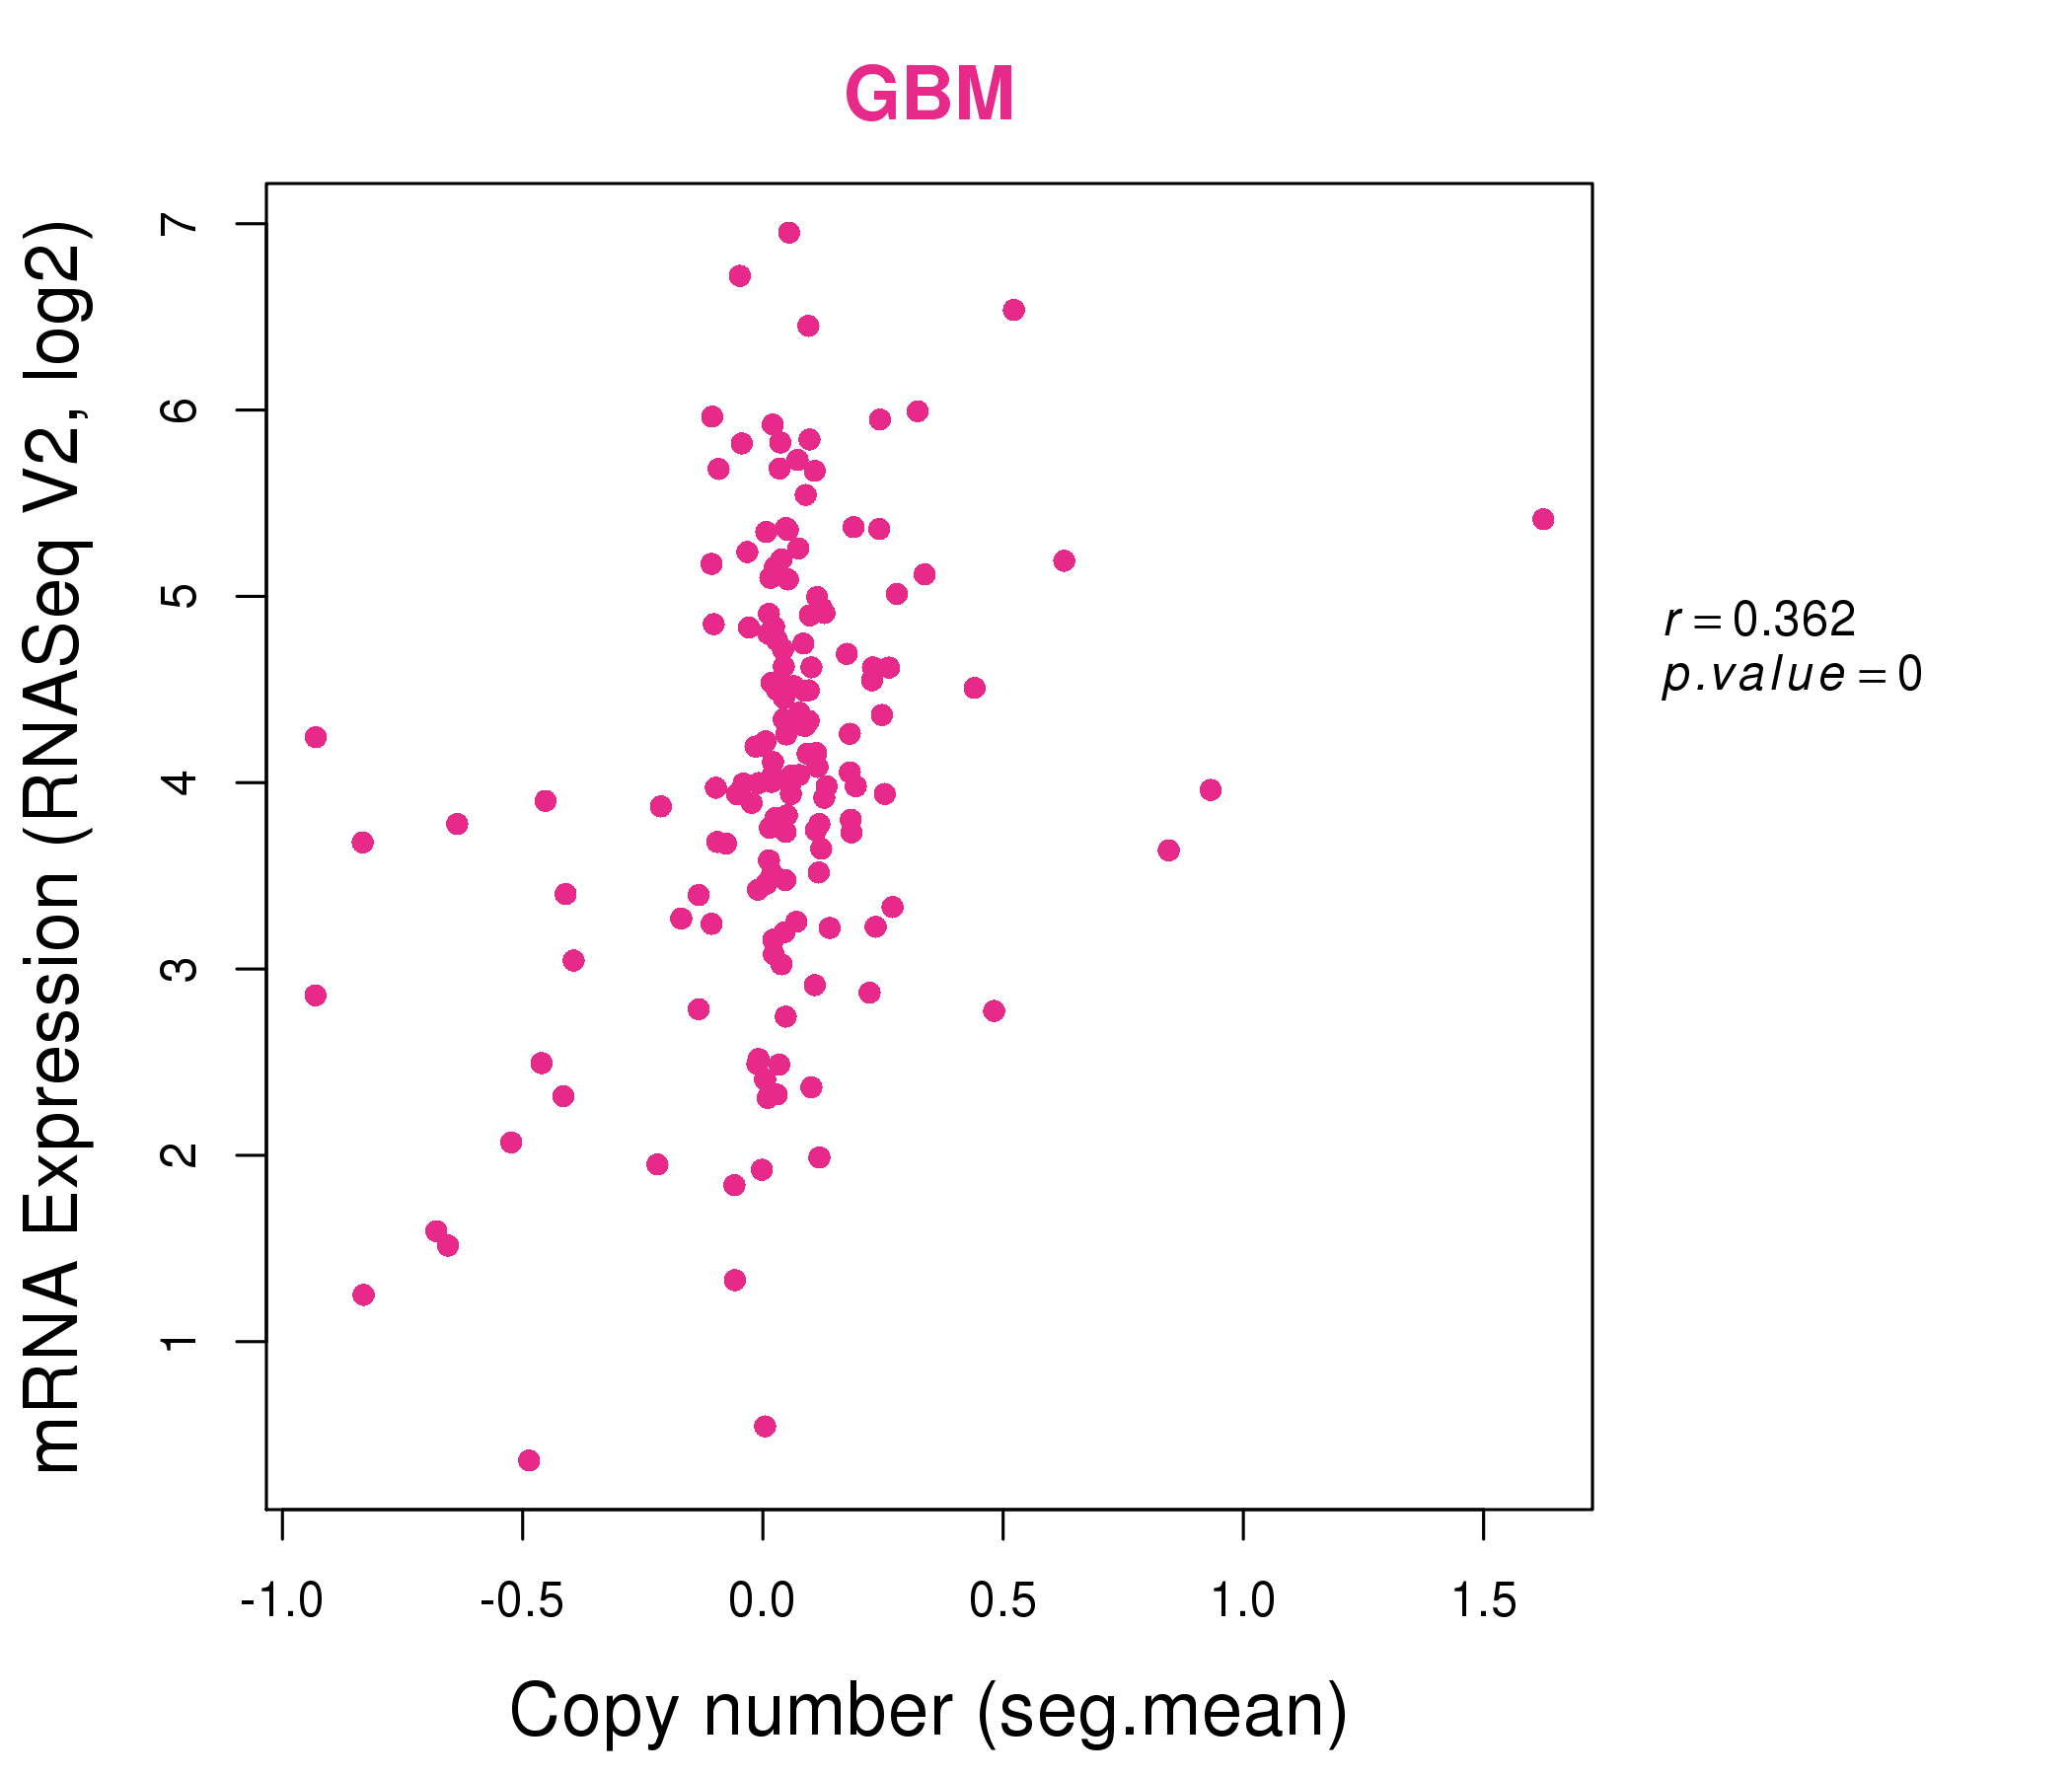
| * This plots show the correlation between CNV and gene expression. |
: Open all plots for all cancer types
 |
|
 |
|
| Top |
| Gene-Gene Network Information |
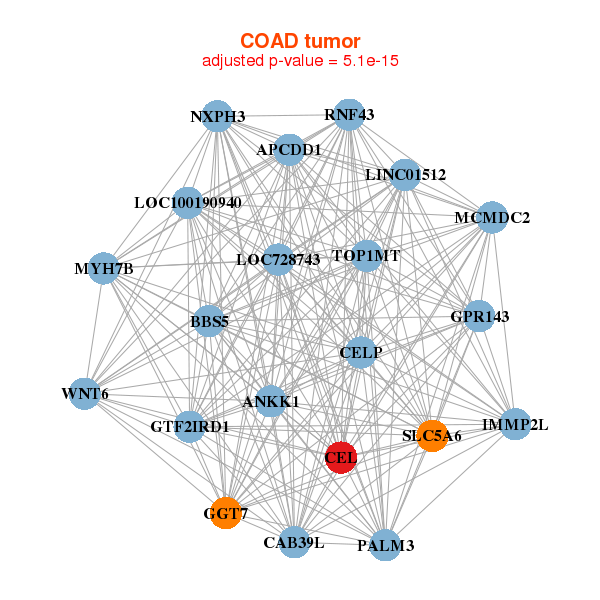
| * Co-Expression network figures were drawn using R package igraph. Only the top 20 genes with the highest correlations were shown. Red circle: input gene, orange circle: cell metabolism gene, sky circle: other gene |
: Open all plots for all cancer types
 |
|
| ALDH1L1,BTN1A1,C17orf77,CEL,CELP,CSN1S1,CSN1S2AP, CSN2,CSRNP3,CXCL2,FAM196B,TMEM236,GREM2,KCTD16, LALBA,MRC1,NPFFR2,OLAH,OR5E1P,SGCZ,SLC9A4 | ASIC5,BTN1A1,CEL,CELP,CHRDL2,CSN1S1,CSN1S2AP, CSN2,CSN3,GC,GPRC6A,KRTAP5-10,LALBA,OLAH, OR52A5,SLC17A2,SLC9A4,SLCO4C1,STATH,TMEM171,XDH |
 |
|
| ANKK1,APCDD1,BBS5,MCMDC2,CAB39L,CEL,CELP, GGT7,GPR143,GTF2IRD1,IMMP2L,LINC01512,LOC100190940,LOC728743, MYH7B,NXPH3,PALM3,RNF43,SLC5A6,TOP1MT,WNT6 | ALB,AMBP,APOA2,C3P1,C8B,CEL,CELP, CFHR2,DNAJB8,F9,FGG,HAO1,HRG,KIR3DP1, KRTAP4-11,KRTAP5-3,LECT2,LOC100129935,LINC00160,OR1N1,PLG |

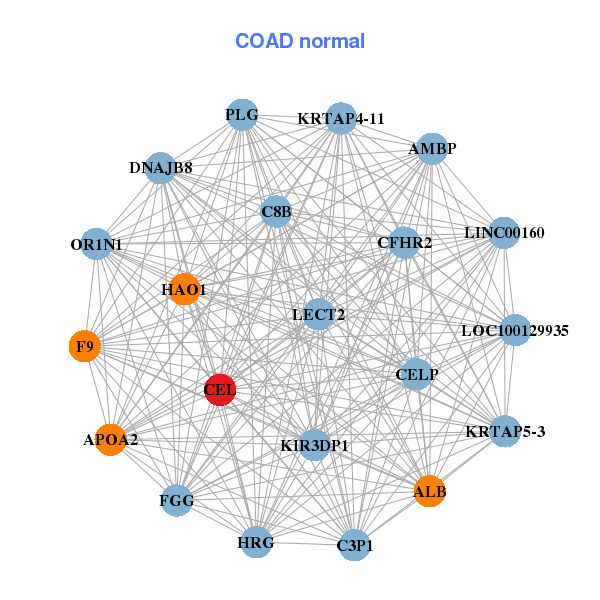
| * Co-Expression network figures were drawn using R package igraph. Only the top 20 genes with the highest correlations were shown. Red circle: input gene, orange circle: cell metabolism gene, sky circle: other gene |
: Open all plots for all cancer types
| Top |
: Open all interacting genes' information including KEGG pathway for all interacting genes from DAVID
| Top |
| Pharmacological Information for CEL |
| There's no related Drug. |
| Top |
| Cross referenced IDs for CEL |
| * We obtained these cross-references from Uniprot database. It covers 150 different DBs, 18 categories. http://www.uniprot.org/help/cross_references_section |
: Open all cross reference information
|
Copyright © 2016-Present - The Univsersity of Texas Health Science Center at Houston @ |