|
|||||||||||||||||||||||||||||||||||||||||||||||||||||||||||||||||||||||||||||||||||||||||||||||||||||||||||||||||||||||||||||||||||||||||||||||||||||||||||||||||||||||||||||||||||||||||||||||||||||||||||||||||||||||||||||||||||||||||||||||||||||||||||||||||||||||||||||||||||||||||||||||||||||||||||||||||||||||||||||||||||||||||||||
| |
| Phenotypic Information (metabolism pathway, cancer, disease, phenome) |
| |
| |
| Gene-Gene Network Information: Co-Expression Network, Interacting Genes & KEGG |
| |
|


| Gene Summary for SLC19A2 |
| Basic gene info. | Gene symbol | SLC19A2 |
| Gene name | solute carrier family 19 (thiamine transporter), member 2 | |
| Synonyms | TC1|THMD1|THT1|THTR1|TRMA | |
| Cytomap | UCSC genome browser: 1q23.3 | |
| Genomic location | chr1 :169433148-169455208 | |
| Type of gene | protein-coding | |
| RefGenes | NM_006996.2, | |
| Ensembl id | ENSG00000117479 | |
| Description | high affinity thiamine transporterreduced folate carrier protein (RFC) likesolute carrier family 19 member 2thTr-1thiamine transporter 1 | |
| Modification date | 20141222 | |
| dbXrefs | MIM : 603941 | |
| HGNC : HGNC | ||
| Ensembl : ENSG00000117479 | ||
| HPRD : 04897 | ||
| Vega : OTTHUMG00000035452 | ||
| Protein | UniProt: go to UniProt's Cross Reference DB Table | |
| Expression | CleanEX: HS_SLC19A2 | |
| BioGPS: 10560 | ||
| Gene Expression Atlas: ENSG00000117479 | ||
| The Human Protein Atlas: ENSG00000117479 | ||
| Pathway | NCI Pathway Interaction Database: SLC19A2 | |
| KEGG: SLC19A2 | ||
| REACTOME: SLC19A2 | ||
| ConsensusPathDB | ||
| Pathway Commons: SLC19A2 | ||
| Metabolism | MetaCyc: SLC19A2 | |
| HUMANCyc: SLC19A2 | ||
| Regulation | Ensembl's Regulation: ENSG00000117479 | |
| miRBase: chr1 :169,433,148-169,455,208 | ||
| TargetScan: NM_006996 | ||
| cisRED: ENSG00000117479 | ||
| Context | iHOP: SLC19A2 | |
| cancer metabolism search in PubMed: SLC19A2 | ||
| UCL Cancer Institute: SLC19A2 | ||
| Assigned class in ccmGDB | C | |
| Top |
| Phenotypic Information for SLC19A2(metabolism pathway, cancer, disease, phenome) |
| Cancer | CGAP: SLC19A2 |
| Familial Cancer Database: SLC19A2 | |
| * This gene is included in those cancer gene databases. |
|
|
|
|
|
|
| |||||||||||||||||||||||||||||||||||||||||||||||||||||||||||||||||||||||||||||||||||||||||||||||||||||||||||||||||||||||||||||||||||||||||||||||||||||||||||||||||||||||||||||||||||||||||||||||||||||||||||||||||||||||||||||||||||||||||||||||||||||||||||||||||||||||||||||||||||||||||||||||||||||||||||||||||||||||||||||||||||||||
Oncogene 1 | Significant driver gene in | ||||||||||||||||||||||||||||||||||||||||||||||||||||||||||||||||||||||||||||||||||||||||||||||||||||||||||||||||||||||||||||||||||||||||||||||||||||||||||||||||||||||||||||||||||||||||||||||||||||||||||||||||||||||||||||||||||||||||||||||||||||||||||||||||||||||||||||||||||||||||||||||||||||||||||||||||||||||||||||||||||||||||||||
| cf) number; DB name 1 Oncogene; http://nar.oxfordjournals.org/content/35/suppl_1/D721.long, 2 Tumor Suppressor gene; https://bioinfo.uth.edu/TSGene/, 3 Cancer Gene Census; http://www.nature.com/nrc/journal/v4/n3/abs/nrc1299.html, 4 CancerGenes; http://nar.oxfordjournals.org/content/35/suppl_1/D721.long, 5 Network of Cancer Gene; http://ncg.kcl.ac.uk/index.php, 1Therapeutic Vulnerabilities in Cancer; http://cbio.mskcc.org/cancergenomics/statius/ |
| REACTOME_METABOLISM_OF_VITAMINS_AND_COFACTORS | |
| Mutations for SLC19A2 |
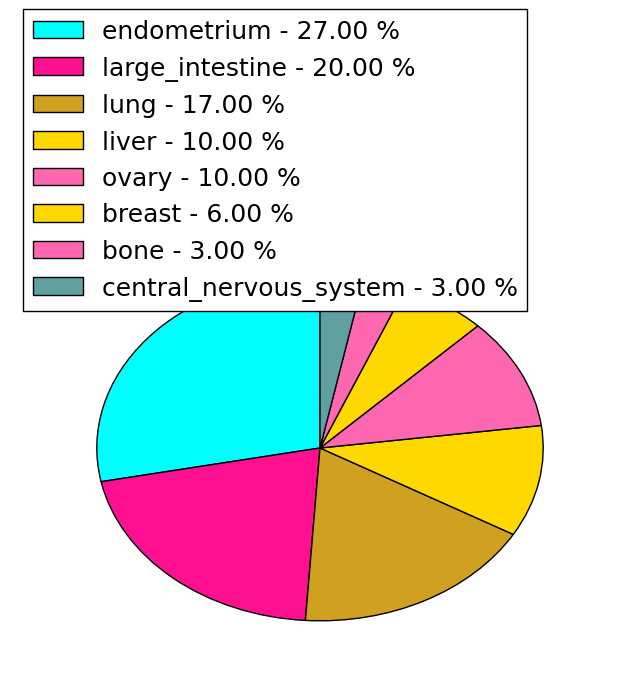
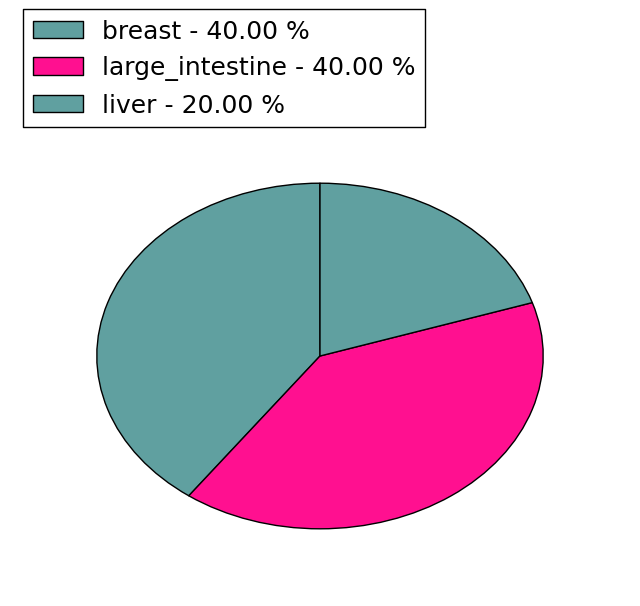
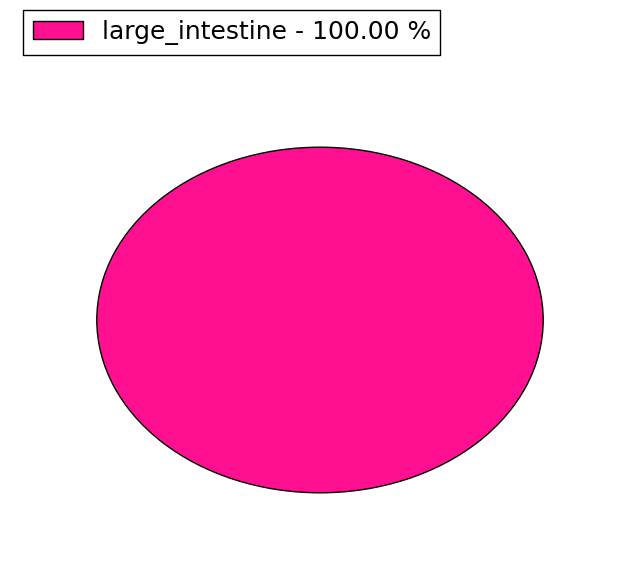
| * Under tables are showing count per each tissue to give us broad intuition about tissue specific mutation patterns.You can go to the detailed page for each mutation database's web site. |
| There's no structural variation information in COSMIC data for this gene. |
| * From mRNA Sanger sequences, Chitars2.0 arranged chimeric transcripts. This table shows SLC19A2 related fusion information. |
| ID | Head Gene | Tail Gene | Accession | Gene_a | qStart_a | qEnd_a | Chromosome_a | tStart_a | tEnd_a | Gene_a | qStart_a | qEnd_a | Chromosome_a | tStart_a | tEnd_a |
| H59323 | SLC19A2 | 1 | 43 | 1 | 169441478 | 169441520 | THAP7-AS1 | 37 | 456 | 22 | 21356834 | 21357245 | |
| BE177610 | SLC19A2 | 2 | 352 | 1 | 169434289 | 169434644 | EIF2S3 | 347 | 525 | X | 24086202 | 24089828 | |
| Top |
| Mutation type/ Tissue ID | brca | cns | cerv | endome | haematopo | kidn | Lintest | liver | lung | ns | ovary | pancre | prost | skin | stoma | thyro | urina | |||
| Total # sample | 1 | 1 | ||||||||||||||||||
| GAIN (# sample) | 1 | 1 | ||||||||||||||||||
| LOSS (# sample) |
| cf) Tissue ID; Tissue type (1; Breast, 2; Central_nervous_system, 3; Cervix, 4; Endometrium, 5; Haematopoietic_and_lymphoid_tissue, 6; Kidney, 7; Large_intestine, 8; Liver, 9; Lung, 10; NS, 11; Ovary, 12; Pancreas, 13; Prostate, 14; Skin, 15; Stomach, 16; Thyroid, 17; Urinary_tract) |
| Top |
|
 |
| Top |
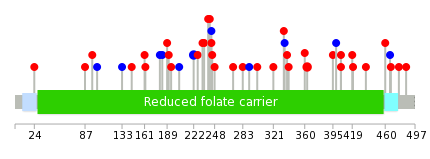
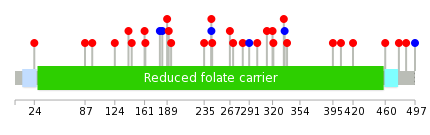
| Stat. for Non-Synonymous SNVs (# total SNVs=29) | (# total SNVs=5) |
 |  |
(# total SNVs=2) | (# total SNVs=0) |
 |
| Top |
| * When you move the cursor on each content, you can see more deailed mutation information on the Tooltip. Those are primary_site,primary_histology,mutation(aa),pubmedID. |
| GRCh37 position | Mutation(aa) | Unique sampleID count |
| chr1:169446534-169446534 | p.S222S | 2 |
| chr1:169438017-169438017 | p.E363G | 2 |
| chr1:169446809-169446809 | p.Y131fs*45 | 2 |
| chr1:169446468-169446468 | p.S244S | 1 |
| chr1:169446634-169446634 | p.S189N | 1 |
| chr1:169437363-169437363 | p.E451* | 1 |
| chr1:169439219-169439219 | p.A338V | 1 |
| chr1:169446894-169446894 | p.L102L | 1 |
| chr1:169446469-169446469 | p.S244Y | 1 |
| chr1:169446645-169446645 | p.W185* | 1 |
| Top |
|
 |
| Point Mutation/ Tissue ID | 1 | 2 | 3 | 4 | 5 | 6 | 7 | 8 | 9 | 10 | 11 | 12 | 13 | 14 | 15 | 16 | 17 | 18 | 19 | 20 |
| # sample | 1 | 1 | 5 | 3 | 1 | 2 | 2 | 7 | 5 | 5 | ||||||||||
| # mutation | 1 | 1 | 5 | 3 | 1 | 2 | 2 | 8 | 5 | 6 | ||||||||||
| nonsynonymous SNV | 1 | 1 | 3 | 3 | 1 | 2 | 2 | 4 | 5 | 6 | ||||||||||
| synonymous SNV | 2 | 4 |
| cf) Tissue ID; Tissue type (1; BLCA[Bladder Urothelial Carcinoma], 2; BRCA[Breast invasive carcinoma], 3; CESC[Cervical squamous cell carcinoma and endocervical adenocarcinoma], 4; COAD[Colon adenocarcinoma], 5; GBM[Glioblastoma multiforme], 6; Glioma Low Grade, 7; HNSC[Head and Neck squamous cell carcinoma], 8; KICH[Kidney Chromophobe], 9; KIRC[Kidney renal clear cell carcinoma], 10; KIRP[Kidney renal papillary cell carcinoma], 11; LAML[Acute Myeloid Leukemia], 12; LUAD[Lung adenocarcinoma], 13; LUSC[Lung squamous cell carcinoma], 14; OV[Ovarian serous cystadenocarcinoma ], 15; PAAD[Pancreatic adenocarcinoma], 16; PRAD[Prostate adenocarcinoma], 17; SKCM[Skin Cutaneous Melanoma], 18:STAD[Stomach adenocarcinoma], 19:THCA[Thyroid carcinoma], 20:UCEC[Uterine Corpus Endometrial Carcinoma]) |
| Top |
| * We represented just top 10 SNVs. When you move the cursor on each content, you can see more deailed mutation information on the Tooltip. Those are primary_site, primary_histology, mutation(aa), pubmedID. |
| Genomic Position | Mutation(aa) | Unique sampleID count |
| chr1:169446660 | p.N191S | 1 |
| chr1:169437891 | p.A338V | 1 |
| chr1:169439421 | p.S189I | 1 |
| chr1:169446715 | p.G335G | 1 |
| chr1:169437922 | p.G334V | 1 |
| chr1:169446399 | p.A183A | 1 |
| chr1:169446719 | p.E321D | 1 |
| chr1:169439219 | p.V180V | 1 |
| chr1:169446466 | p.W320R | 1 |
| chr1:169446766 | p.R162Q | 1 |
| * Copy number data were extracted from TCGA using R package TCGA-Assembler. The URLs of all public data files on TCGA DCC data server were gathered on Jan-05-2015. Function ProcessCNAData in TCGA-Assembler package was used to obtain gene-level copy number value which is calculated as the average copy number of the genomic region of a gene. |
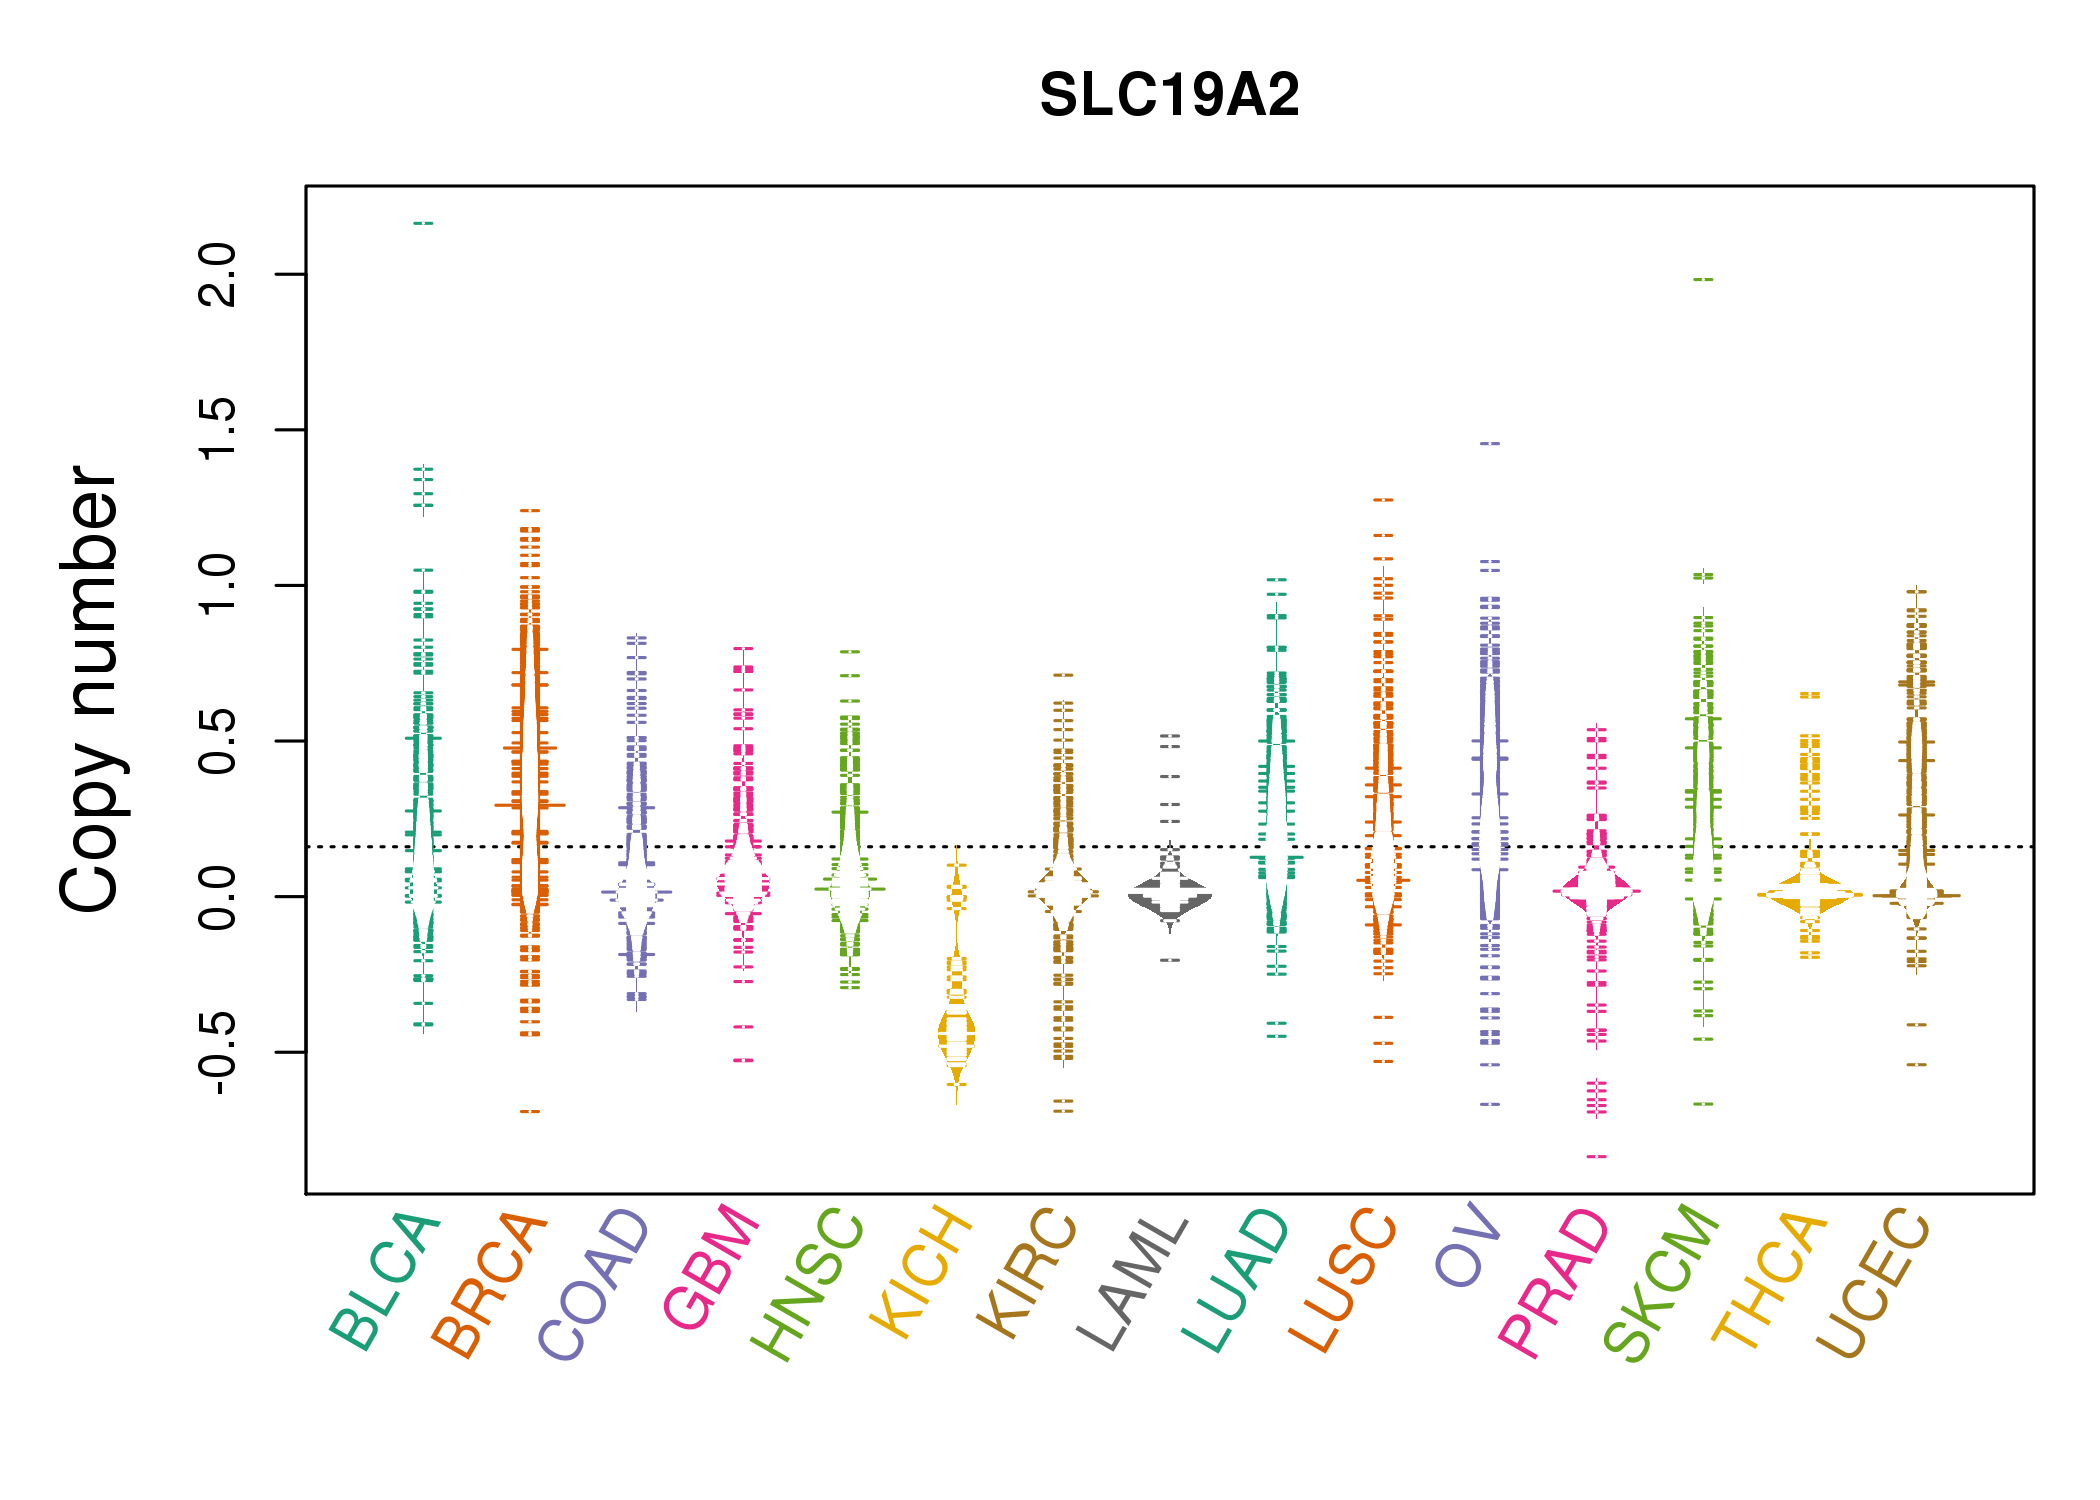 |
| cf) Tissue ID[Tissue type]: BLCA[Bladder Urothelial Carcinoma], BRCA[Breast invasive carcinoma], CESC[Cervical squamous cell carcinoma and endocervical adenocarcinoma], COAD[Colon adenocarcinoma], GBM[Glioblastoma multiforme], Glioma Low Grade, HNSC[Head and Neck squamous cell carcinoma], KICH[Kidney Chromophobe], KIRC[Kidney renal clear cell carcinoma], KIRP[Kidney renal papillary cell carcinoma], LAML[Acute Myeloid Leukemia], LUAD[Lung adenocarcinoma], LUSC[Lung squamous cell carcinoma], OV[Ovarian serous cystadenocarcinoma ], PAAD[Pancreatic adenocarcinoma], PRAD[Prostate adenocarcinoma], SKCM[Skin Cutaneous Melanoma], STAD[Stomach adenocarcinoma], THCA[Thyroid carcinoma], UCEC[Uterine Corpus Endometrial Carcinoma] |
| Top |
| Gene Expression for SLC19A2 |
| * CCLE gene expression data were extracted from CCLE_Expression_Entrez_2012-10-18.res: Gene-centric RMA-normalized mRNA expression data. |
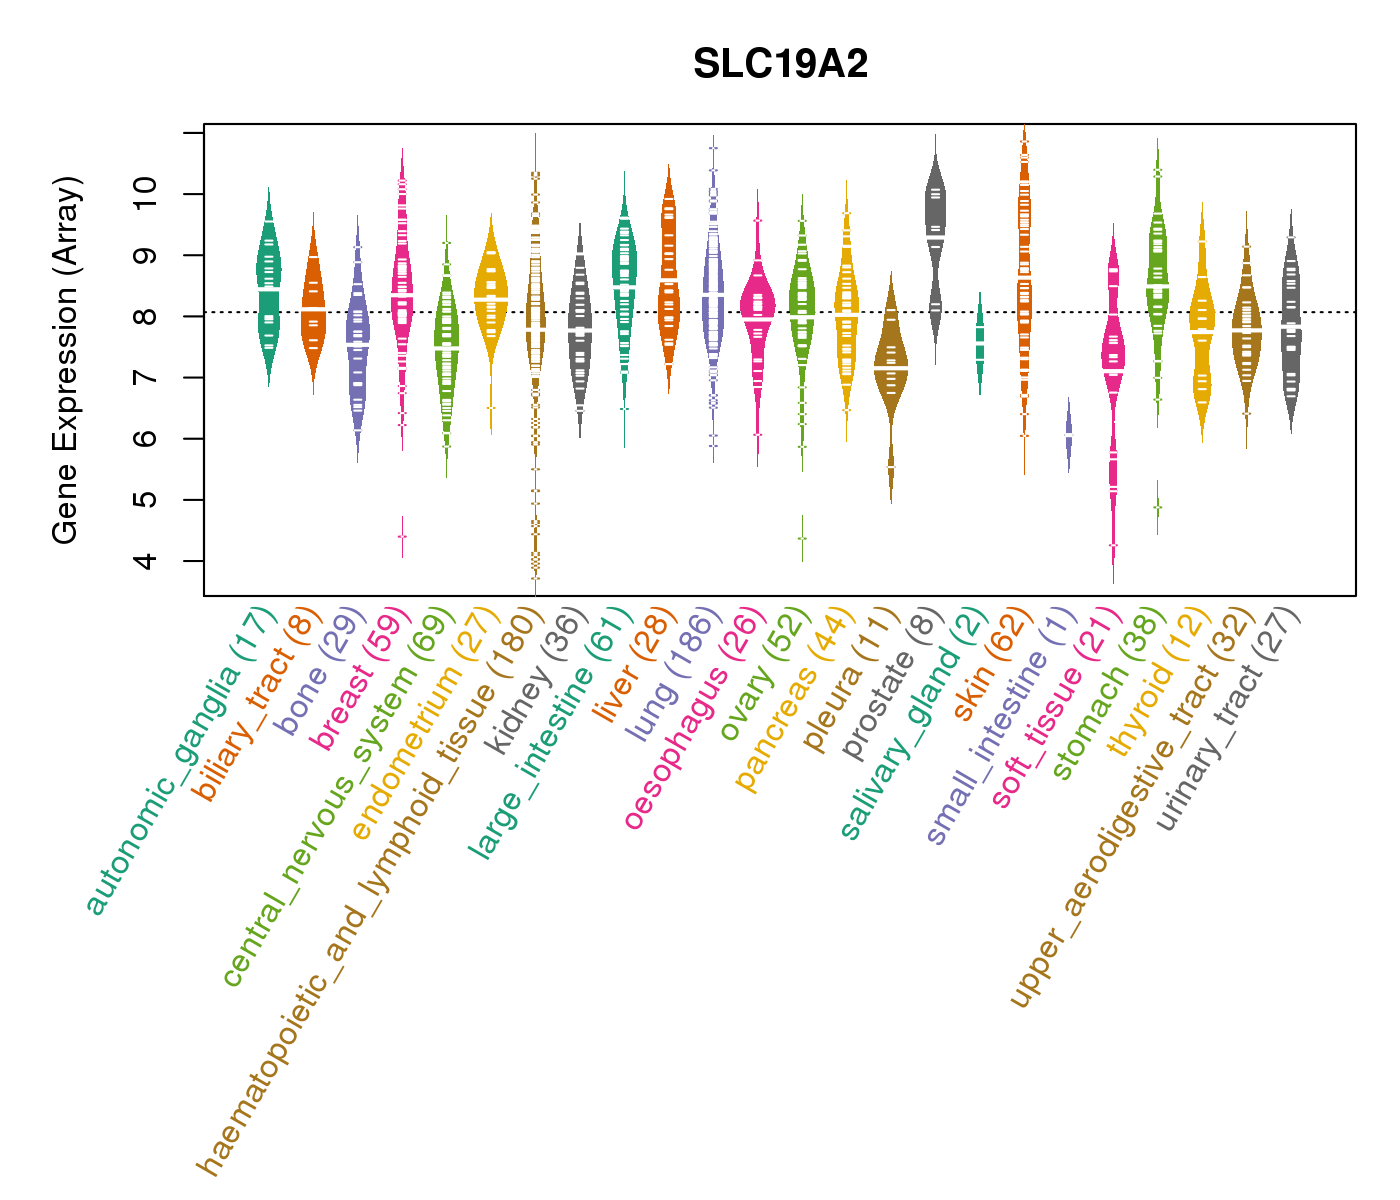 |
| * Normalized gene expression data of RNASeqV2 was extracted from TCGA using R package TCGA-Assembler. The URLs of all public data files on TCGA DCC data server were gathered at Jan-05-2015. Only eight cancer types have enough normal control samples for differential expression analysis. (t test, adjusted p<0.05 (using Benjamini-Hochberg FDR)) |
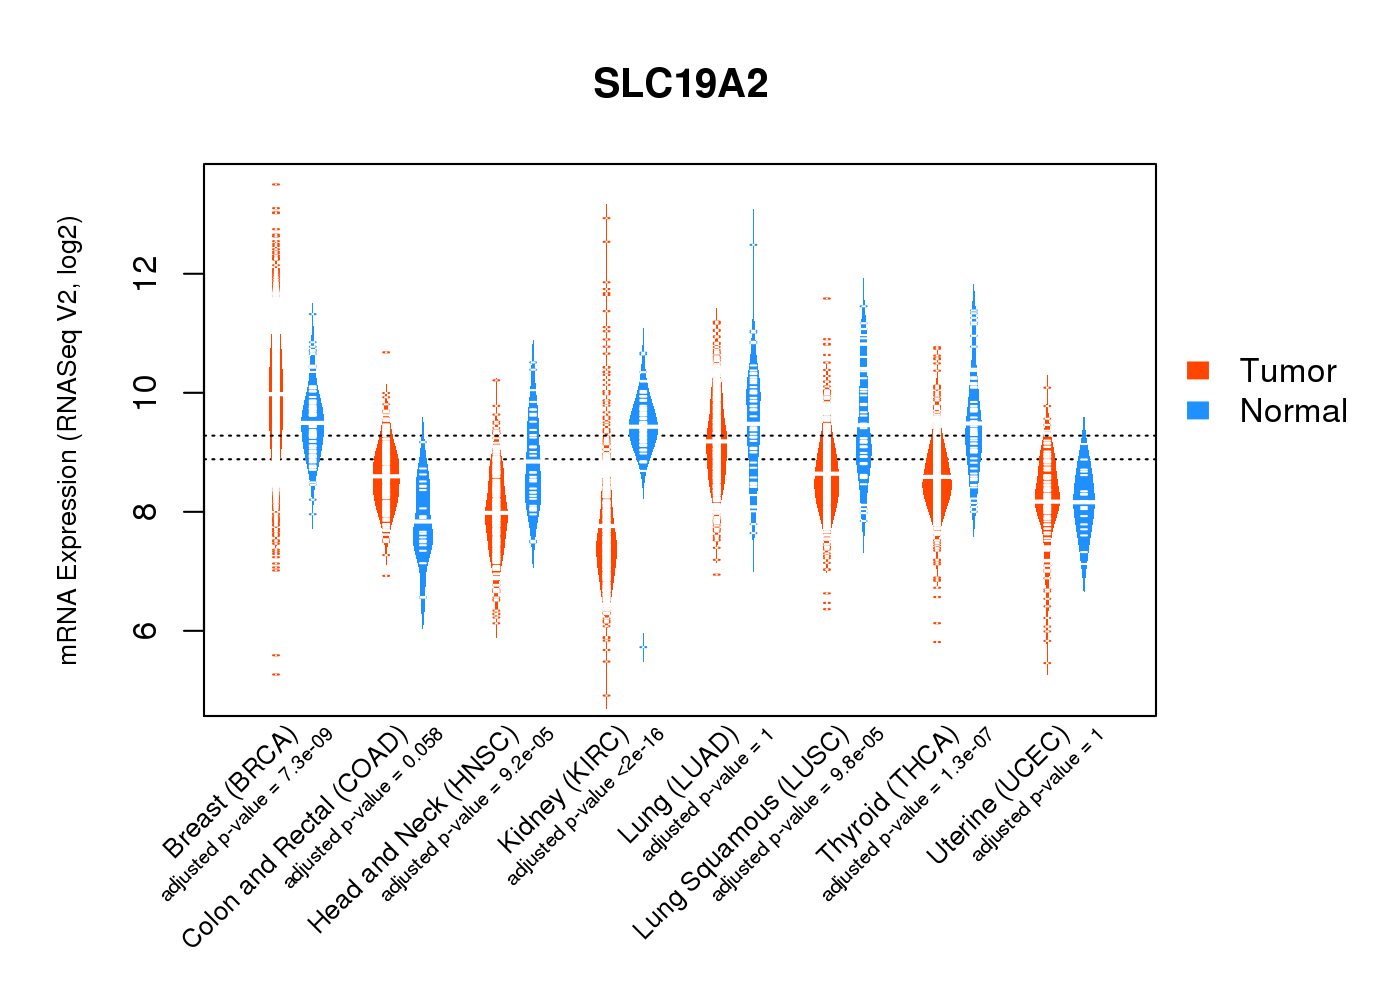 |
| Top |
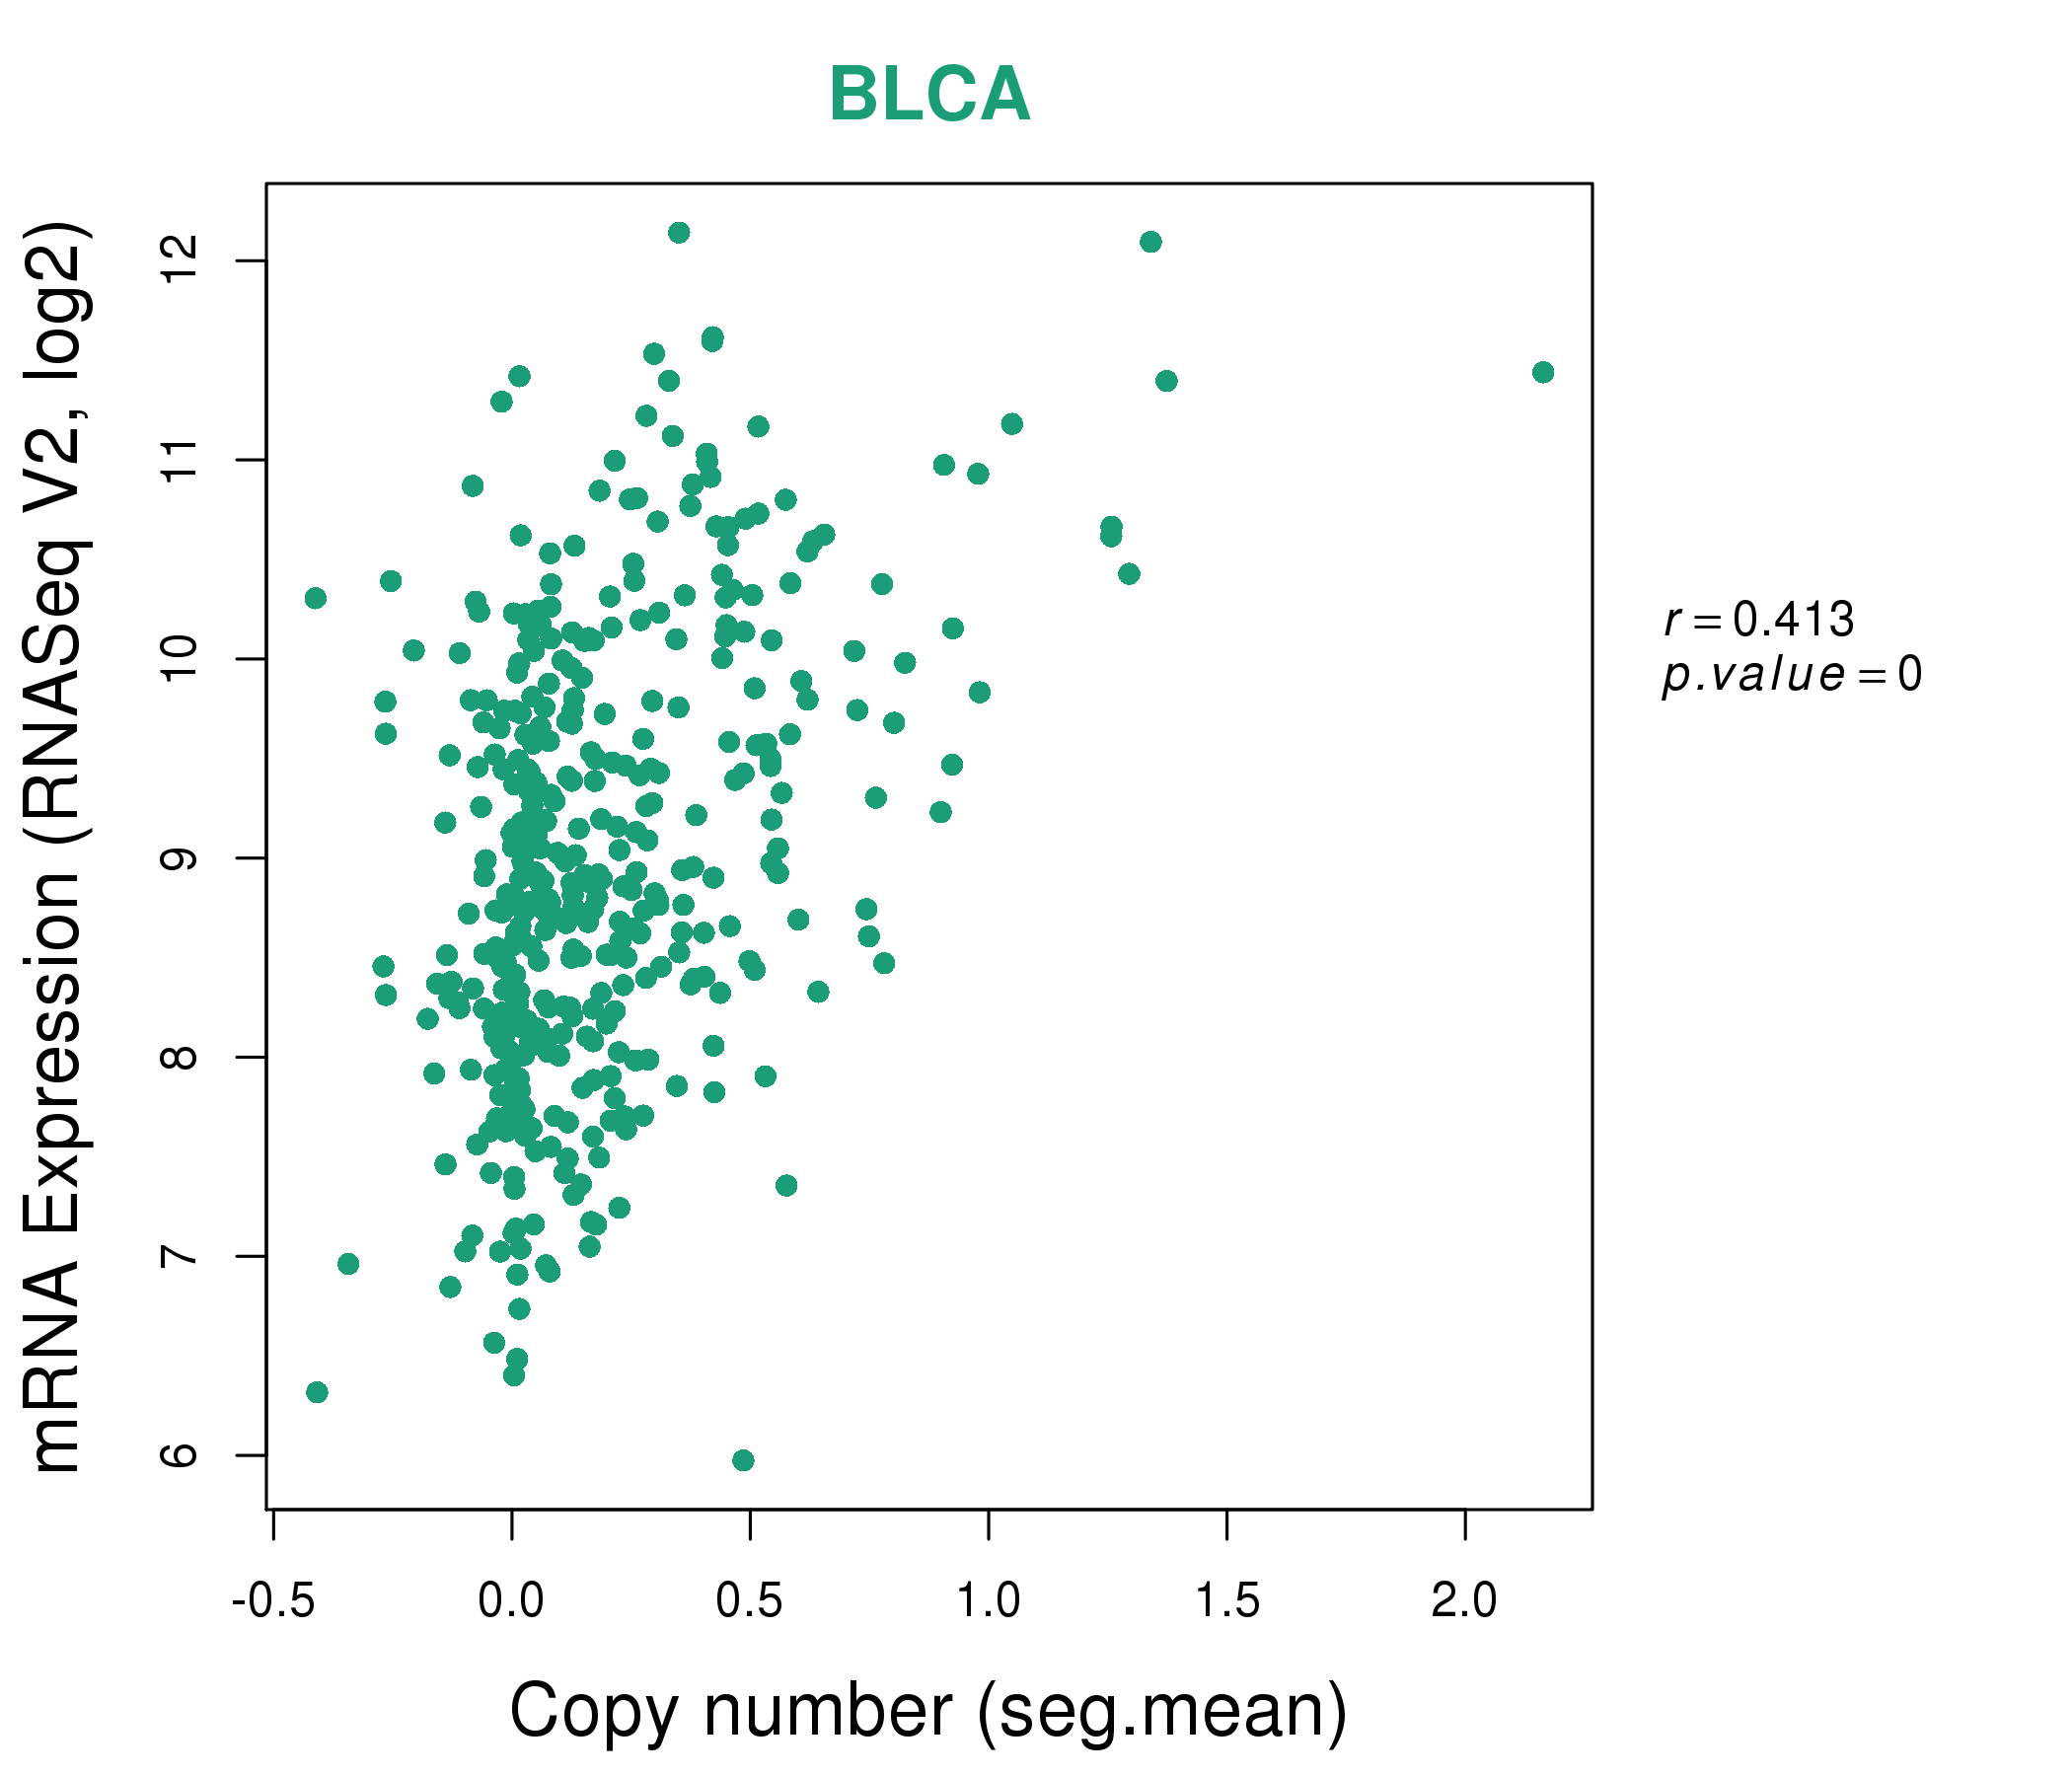
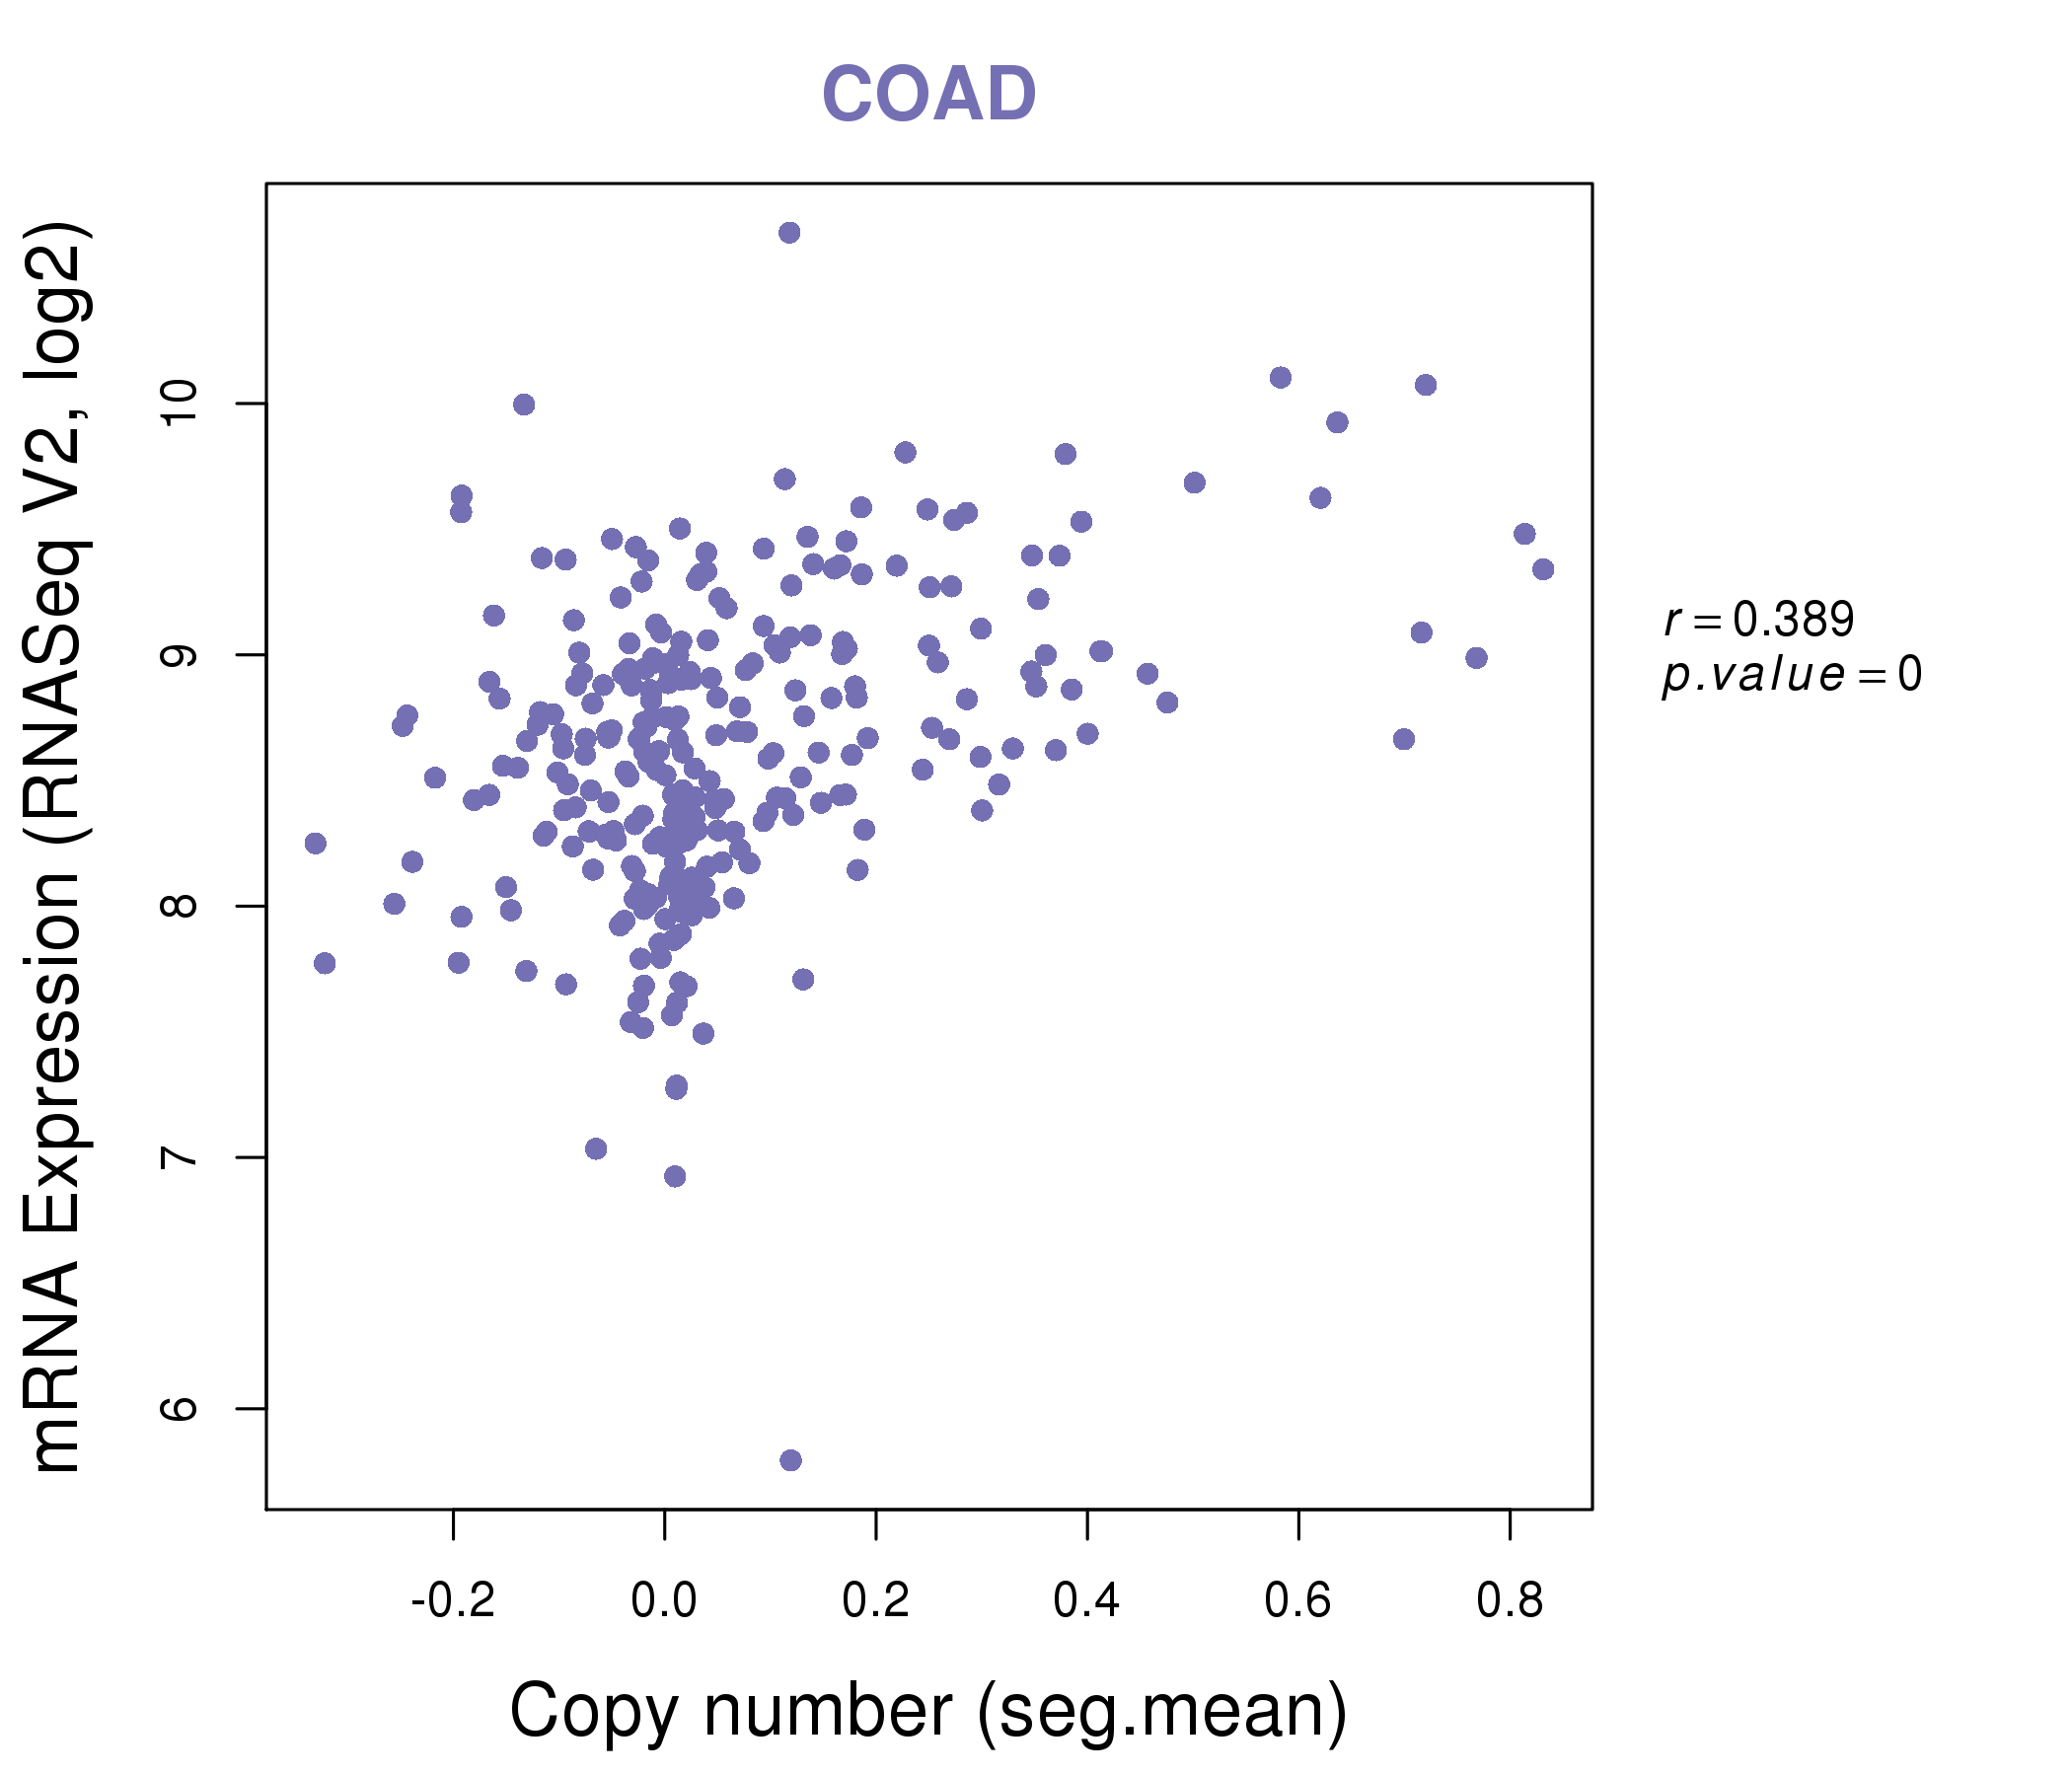
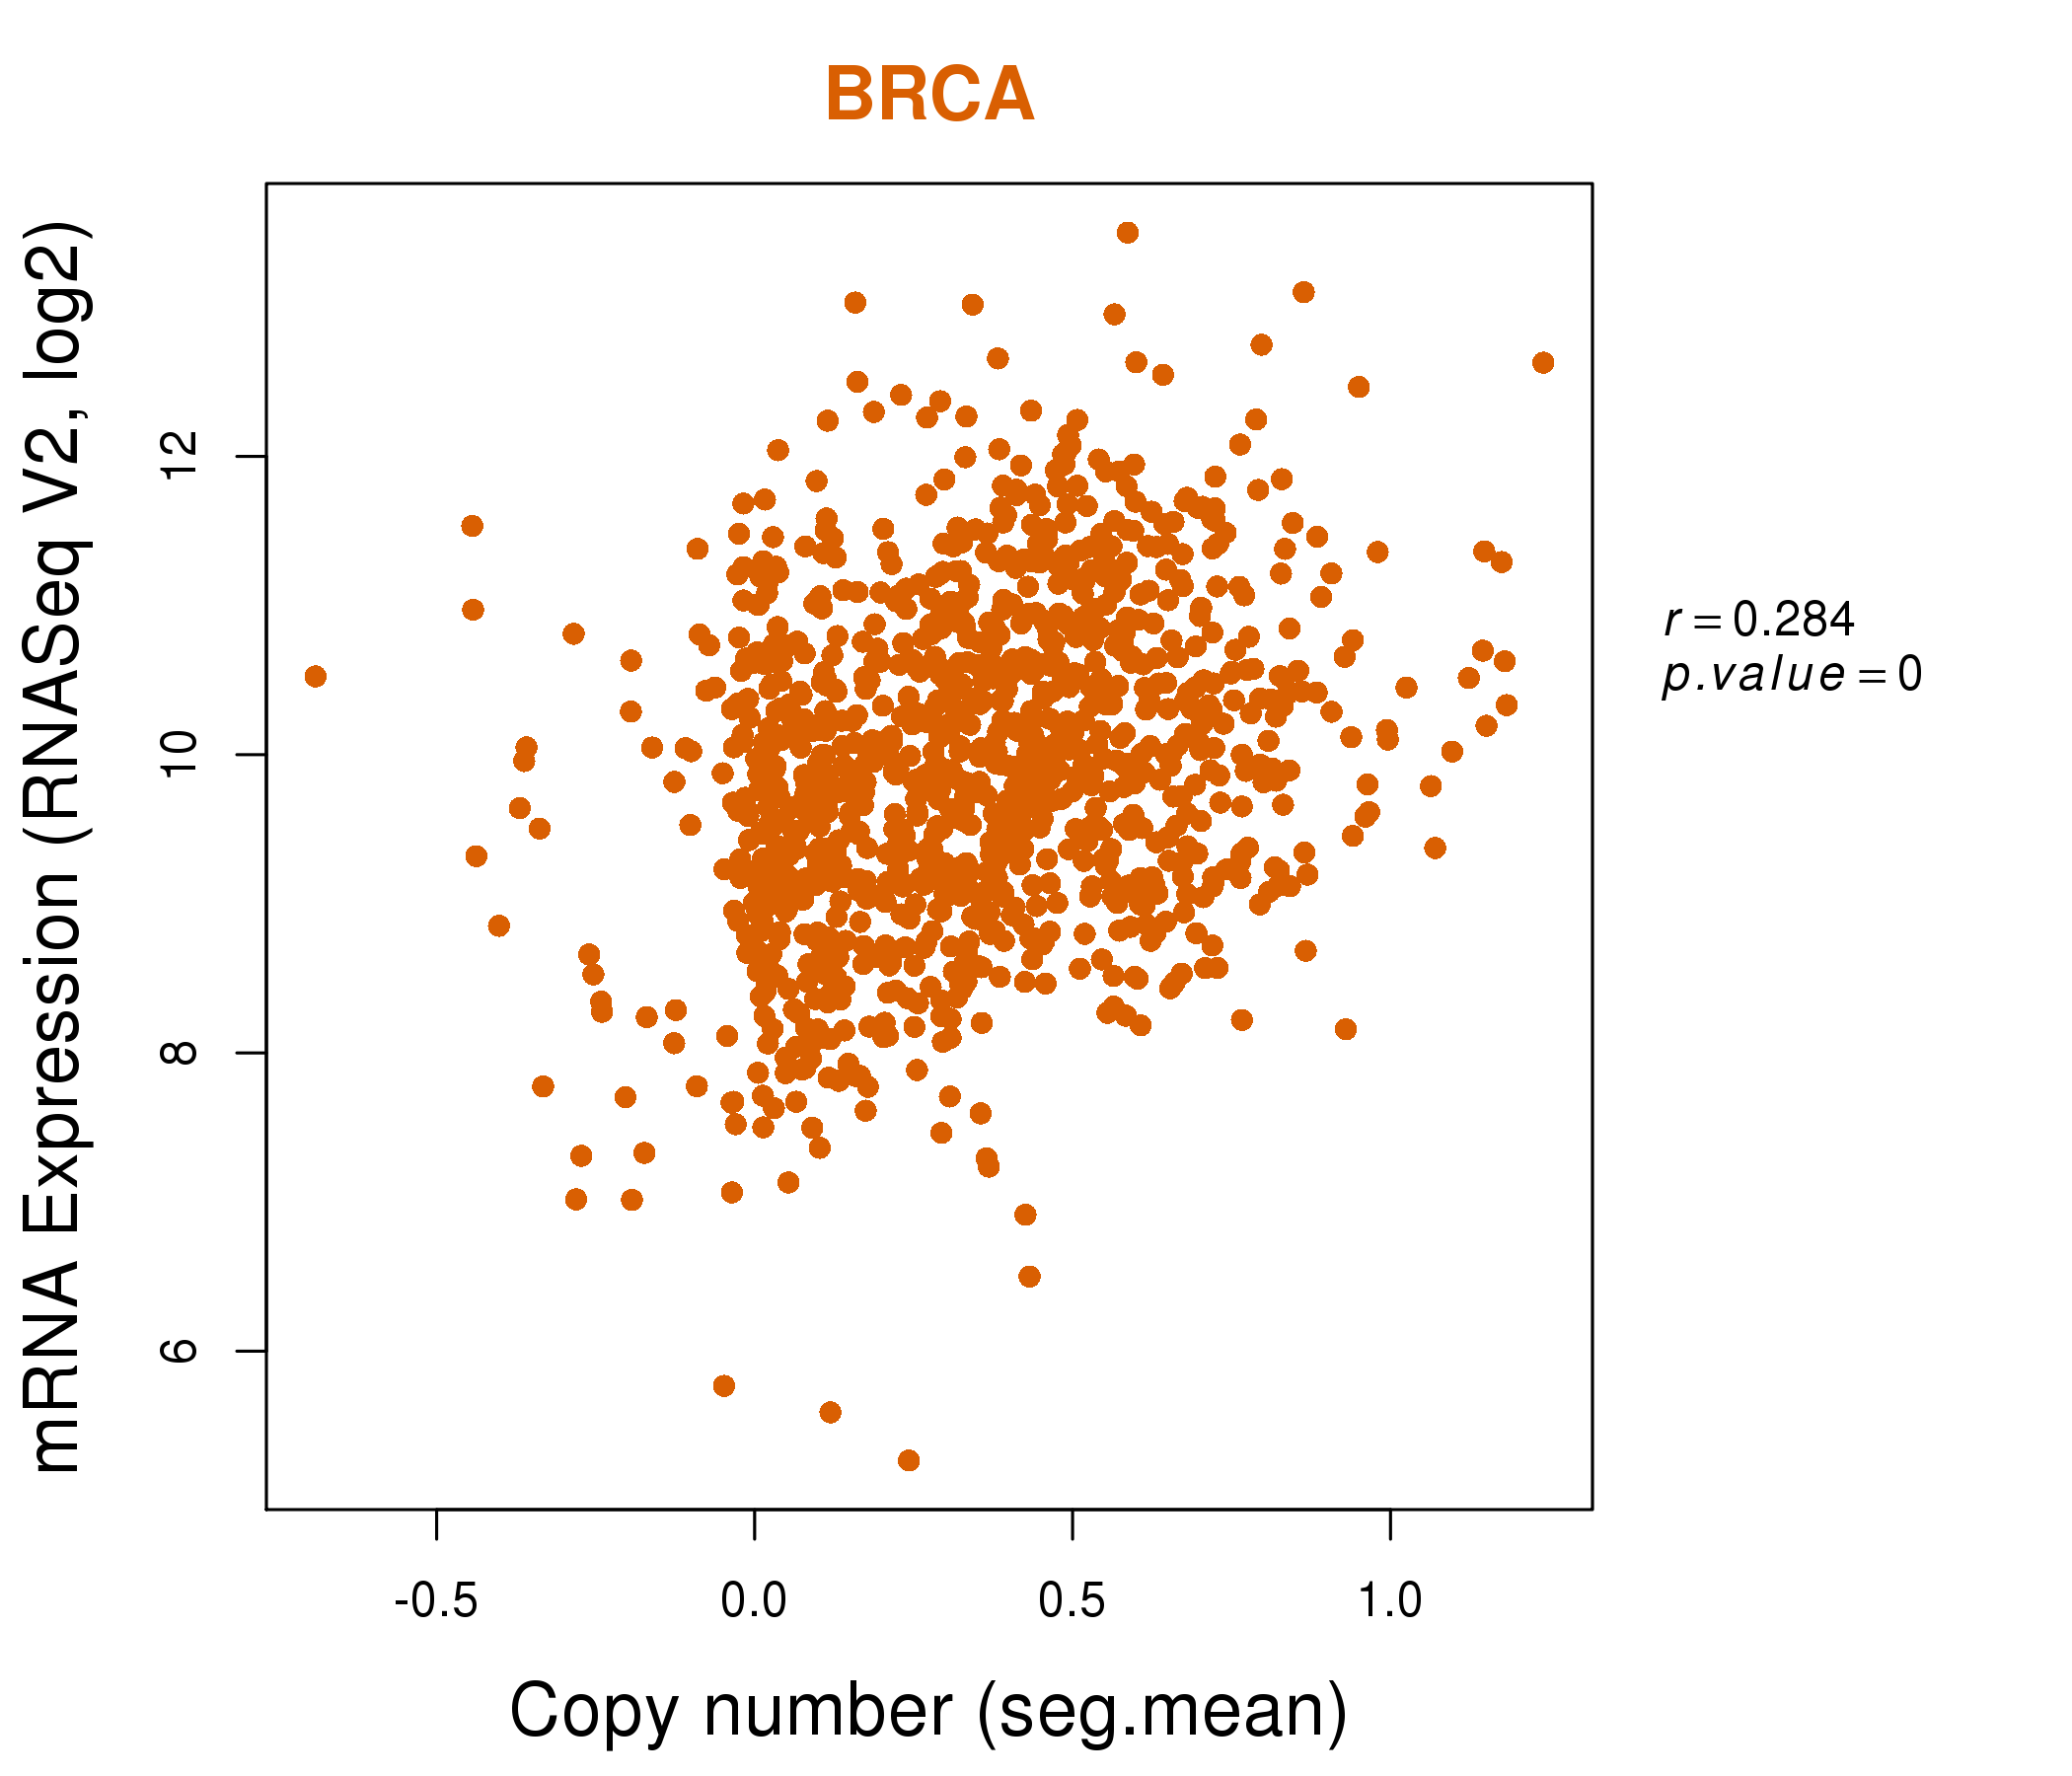
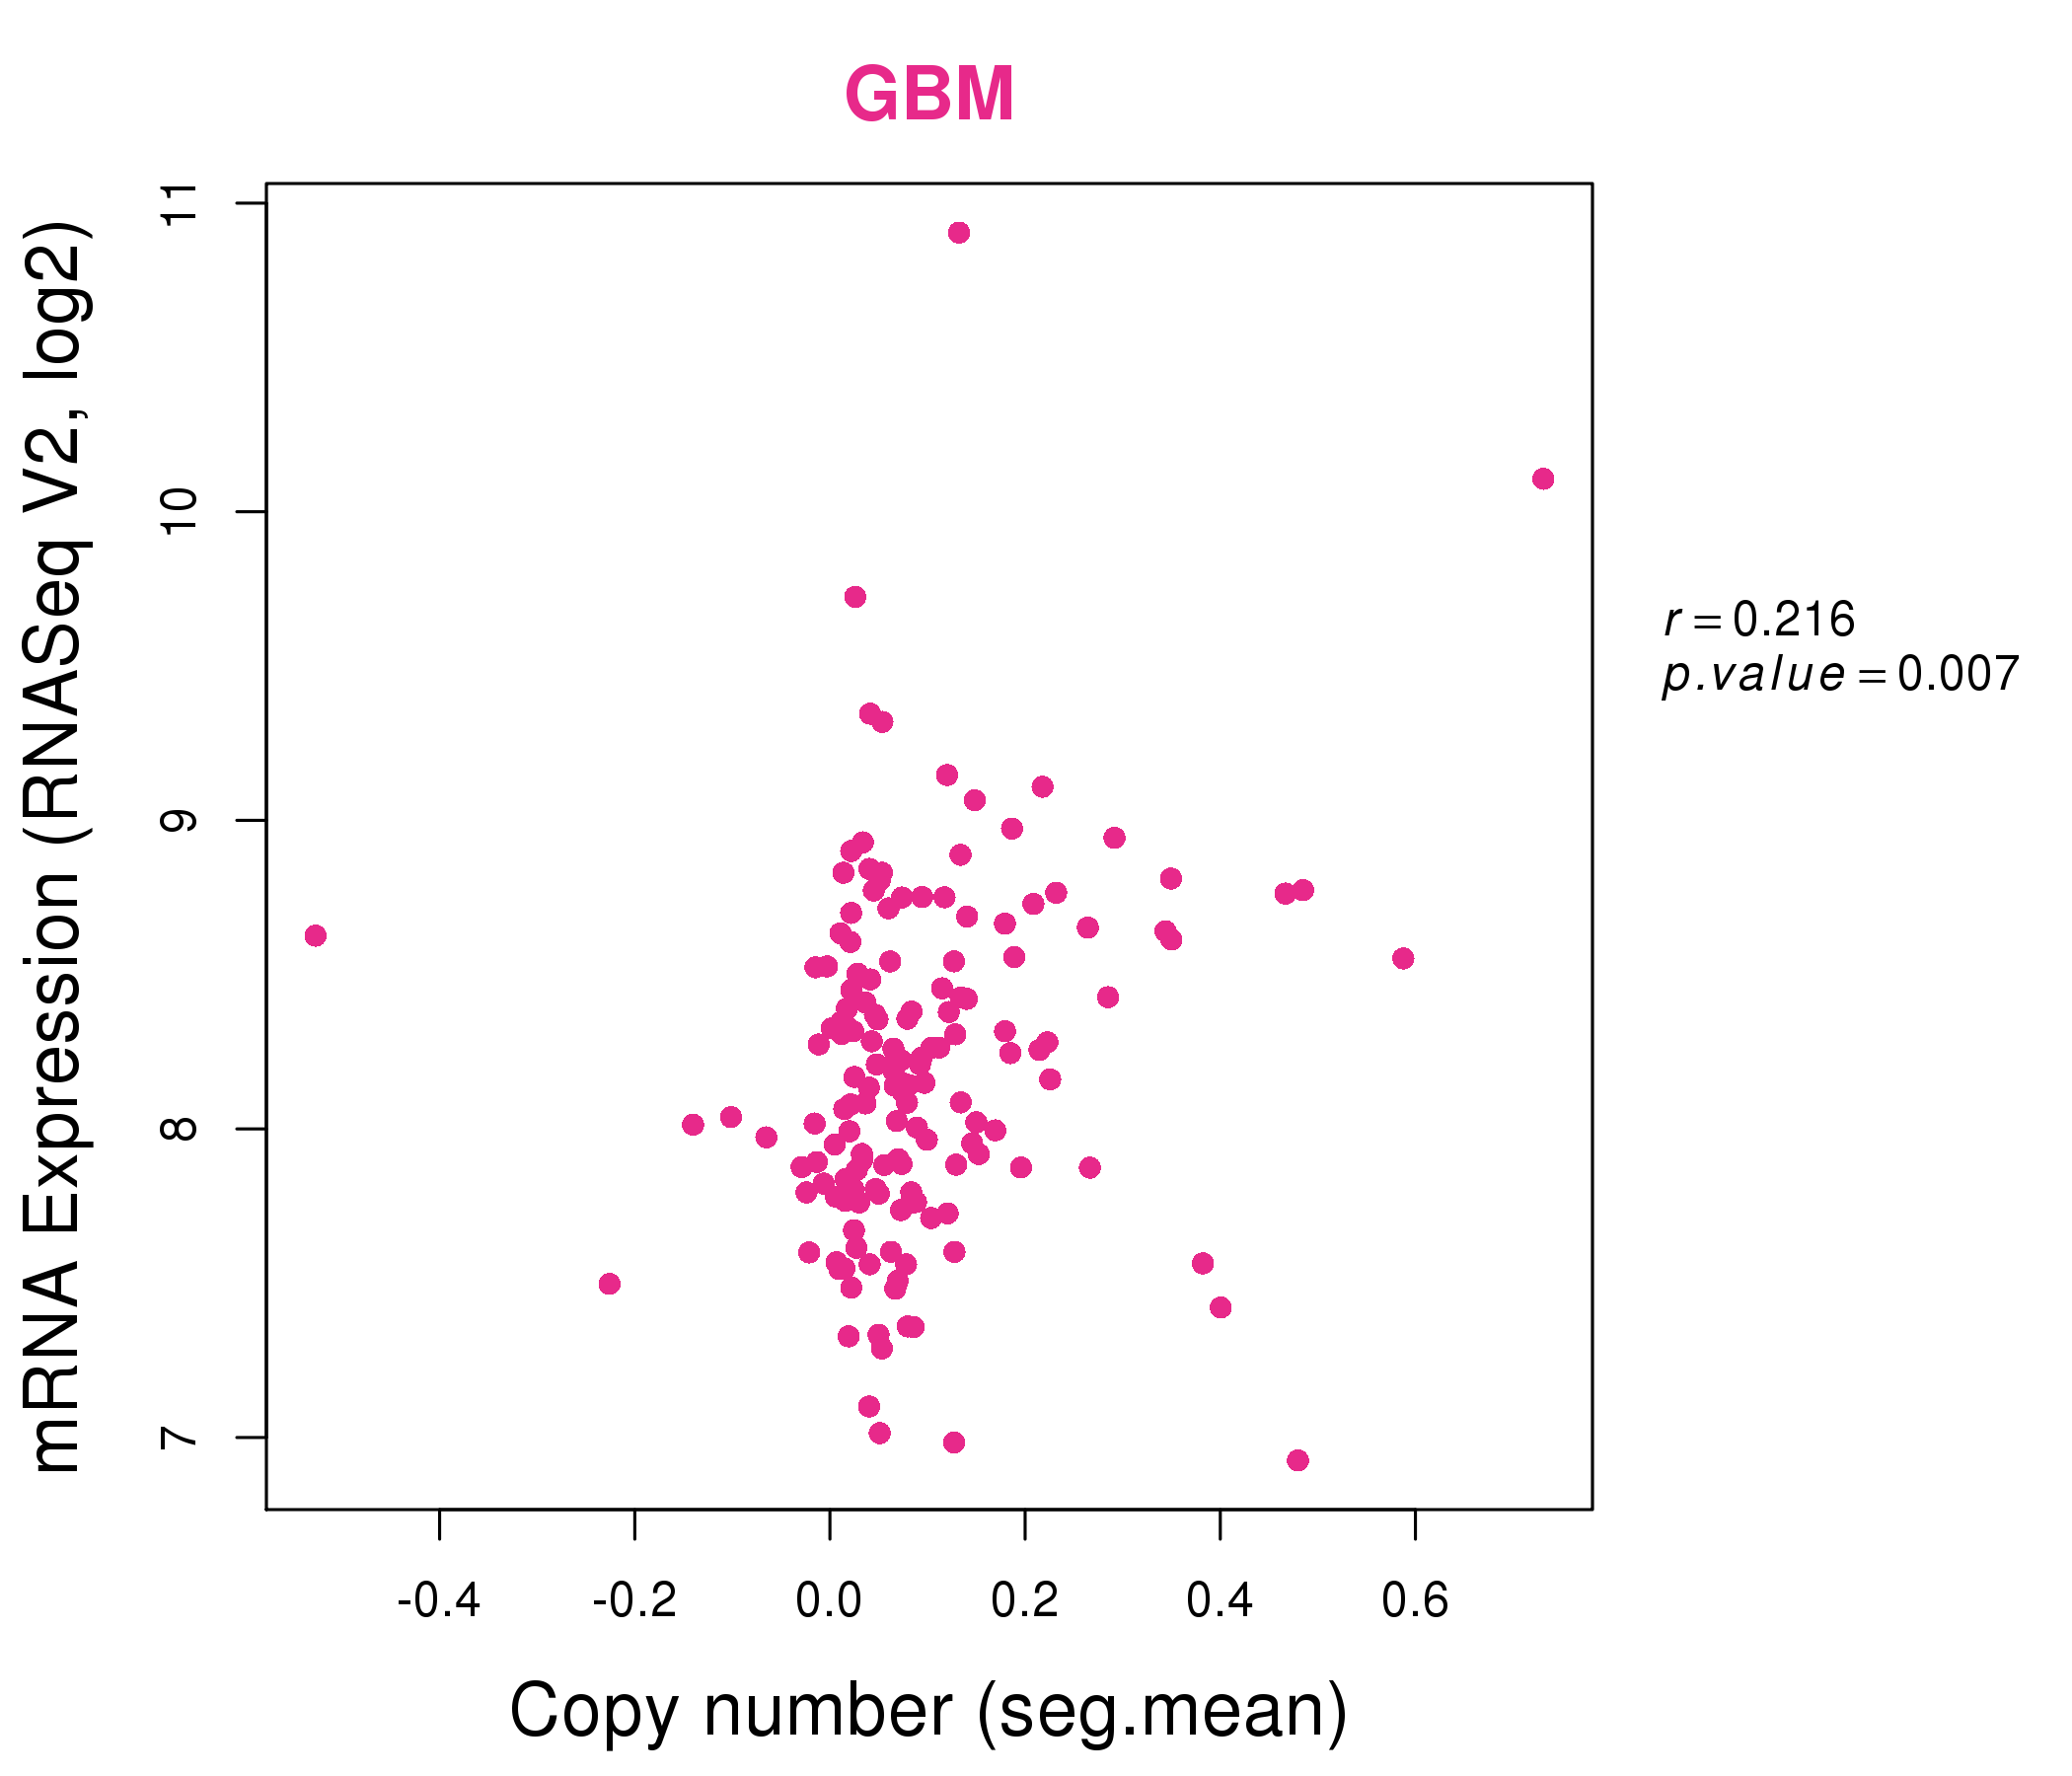
| * This plots show the correlation between CNV and gene expression. |
: Open all plots for all cancer types
 |
|
 |
|
| Top |
| Gene-Gene Network Information |
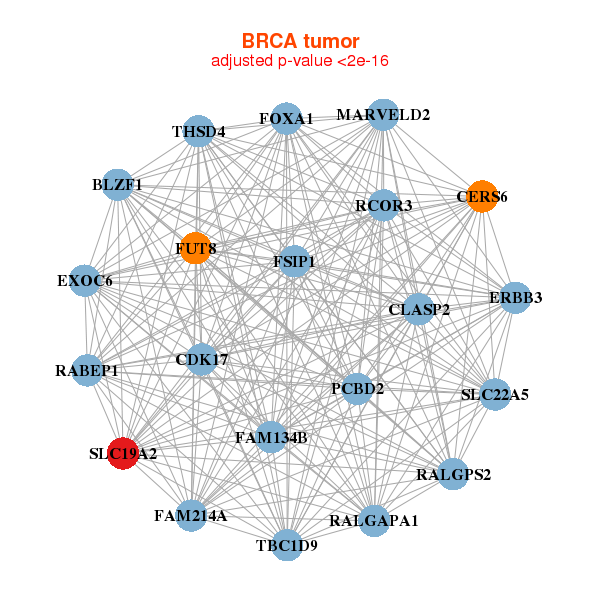
| * Co-Expression network figures were drawn using R package igraph. Only the top 20 genes with the highest correlations were shown. Red circle: input gene, orange circle: cell metabolism gene, sky circle: other gene |
: Open all plots for all cancer types
 |
| ||||
| BLZF1,CDK17,CLASP2,ERBB3,EXOC6,FAM134B,FOXA1, FSIP1,FUT8,FAM214A,CERS6,MARVELD2,PCBD2,RABEP1, RALGAPA1,RALGPS2,RCOR3,SLC19A2,SLC22A5,TBC1D9,THSD4 | CFAP126,CPEB4,CUL3,DYNC1LI1,G3BP2,GFM1,KLF9, L2HGDH,MAPK6,MLF1,MUM1L1,NPEPPS,OXNAD1,PTP4A1, RAB21,RNF115,SAR1B,SLC19A2,TP53INP2,UBE3A,USP38 | ||||
 |
| ||||
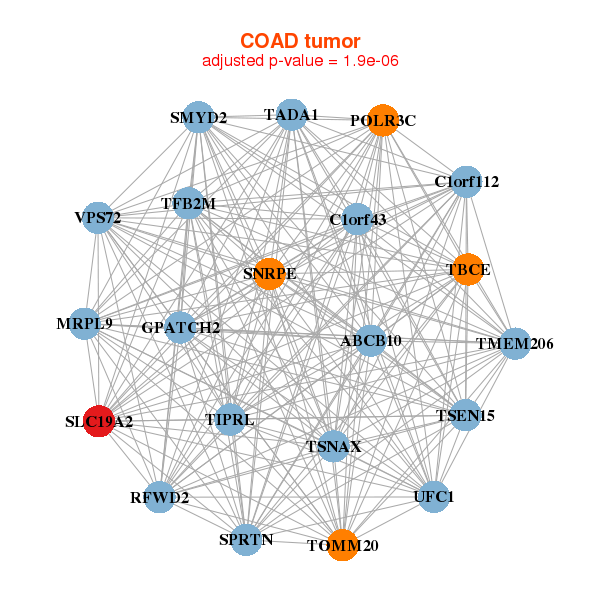
| ABCB10,C1orf112,SPRTN,C1orf43,GPATCH2,MRPL9,POLR3C, RFWD2,SLC19A2,SMYD2,SNRPE,TADA1,TBCE,TFB2M, TIPRL,TMEM206,TOMM20,TSEN15,TSNAX,UFC1,VPS72 | VCPKMT,CCDC173,CCNL1,CEBPB,CSRNP1,DCUN1D3,GJA1, IGFBP1,IL6,JMJD6,KLF9,MAK,ODF3L1,PDK4, PRPF4B,RBM39,SCNN1G,SLC19A2,TIPARP,TSC22D3,ZNF460 |
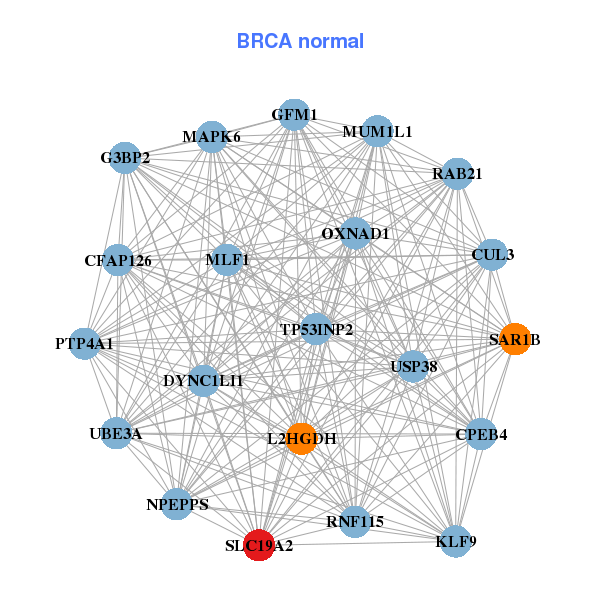

| * Co-Expression network figures were drawn using R package igraph. Only the top 20 genes with the highest correlations were shown. Red circle: input gene, orange circle: cell metabolism gene, sky circle: other gene |
: Open all plots for all cancer types
| Top |
: Open all interacting genes' information including KEGG pathway for all interacting genes from DAVID
| Top |
| Pharmacological Information for SLC19A2 |
| DB Category | DB Name | DB's ID and Url link |
| * Gene Centered Interaction Network. |
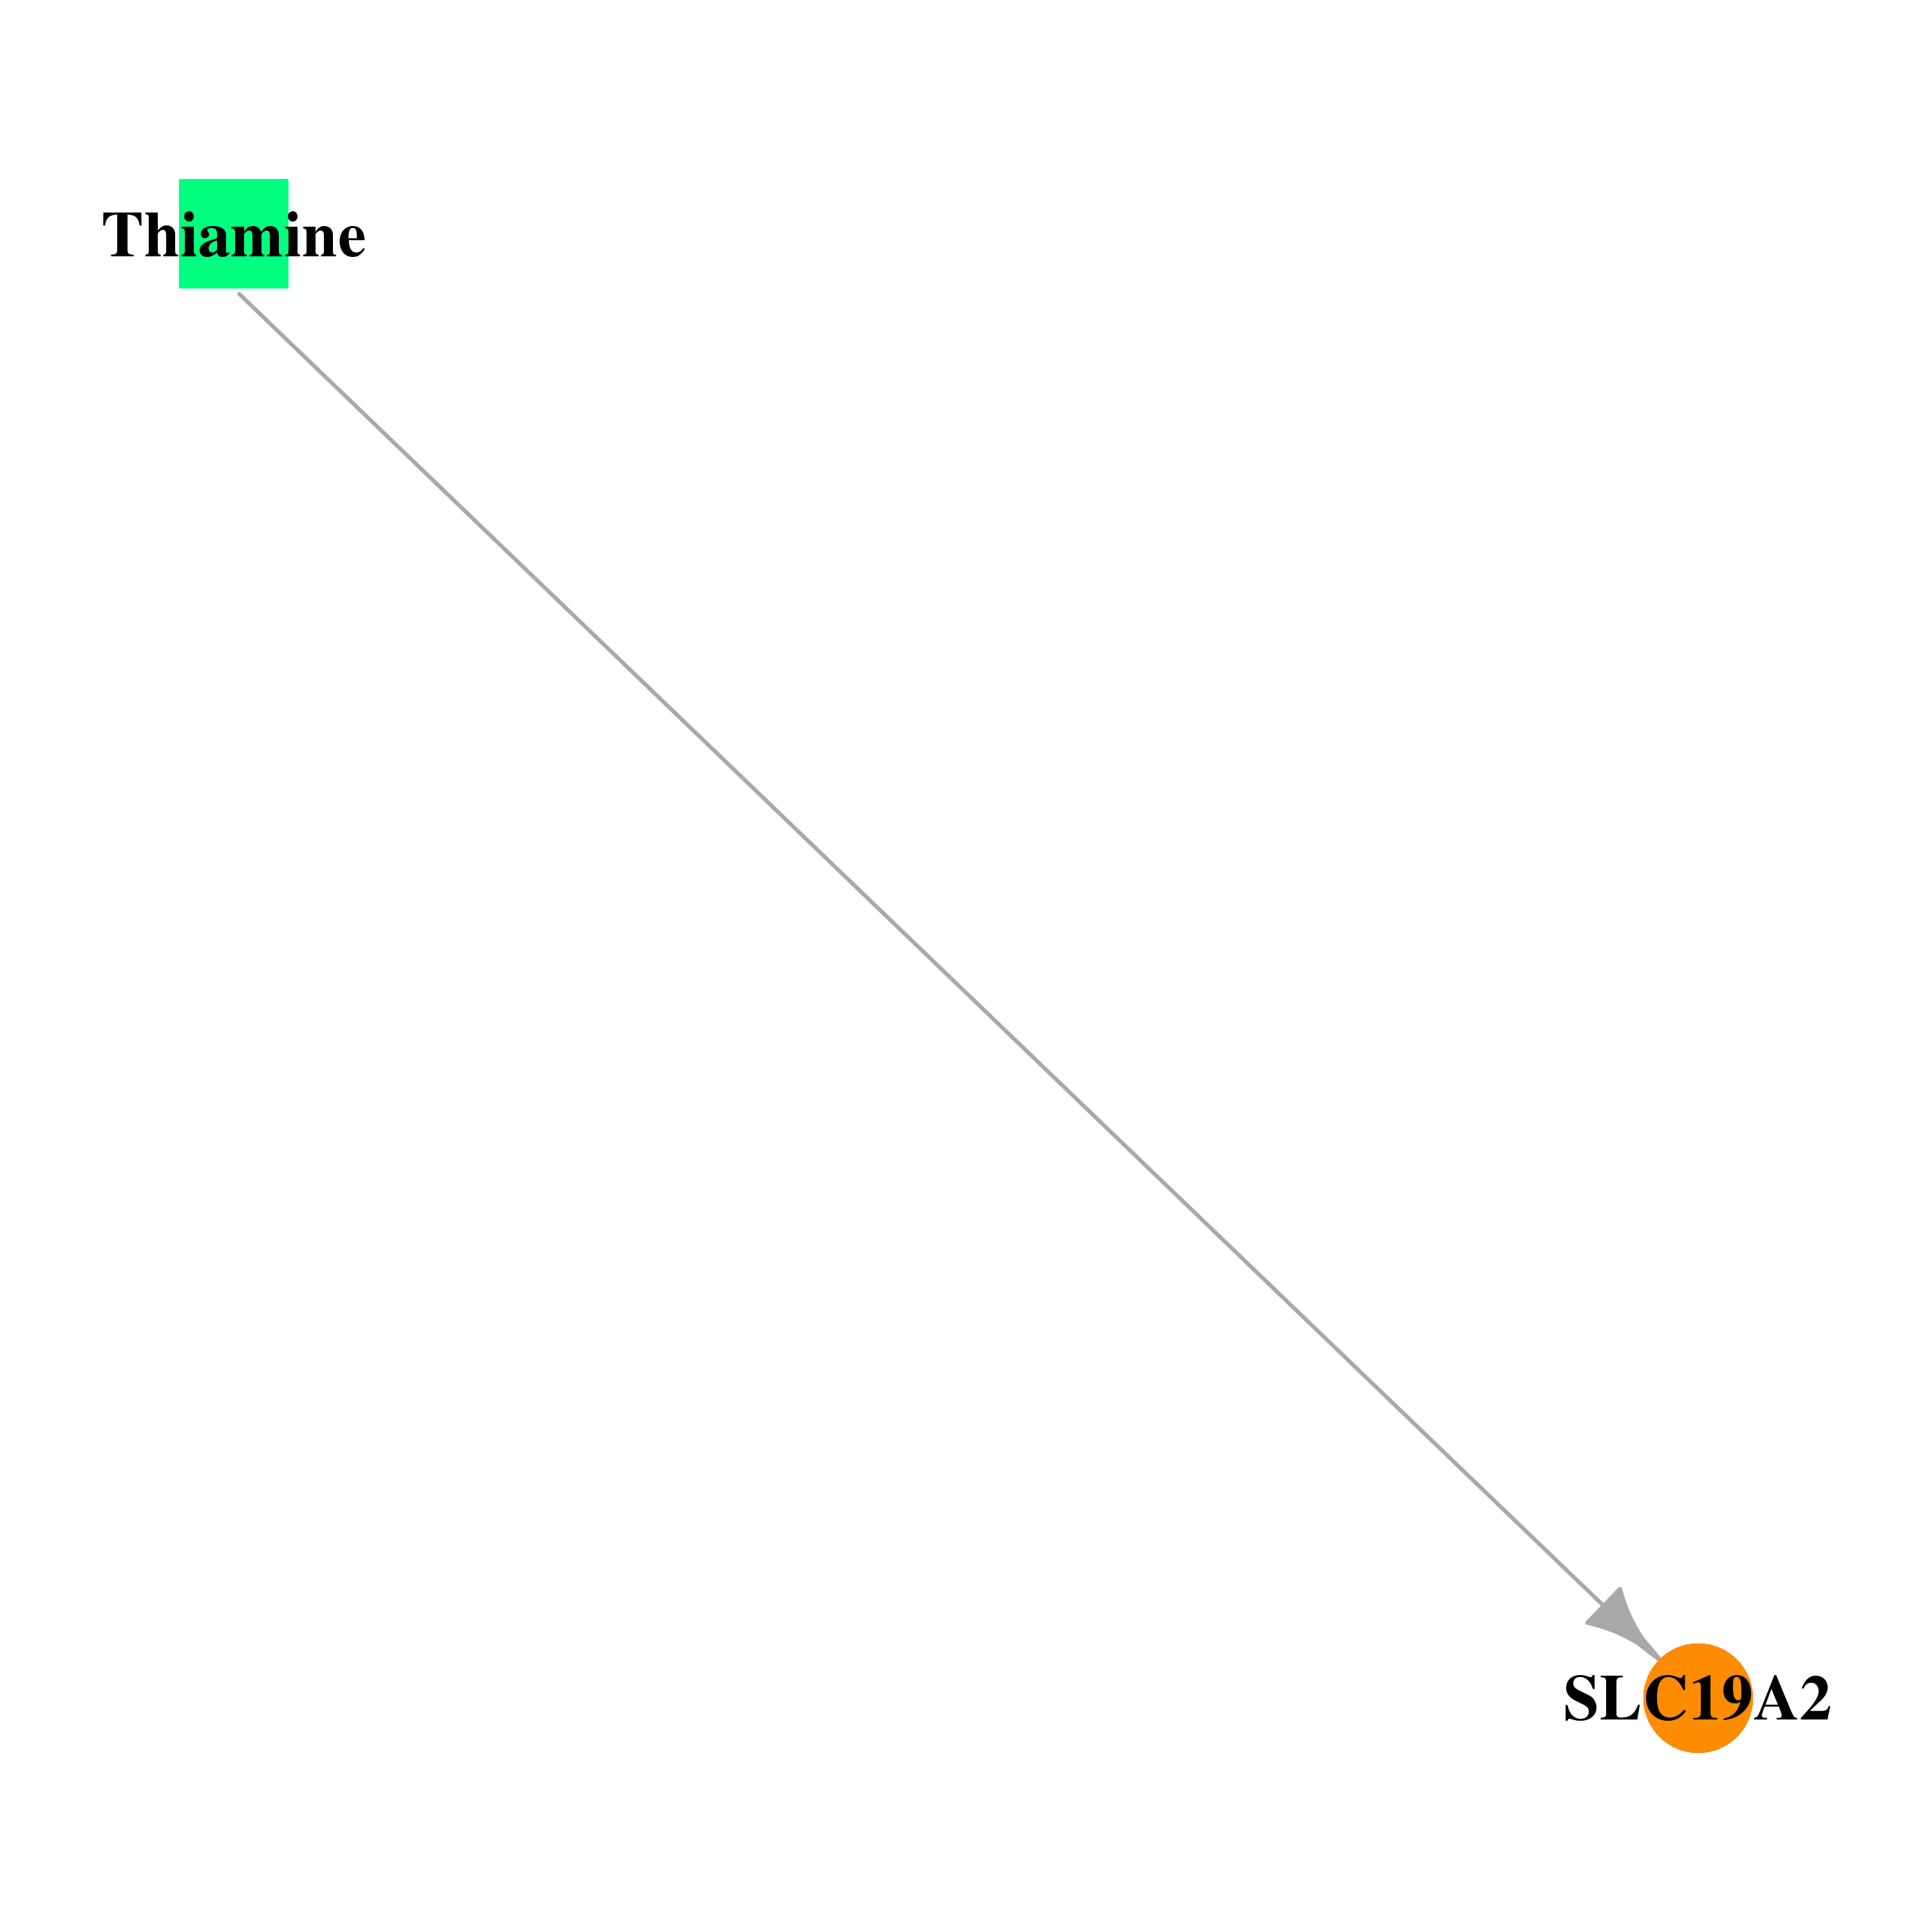 |
| * Drug Centered Interaction Network. |
| DrugBank ID | Target Name | Drug Groups | Generic Name | Drug Centered Network | Drug Structure |
| DB00152 | solute carrier family 19 (thiamine transporter), member 2 | approved; nutraceutical | Thiamine | 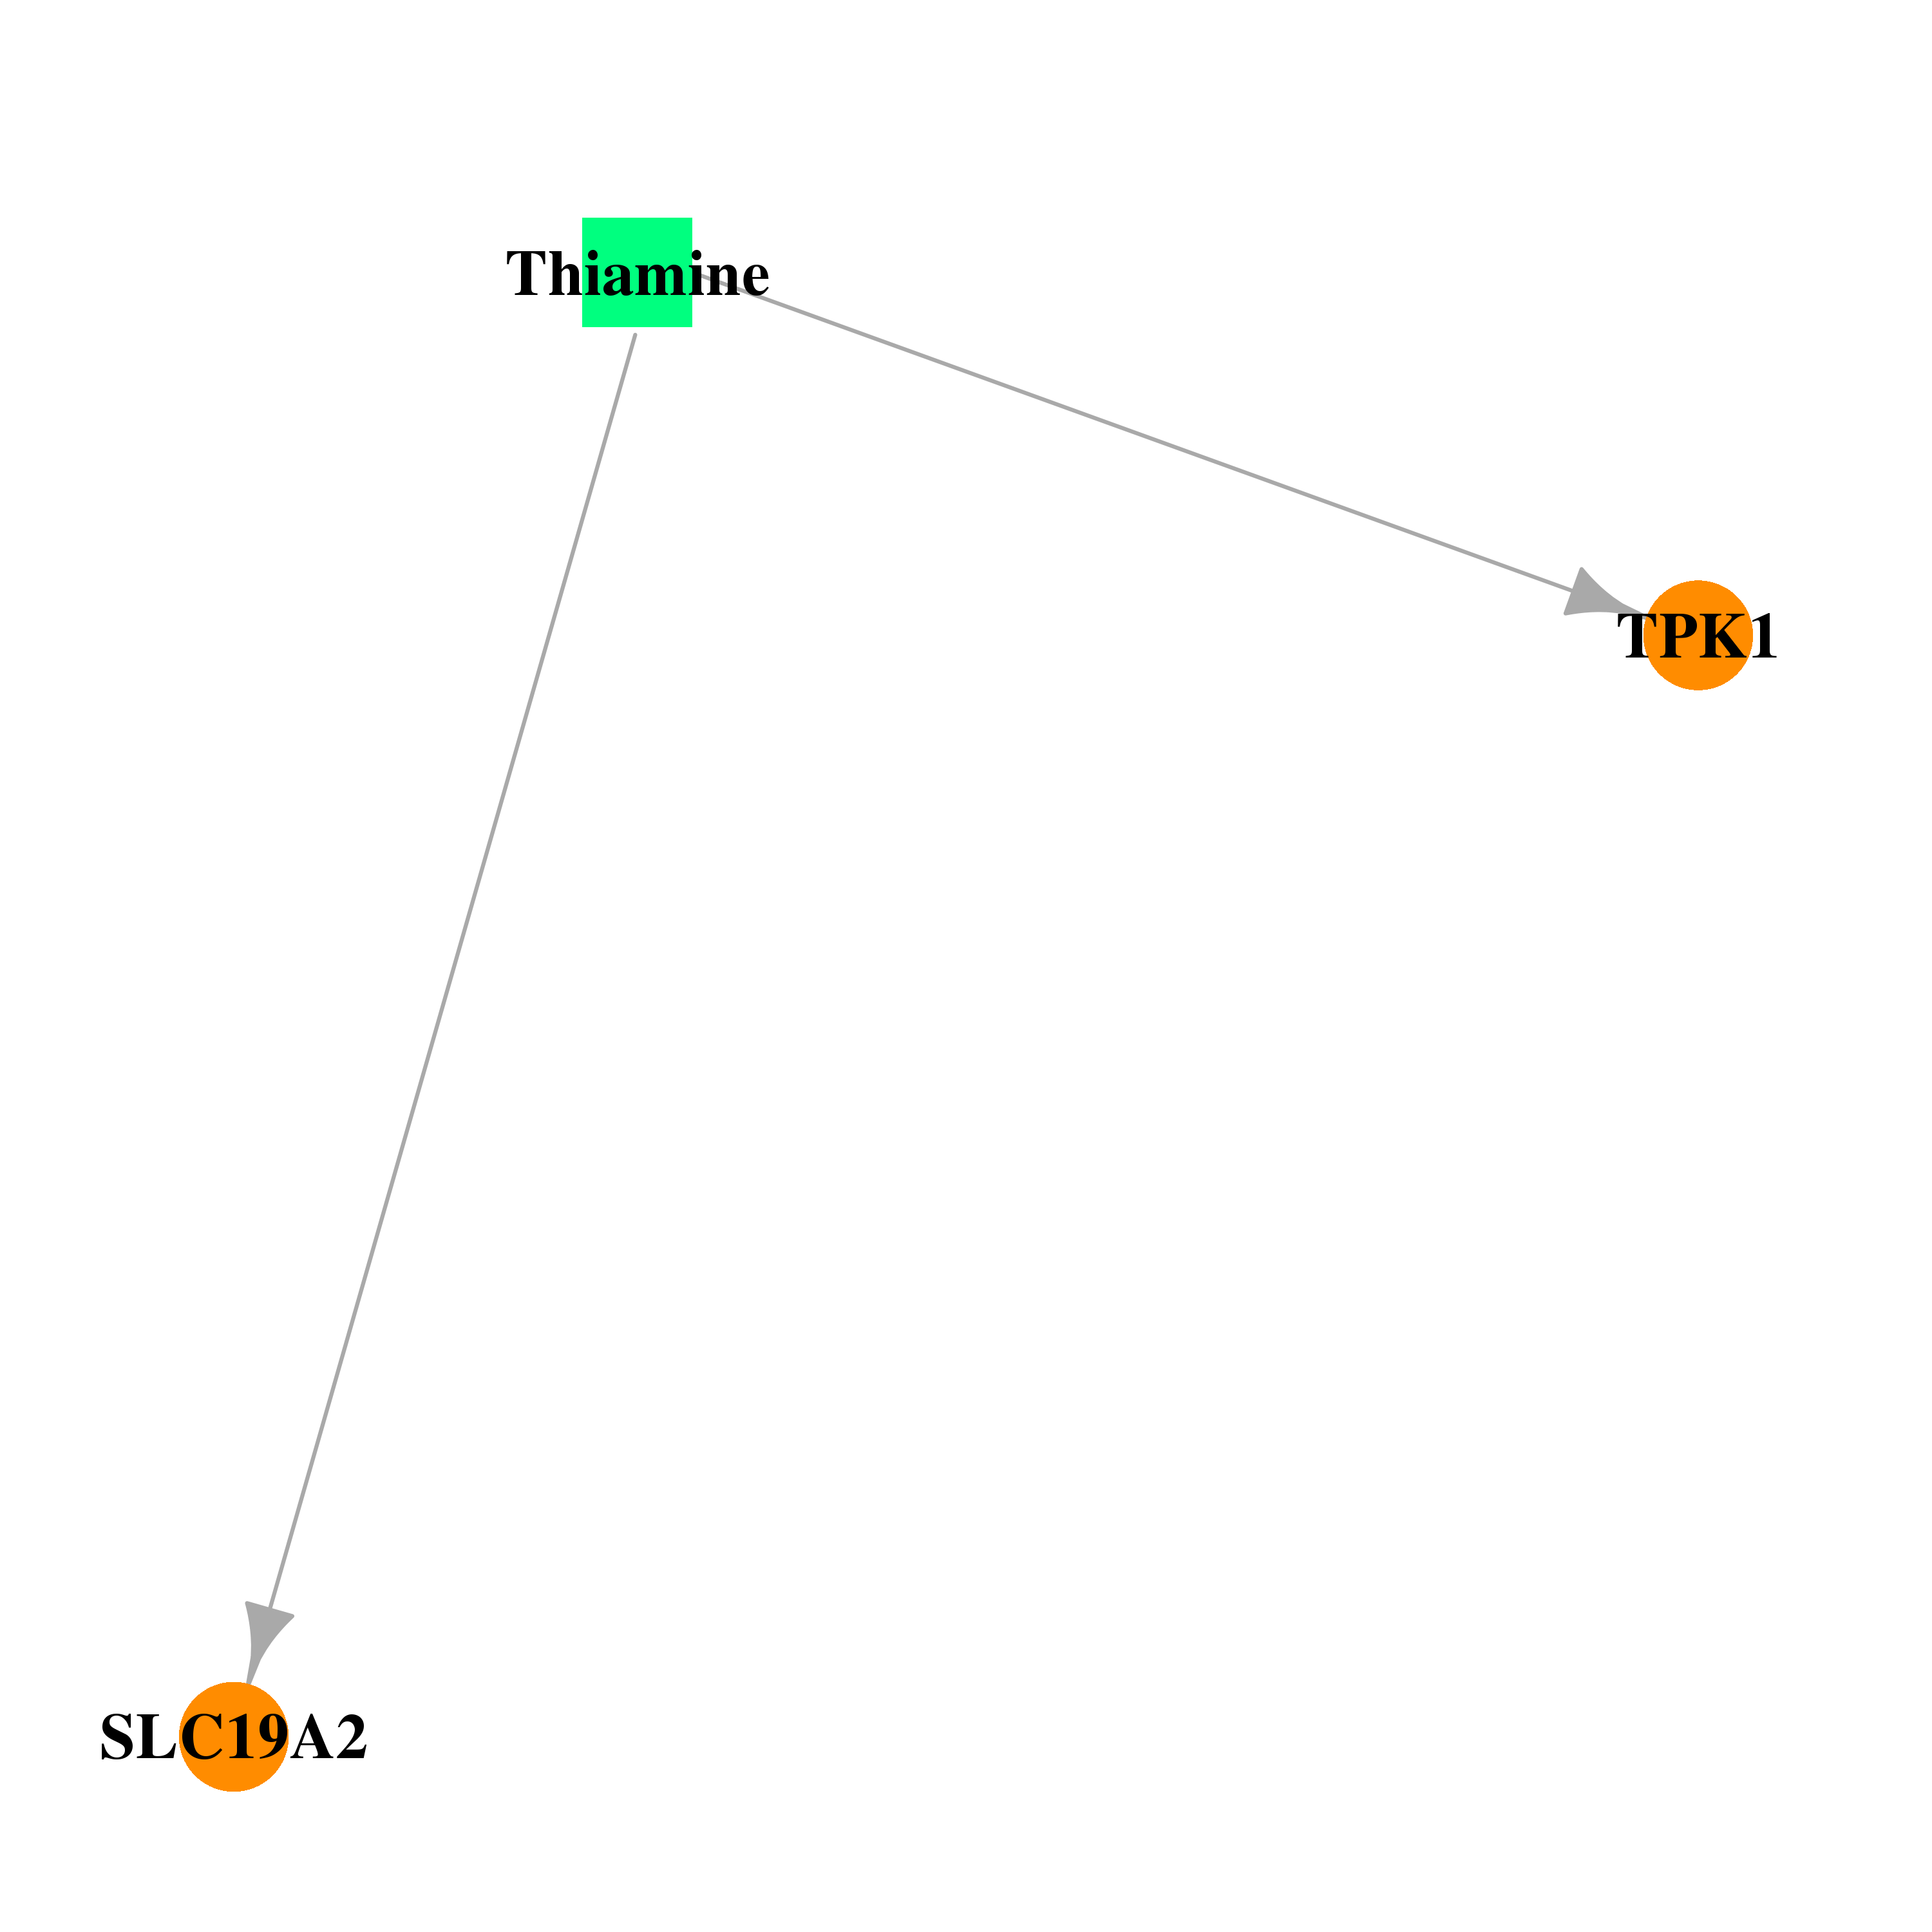 | 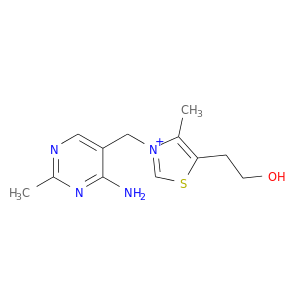 |
| Top |
| Cross referenced IDs for SLC19A2 |
| * We obtained these cross-references from Uniprot database. It covers 150 different DBs, 18 categories. http://www.uniprot.org/help/cross_references_section |
: Open all cross reference information
|
Copyright © 2016-Present - The Univsersity of Texas Health Science Center at Houston @ |