|
||||||||||||||||||||||||||||||||||||||||||||||||||||||||||||||||||||||||||||||||||||||||||||||||||||||||||||||||||||||||||||||||||||||||||||||||||||||||||||||||||||||||||||||||||||||||||||||||||||||||||||||||||||||||||||||||||||||||||||||||||||||||||||||||||||||||||||||||||||||||||||||||||||||||||||||||||||||||||
| |
| Phenotypic Information (metabolism pathway, cancer, disease, phenome) |
| |
| |
| Gene-Gene Network Information: Co-Expression Network, Interacting Genes & KEGG |
| |
|


| Gene Summary for CCT7 |
| Top |
| Phenotypic Information for CCT7(metabolism pathway, cancer, disease, phenome) |
| Cancer | CGAP: CCT7 |
| Familial Cancer Database: CCT7 | |
| * This gene is included in those cancer gene databases. |
|
|
|
|
|
| . | ||||||||||||||||||||||||||||||||||||||||||||||||||||||||||||||||||||||||||||||||||||||||||||||||||||||||||||||||||||||||||||||||||||||||||||||||||||||||||||||||||||||||||||||||||||||||||||||||||||||||||||||||||||||||||||||||||||||||||||||||||||||||||||||||||||||||||||||||||||||||||||||||||||||||||||||||||||
Oncogene 1 | Significant driver gene in | |||||||||||||||||||||||||||||||||||||||||||||||||||||||||||||||||||||||||||||||||||||||||||||||||||||||||||||||||||||||||||||||||||||||||||||||||||||||||||||||||||||||||||||||||||||||||||||||||||||||||||||||||||||||||||||||||||||||||||||||||||||||||||||||||||||||||||||||||||||||||||||||||||||||||||||||||||||||||
| cf) number; DB name 1 Oncogene; http://nar.oxfordjournals.org/content/35/suppl_1/D721.long, 2 Tumor Suppressor gene; https://bioinfo.uth.edu/TSGene/, 3 Cancer Gene Census; http://www.nature.com/nrc/journal/v4/n3/abs/nrc1299.html, 4 CancerGenes; http://nar.oxfordjournals.org/content/35/suppl_1/D721.long, 5 Network of Cancer Gene; http://ncg.kcl.ac.uk/index.php, 1Therapeutic Vulnerabilities in Cancer; http://cbio.mskcc.org/cancergenomics/statius/ |
| REACTOME_METABOLISM_OF_PROTEINS | |
| OMIM | |
| Orphanet | |
| Disease | KEGG Disease: CCT7 |
| MedGen: CCT7 (Human Medical Genetics with Condition) | |
| ClinVar: CCT7 | |
| Phenotype | MGI: CCT7 (International Mouse Phenotyping Consortium) |
| PhenomicDB: CCT7 | |
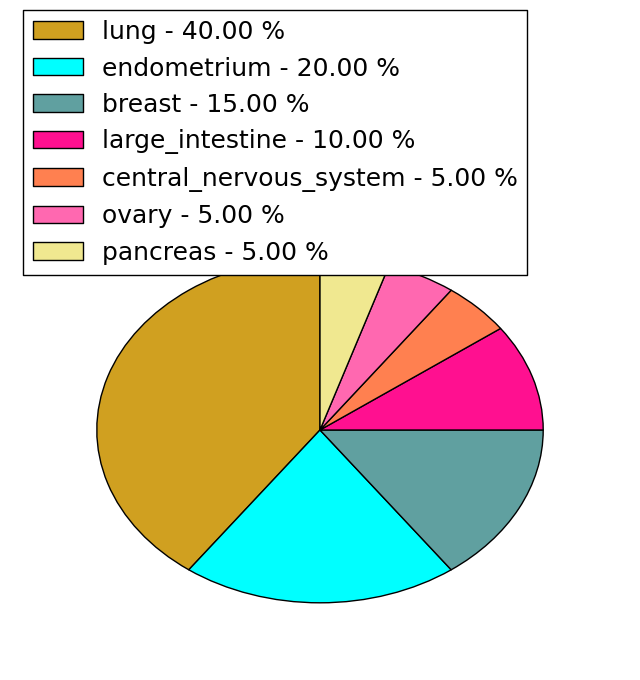
| Mutations for CCT7 |
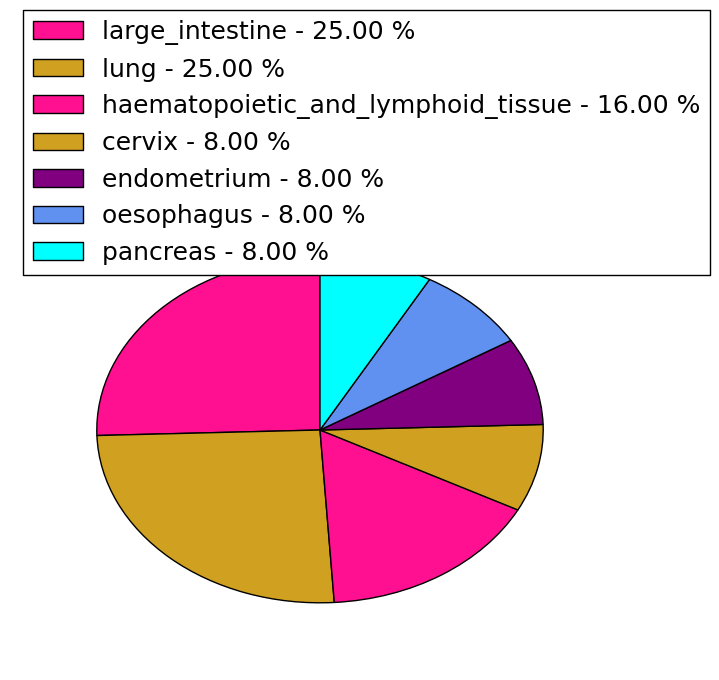
| * Under tables are showing count per each tissue to give us broad intuition about tissue specific mutation patterns.You can go to the detailed page for each mutation database's web site. |
| - Statistics for Tissue and Mutation type | Top |
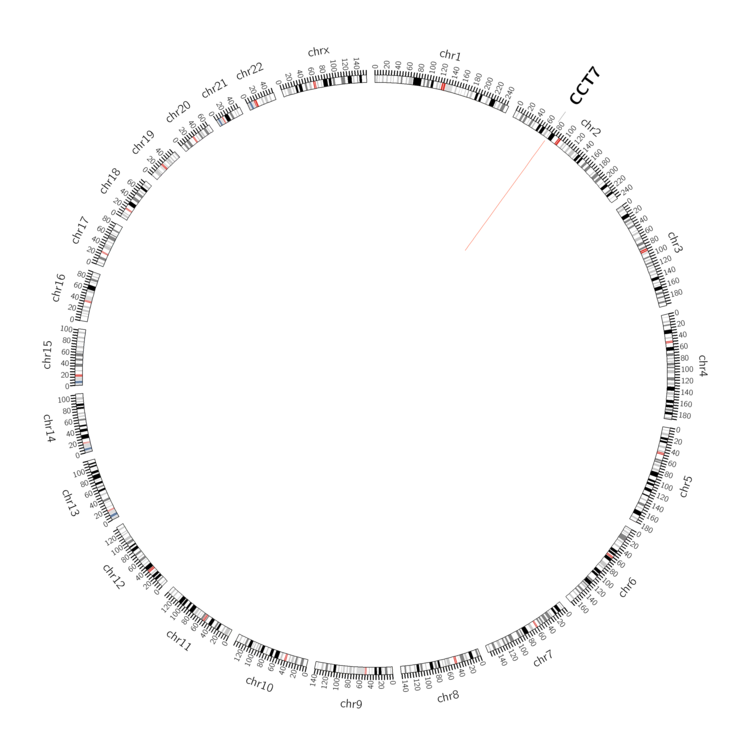 |
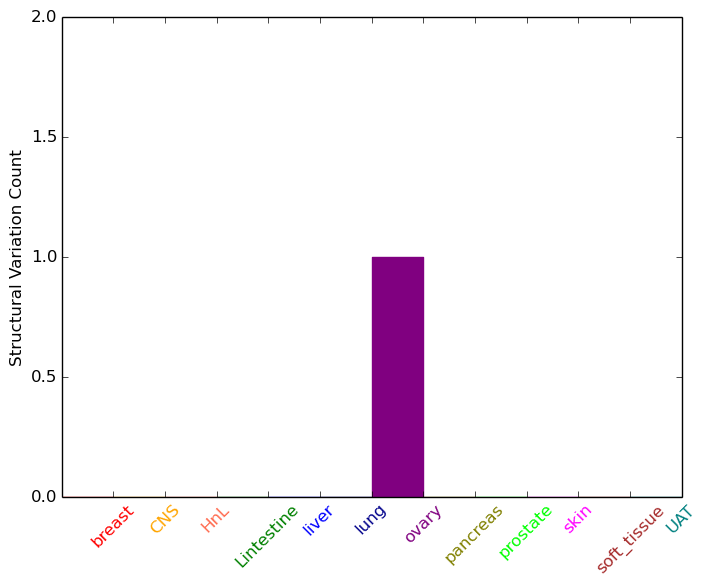
| - For Inter-chromosomal Variations |
| There's no inter-chromosomal structural variation. |
| - For Intra-chromosomal Variations |
| * Intra-chromosomal variantions includes 'intrachromosomal amplicon to amplicon', 'intrachromosomal amplicon to non-amplified dna', 'intrachromosomal deletion', 'intrachromosomal fold-back inversion', 'intrachromosomal inversion', 'intrachromosomal tandem duplication', 'Intrachromosomal unknown type', 'intrachromosomal with inverted orientation', 'intrachromosomal with non-inverted orientation'. |
 |
| Sample | Symbol_a | Chr_a | Start_a | End_a | Symbol_b | Chr_b | Start_b | End_b |
| ovary | CCT7 | chr2 | 73479281 | 73479301 | CCT7 | chr2 | 73477080 | 73477100 |
| cf) Tissue number; Tissue name (1;Breast, 2;Central_nervous_system, 3;Haematopoietic_and_lymphoid_tissue, 4;Large_intestine, 5;Liver, 6;Lung, 7;Ovary, 8;Pancreas, 9;Prostate, 10;Skin, 11;Soft_tissue, 12;Upper_aerodigestive_tract) |
| * From mRNA Sanger sequences, Chitars2.0 arranged chimeric transcripts. This table shows CCT7 related fusion information. |
| ID | Head Gene | Tail Gene | Accession | Gene_a | qStart_a | qEnd_a | Chromosome_a | tStart_a | tEnd_a | Gene_a | qStart_a | qEnd_a | Chromosome_a | tStart_a | tEnd_a |
| AA192763 | CCT7 | 1 | 77 | 2 | 73474927 | 73475003 | CCT7 | 74 | 176 | 2 | 73475026 | 73476192 | |
| BE295614 | RIMS3 | 1 | 163 | 1 | 41088634 | 41088797 | CCT7 | 161 | 439 | 2 | 73474958 | 73476304 | |
| BF818027 | HLA-B | 18 | 253 | 6 | 2628575 | 2628815 | CCT7 | 249 | 461 | 2 | 73461456 | 73466923 | |
| BM423518 | SMAP2 | 1 | 507 | 1 | 40882451 | 40887836 | CCT7 | 508 | 778 | 2 | 73479862 | 73480133 | |
| AW410065 | RIMS3 | 19 | 202 | 1 | 41088634 | 41088817 | CCT7 | 200 | 543 | 2 | 73474958 | 73477007 | |
| AW410067 | RIMS3 | 19 | 202 | 1 | 41088634 | 41088817 | CCT7 | 200 | 483 | 2 | 73474958 | 73476308 | |
| AI183764 | CCT7 | 15 | 205 | 2 | 73479943 | 73480133 | MOSPD3 | 204 | 298 | 7 | 100211226 | 100211320 | |
| BI113920 | RIMS3 | 183 | 202 | 1 | 41088608 | 41088627 | CCT7 | 202 | 650 | 2 | 73474979 | 73477515 | |
| BM809370 | SMAP2 | 23 | 529 | 1 | 40882451 | 40887836 | CCT7 | 530 | 801 | 2 | 73479862 | 73480133 | |
| BM915408 | SMAP2 | 1 | 506 | 1 | 40882451 | 40887835 | CCT7 | 507 | 778 | 2 | 73479862 | 73480133 | |
| BQ646179 | ENO1 | 39 | 575 | 1 | 8921061 | 8923343 | CCT7 | 575 | 790 | 2 | 73461450 | 73466921 | |
| CV324589 | CCT7 | 18 | 220 | 2 | 73477010 | 73478390 | CCT7 | 216 | 486 | 2 | 73478406 | 73479883 | |
| Top |
| Mutation type/ Tissue ID | brca | cns | cerv | endome | haematopo | kidn | Lintest | liver | lung | ns | ovary | pancre | prost | skin | stoma | thyro | urina | |||
| Total # sample | 1 | |||||||||||||||||||
| GAIN (# sample) | 1 | |||||||||||||||||||
| LOSS (# sample) |
| cf) Tissue ID; Tissue type (1; Breast, 2; Central_nervous_system, 3; Cervix, 4; Endometrium, 5; Haematopoietic_and_lymphoid_tissue, 6; Kidney, 7; Large_intestine, 8; Liver, 9; Lung, 10; NS, 11; Ovary, 12; Pancreas, 13; Prostate, 14; Skin, 15; Stomach, 16; Thyroid, 17; Urinary_tract) |
| Top |
|
 |
| Top |
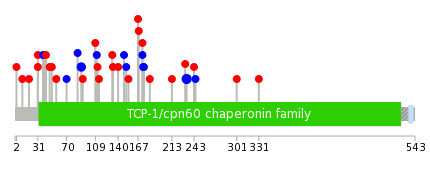
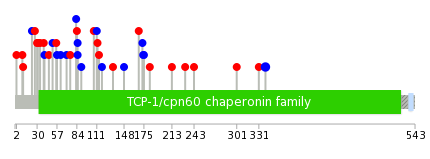
| Stat. for Non-Synonymous SNVs (# total SNVs=20) | (# total SNVs=12) |
 |  |
(# total SNVs=0) | (# total SNVs=0) |
| Top |
| * When you move the cursor on each content, you can see more deailed mutation information on the Tooltip. Those are primary_site,primary_histology,mutation(aa),pubmedID. |
| GRCh37 position | Mutation(aa) | Unique sampleID count |
| chr2:73478461-73478461 | p.A233A | 3 |
| chr2:73479988-73479988 | p.*340* | 2 |
| chr2:73476217-73476217 | p.P90P | 2 |
| chr2:73474975-73474975 | p.P31R | 1 |
| chr2:73476273-73476273 | p.R109P | 1 |
| chr2:73477475-73477475 | p.T167N | 1 |
| chr2:73474997-73474997 | p.V38V | 1 |
| chr2:73478490-73478490 | p.R243H | 1 |
| chr2:73476280-73476280 | p.P111P | 1 |
| chr2:73477477-73477477 | p.F168L | 1 |
| Top |
|
 |
| Point Mutation/ Tissue ID | 1 | 2 | 3 | 4 | 5 | 6 | 7 | 8 | 9 | 10 | 11 | 12 | 13 | 14 | 15 | 16 | 17 | 18 | 19 | 20 |
| # sample | 1 | 1 | 1 | 4 | 1 | 1 | 6 | 4 | 1 | 3 | 8 | 7 | ||||||||
| # mutation | 1 | 1 | 1 | 4 | 1 | 1 | 7 | 4 | 1 | 3 | 8 | 7 | ||||||||
| nonsynonymous SNV | 1 | 1 | 1 | 1 | 3 | 2 | 1 | 1 | 4 | 6 | ||||||||||
| synonymous SNV | 1 | 1 | 3 | 4 | 2 | 2 | 4 | 1 |
| cf) Tissue ID; Tissue type (1; BLCA[Bladder Urothelial Carcinoma], 2; BRCA[Breast invasive carcinoma], 3; CESC[Cervical squamous cell carcinoma and endocervical adenocarcinoma], 4; COAD[Colon adenocarcinoma], 5; GBM[Glioblastoma multiforme], 6; Glioma Low Grade, 7; HNSC[Head and Neck squamous cell carcinoma], 8; KICH[Kidney Chromophobe], 9; KIRC[Kidney renal clear cell carcinoma], 10; KIRP[Kidney renal papillary cell carcinoma], 11; LAML[Acute Myeloid Leukemia], 12; LUAD[Lung adenocarcinoma], 13; LUSC[Lung squamous cell carcinoma], 14; OV[Ovarian serous cystadenocarcinoma ], 15; PAAD[Pancreatic adenocarcinoma], 16; PRAD[Prostate adenocarcinoma], 17; SKCM[Skin Cutaneous Melanoma], 18:STAD[Stomach adenocarcinoma], 19:THCA[Thyroid carcinoma], 20:UCEC[Uterine Corpus Endometrial Carcinoma]) |
| Top |
| * We represented just top 10 SNVs. When you move the cursor on each content, you can see more deailed mutation information on the Tooltip. Those are primary_site, primary_histology, mutation(aa), pubmedID. |
| Genomic Position | Mutation(aa) | Unique sampleID count |
| chr2:73479988 | p.X340X,CCT7 | 2 |
| chr2:73476280 | p.L40L,CCT7 | 1 |
| chr2:73466844 | p.I231T,CCT7 | 1 |
| chr2:73478454 | p.S27N | 1 |
| chr2:73471736 | p.E34K | 1 |
| chr2:73476281 | p.V56A,CCT7 | 1 |
| chr2:73466864 | p.R243H,CCT7 | 1 |
| chr2:73478490 | p.D46N,CCT7 | 1 |
| chr2:73471807 | p.L70L,CCT7 | 1 |
| chr2:73476288 | p.A301T,CCT7 | 1 |
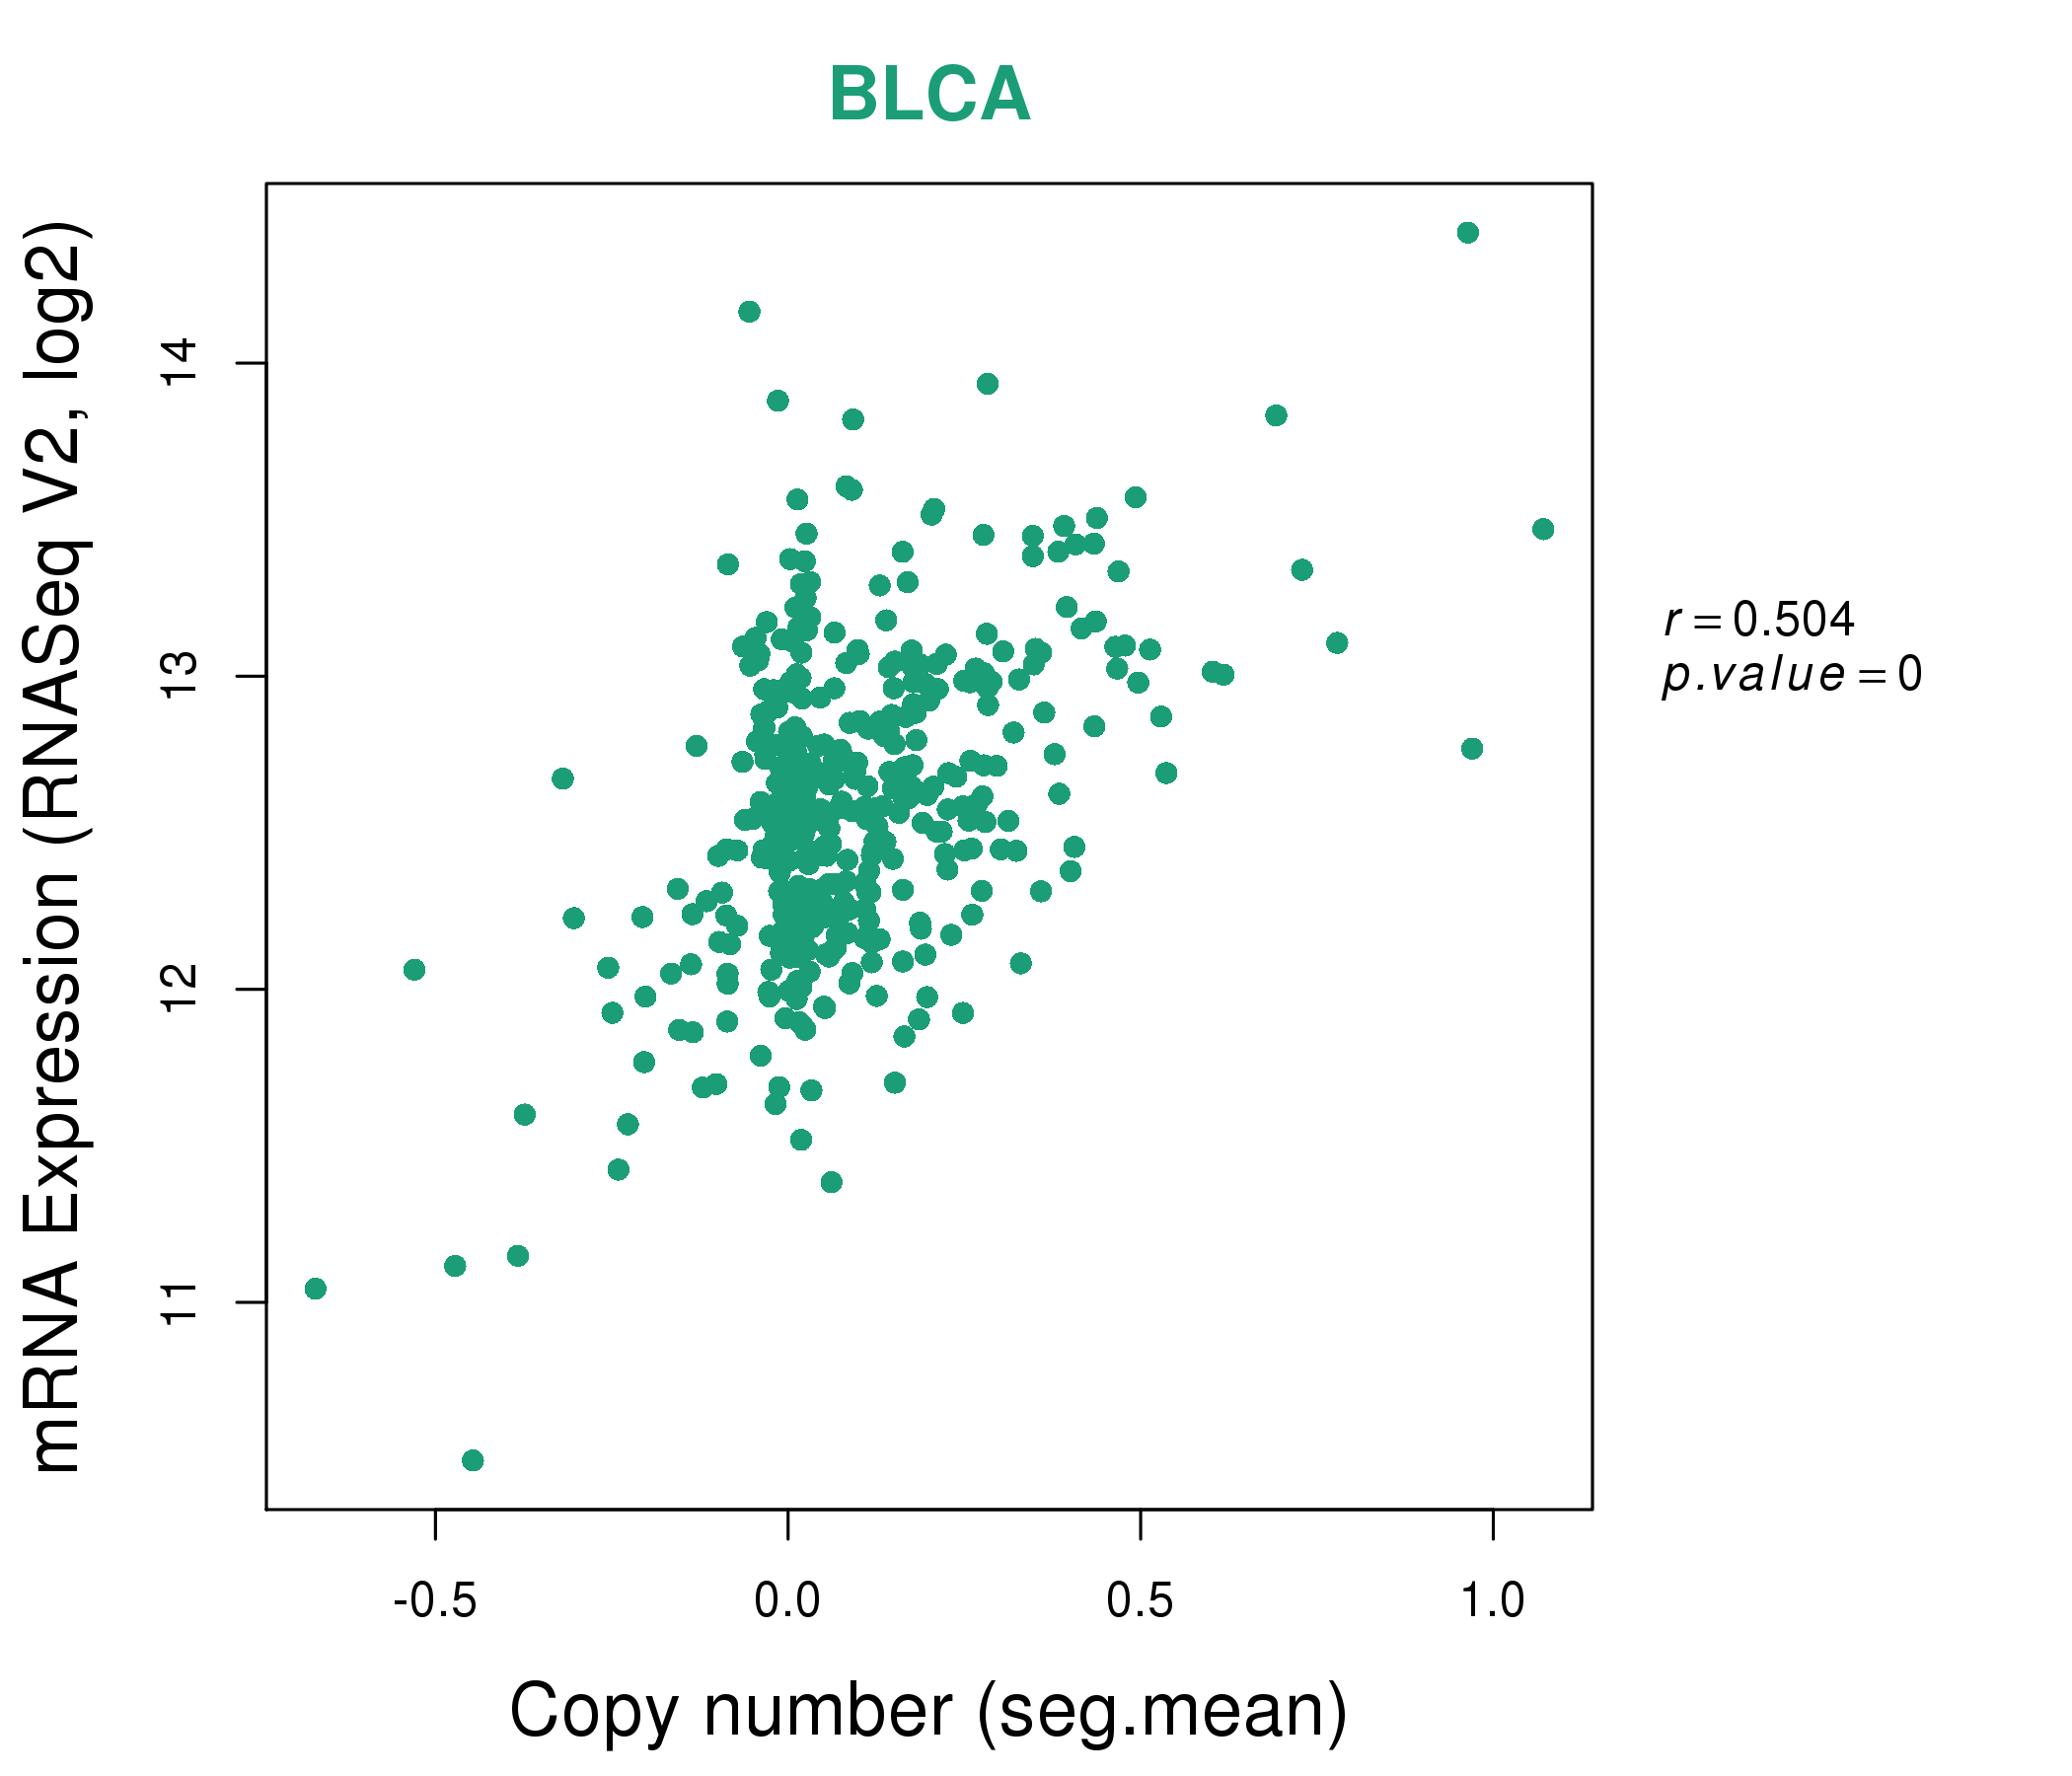
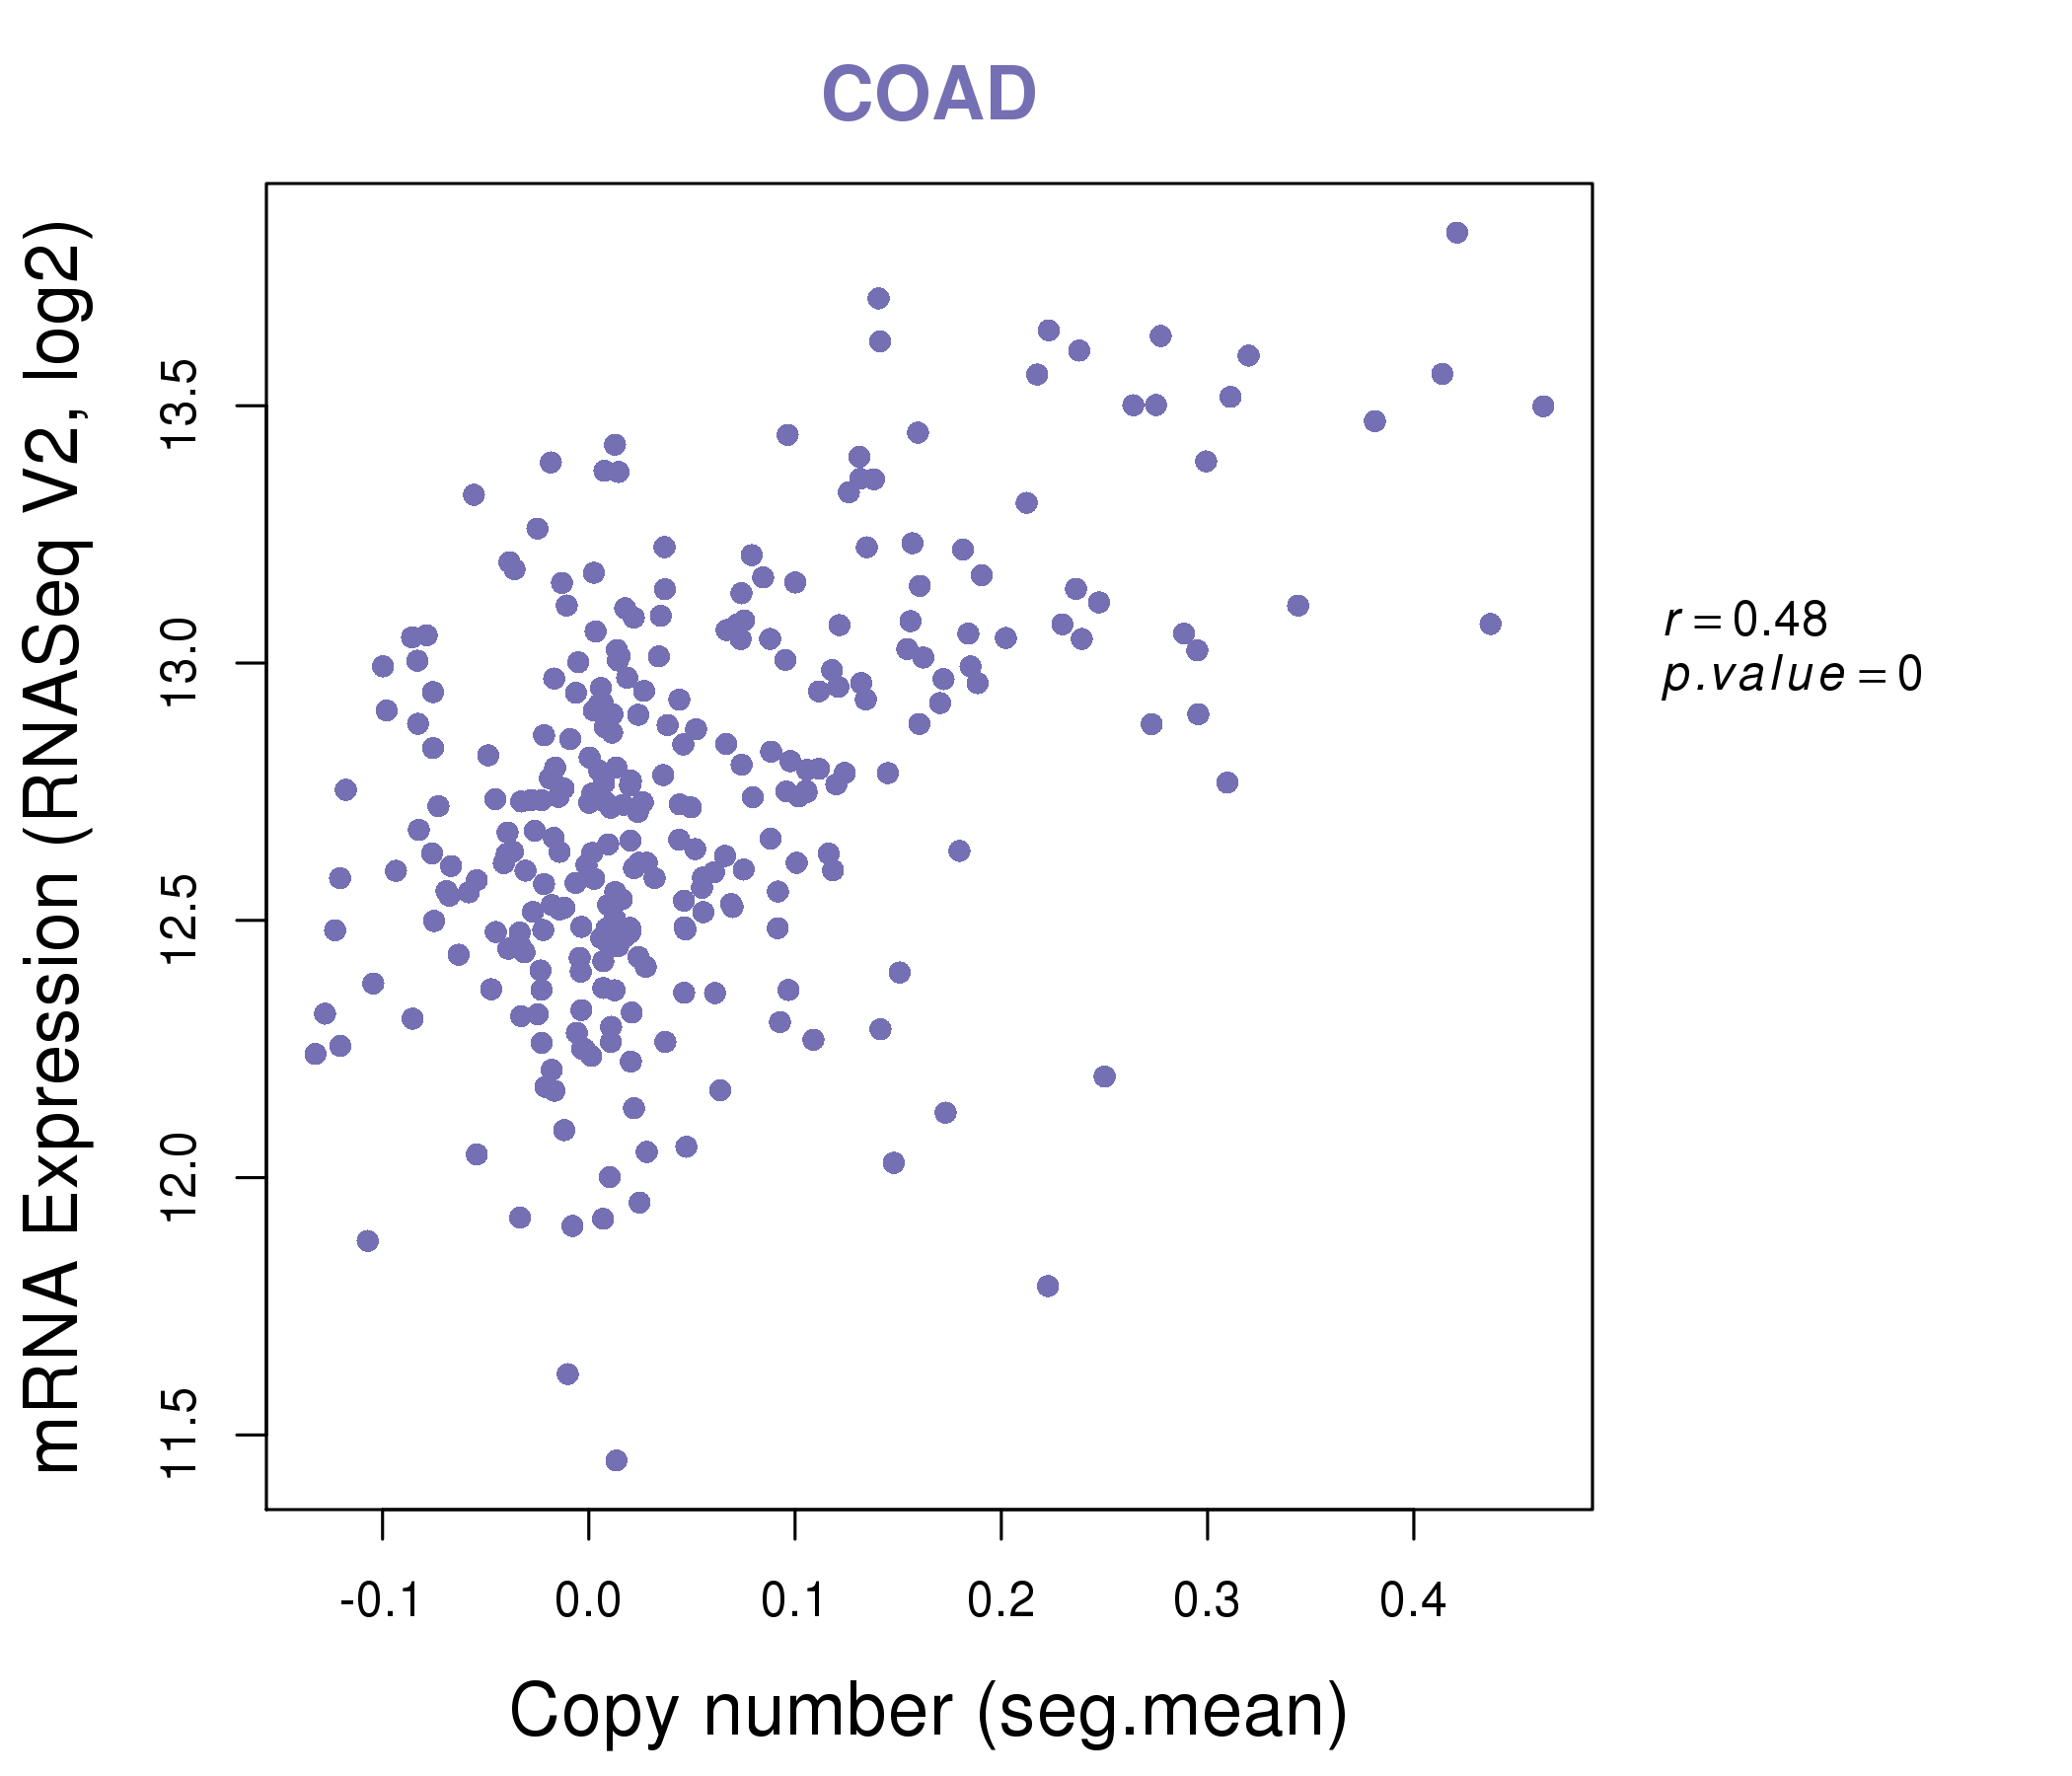
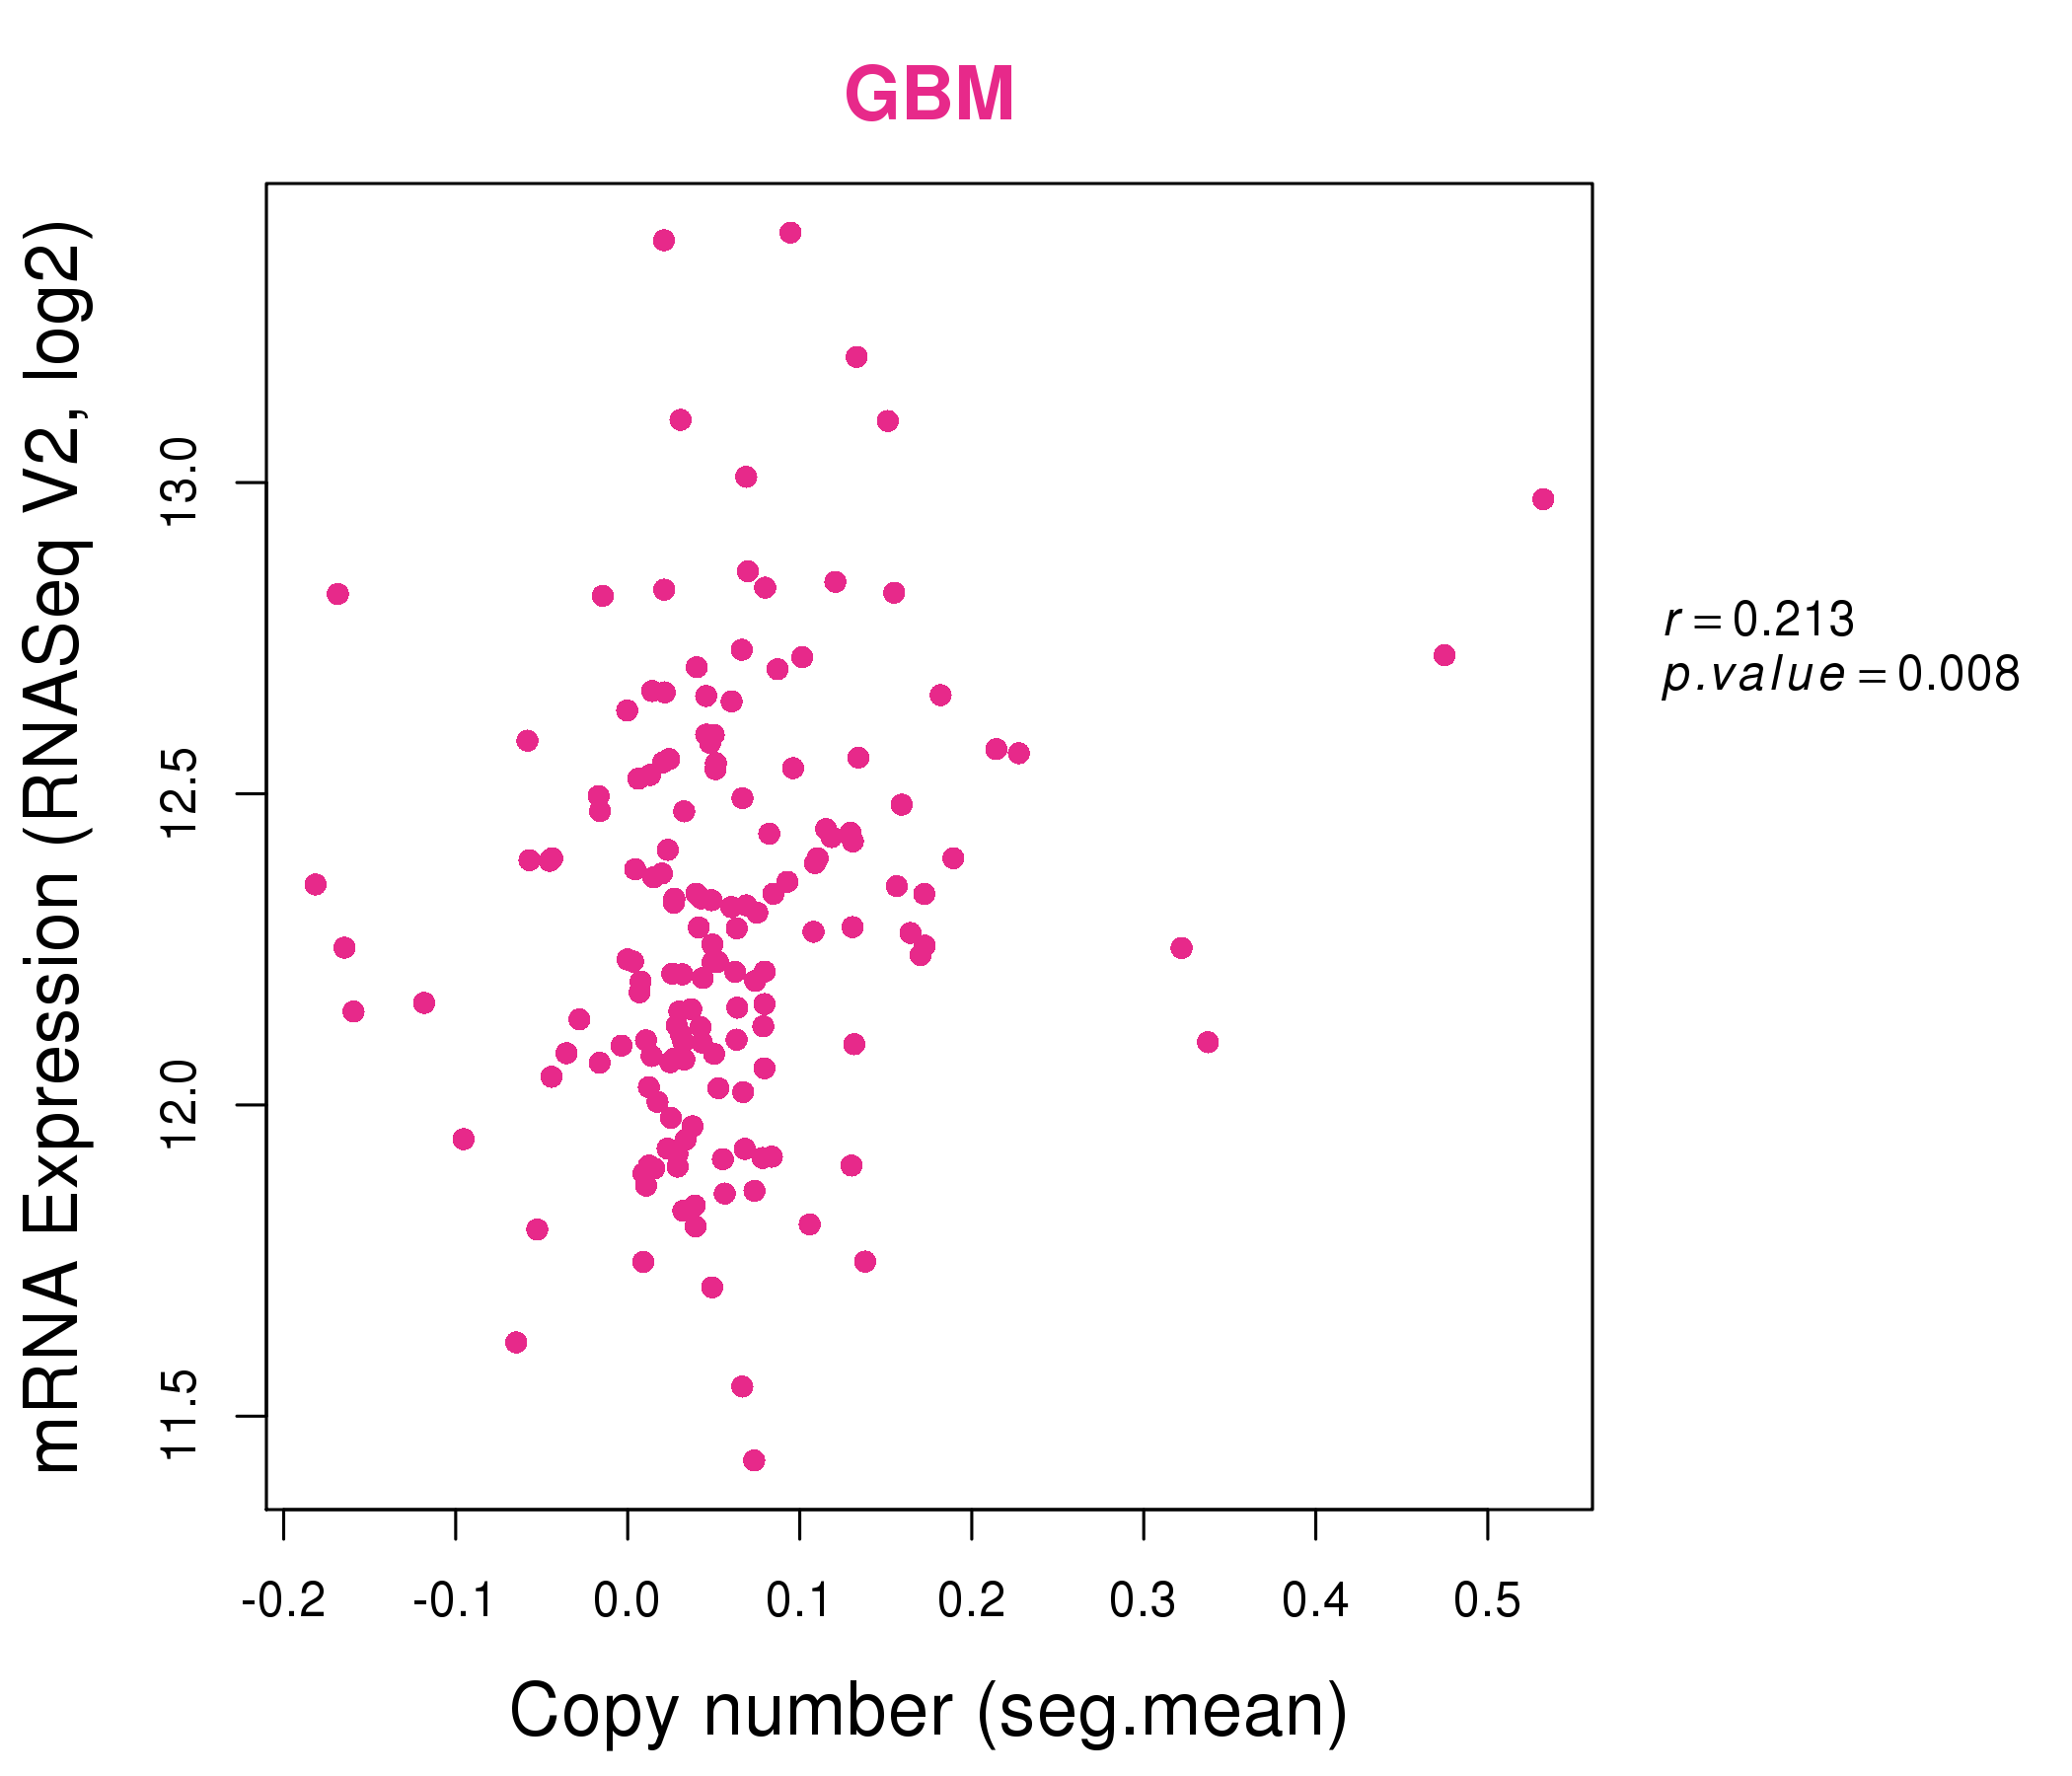
| * Copy number data were extracted from TCGA using R package TCGA-Assembler. The URLs of all public data files on TCGA DCC data server were gathered on Jan-05-2015. Function ProcessCNAData in TCGA-Assembler package was used to obtain gene-level copy number value which is calculated as the average copy number of the genomic region of a gene. |
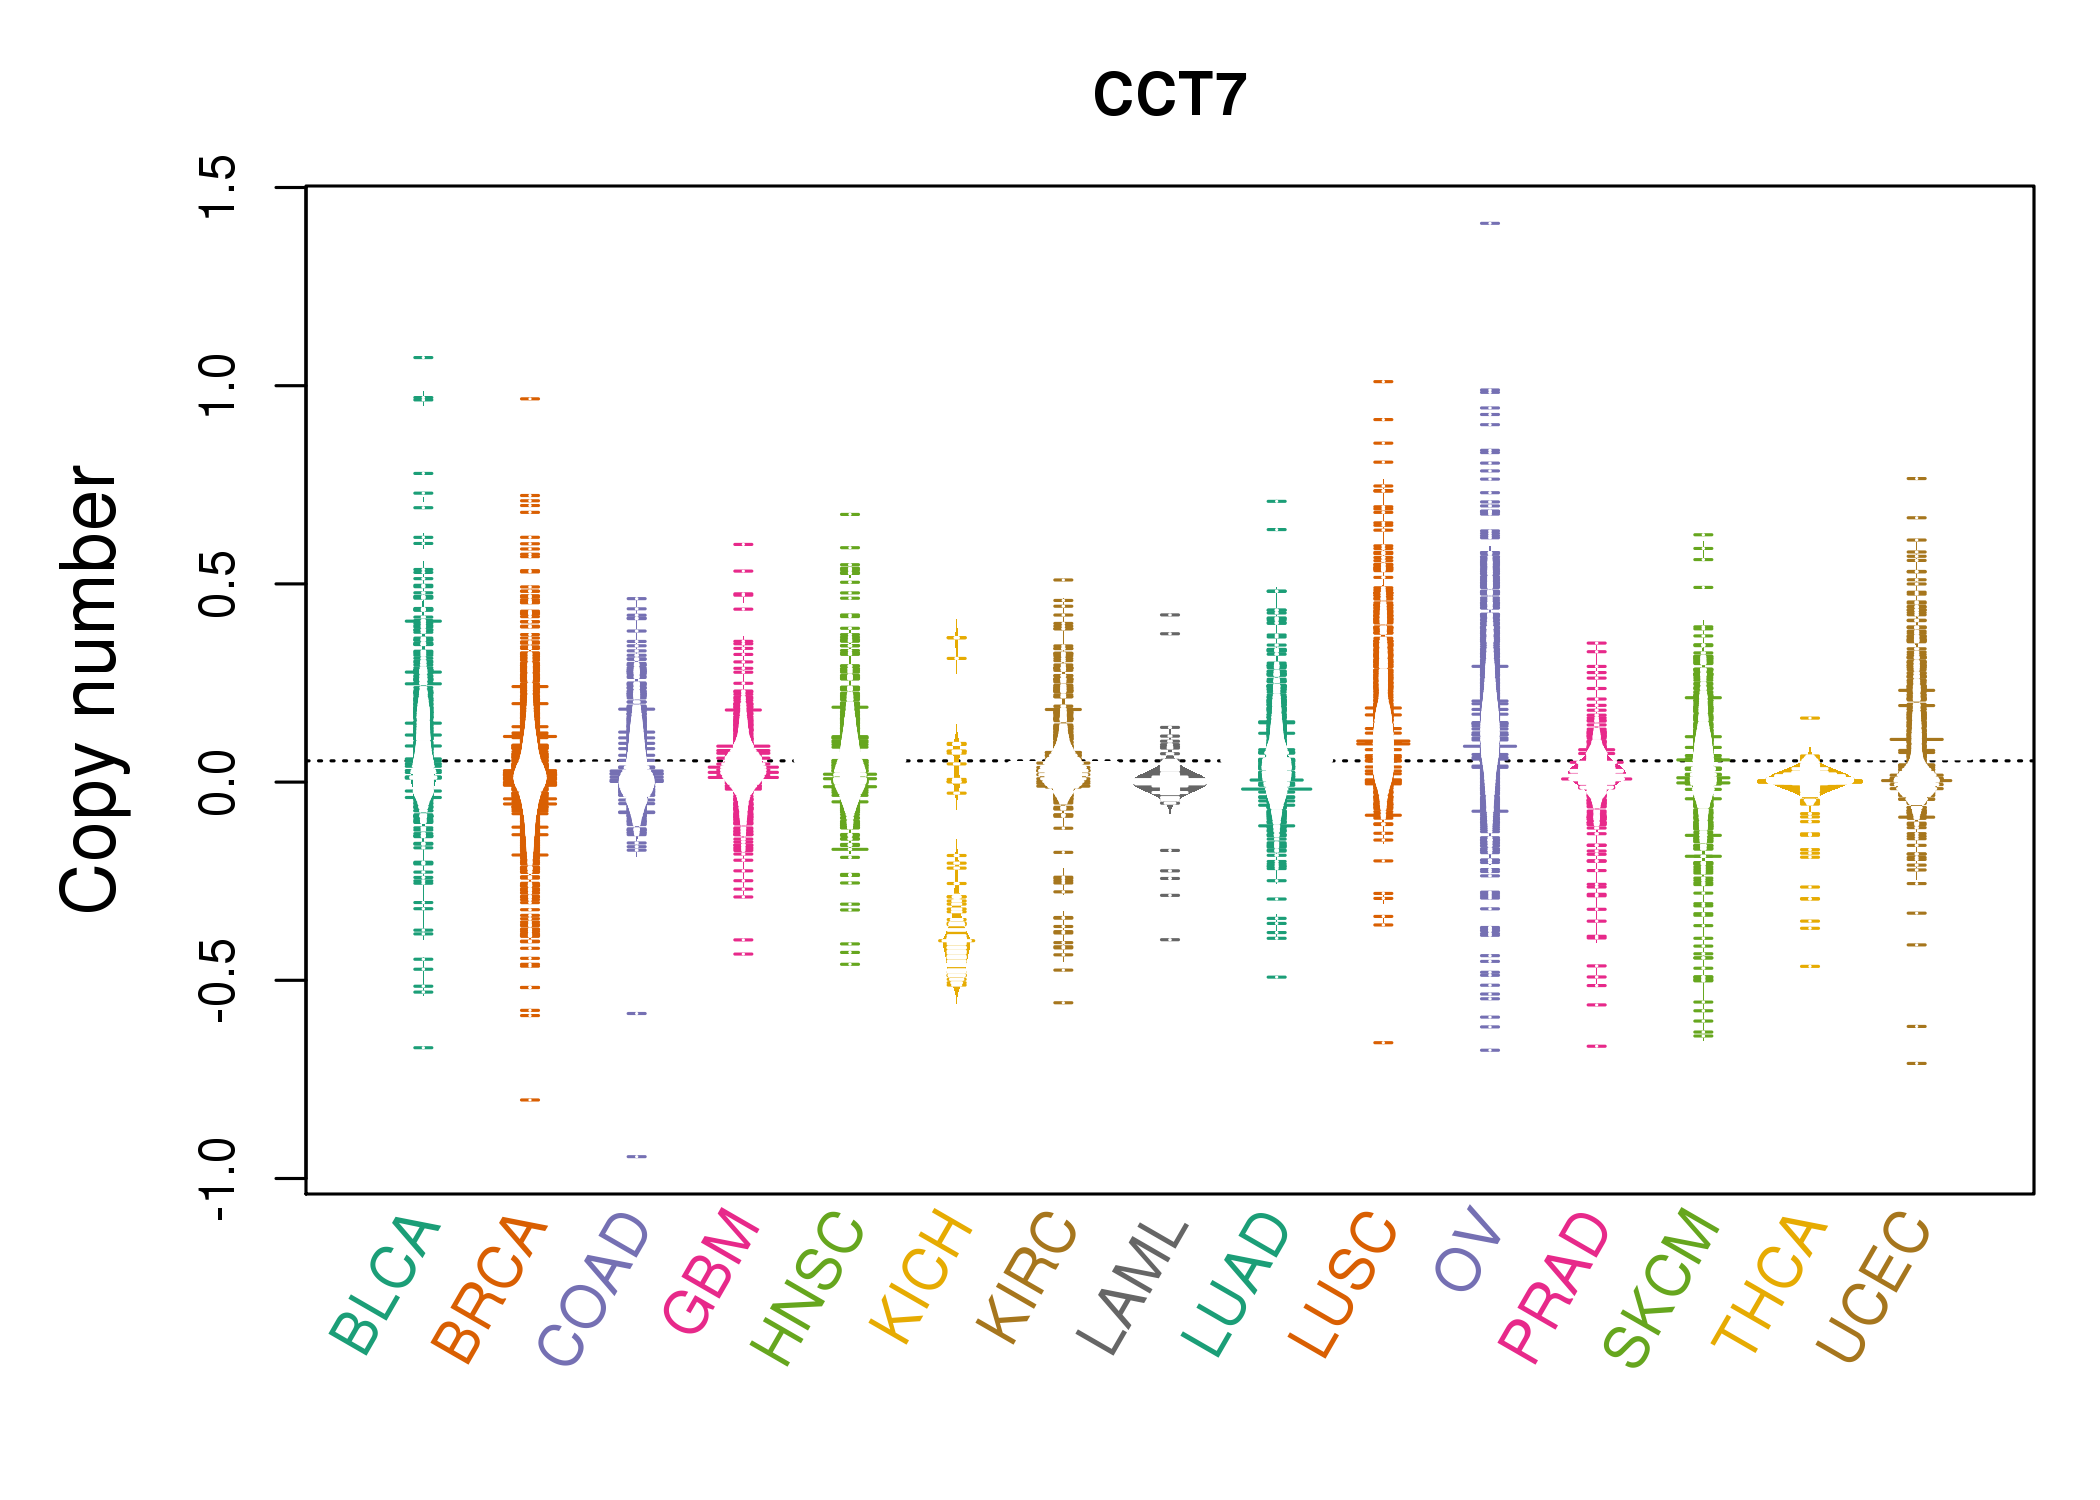 |
| cf) Tissue ID[Tissue type]: BLCA[Bladder Urothelial Carcinoma], BRCA[Breast invasive carcinoma], CESC[Cervical squamous cell carcinoma and endocervical adenocarcinoma], COAD[Colon adenocarcinoma], GBM[Glioblastoma multiforme], Glioma Low Grade, HNSC[Head and Neck squamous cell carcinoma], KICH[Kidney Chromophobe], KIRC[Kidney renal clear cell carcinoma], KIRP[Kidney renal papillary cell carcinoma], LAML[Acute Myeloid Leukemia], LUAD[Lung adenocarcinoma], LUSC[Lung squamous cell carcinoma], OV[Ovarian serous cystadenocarcinoma ], PAAD[Pancreatic adenocarcinoma], PRAD[Prostate adenocarcinoma], SKCM[Skin Cutaneous Melanoma], STAD[Stomach adenocarcinoma], THCA[Thyroid carcinoma], UCEC[Uterine Corpus Endometrial Carcinoma] |
| Top |
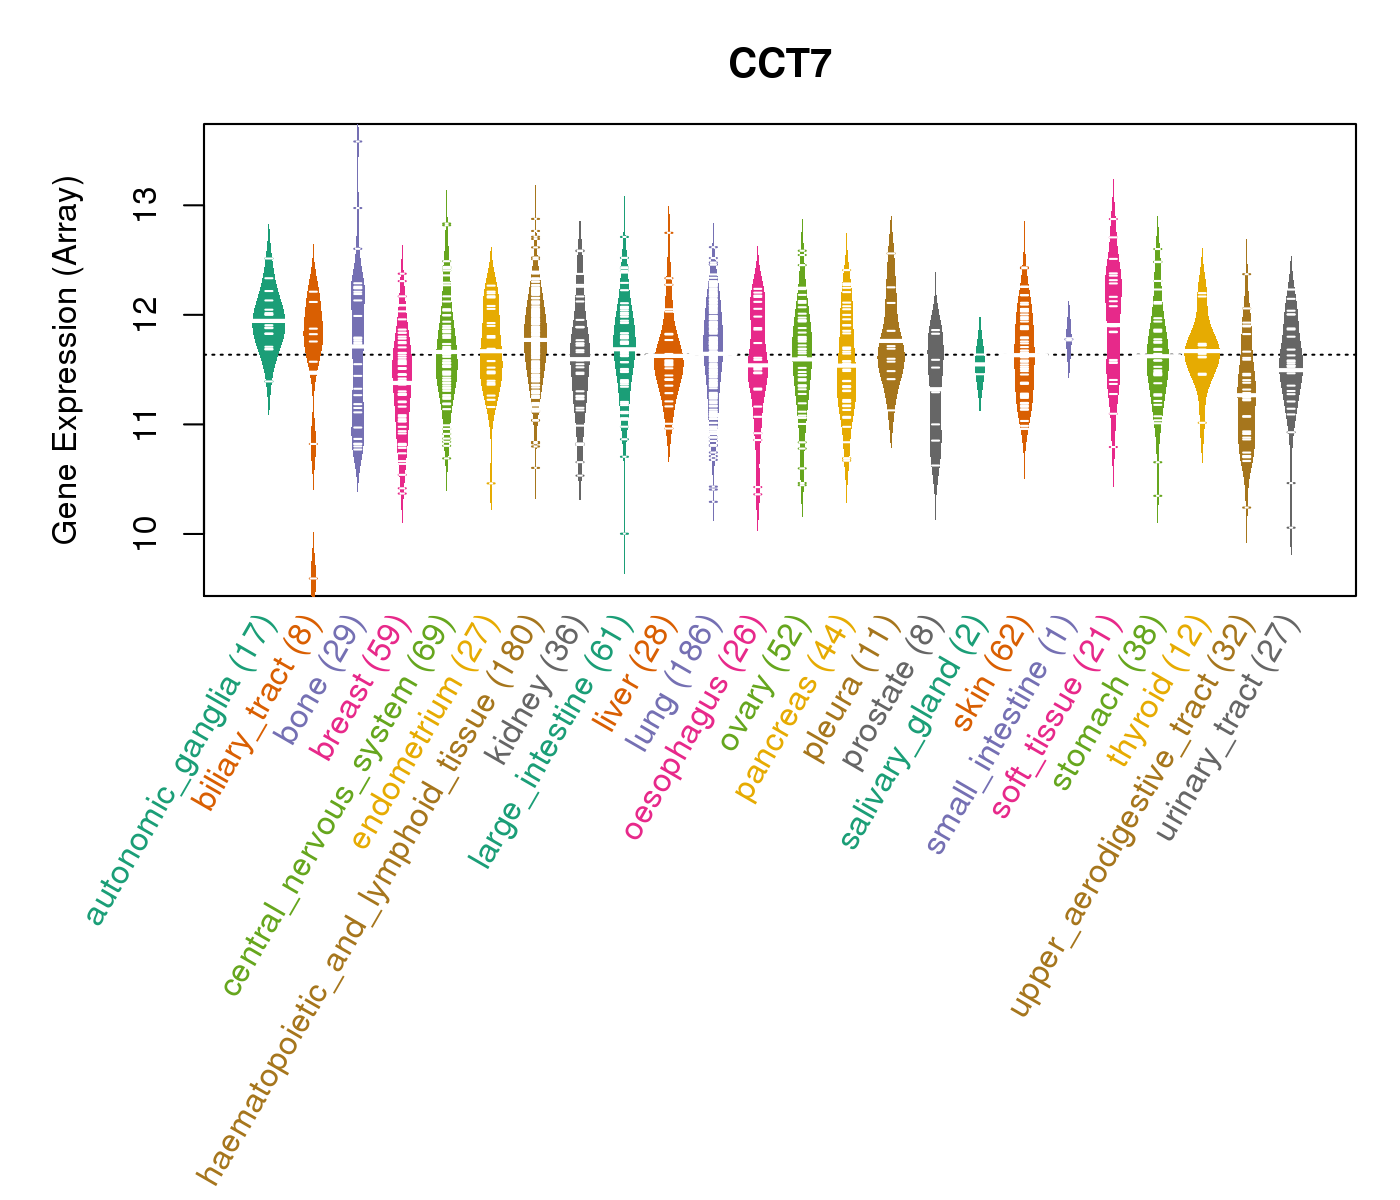
| Gene Expression for CCT7 |
| * CCLE gene expression data were extracted from CCLE_Expression_Entrez_2012-10-18.res: Gene-centric RMA-normalized mRNA expression data. |
 |
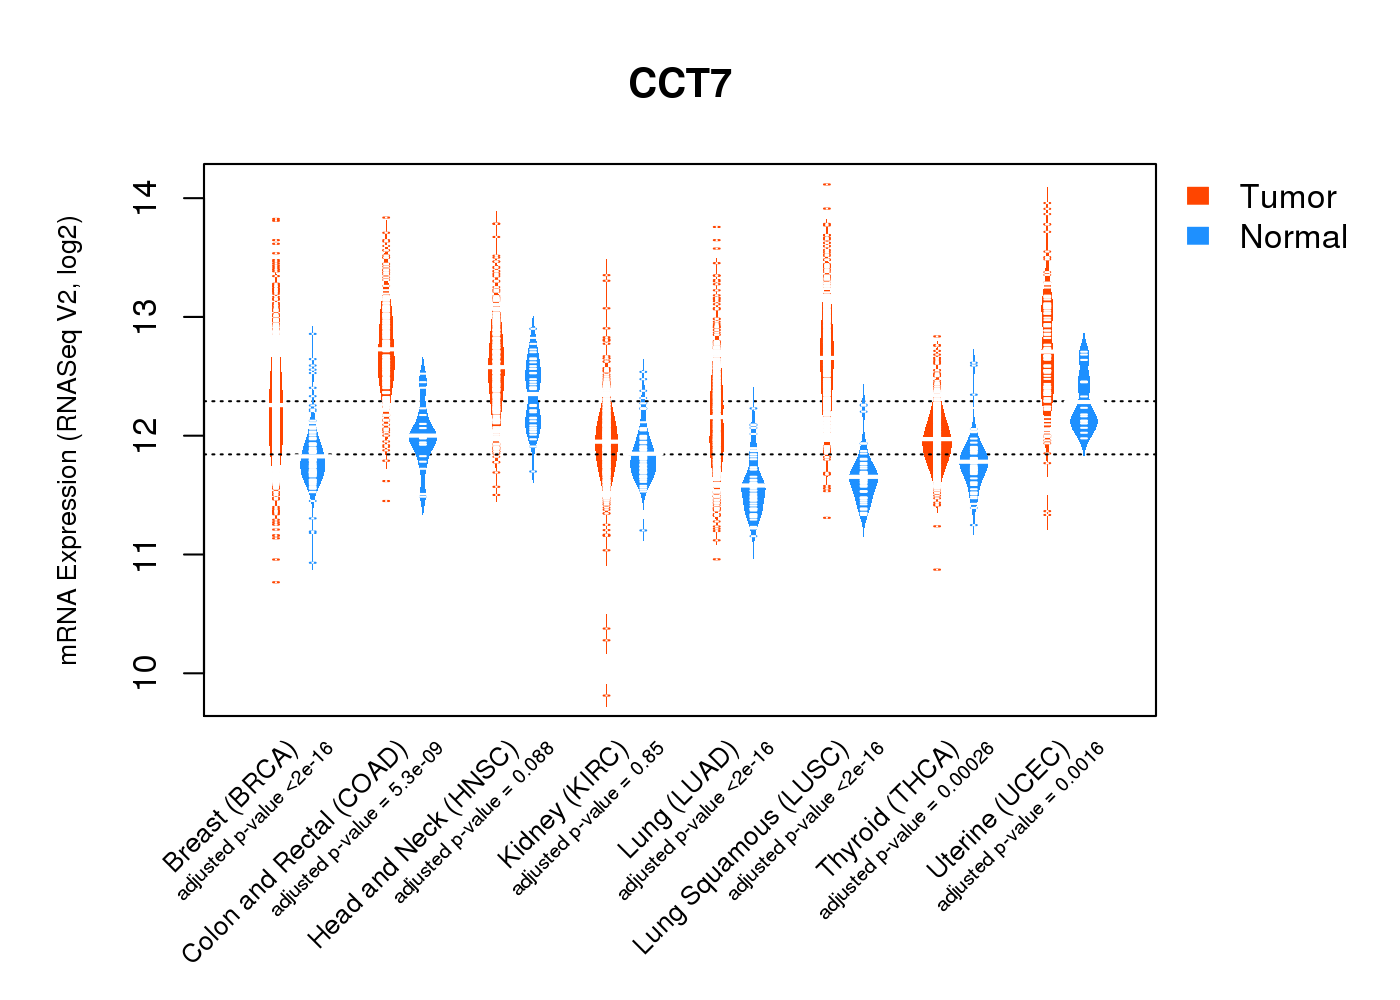
| * Normalized gene expression data of RNASeqV2 was extracted from TCGA using R package TCGA-Assembler. The URLs of all public data files on TCGA DCC data server were gathered at Jan-05-2015. Only eight cancer types have enough normal control samples for differential expression analysis. (t test, adjusted p<0.05 (using Benjamini-Hochberg FDR)) |
 |
| Top |
| * This plots show the correlation between CNV and gene expression. |
: Open all plots for all cancer types
 |
|
 |
|

| Top |
| Gene-Gene Network Information |
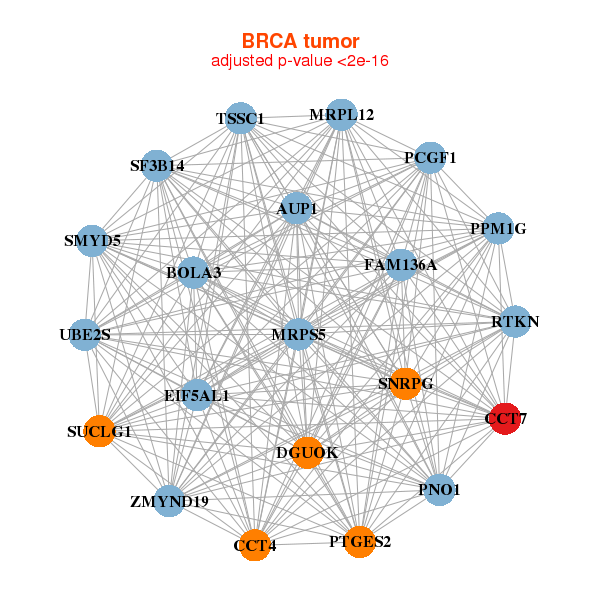
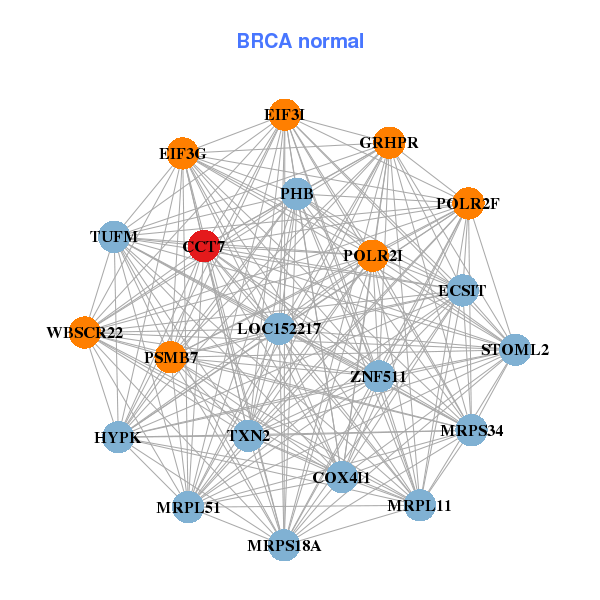
| * Co-Expression network figures were drawn using R package igraph. Only the top 20 genes with the highest correlations were shown. Red circle: input gene, orange circle: cell metabolism gene, sky circle: other gene |
: Open all plots for all cancer types
 |
|
| AUP1,BOLA3,CCT4,CCT7,DGUOK,EIF5AL1,FAM136A, MRPL12,MRPS5,PCGF1,PNO1,PPM1G,PTGES2,RTKN, SF3B14,SMYD5,SNRPG,SUCLG1,TSSC1,UBE2S,ZMYND19 | HYPK,CCT7,COX4I1,ECSIT,EIF3G,EIF3I,GRHPR, LOC152217,MRPL11,MRPL51,MRPS18A,MRPS34,PHB,POLR2F, POLR2I,PSMB7,STOML2,TUFM,TXN2,WBSCR22,ZNF511 |
 |
|
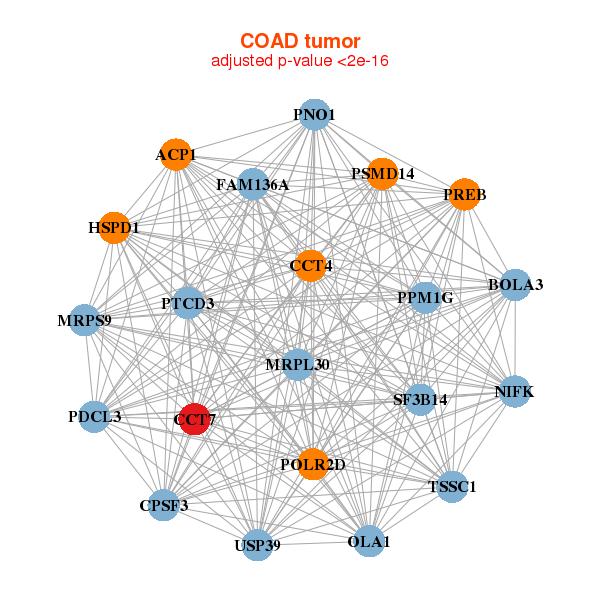
| ACP1,BOLA3,CCT4,CCT7,CPSF3,FAM136A,HSPD1, NIFK,MRPL30,MRPS9,OLA1,PDCL3,PNO1,POLR2D, PPM1G,PREB,PSMD14,PTCD3,SF3B14,TSSC1,USP39 | ATXN10,CMSS1,CCT3,CCT4,CCT7,CDK4,EBNA1BP2, EIF3I,NHP2L1,NME1,NPM1,NPM3,PA2G4,PARK7, PRMT1,PSMB5,PSMC3,RAN,RANBP1,TUBA1B,XRCC6 |
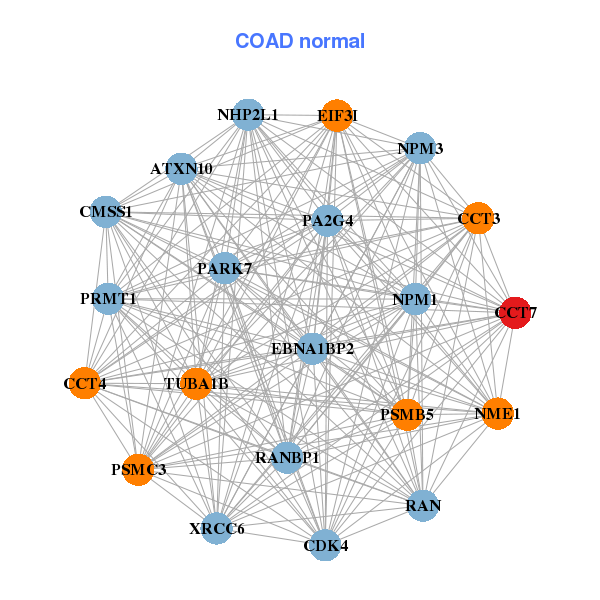
| * Co-Expression network figures were drawn using R package igraph. Only the top 20 genes with the highest correlations were shown. Red circle: input gene, orange circle: cell metabolism gene, sky circle: other gene |
: Open all plots for all cancer types
| Top |
: Open all interacting genes' information including KEGG pathway for all interacting genes from DAVID
| Top |
| Pharmacological Information for CCT7 |
| There's no related Drug. |
| Top |
| Cross referenced IDs for CCT7 |
| * We obtained these cross-references from Uniprot database. It covers 150 different DBs, 18 categories. http://www.uniprot.org/help/cross_references_section |
: Open all cross reference information
|
Copyright © 2016-Present - The Univsersity of Texas Health Science Center at Houston @ |