|
||||||||||||||||||||||||||||||||||||||||||||||||||||||||||||||||||||||||||||||||||||||||||||||||||||||||||||||||||||||||||||||||||||||||||||||||||||||||||||||||||||||||||||||||||||||||||||||||||||||||||||||||||||||||||||||||||||||||||||||||||||||||||||||||||||||||||||||||||||||||||||||||||||||||||||||||||||||||||
| |
| Phenotypic Information (metabolism pathway, cancer, disease, phenome) |
| |
| |
| Gene-Gene Network Information: Co-Expression Network, Interacting Genes & KEGG |
| |
|


| Gene Summary for CCT4 |
| Basic gene info. | Gene symbol | CCT4 |
| Gene name | chaperonin containing TCP1, subunit 4 (delta) | |
| Synonyms | CCT-DELTA|Cctd|SRB | |
| Cytomap | UCSC genome browser: 2p15 | |
| Genomic location | chr2 :62095261-62115806 | |
| Type of gene | protein-coding | |
| RefGenes | NM_001256721.1, NM_006430.3, | |
| Ensembl id | ENSG00000115484 | |
| Description | T-complex protein 1 subunit deltaTCP-1-deltachaperonin containing t-complex polypeptide 1, delta subunitstimulator of TAR RNA-binding | |
| Modification date | 20141207 | |
| dbXrefs | MIM : 605142 | |
| HGNC : HGNC | ||
| Ensembl : ENSG00000115484 | ||
| HPRD : 05506 | ||
| Vega : OTTHUMG00000152166 | ||
| Protein | UniProt: go to UniProt's Cross Reference DB Table | |
| Expression | CleanEX: HS_CCT4 | |
| BioGPS: 10575 | ||
| Gene Expression Atlas: ENSG00000115484 | ||
| The Human Protein Atlas: ENSG00000115484 | ||
| Pathway | NCI Pathway Interaction Database: CCT4 | |
| KEGG: CCT4 | ||
| REACTOME: CCT4 | ||
| ConsensusPathDB | ||
| Pathway Commons: CCT4 | ||
| Metabolism | MetaCyc: CCT4 | |
| HUMANCyc: CCT4 | ||
| Regulation | Ensembl's Regulation: ENSG00000115484 | |
| miRBase: chr2 :62,095,261-62,115,806 | ||
| TargetScan: NM_001256721 | ||
| cisRED: ENSG00000115484 | ||
| Context | iHOP: CCT4 | |
| cancer metabolism search in PubMed: CCT4 | ||
| UCL Cancer Institute: CCT4 | ||
| Assigned class in ccmGDB | C | |
| Top |
| Phenotypic Information for CCT4(metabolism pathway, cancer, disease, phenome) |
| Cancer | CGAP: CCT4 |
| Familial Cancer Database: CCT4 | |
| * This gene is included in those cancer gene databases. |
|
|
|
|
|
| . | ||||||||||||||||||||||||||||||||||||||||||||||||||||||||||||||||||||||||||||||||||||||||||||||||||||||||||||||||||||||||||||||||||||||||||||||||||||||||||||||||||||||||||||||||||||||||||||||||||||||||||||||||||||||||||||||||||||||||||||||||||||||||||||||||||||||||||||||||||||||||||||||||||||||||||||||||||||
Oncogene 1 | Significant driver gene in | |||||||||||||||||||||||||||||||||||||||||||||||||||||||||||||||||||||||||||||||||||||||||||||||||||||||||||||||||||||||||||||||||||||||||||||||||||||||||||||||||||||||||||||||||||||||||||||||||||||||||||||||||||||||||||||||||||||||||||||||||||||||||||||||||||||||||||||||||||||||||||||||||||||||||||||||||||||||||
| cf) number; DB name 1 Oncogene; http://nar.oxfordjournals.org/content/35/suppl_1/D721.long, 2 Tumor Suppressor gene; https://bioinfo.uth.edu/TSGene/, 3 Cancer Gene Census; http://www.nature.com/nrc/journal/v4/n3/abs/nrc1299.html, 4 CancerGenes; http://nar.oxfordjournals.org/content/35/suppl_1/D721.long, 5 Network of Cancer Gene; http://ncg.kcl.ac.uk/index.php, 1Therapeutic Vulnerabilities in Cancer; http://cbio.mskcc.org/cancergenomics/statius/ |
| REACTOME_METABOLISM_OF_PROTEINS | |
| OMIM | |
| Orphanet | |
| Disease | KEGG Disease: CCT4 |
| MedGen: CCT4 (Human Medical Genetics with Condition) | |
| ClinVar: CCT4 | |
| Phenotype | MGI: CCT4 (International Mouse Phenotyping Consortium) |
| PhenomicDB: CCT4 | |
| Mutations for CCT4 |
| * Under tables are showing count per each tissue to give us broad intuition about tissue specific mutation patterns.You can go to the detailed page for each mutation database's web site. |
| - Statistics for Tissue and Mutation type | Top |
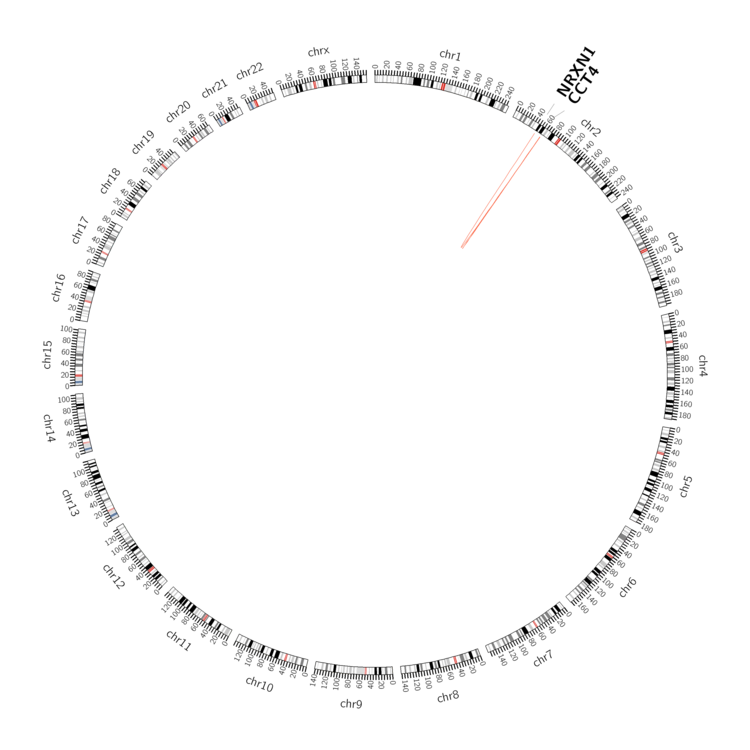 |
| - For Inter-chromosomal Variations |
| There's no inter-chromosomal structural variation. |
| - For Intra-chromosomal Variations |
| * Intra-chromosomal variantions includes 'intrachromosomal amplicon to amplicon', 'intrachromosomal amplicon to non-amplified dna', 'intrachromosomal deletion', 'intrachromosomal fold-back inversion', 'intrachromosomal inversion', 'intrachromosomal tandem duplication', 'Intrachromosomal unknown type', 'intrachromosomal with inverted orientation', 'intrachromosomal with non-inverted orientation'. |
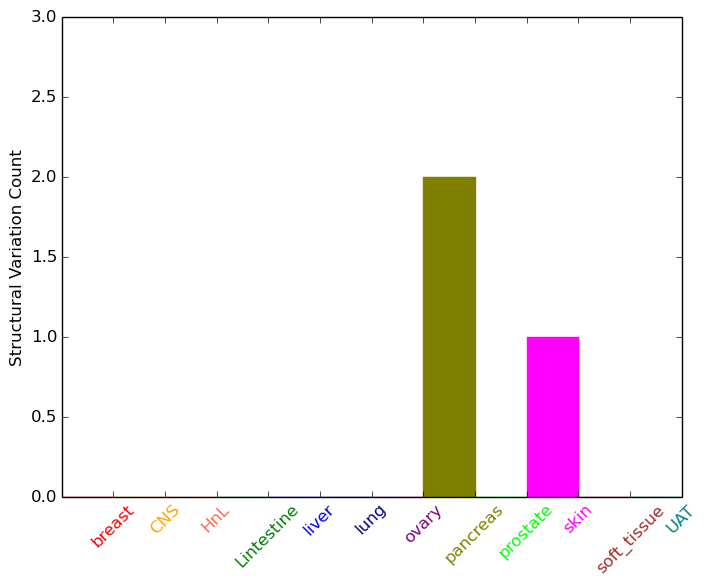 |
| Sample | Symbol_a | Chr_a | Start_a | End_a | Symbol_b | Chr_b | Start_b | End_b |
| pancreas | CCT4 | chr2 | 62095489 | 62095509 | chr2 | 61898722 | 61898742 | |
| pancreas | CCT4 | chr2 | 62102637 | 62102657 | NRXN1 | chr2 | 50374809 | 50374829 |
| skin | CCT4 | chr2 | 62102078 | 62102078 | chr2 | 62465616 | 62465616 |
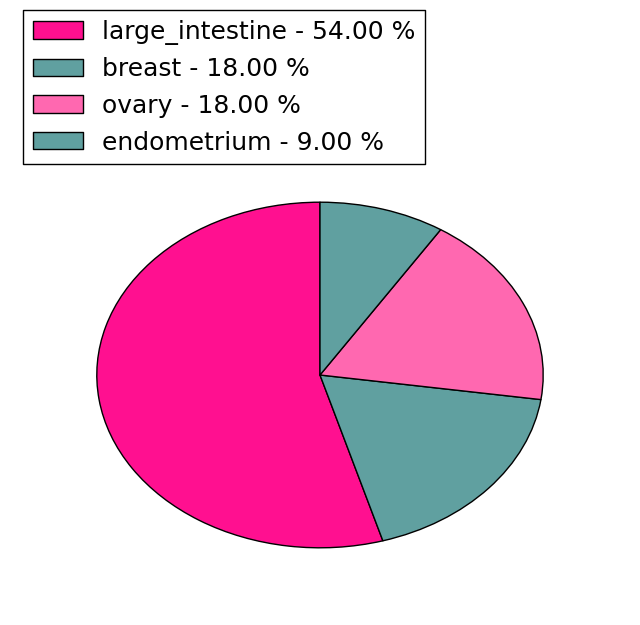
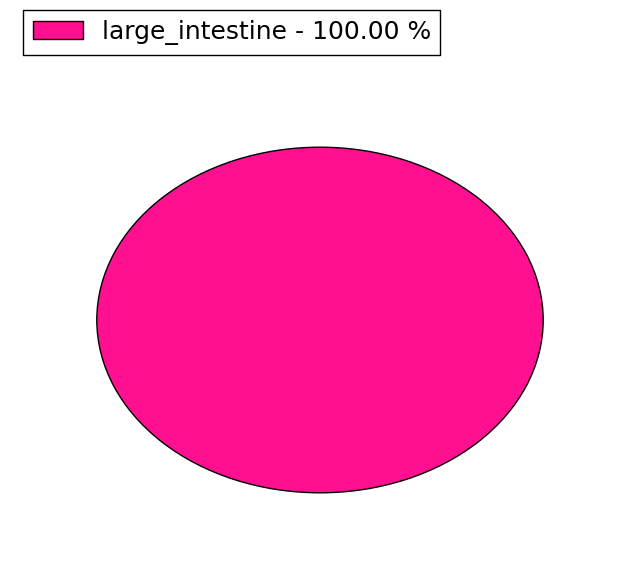
| cf) Tissue number; Tissue name (1;Breast, 2;Central_nervous_system, 3;Haematopoietic_and_lymphoid_tissue, 4;Large_intestine, 5;Liver, 6;Lung, 7;Ovary, 8;Pancreas, 9;Prostate, 10;Skin, 11;Soft_tissue, 12;Upper_aerodigestive_tract) |
| * From mRNA Sanger sequences, Chitars2.0 arranged chimeric transcripts. This table shows CCT4 related fusion information. |
| ID | Head Gene | Tail Gene | Accession | Gene_a | qStart_a | qEnd_a | Chromosome_a | tStart_a | tEnd_a | Gene_a | qStart_a | qEnd_a | Chromosome_a | tStart_a | tEnd_a |
| AI814482 | CCT4 | 1 | 109 | 2 | 62112155 | 62115571 | ATG5 | 109 | 545 | 6 | 106634116 | 106634552 | |
| BE698729 | CLNK | 132 | 156 | 4 | 10602071 | 10602096 | CCT4 | 153 | 218 | 2 | 62095716 | 62095781 | |
| X55330 | CCT4 | 1 | 108 | 2 | 62095580 | 62095687 | AGA | 109 | 2150 | 4 | 178351924 | 178363591 | |
| CB243441 | CCT4 | 14 | 163 | 2 | 62095560 | 62095709 | CCT4 | 158 | 381 | 2 | 62095707 | 62096663 | |
| BM918916 | CCT4 | 31 | 160 | 2 | 62100169 | 62100383 | CCT4 | 159 | 239 | 2 | 62099409 | 62099630 | |
| Top |
| Mutation type/ Tissue ID | brca | cns | cerv | endome | haematopo | kidn | Lintest | liver | lung | ns | ovary | pancre | prost | skin | stoma | thyro | urina | |||
| Total # sample | 1 | |||||||||||||||||||
| GAIN (# sample) | 1 | |||||||||||||||||||
| LOSS (# sample) |
| cf) Tissue ID; Tissue type (1; Breast, 2; Central_nervous_system, 3; Cervix, 4; Endometrium, 5; Haematopoietic_and_lymphoid_tissue, 6; Kidney, 7; Large_intestine, 8; Liver, 9; Lung, 10; NS, 11; Ovary, 12; Pancreas, 13; Prostate, 14; Skin, 15; Stomach, 16; Thyroid, 17; Urinary_tract) |
| Top |
|
 |
| Top |
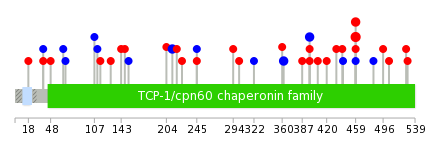
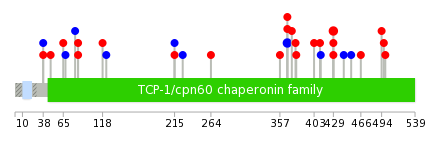
| Stat. for Non-Synonymous SNVs (# total SNVs=29) | (# total SNVs=11) |
 |  |
(# total SNVs=1) | (# total SNVs=0) |
 |
| Top |
| * When you move the cursor on each content, you can see more deailed mutation information on the Tooltip. Those are primary_site,primary_histology,mutation(aa),pubmedID. |
| GRCh37 position | Mutation(aa) | Unique sampleID count |
| chr2:62099331-62099331 | p.E459D | 4 |
| chr2:62099332-62099332 | p.E459G | 3 |
| chr2:62100176-62100176 | p.A362A | 2 |
| chr2:62104536-62104536 | p.K212K | 2 |
| chr2:62099658-62099658 | p.V397V | 2 |
| chr2:62099660-62099660 | p.V397M | 1 |
| chr2:62104157-62104157 | p.E225D | 1 |
| chr2:62110593-62110593 | p.? | 1 |
| chr2:62099690-62099690 | p.T387A | 1 |
| chr2:62104179-62104179 | p.I218T | 1 |
| Top |
|
 |
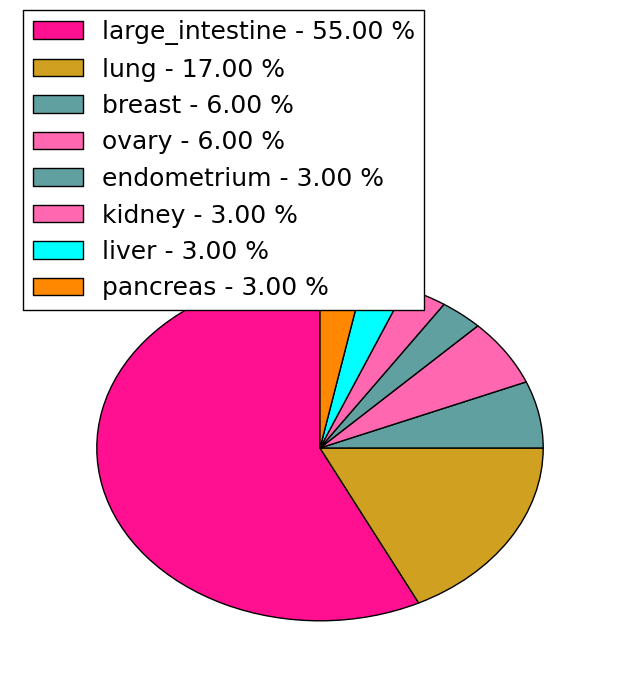
| Point Mutation/ Tissue ID | 1 | 2 | 3 | 4 | 5 | 6 | 7 | 8 | 9 | 10 | 11 | 12 | 13 | 14 | 15 | 16 | 17 | 18 | 19 | 20 |
| # sample | 2 | 14 | 1 | 1 | 5 | 1 | 3 | 4 | 2 | |||||||||||
| # mutation | 3 | 12 | 1 | 1 | 6 | 1 | 3 | 4 | 2 | |||||||||||
| nonsynonymous SNV | 1 | 8 | 1 | 1 | 5 | 2 | 3 | 1 | ||||||||||||
| synonymous SNV | 2 | 4 | 1 | 1 | 1 | 1 | 1 |
| cf) Tissue ID; Tissue type (1; BLCA[Bladder Urothelial Carcinoma], 2; BRCA[Breast invasive carcinoma], 3; CESC[Cervical squamous cell carcinoma and endocervical adenocarcinoma], 4; COAD[Colon adenocarcinoma], 5; GBM[Glioblastoma multiforme], 6; Glioma Low Grade, 7; HNSC[Head and Neck squamous cell carcinoma], 8; KICH[Kidney Chromophobe], 9; KIRC[Kidney renal clear cell carcinoma], 10; KIRP[Kidney renal papillary cell carcinoma], 11; LAML[Acute Myeloid Leukemia], 12; LUAD[Lung adenocarcinoma], 13; LUSC[Lung squamous cell carcinoma], 14; OV[Ovarian serous cystadenocarcinoma ], 15; PAAD[Pancreatic adenocarcinoma], 16; PRAD[Prostate adenocarcinoma], 17; SKCM[Skin Cutaneous Melanoma], 18:STAD[Stomach adenocarcinoma], 19:THCA[Thyroid carcinoma], 20:UCEC[Uterine Corpus Endometrial Carcinoma]) |
| Top |
| * We represented just top 10 SNVs. When you move the cursor on each content, you can see more deailed mutation information on the Tooltip. Those are primary_site, primary_histology, mutation(aa), pubmedID. |
| Genomic Position | Mutation(aa) | Unique sampleID count |
| chr2:62099332 | p.E429G,CCT4 | 3 |
| chr2:62099658 | p.V367V,CCT4 | 2 |
| chr2:62099660 | p.R411Q,CCT4 | 1 |
| chr2:62110660 | p.S85A,CCT4 | 1 |
| chr2:62099331 | p.A403T,CCT4 | 1 |
| chr2:62099690 | p.I81I,CCT4 | 1 |
| chr2:62110669 | p.L379I,CCT4 | 1 |
| chr2:62103266 | p.V68V | 1 |
| chr2:62112193 | p.K65N | 1 |
| chr2:62099382 | p.A378V,CCT4 | 1 |
| * Copy number data were extracted from TCGA using R package TCGA-Assembler. The URLs of all public data files on TCGA DCC data server were gathered on Jan-05-2015. Function ProcessCNAData in TCGA-Assembler package was used to obtain gene-level copy number value which is calculated as the average copy number of the genomic region of a gene. |
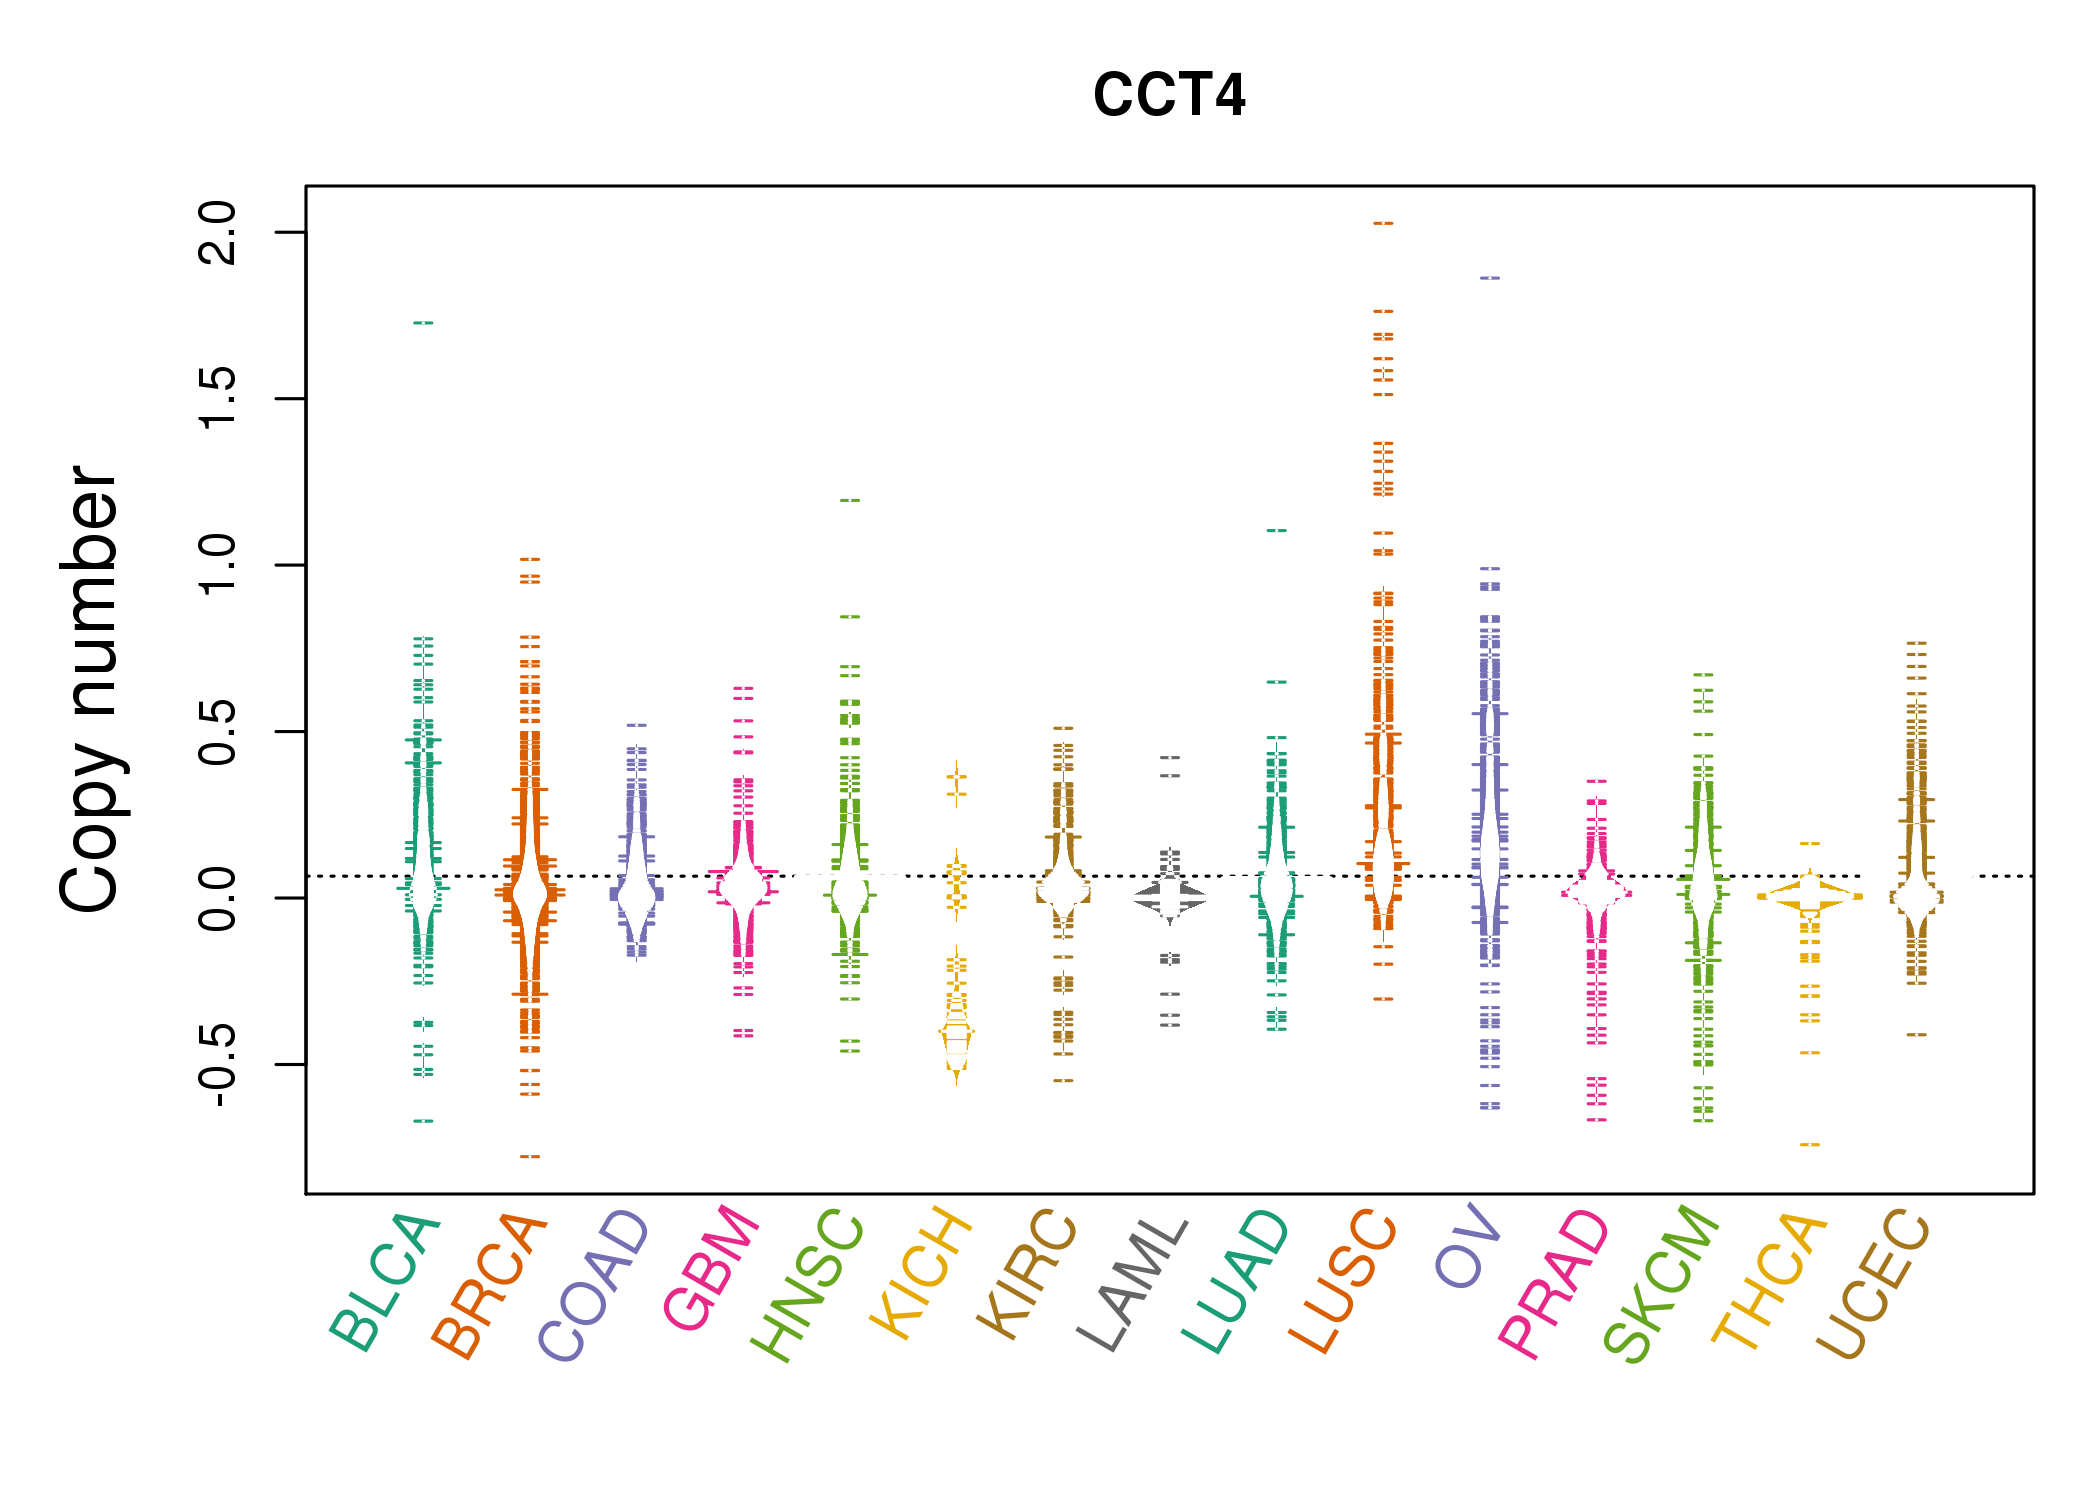 |
| cf) Tissue ID[Tissue type]: BLCA[Bladder Urothelial Carcinoma], BRCA[Breast invasive carcinoma], CESC[Cervical squamous cell carcinoma and endocervical adenocarcinoma], COAD[Colon adenocarcinoma], GBM[Glioblastoma multiforme], Glioma Low Grade, HNSC[Head and Neck squamous cell carcinoma], KICH[Kidney Chromophobe], KIRC[Kidney renal clear cell carcinoma], KIRP[Kidney renal papillary cell carcinoma], LAML[Acute Myeloid Leukemia], LUAD[Lung adenocarcinoma], LUSC[Lung squamous cell carcinoma], OV[Ovarian serous cystadenocarcinoma ], PAAD[Pancreatic adenocarcinoma], PRAD[Prostate adenocarcinoma], SKCM[Skin Cutaneous Melanoma], STAD[Stomach adenocarcinoma], THCA[Thyroid carcinoma], UCEC[Uterine Corpus Endometrial Carcinoma] |
| Top |
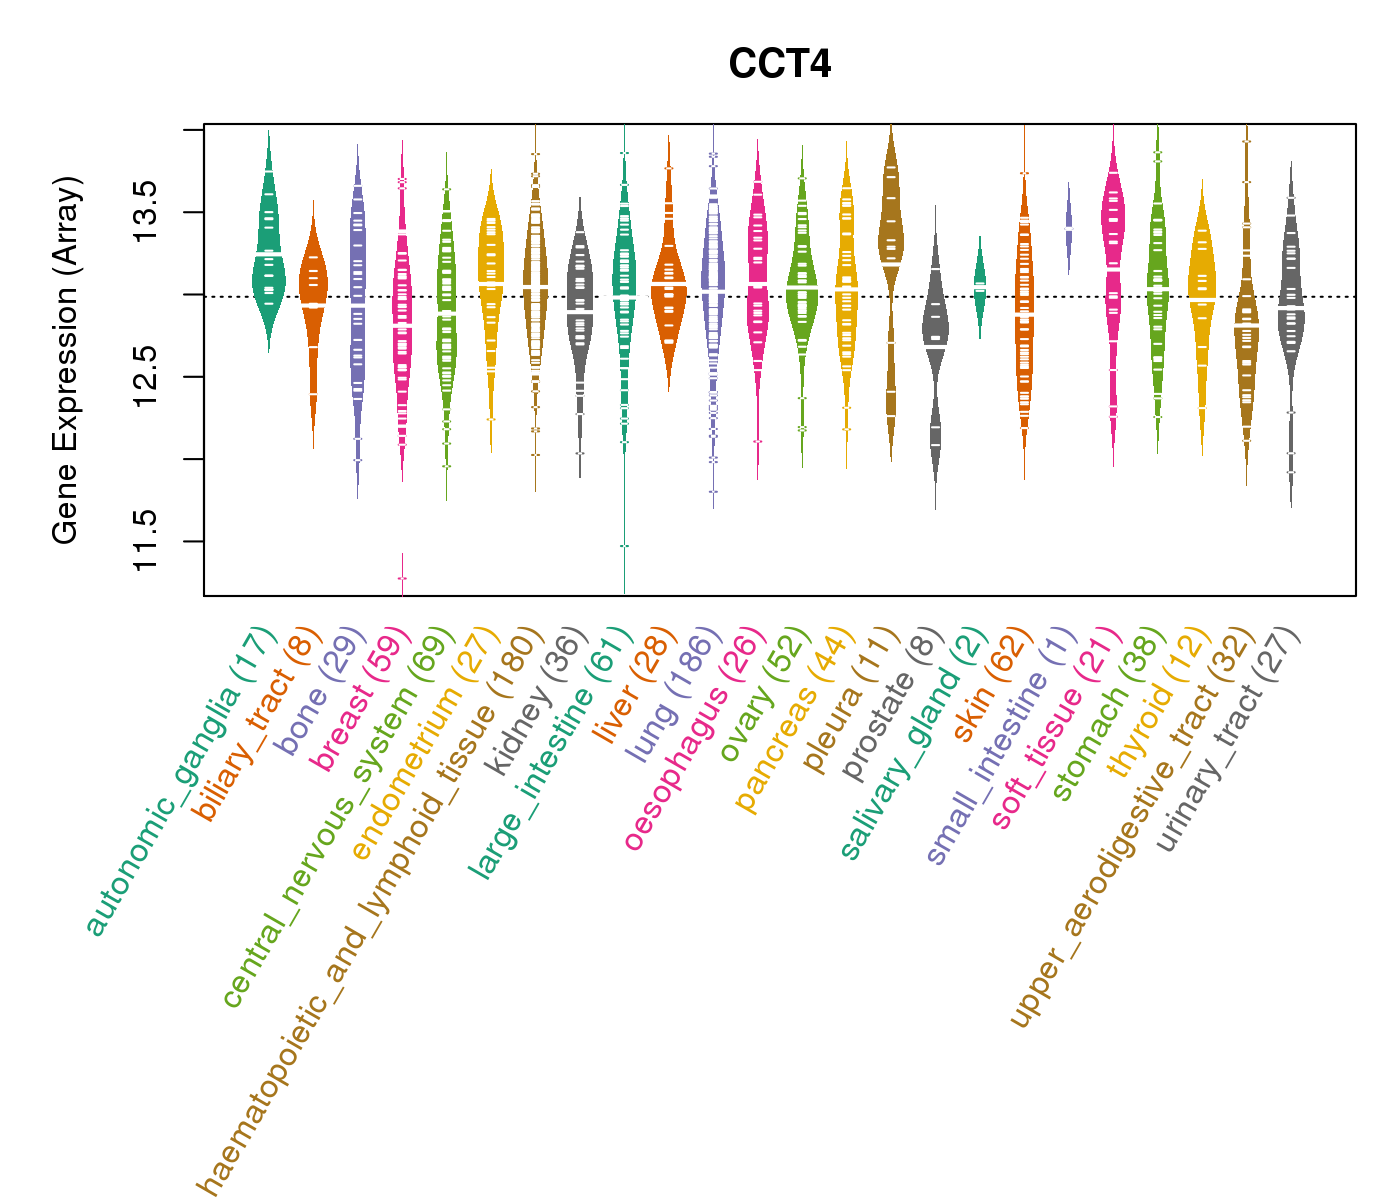
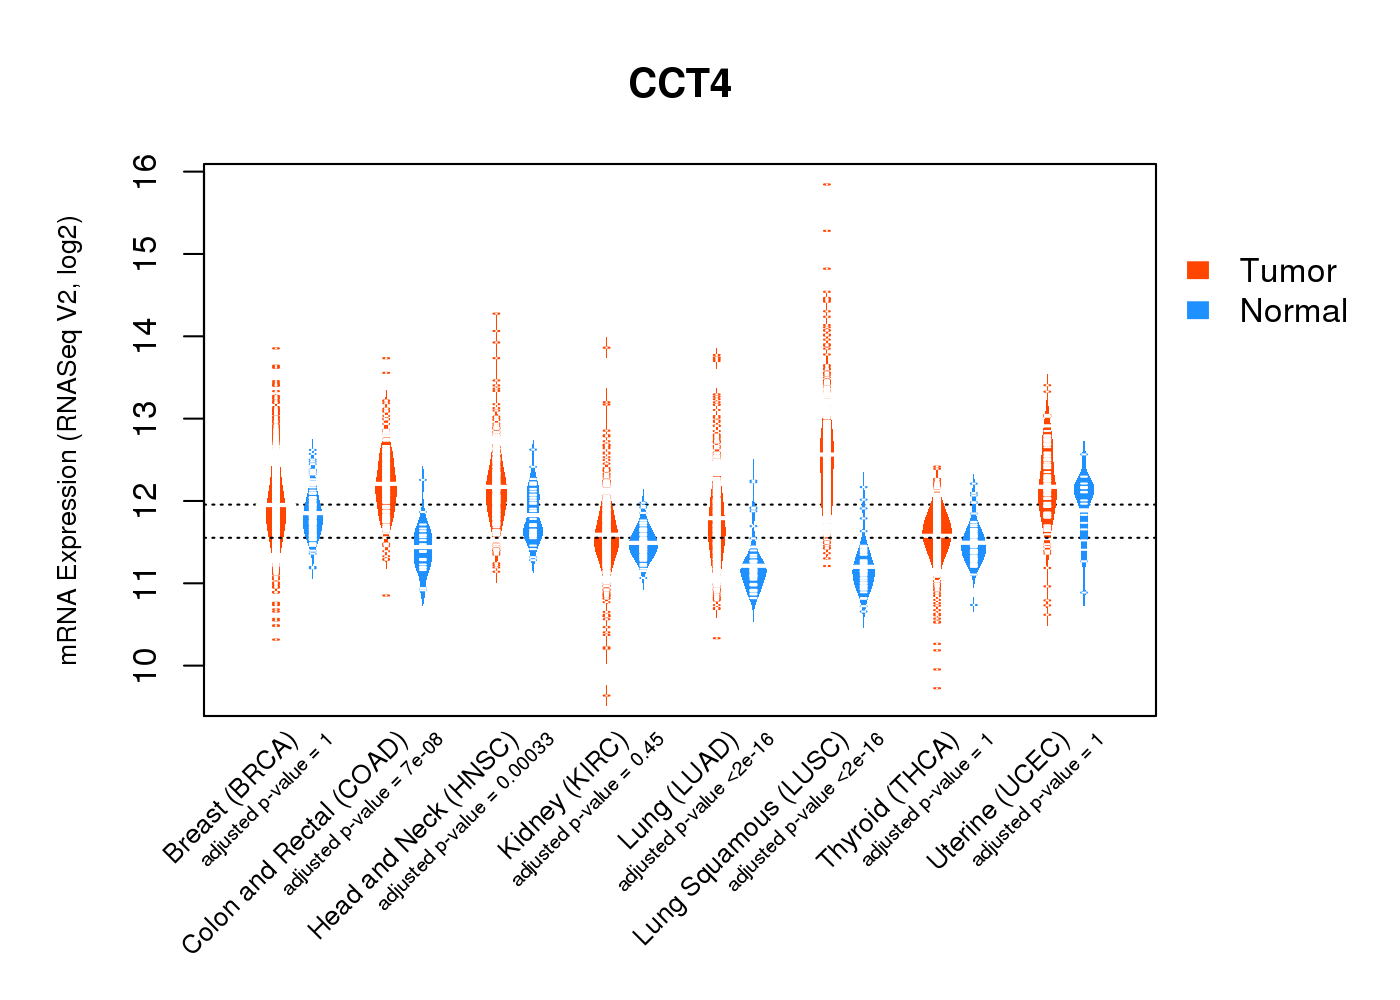
| Gene Expression for CCT4 |
| * CCLE gene expression data were extracted from CCLE_Expression_Entrez_2012-10-18.res: Gene-centric RMA-normalized mRNA expression data. |
 |
| * Normalized gene expression data of RNASeqV2 was extracted from TCGA using R package TCGA-Assembler. The URLs of all public data files on TCGA DCC data server were gathered at Jan-05-2015. Only eight cancer types have enough normal control samples for differential expression analysis. (t test, adjusted p<0.05 (using Benjamini-Hochberg FDR)) |
 |
| Top |
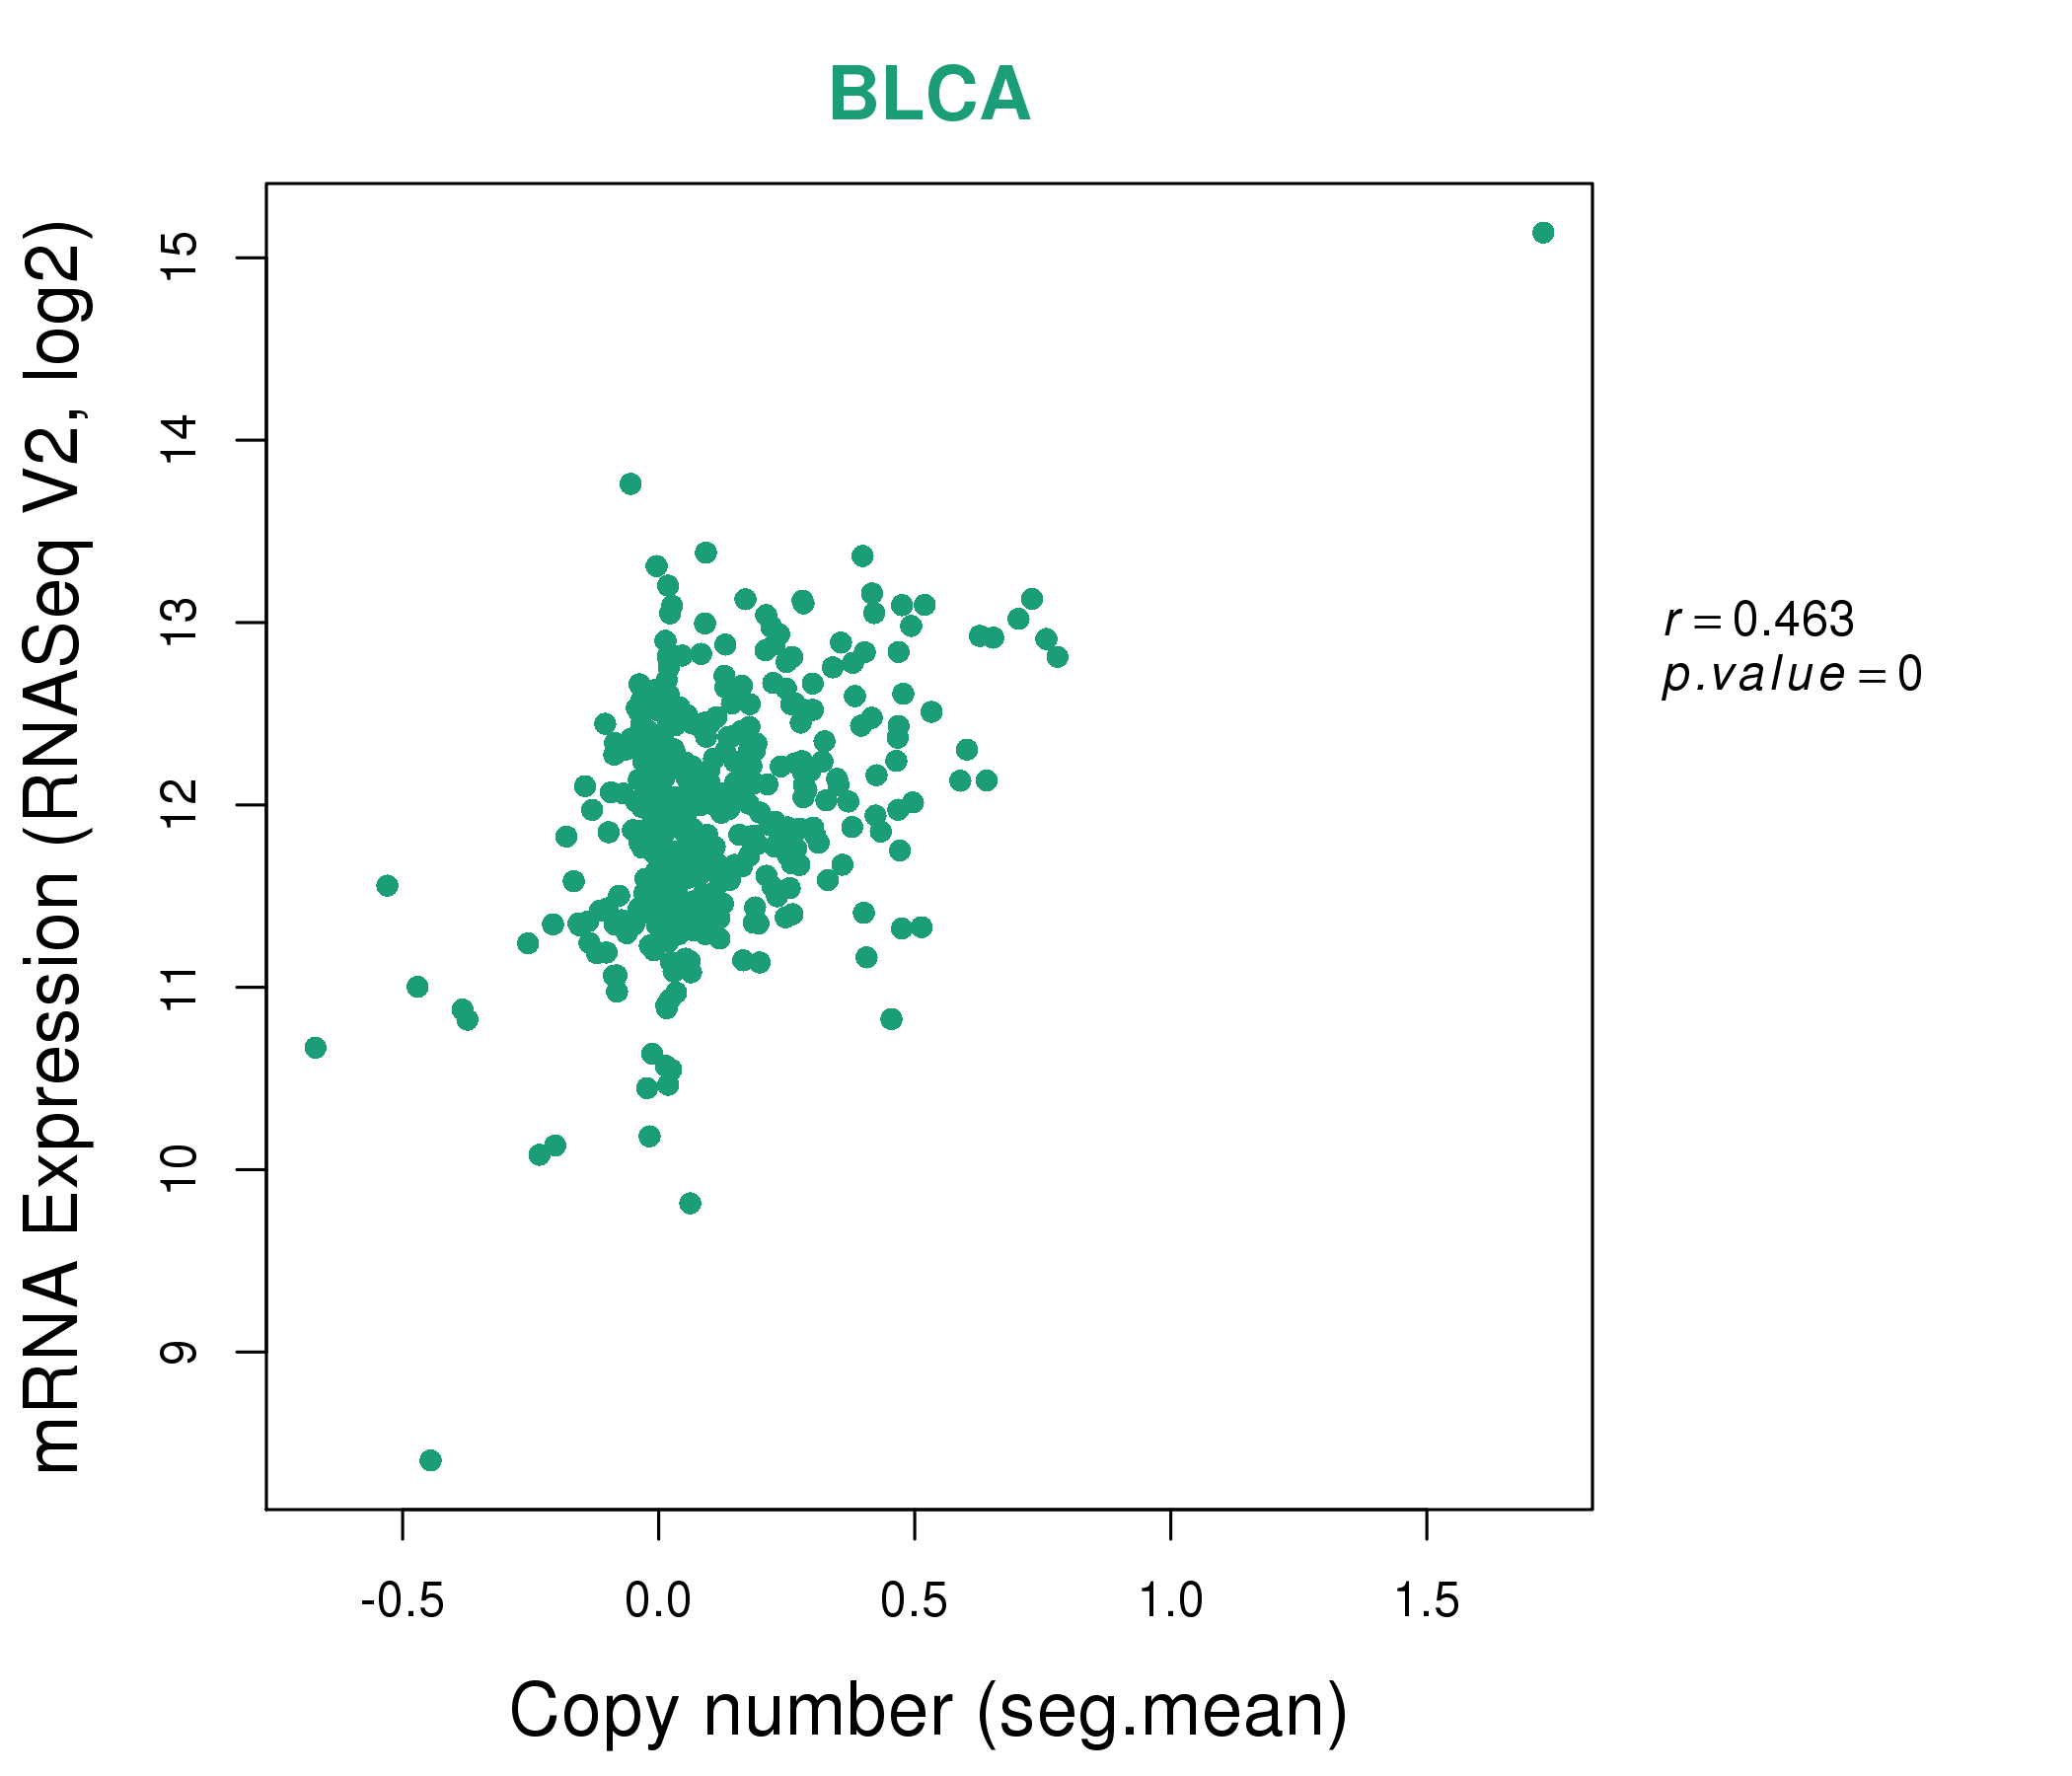
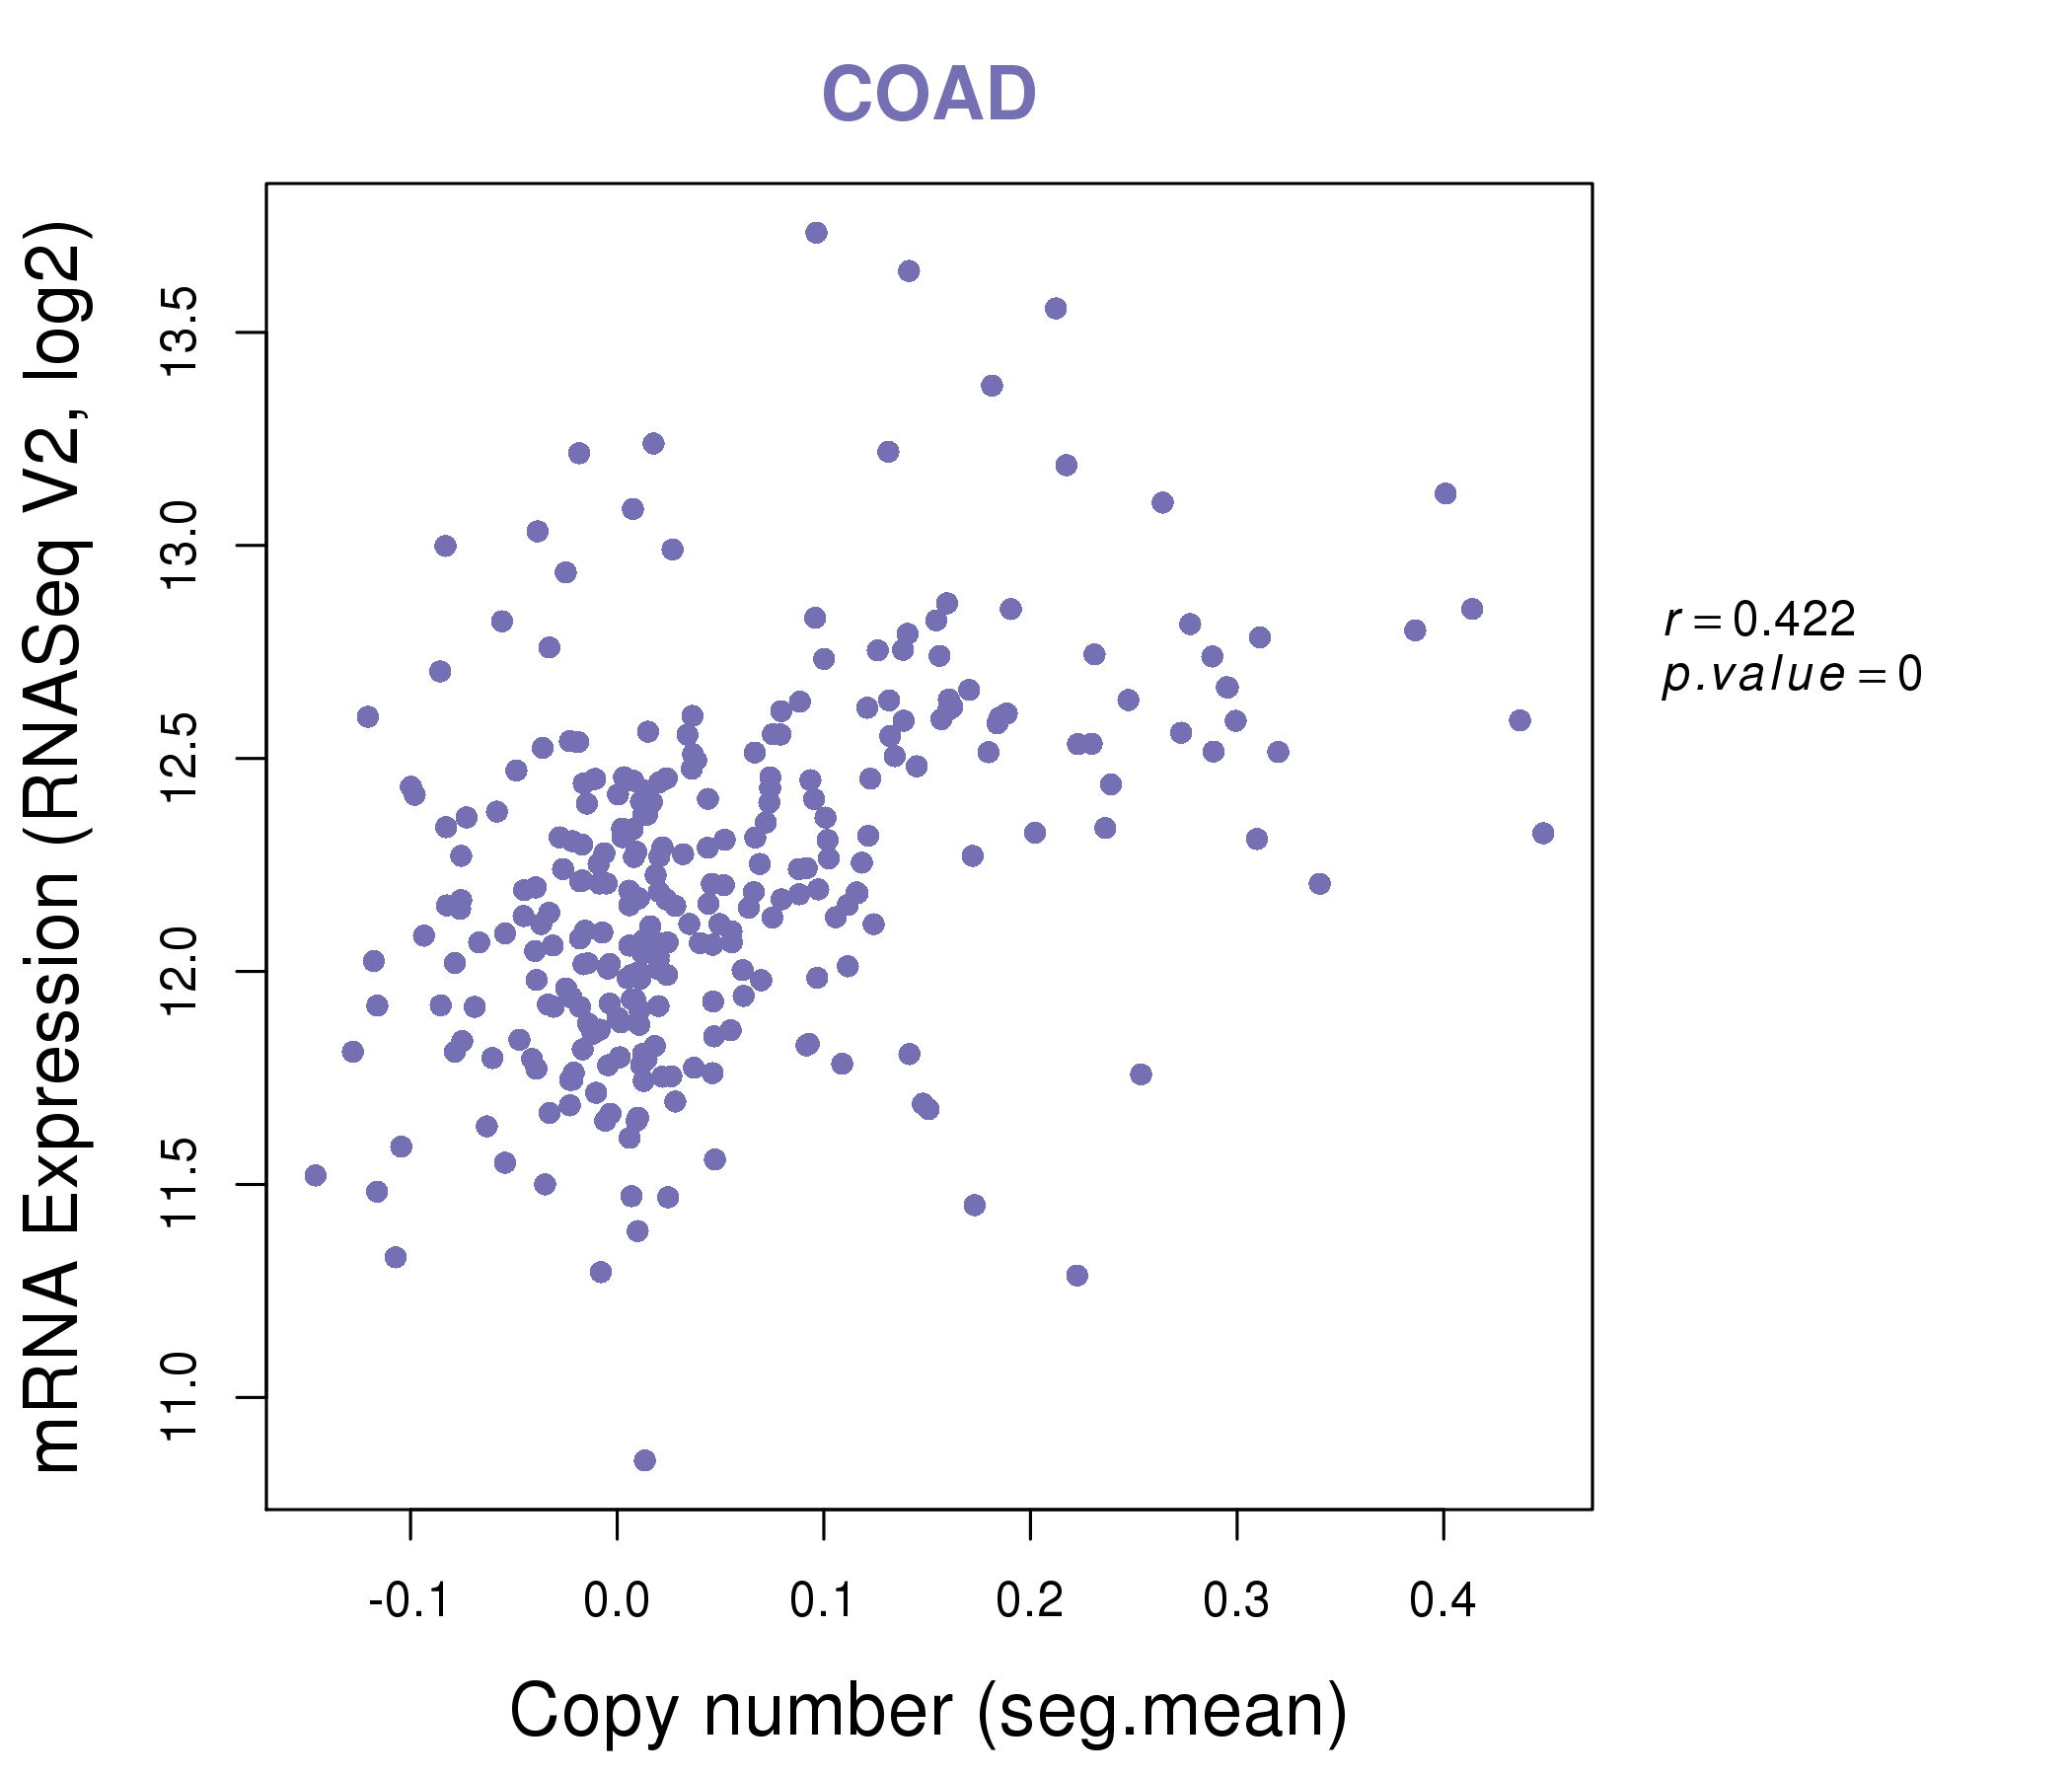
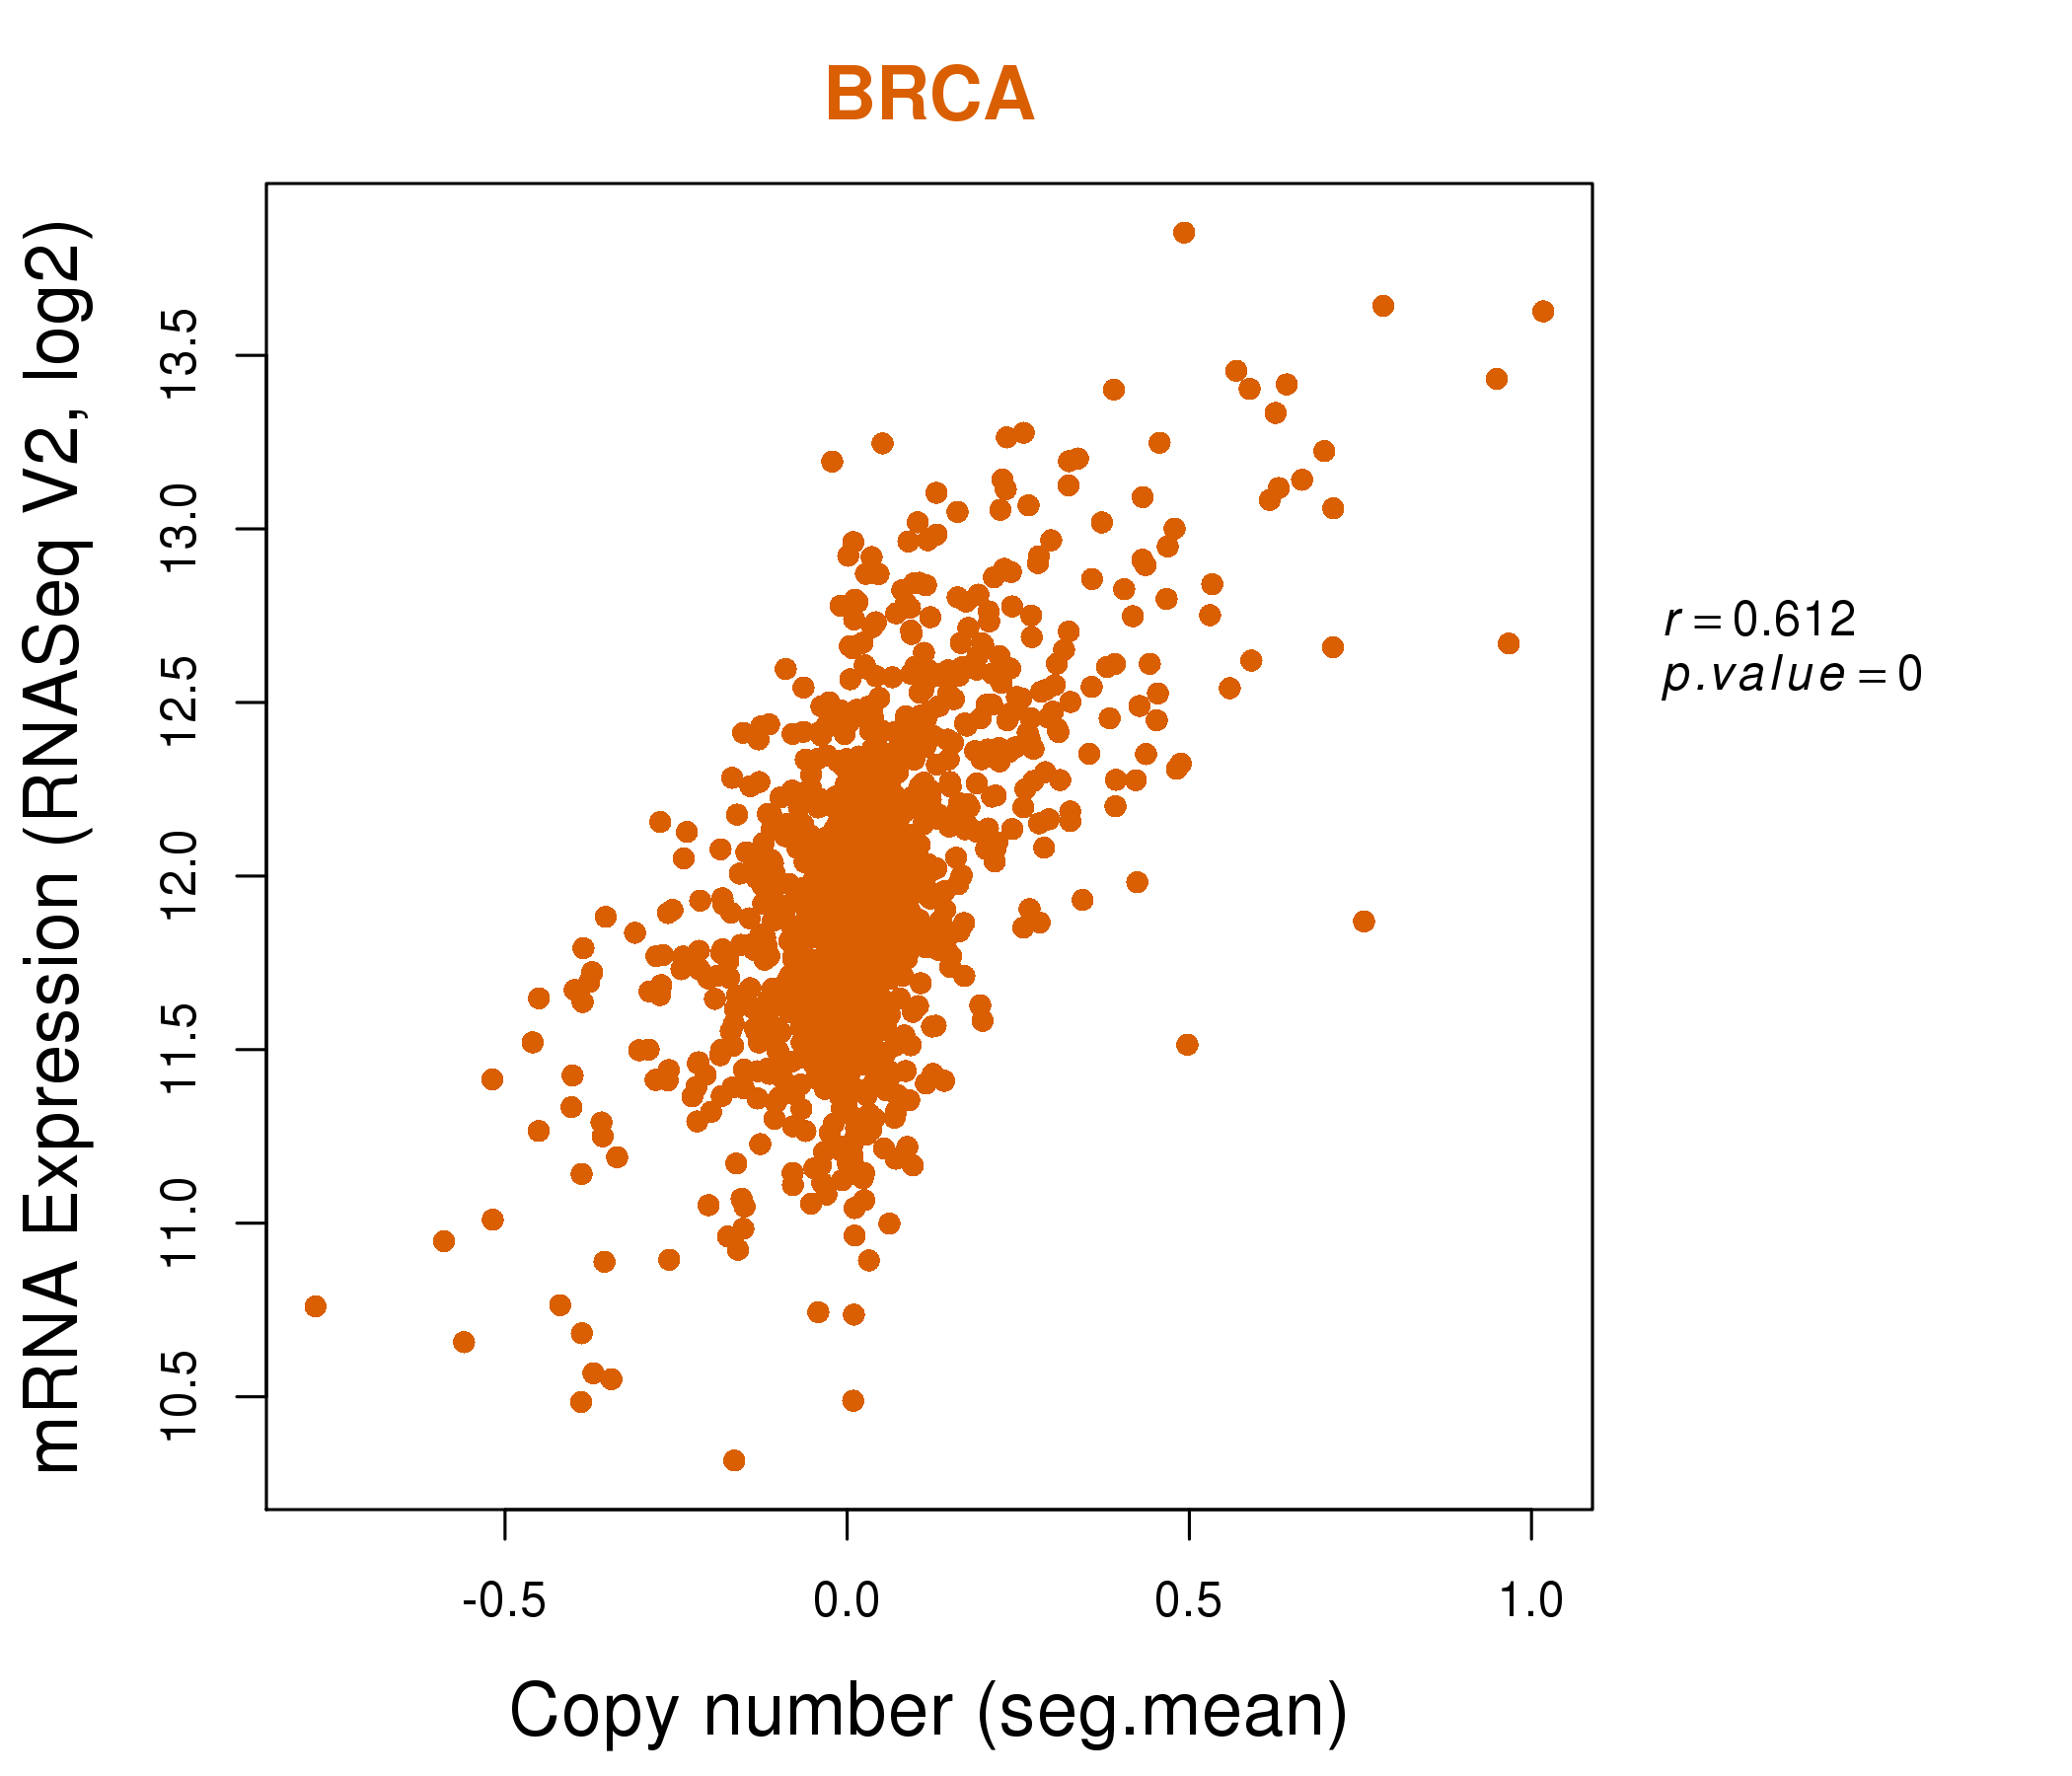
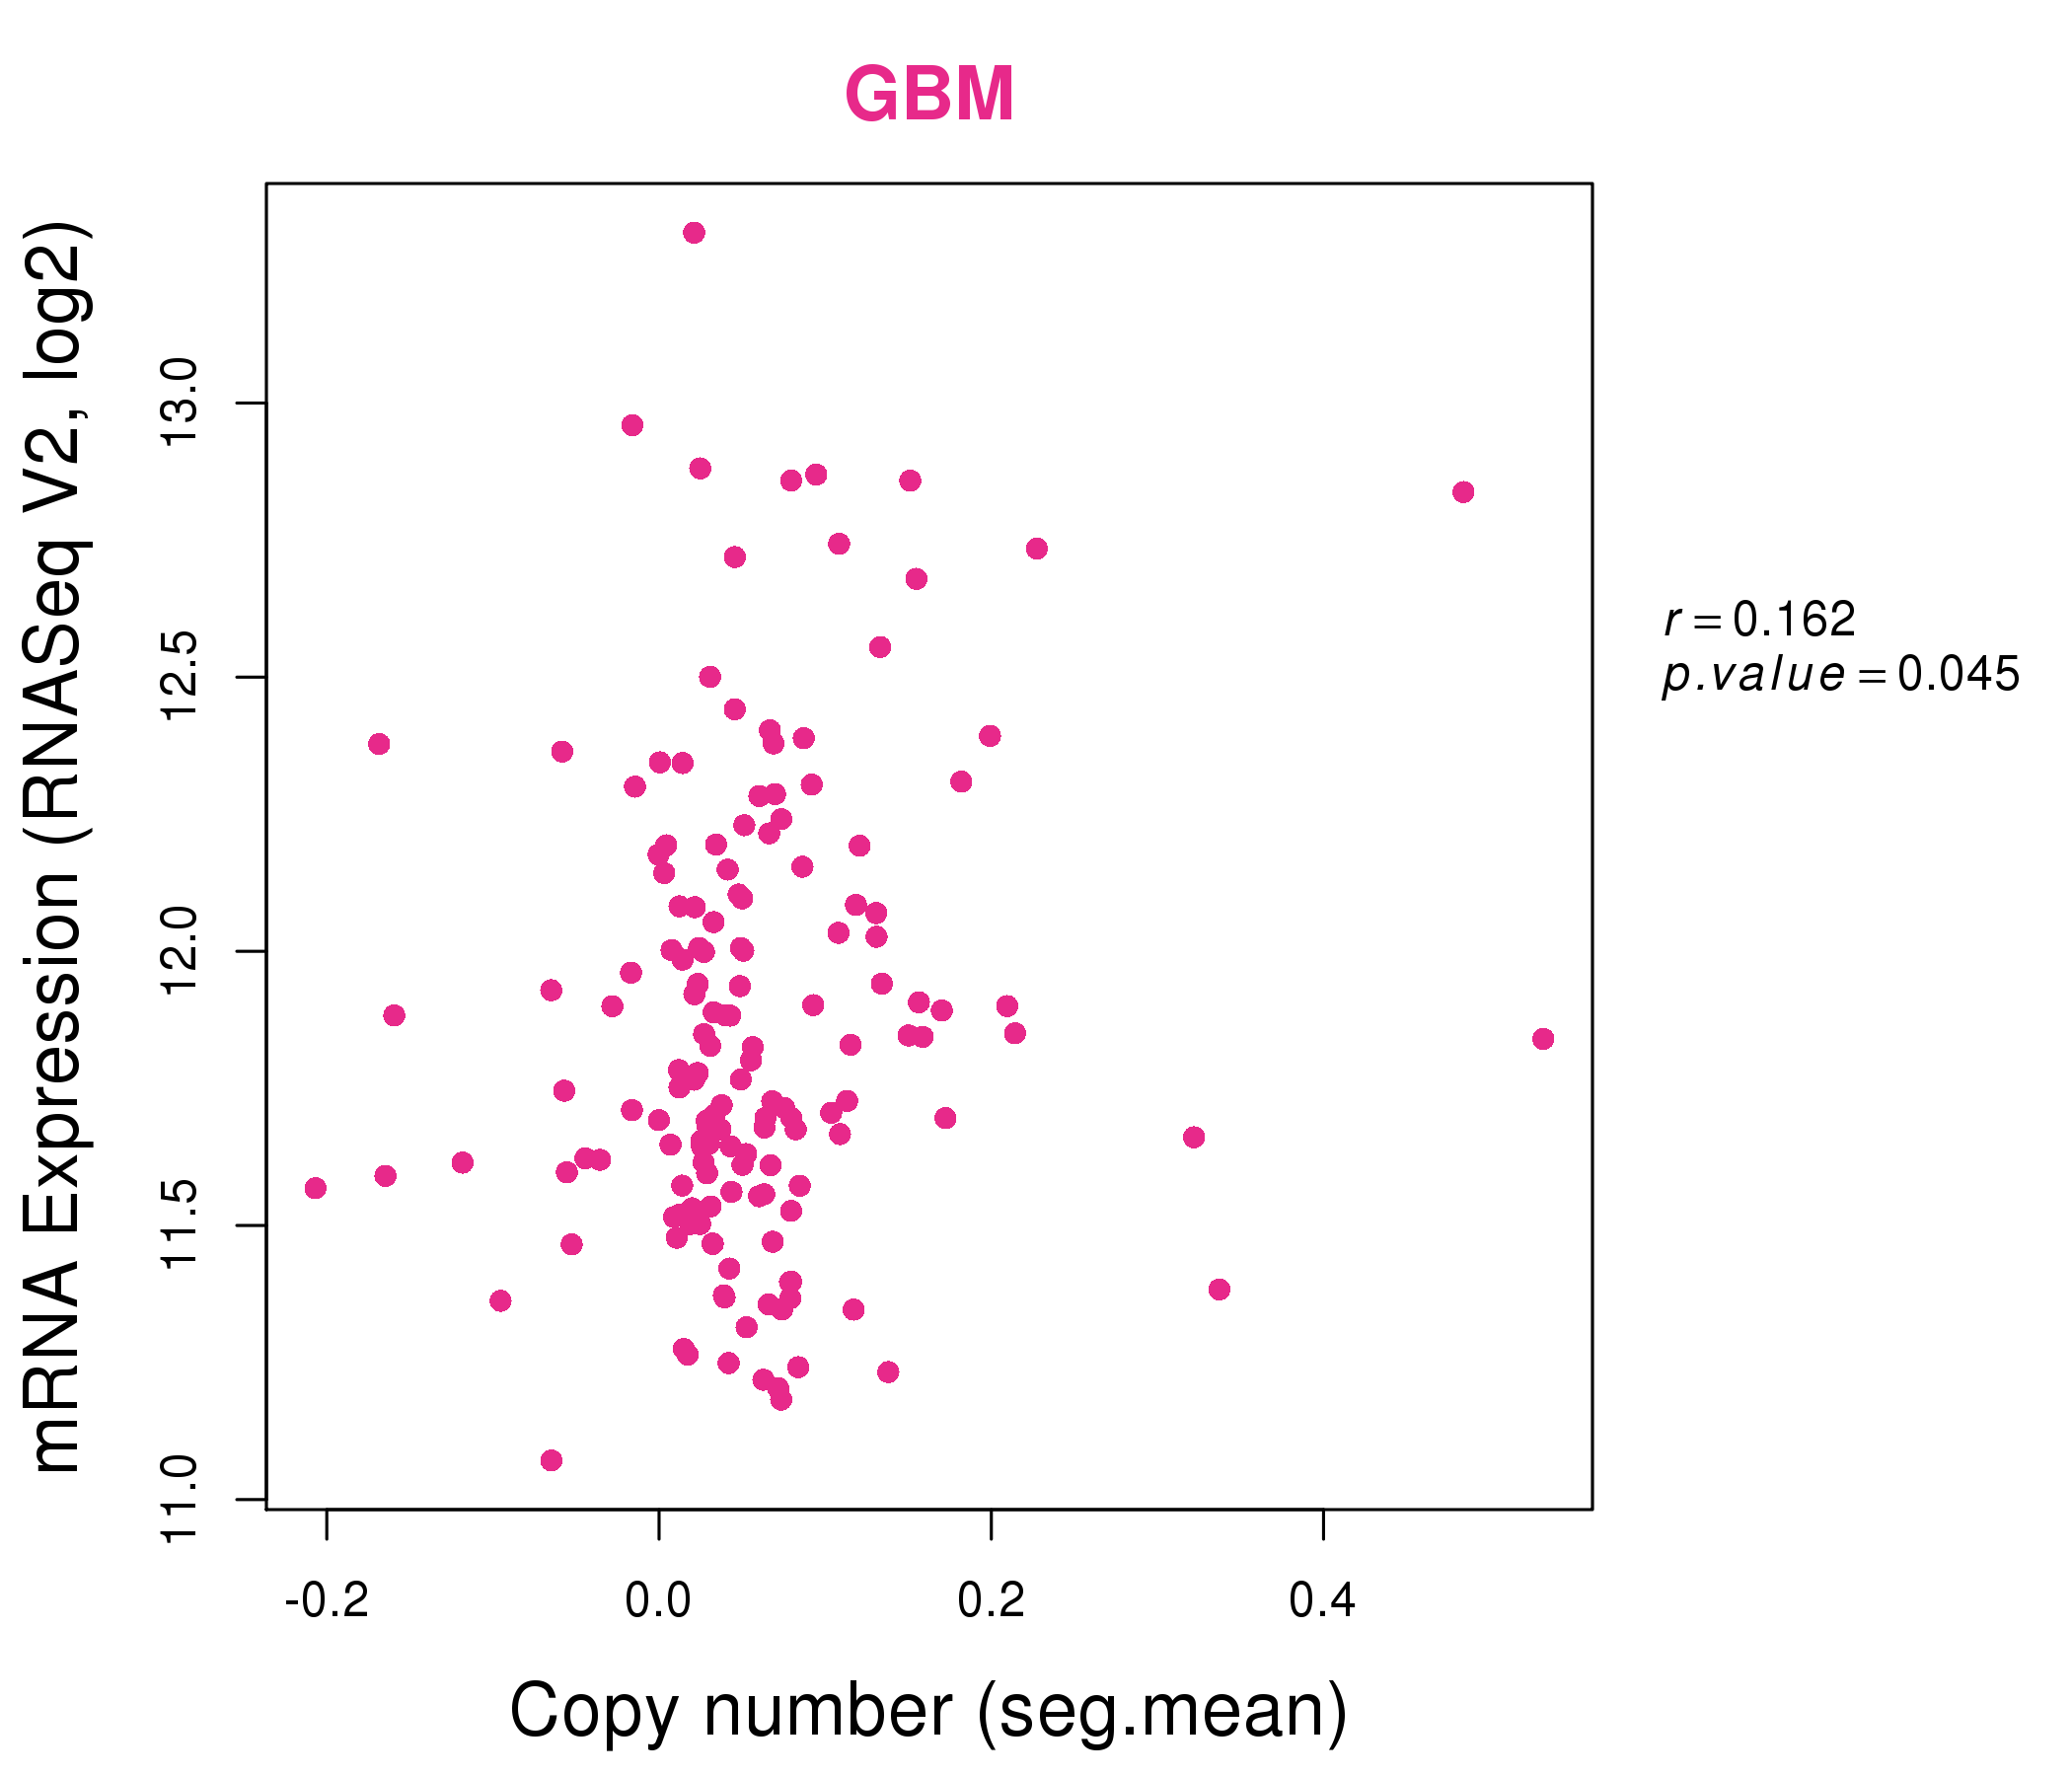
| * This plots show the correlation between CNV and gene expression. |
: Open all plots for all cancer types
 |
|
 |
|
| Top |
| Gene-Gene Network Information |
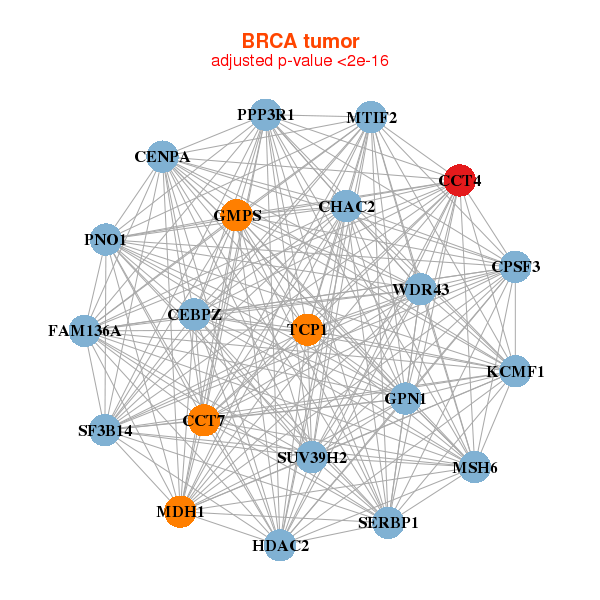
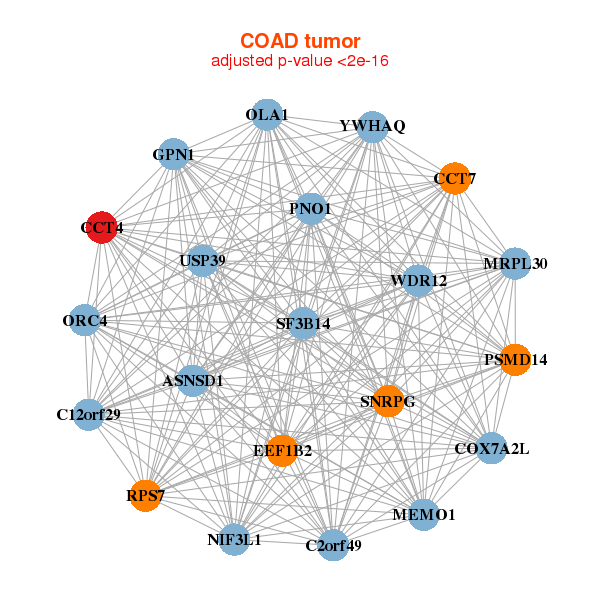
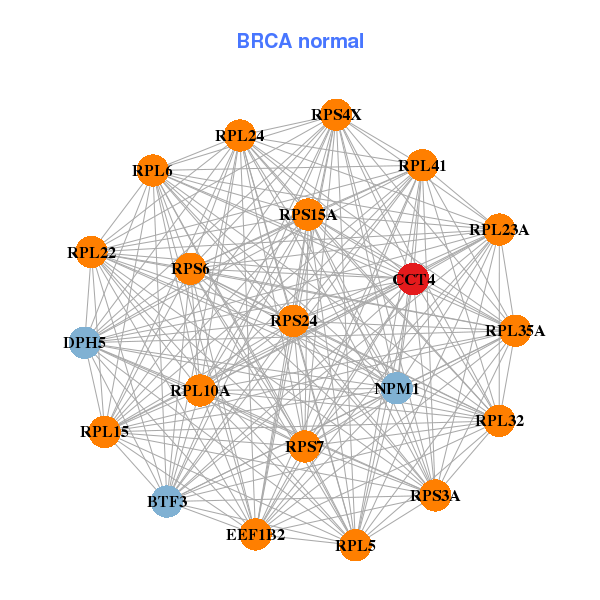
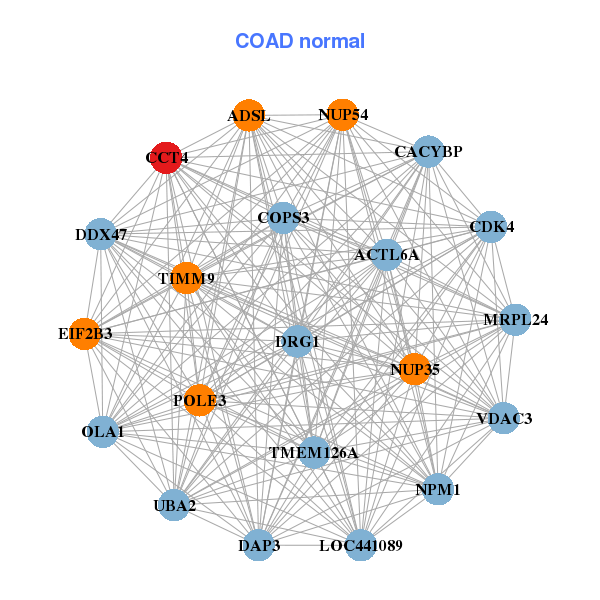
| * Co-Expression network figures were drawn using R package igraph. Only the top 20 genes with the highest correlations were shown. Red circle: input gene, orange circle: cell metabolism gene, sky circle: other gene |
: Open all plots for all cancer types
 |
|
| CCT4,CCT7,CEBPZ,CENPA,CHAC2,CPSF3,FAM136A, GMPS,GPN1,HDAC2,KCMF1,MDH1,MSH6,MTIF2, PNO1,PPP3R1,SERBP1,SF3B14,SUV39H2,TCP1,WDR43 | BTF3,CCT4,DPH5,EEF1B2,NPM1,RPL10A,RPL15, RPL22,RPL23A,RPL24,RPL32,RPL35A,RPL41,RPL5, RPL6,RPS15A,RPS24,RPS3A,RPS4X,RPS6,RPS7 |
 |
|
| ASNSD1,C12orf29,C2orf49,CCT4,CCT7,COX7A2L,EEF1B2, GPN1,MEMO1,MRPL30,NIF3L1,OLA1,ORC4,PNO1, PSMD14,RPS7,SF3B14,SNRPG,USP39,WDR12,YWHAQ | ACTL6A,ADSL,CACYBP,CCT4,CDK4,COPS3,DAP3, DDX47,DRG1,EIF2B3,LOC441089,MRPL24,NPM1,NUP35, NUP54,OLA1,POLE3,TIMM9,TMEM126A,UBA2,VDAC3 |
| * Co-Expression network figures were drawn using R package igraph. Only the top 20 genes with the highest correlations were shown. Red circle: input gene, orange circle: cell metabolism gene, sky circle: other gene |
: Open all plots for all cancer types
| Top |
: Open all interacting genes' information including KEGG pathway for all interacting genes from DAVID
| Top |
| Pharmacological Information for CCT4 |
| There's no related Drug. |
| Top |
| Cross referenced IDs for CCT4 |
| * We obtained these cross-references from Uniprot database. It covers 150 different DBs, 18 categories. http://www.uniprot.org/help/cross_references_section |
: Open all cross reference information
|
Copyright © 2016-Present - The Univsersity of Texas Health Science Center at Houston @ |