|
||||||||||||||||||||||||||||||||||||||||||||||||||||||||||||||||||||||||||||||||||||||||||||||||||||||||||||||||||||||||||||||||||||||||||||||||||||||||||||||||||||||||||||||||||||||||||||||||||||||||||||||||||||||||||||||||||||||||||||||||||||||||||||||||||||||||||||||||||||||||||||||||||||||||||||||||||||||||||
| |
| Phenotypic Information (metabolism pathway, cancer, disease, phenome) |
| |
| |
| Gene-Gene Network Information: Co-Expression Network, Interacting Genes & KEGG |
| |
|


| Gene Summary for CCT2 |
| Basic gene info. | Gene symbol | CCT2 |
| Gene name | chaperonin containing TCP1, subunit 2 (beta) | |
| Synonyms | 99D8.1|CCT-beta|CCTB|HEL-S-100n|PRO1633|TCP-1-beta | |
| Cytomap | UCSC genome browser: 12q15 | |
| Genomic location | chr12 :69979207-69995357 | |
| Type of gene | protein-coding | |
| RefGenes | NM_001198842.1, NM_006431.2, | |
| Ensembl id | ENSG00000166226 | |
| Description | T-complex protein 1 subunit betaT-complex protein 1, beta subunitchaperonin containing t-complex polypeptide 1, beta subunitchaperonin containing t-complex polypeptide 1, subunit 2epididymis secretory sperm binding protein Li 100n | |
| Modification date | 20141207 | |
| dbXrefs | MIM : 605139 | |
| HGNC : HGNC | ||
| Ensembl : ENSG00000166226 | ||
| HPRD : 06895 | ||
| Vega : OTTHUMG00000169383 | ||
| Protein | UniProt: go to UniProt's Cross Reference DB Table | |
| Expression | CleanEX: HS_CCT2 | |
| BioGPS: 10576 | ||
| Gene Expression Atlas: ENSG00000166226 | ||
| The Human Protein Atlas: ENSG00000166226 | ||
| Pathway | NCI Pathway Interaction Database: CCT2 | |
| KEGG: CCT2 | ||
| REACTOME: CCT2 | ||
| ConsensusPathDB | ||
| Pathway Commons: CCT2 | ||
| Metabolism | MetaCyc: CCT2 | |
| HUMANCyc: CCT2 | ||
| Regulation | Ensembl's Regulation: ENSG00000166226 | |
| miRBase: chr12 :69,979,207-69,995,357 | ||
| TargetScan: NM_001198842 | ||
| cisRED: ENSG00000166226 | ||
| Context | iHOP: CCT2 | |
| cancer metabolism search in PubMed: CCT2 | ||
| UCL Cancer Institute: CCT2 | ||
| Assigned class in ccmGDB | C | |
| Top |
| Phenotypic Information for CCT2(metabolism pathway, cancer, disease, phenome) |
| Cancer | CGAP: CCT2 |
| Familial Cancer Database: CCT2 | |
| * This gene is included in those cancer gene databases. |
|
|
|
|
|
| . | ||||||||||||||||||||||||||||||||||||||||||||||||||||||||||||||||||||||||||||||||||||||||||||||||||||||||||||||||||||||||||||||||||||||||||||||||||||||||||||||||||||||||||||||||||||||||||||||||||||||||||||||||||||||||||||||||||||||||||||||||||||||||||||||||||||||||||||||||||||||||||||||||||||||||||||||||||||
Oncogene 1 | Significant driver gene in | |||||||||||||||||||||||||||||||||||||||||||||||||||||||||||||||||||||||||||||||||||||||||||||||||||||||||||||||||||||||||||||||||||||||||||||||||||||||||||||||||||||||||||||||||||||||||||||||||||||||||||||||||||||||||||||||||||||||||||||||||||||||||||||||||||||||||||||||||||||||||||||||||||||||||||||||||||||||||
| cf) number; DB name 1 Oncogene; http://nar.oxfordjournals.org/content/35/suppl_1/D721.long, 2 Tumor Suppressor gene; https://bioinfo.uth.edu/TSGene/, 3 Cancer Gene Census; http://www.nature.com/nrc/journal/v4/n3/abs/nrc1299.html, 4 CancerGenes; http://nar.oxfordjournals.org/content/35/suppl_1/D721.long, 5 Network of Cancer Gene; http://ncg.kcl.ac.uk/index.php, 1Therapeutic Vulnerabilities in Cancer; http://cbio.mskcc.org/cancergenomics/statius/ |
| REACTOME_METABOLISM_OF_PROTEINS | |
| OMIM | |
| Orphanet | |
| Disease | KEGG Disease: CCT2 |
| MedGen: CCT2 (Human Medical Genetics with Condition) | |
| ClinVar: CCT2 | |
| Phenotype | MGI: CCT2 (International Mouse Phenotyping Consortium) |
| PhenomicDB: CCT2 | |
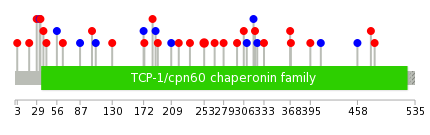
| Mutations for CCT2 |
| * Under tables are showing count per each tissue to give us broad intuition about tissue specific mutation patterns.You can go to the detailed page for each mutation database's web site. |
| There's no structural variation information in COSMIC data for this gene. |
| * From mRNA Sanger sequences, Chitars2.0 arranged chimeric transcripts. This table shows CCT2 related fusion information. |
| ID | Head Gene | Tail Gene | Accession | Gene_a | qStart_a | qEnd_a | Chromosome_a | tStart_a | tEnd_a | Gene_a | qStart_a | qEnd_a | Chromosome_a | tStart_a | tEnd_a |
| CN431150 | HMGA2 | 3 | 107 | 12 | 66358572 | 66358676 | CCT2 | 108 | 748 | 12 | 69979251 | 69991838 | |
| BG180662 | ELF1 | 1 | 375 | 13 | 41517138 | 41524088 | CCT2 | 370 | 723 | 12 | 69993649 | 69995292 | |
| AW518263 | CCT2 | 1 | 89 | 12 | 69995262 | 69995350 | PAN3 | 78 | 484 | 13 | 28793464 | 28793870 | |
| Top |
| Mutation type/ Tissue ID | brca | cns | cerv | endome | haematopo | kidn | Lintest | liver | lung | ns | ovary | pancre | prost | skin | stoma | thyro | urina | |||
| Total # sample | 1 | 1 | 1 | |||||||||||||||||
| GAIN (# sample) | 1 | 1 | 1 | |||||||||||||||||
| LOSS (# sample) |
| cf) Tissue ID; Tissue type (1; Breast, 2; Central_nervous_system, 3; Cervix, 4; Endometrium, 5; Haematopoietic_and_lymphoid_tissue, 6; Kidney, 7; Large_intestine, 8; Liver, 9; Lung, 10; NS, 11; Ovary, 12; Pancreas, 13; Prostate, 14; Skin, 15; Stomach, 16; Thyroid, 17; Urinary_tract) |
| Top |
|
 |
| Top |
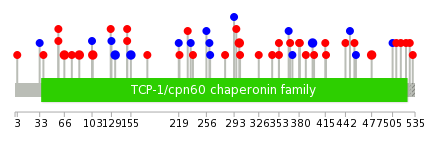
| Stat. for Non-Synonymous SNVs (# total SNVs=34) | (# total SNVs=13) |
 |  |
(# total SNVs=1) | (# total SNVs=1) |
 |  |
| Top |
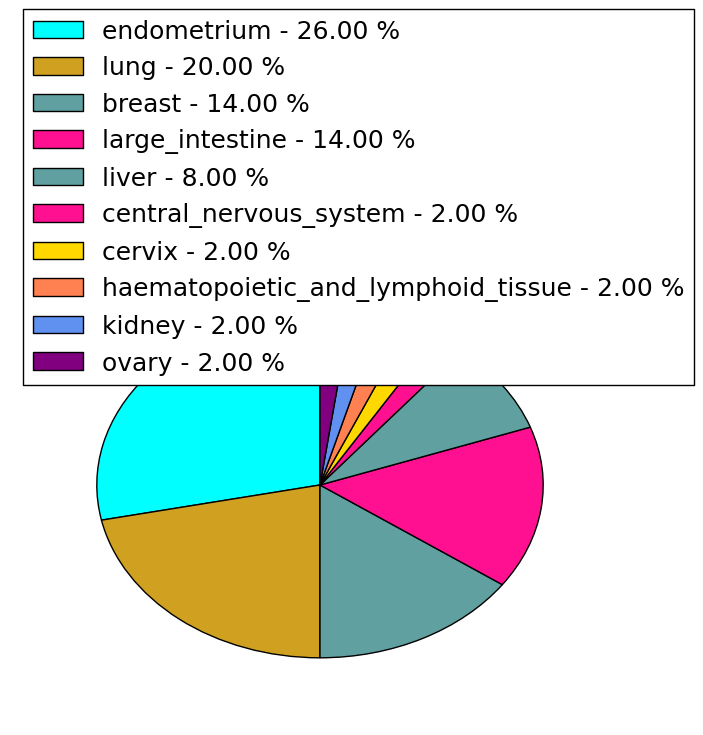
| * When you move the cursor on each content, you can see more deailed mutation information on the Tooltip. Those are primary_site,primary_histology,mutation(aa),pubmedID. |
| GRCh37 position | Mutation(aa) | Unique sampleID count |
| chr12:69987312-69987312 | p.E301* | 2 |
| chr12:69981998-69981998 | p.T134T | 2 |
| chr12:69992196-69992196 | p.G477V | 2 |
| chr12:69983267-69983267 | p.S150F | 2 |
| chr12:69983283-69983283 | p.F155F | 2 |
| chr12:69991509-69991509 | p.A398A | 2 |
| chr12:69981312-69981312 | p.D58Y | 2 |
| chr12:69981336-69981336 | p.D66H | 2 |
| chr12:69981396-69981396 | p.D86N | 2 |
| chr12:69981763-69981763 | p.V104I | 2 |
| Top |
|
 |
| Point Mutation/ Tissue ID | 1 | 2 | 3 | 4 | 5 | 6 | 7 | 8 | 9 | 10 | 11 | 12 | 13 | 14 | 15 | 16 | 17 | 18 | 19 | 20 |
| # sample | 1 | 2 | 1 | 2 | 3 | 2 | 1 | 5 | 1 | 4 | 2 | 1 | 12 | |||||||
| # mutation | 1 | 2 | 1 | 2 | 3 | 2 | 1 | 5 | 1 | 4 | 2 | 1 | 13 | |||||||
| nonsynonymous SNV | 1 | 2 | 1 | 1 | 2 | 2 | 4 | 1 | 3 | 2 | 1 | 7 | ||||||||
| synonymous SNV | 1 | 1 | 1 | 1 | 1 | 6 |
| cf) Tissue ID; Tissue type (1; BLCA[Bladder Urothelial Carcinoma], 2; BRCA[Breast invasive carcinoma], 3; CESC[Cervical squamous cell carcinoma and endocervical adenocarcinoma], 4; COAD[Colon adenocarcinoma], 5; GBM[Glioblastoma multiforme], 6; Glioma Low Grade, 7; HNSC[Head and Neck squamous cell carcinoma], 8; KICH[Kidney Chromophobe], 9; KIRC[Kidney renal clear cell carcinoma], 10; KIRP[Kidney renal papillary cell carcinoma], 11; LAML[Acute Myeloid Leukemia], 12; LUAD[Lung adenocarcinoma], 13; LUSC[Lung squamous cell carcinoma], 14; OV[Ovarian serous cystadenocarcinoma ], 15; PAAD[Pancreatic adenocarcinoma], 16; PRAD[Prostate adenocarcinoma], 17; SKCM[Skin Cutaneous Melanoma], 18:STAD[Stomach adenocarcinoma], 19:THCA[Thyroid carcinoma], 20:UCEC[Uterine Corpus Endometrial Carcinoma]) |
| Top |
| * We represented just top 10 SNVs. When you move the cursor on each content, you can see more deailed mutation information on the Tooltip. Those are primary_site, primary_histology, mutation(aa), pubmedID. |
| Genomic Position | Mutation(aa) | Unique sampleID count |
| chr12:69987309 | p.P253S,CCT2 | 2 |
| chr12:69986847 | p.L173F,CCT2 | 1 |
| chr12:69991759 | p.Q333E,CCT2 | 1 |
| chr12:69983267 | p.R184Q,CCT2 | 1 |
| chr12:69980054 | p.M368L,CCT2 | 1 |
| chr12:69991764 | p.S3F | 1 |
| chr12:69983283 | p.A188A,CCT2 | 1 |
| chr12:69987352 | p.L369F,CCT2 | 1 |
| chr12:69980553 | p.I33I | 1 |
| chr12:69991840 | p.L191R,CCT2 | 1 |
| * Copy number data were extracted from TCGA using R package TCGA-Assembler. The URLs of all public data files on TCGA DCC data server were gathered on Jan-05-2015. Function ProcessCNAData in TCGA-Assembler package was used to obtain gene-level copy number value which is calculated as the average copy number of the genomic region of a gene. |
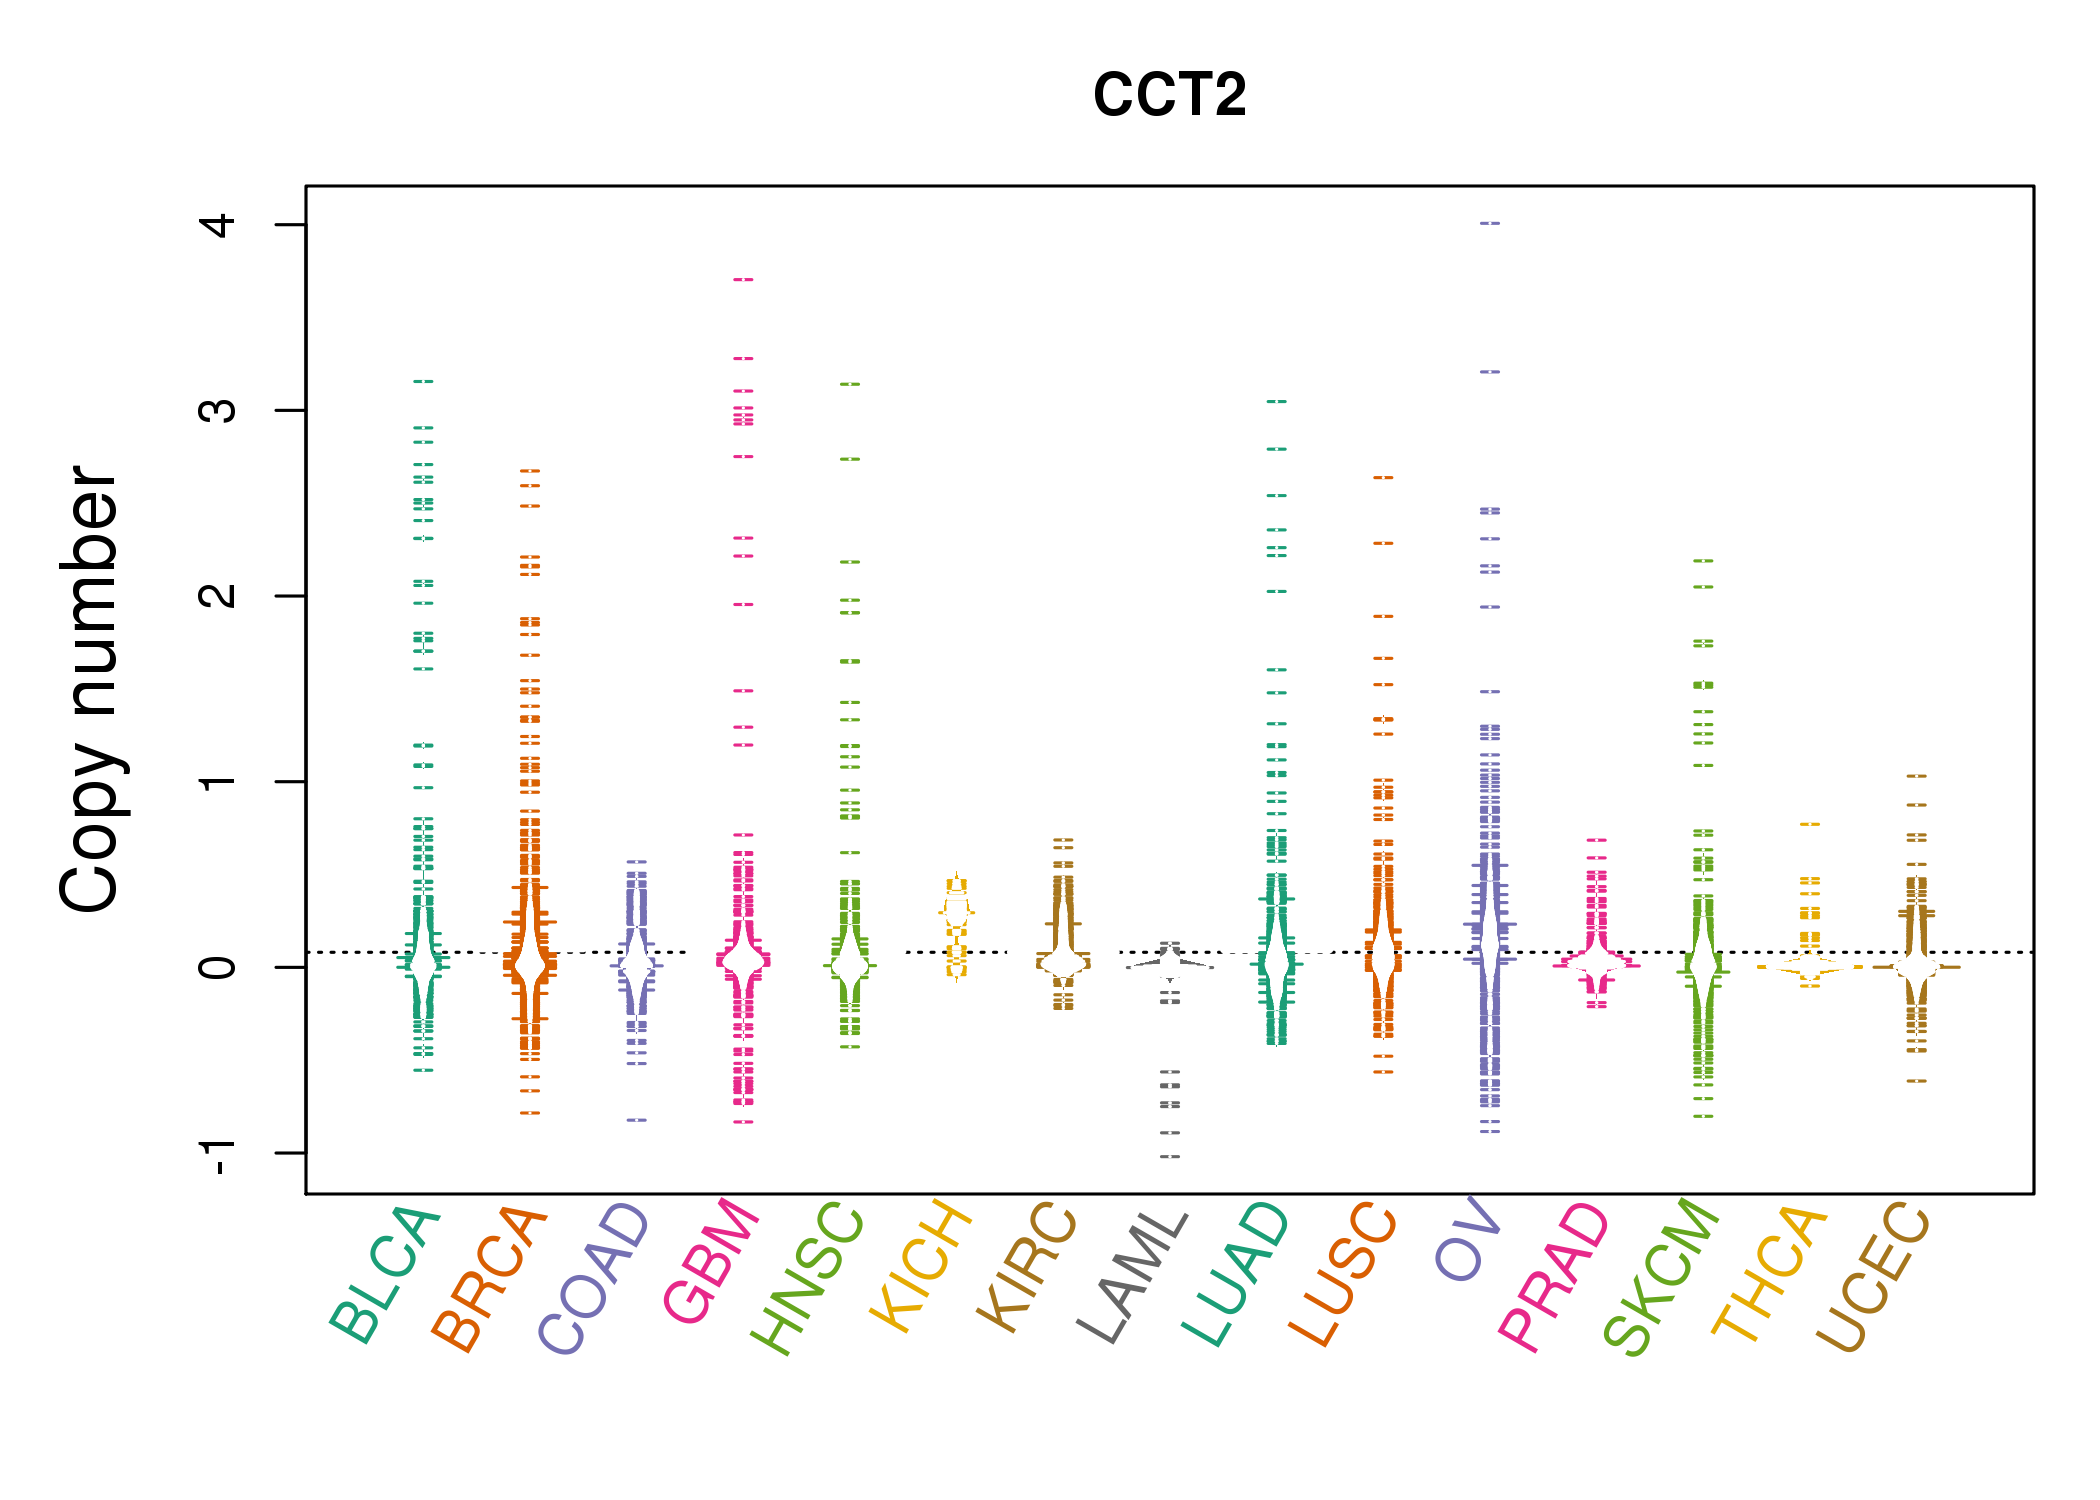 |
| cf) Tissue ID[Tissue type]: BLCA[Bladder Urothelial Carcinoma], BRCA[Breast invasive carcinoma], CESC[Cervical squamous cell carcinoma and endocervical adenocarcinoma], COAD[Colon adenocarcinoma], GBM[Glioblastoma multiforme], Glioma Low Grade, HNSC[Head and Neck squamous cell carcinoma], KICH[Kidney Chromophobe], KIRC[Kidney renal clear cell carcinoma], KIRP[Kidney renal papillary cell carcinoma], LAML[Acute Myeloid Leukemia], LUAD[Lung adenocarcinoma], LUSC[Lung squamous cell carcinoma], OV[Ovarian serous cystadenocarcinoma ], PAAD[Pancreatic adenocarcinoma], PRAD[Prostate adenocarcinoma], SKCM[Skin Cutaneous Melanoma], STAD[Stomach adenocarcinoma], THCA[Thyroid carcinoma], UCEC[Uterine Corpus Endometrial Carcinoma] |
| Top |
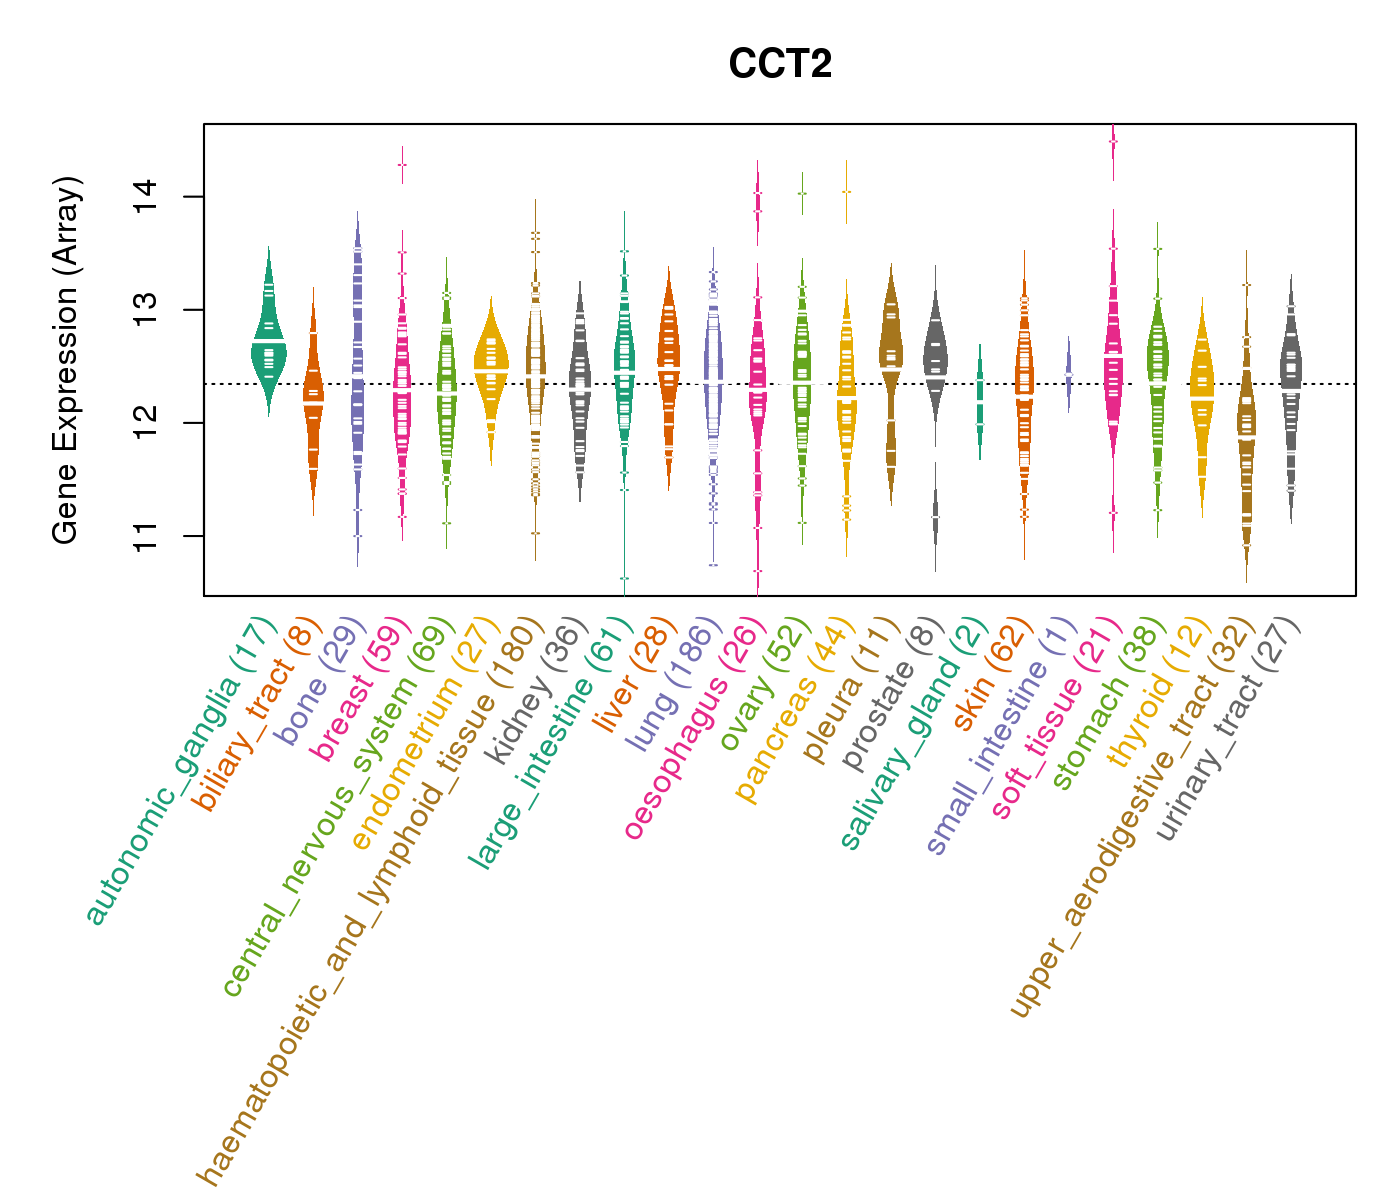
| Gene Expression for CCT2 |
| * CCLE gene expression data were extracted from CCLE_Expression_Entrez_2012-10-18.res: Gene-centric RMA-normalized mRNA expression data. |
 |
| * Normalized gene expression data of RNASeqV2 was extracted from TCGA using R package TCGA-Assembler. The URLs of all public data files on TCGA DCC data server were gathered at Jan-05-2015. Only eight cancer types have enough normal control samples for differential expression analysis. (t test, adjusted p<0.05 (using Benjamini-Hochberg FDR)) |
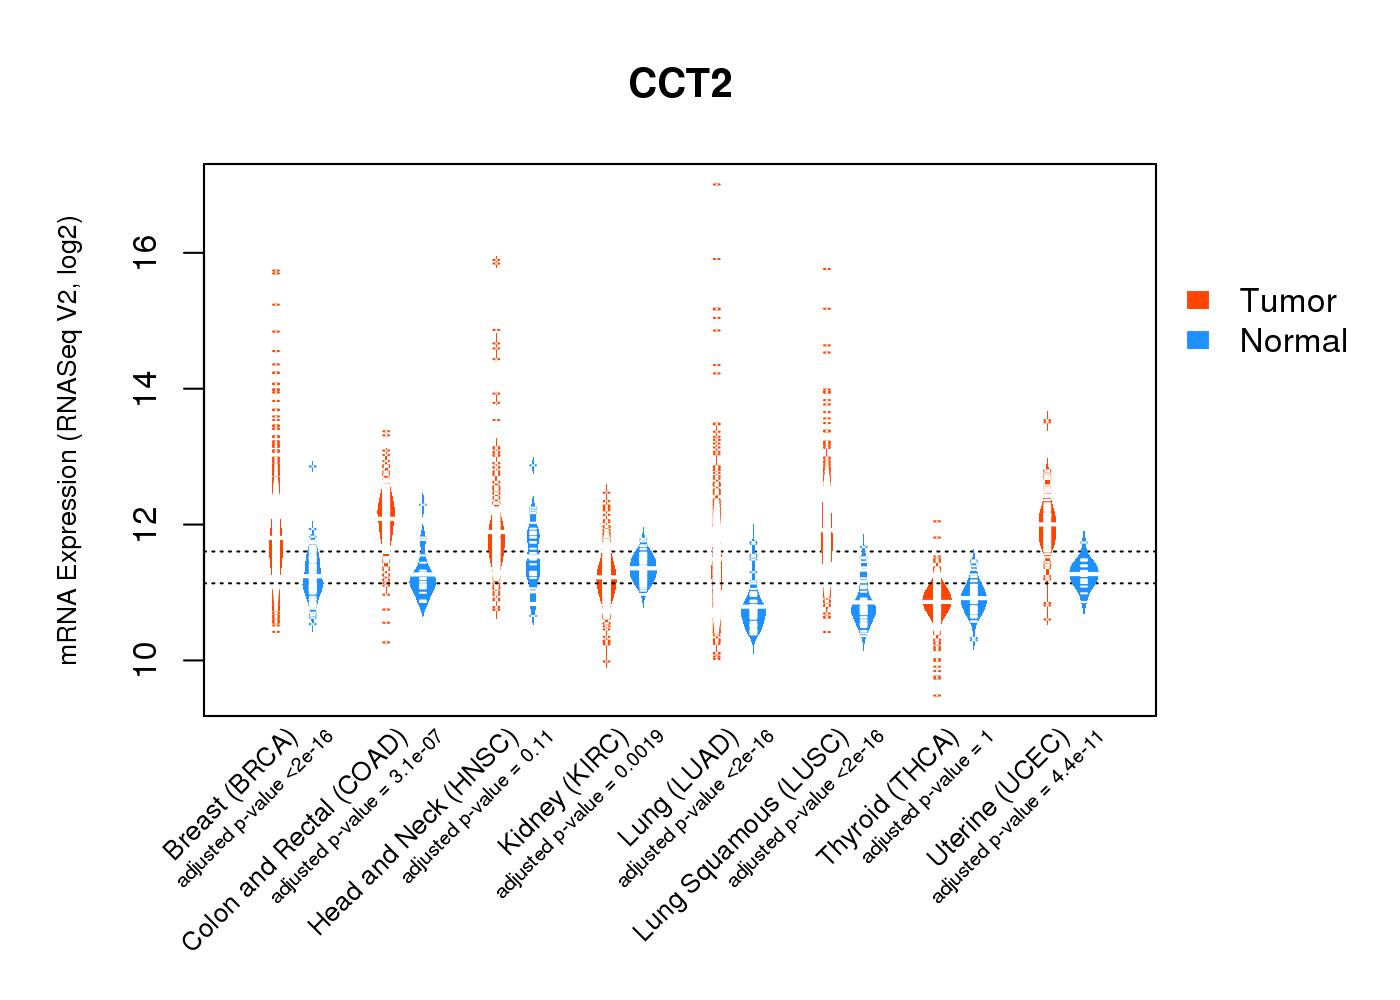 |
| Top |
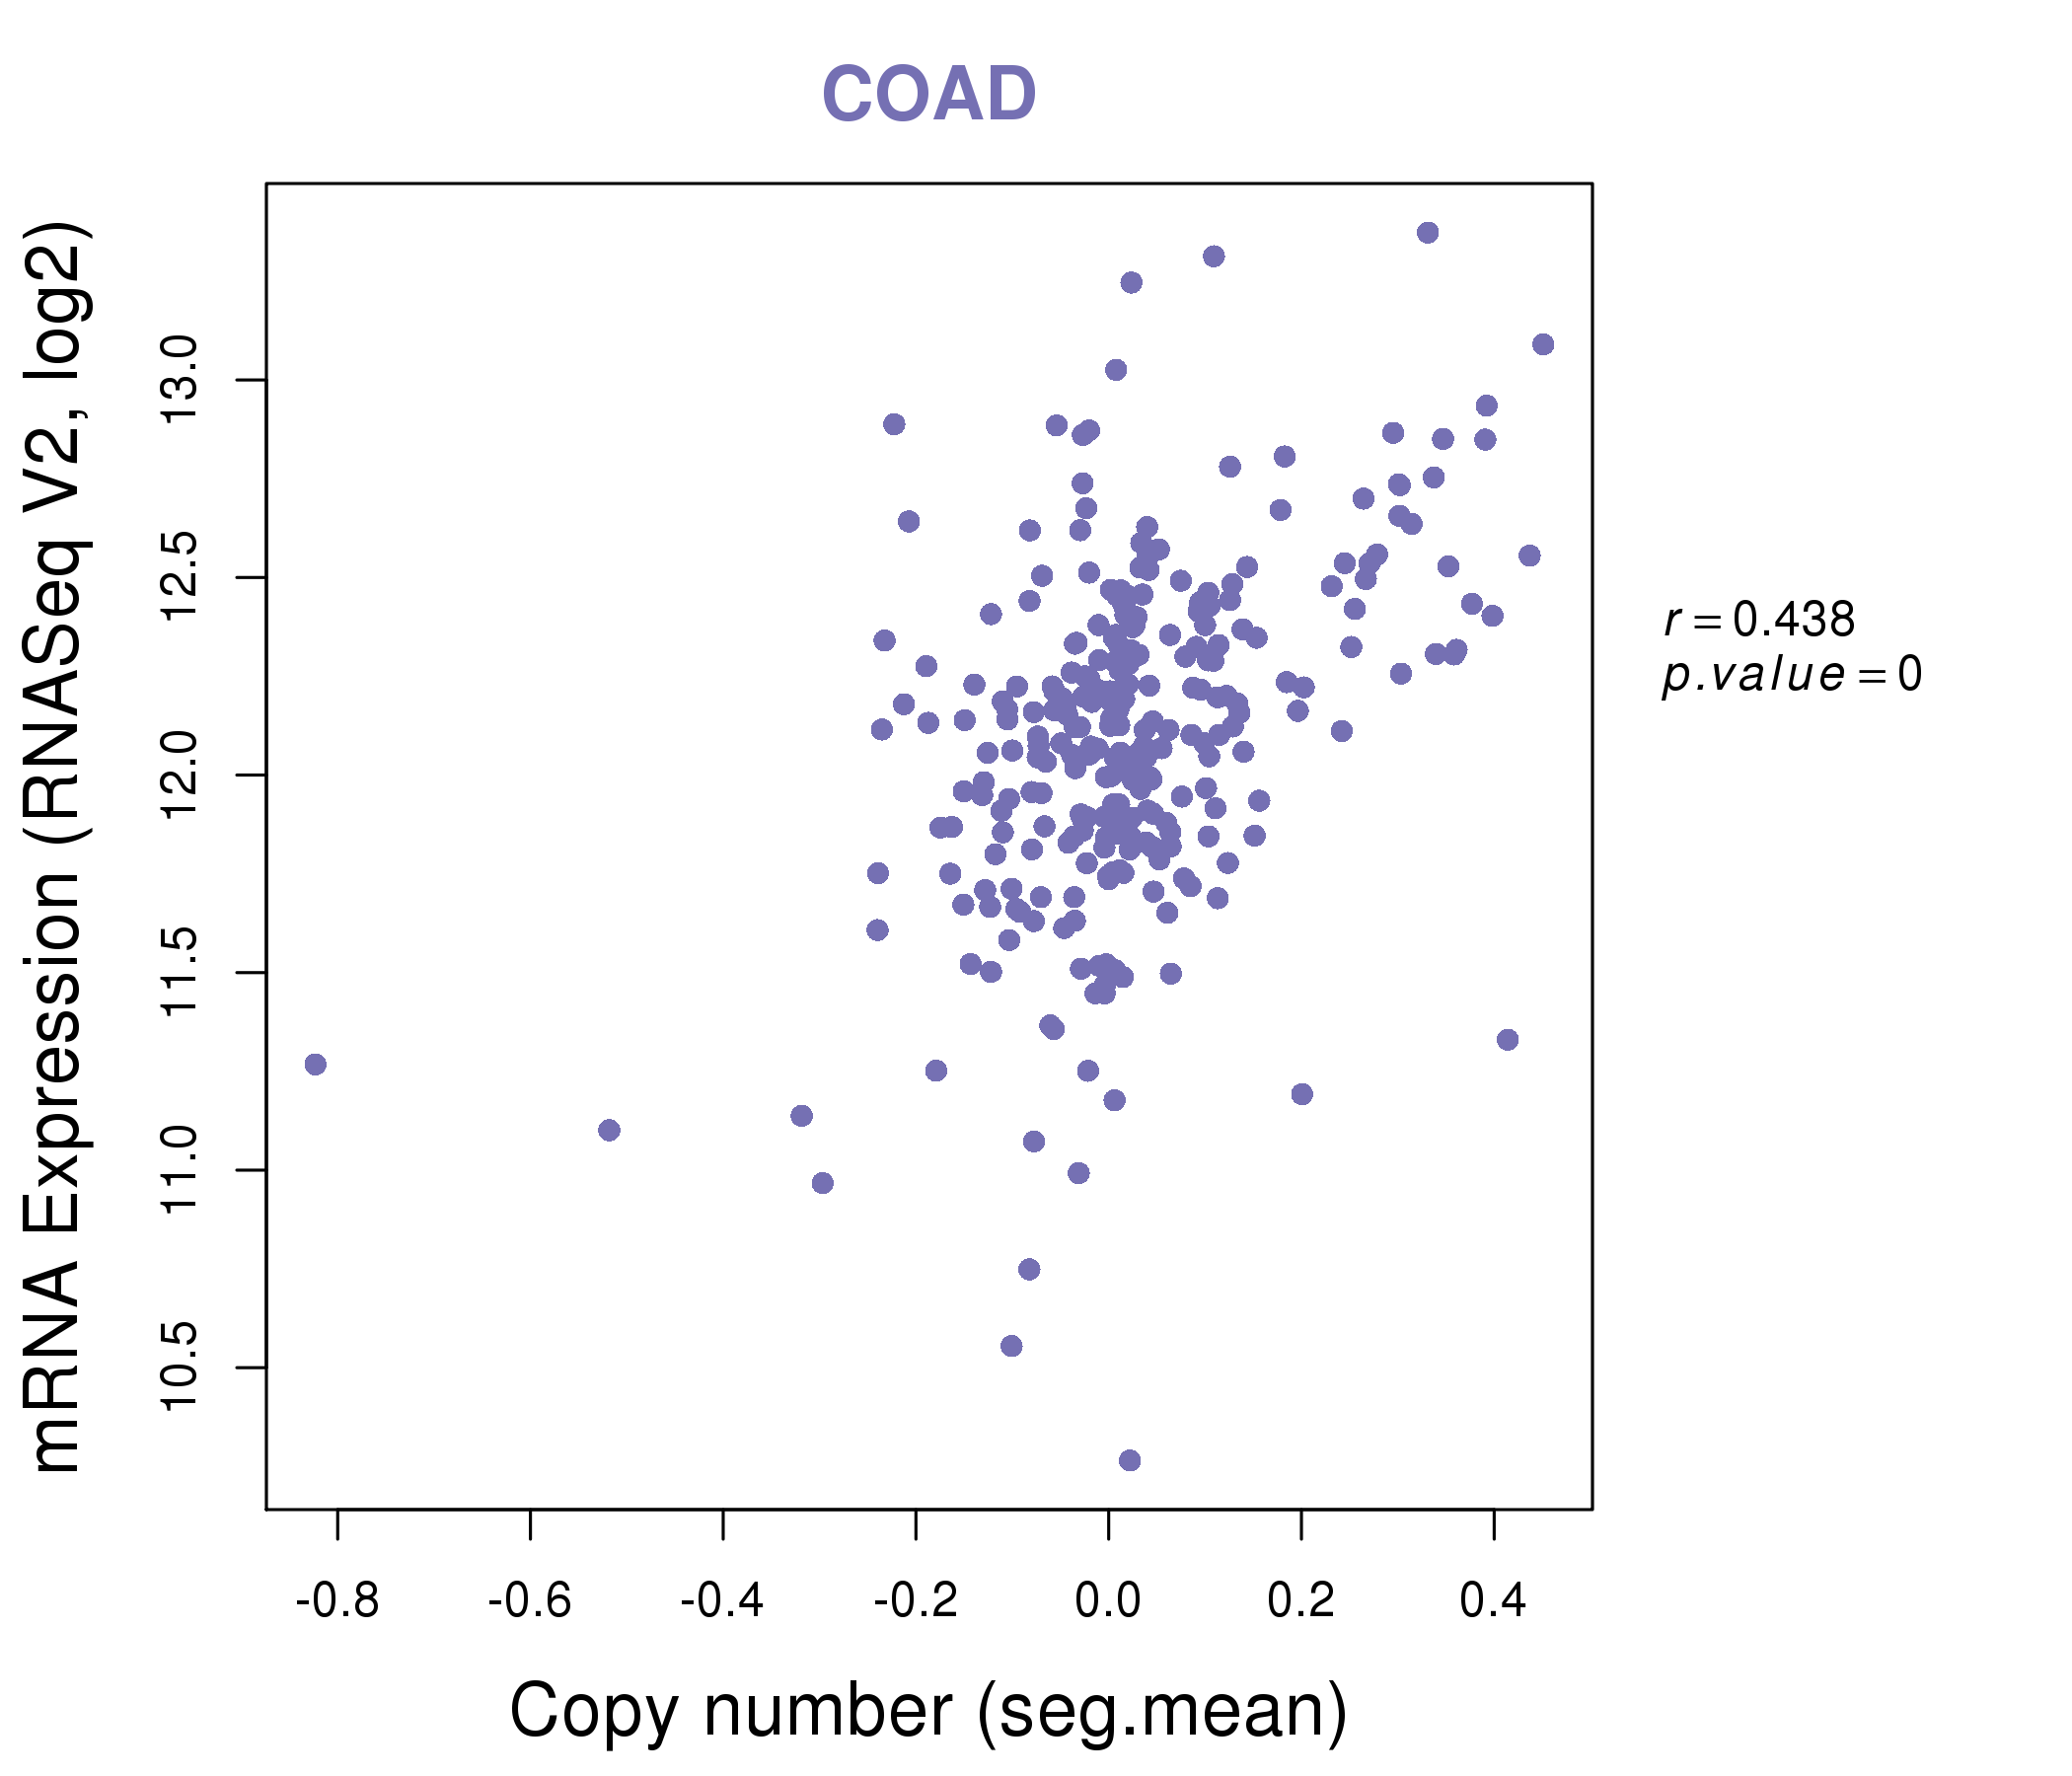
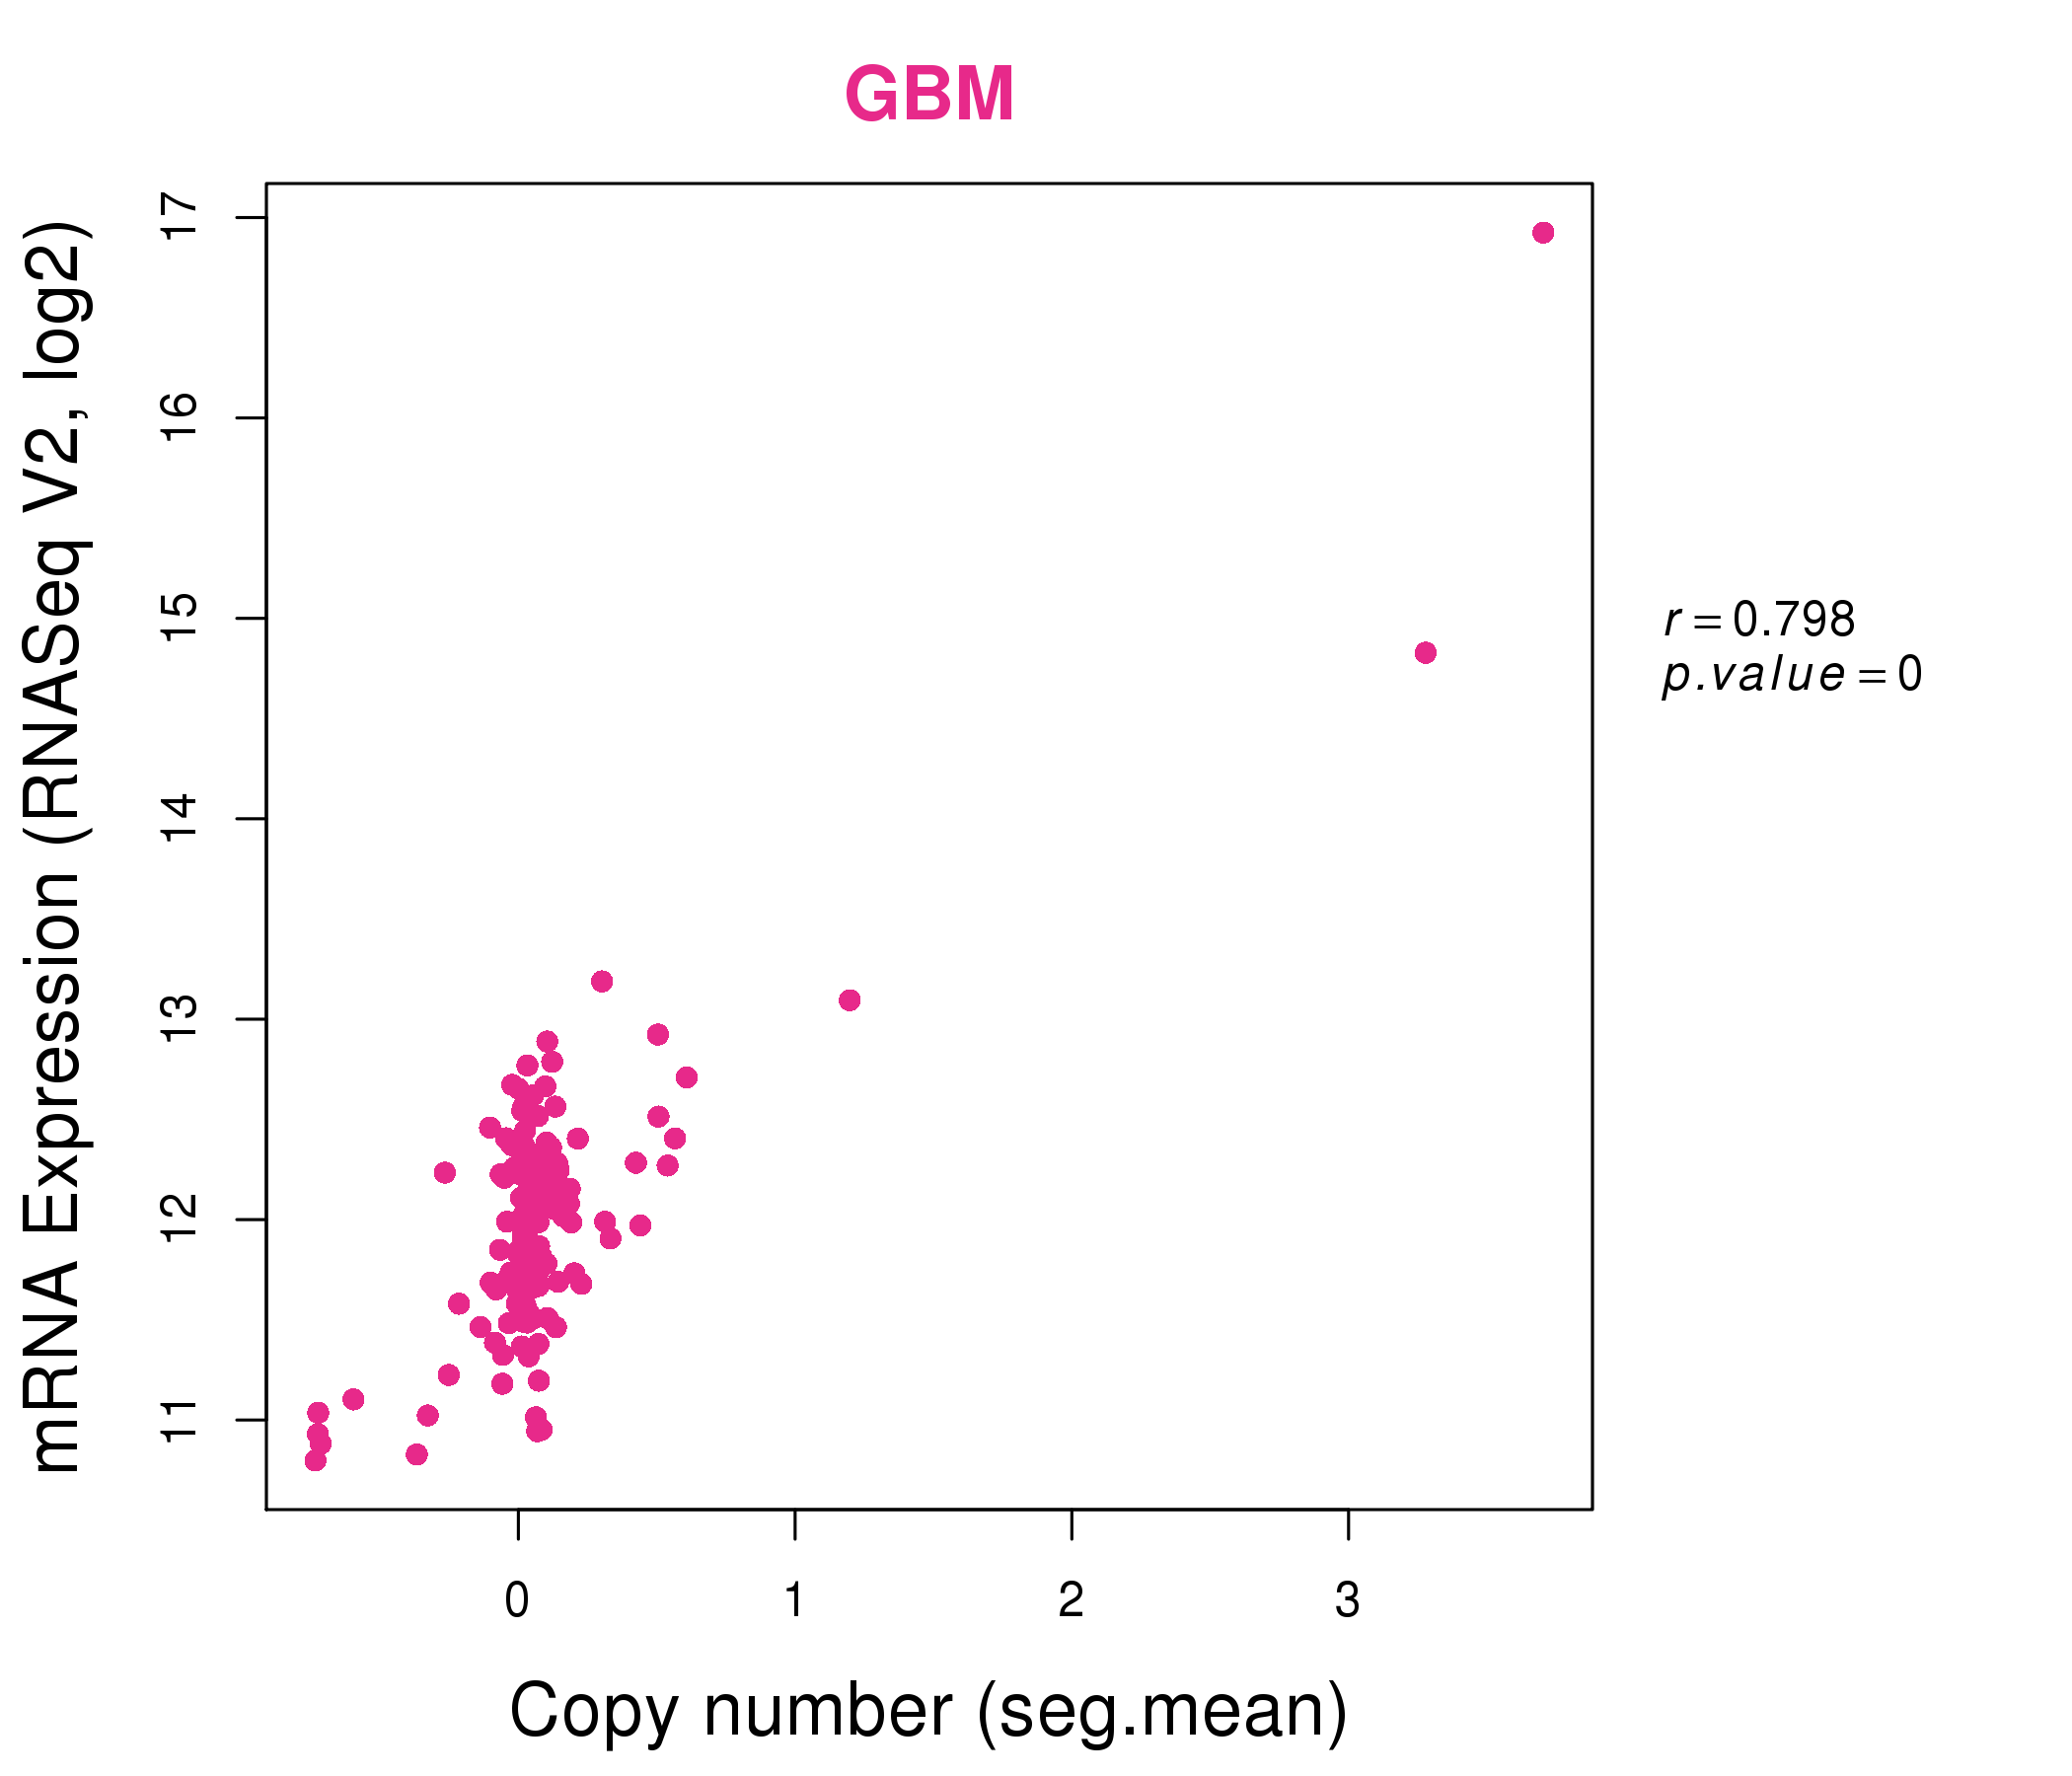
| * This plots show the correlation between CNV and gene expression. |
: Open all plots for all cancer types
 |
|
 |
|

| Top |
| Gene-Gene Network Information |
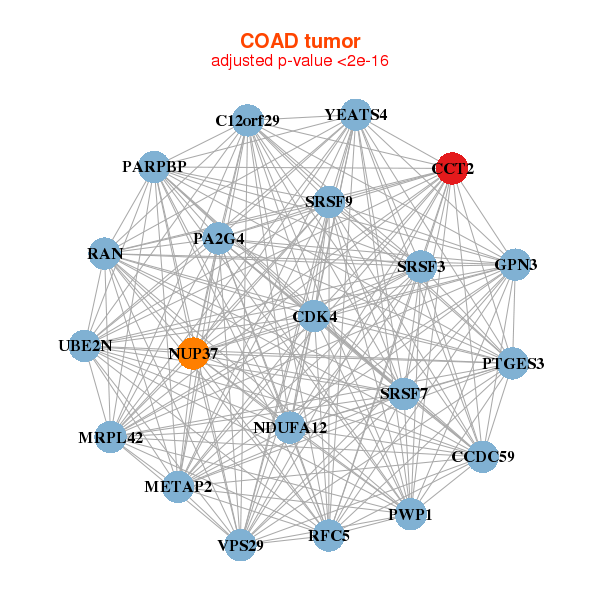
| * Co-Expression network figures were drawn using R package igraph. Only the top 20 genes with the highest correlations were shown. Red circle: input gene, orange circle: cell metabolism gene, sky circle: other gene |
: Open all plots for all cancer types
 |
|
| BEST3,LINC00320,CAND1,CCT2,CNOT2,CPSF6,FRS2, LEMD3,MDM1,MDM2,NUP107,RAB21,RAB3IP,RAP1B, SLC35E3,TBC1D15,TBK1,TMEM19,TSG1,YEATS4,YTHDF1 | CAND1,CCT2,CDK7,CNOT2,DCAF13,GMPS,GOLM1, GRIP1,HDAC2,ILF2,LRRC42,NME5,PAICS,PRPF4, RAB3IP,RFC4,SFXN2,SLC35E3,SPATS2,TMEM5,YEATS4 |
 |
|
| C12orf29,PARPBP,CCDC59,CCT2,CDK4,GPN3,METAP2, MRPL42,NDUFA12,NUP37,PA2G4,PTGES3,PWP1,RAN, RFC5,SRSF3,SRSF7,SRSF9,UBE2N,VPS29,YEATS4 | ABCE1,BCCIP,BRIX1,CCT2,CHAC2,DCAF13,EEF1E1, ENOPH1,HSPE1,METTL1,MRPL3,MRTO4,PAK1IP1,PINX1, PNO1,RAN,RPP40,SNRPD1,SRPRB,UTP6,WDR77 |
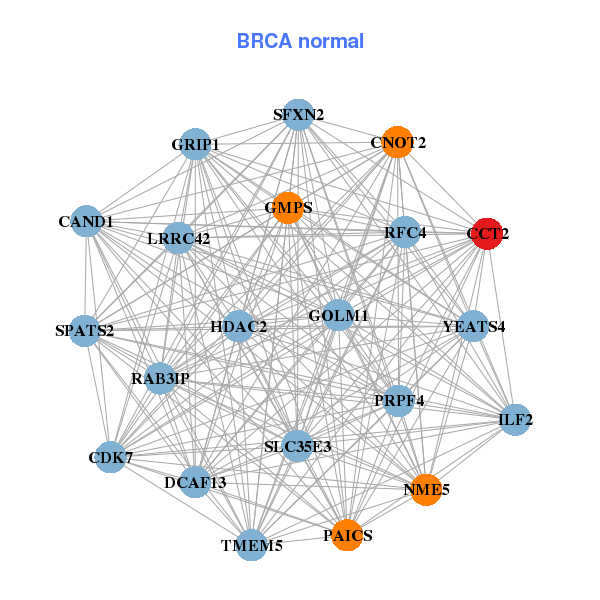
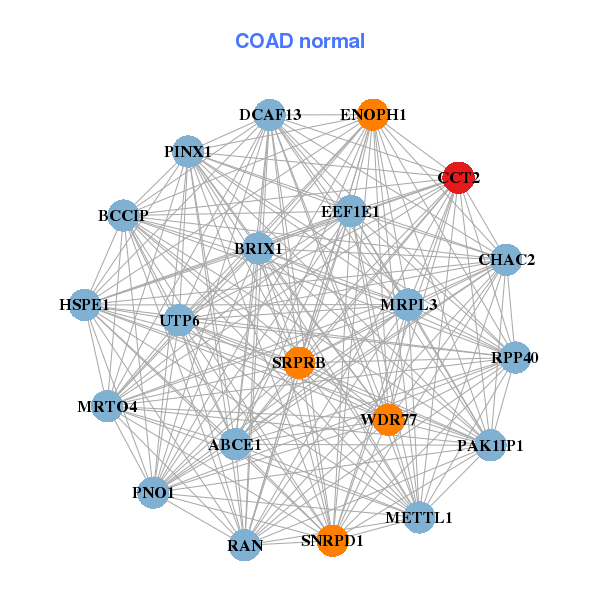
| * Co-Expression network figures were drawn using R package igraph. Only the top 20 genes with the highest correlations were shown. Red circle: input gene, orange circle: cell metabolism gene, sky circle: other gene |
: Open all plots for all cancer types
| Top |
: Open all interacting genes' information including KEGG pathway for all interacting genes from DAVID
| Top |
| Pharmacological Information for CCT2 |
| There's no related Drug. |
| Top |
| Cross referenced IDs for CCT2 |
| * We obtained these cross-references from Uniprot database. It covers 150 different DBs, 18 categories. http://www.uniprot.org/help/cross_references_section |
: Open all cross reference information
|
Copyright © 2016-Present - The Univsersity of Texas Health Science Center at Houston @ |