|
|||||||||||||||||||||||||||||||||||||||||||||||||||||||||||||||||||||||||||||||||||||||||||||||||||||||||||||||||||||||||||||||||||||||||||||||||||||||||||||||||||||||||||||||||||||||||||||||||||||||||||||||||||||||||||||||||||||||||||||||||||||||||||||||||||||||||||||||||||||||||||||||||||||||||||||||||||||||
| |
| Phenotypic Information (metabolism pathway, cancer, disease, phenome) |
| |
| |
| Gene-Gene Network Information: Co-Expression Network, Interacting Genes & KEGG |
| |
|


| Gene Summary for POLR3F |
| Top |
| Phenotypic Information for POLR3F(metabolism pathway, cancer, disease, phenome) |
| Cancer | CGAP: POLR3F |
| Familial Cancer Database: POLR3F | |
| * This gene is included in those cancer gene databases. |
|
|
|
|
|
| . | |||||||||||||||||||||||||||||||||||||||||||||||||||||||||||||||||||||||||||||||||||||||||||||||||||||||||||||||||||||||||||||||||||||||||||||||||||||||||||||||||||||||||||||||||||||||||||||||||||||||||||||||||||||||||||||||||||||||||||||||||||||||||||||||||||||||||||||||||||||||||||||||||||||||||||||||||
Oncogene 1 | Significant driver gene in | ||||||||||||||||||||||||||||||||||||||||||||||||||||||||||||||||||||||||||||||||||||||||||||||||||||||||||||||||||||||||||||||||||||||||||||||||||||||||||||||||||||||||||||||||||||||||||||||||||||||||||||||||||||||||||||||||||||||||||||||||||||||||||||||||||||||||||||||||||||||||||||||||||||||||||||||||||||||
| cf) number; DB name 1 Oncogene; http://nar.oxfordjournals.org/content/35/suppl_1/D721.long, 2 Tumor Suppressor gene; https://bioinfo.uth.edu/TSGene/, 3 Cancer Gene Census; http://www.nature.com/nrc/journal/v4/n3/abs/nrc1299.html, 4 CancerGenes; http://nar.oxfordjournals.org/content/35/suppl_1/D721.long, 5 Network of Cancer Gene; http://ncg.kcl.ac.uk/index.php, 1Therapeutic Vulnerabilities in Cancer; http://cbio.mskcc.org/cancergenomics/statius/ |
| KEGG_PURINE_METABOLISM KEGG_PYRIMIDINE_METABOLISM | |
| OMIM | |
| Orphanet | |
| Disease | KEGG Disease: POLR3F |
| MedGen: POLR3F (Human Medical Genetics with Condition) | |
| ClinVar: POLR3F | |
| Phenotype | MGI: POLR3F (International Mouse Phenotyping Consortium) |
| PhenomicDB: POLR3F | |
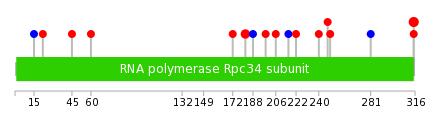
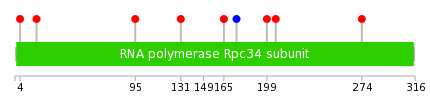
| Mutations for POLR3F |
| * Under tables are showing count per each tissue to give us broad intuition about tissue specific mutation patterns.You can go to the detailed page for each mutation database's web site. |
| There's no structural variation information in COSMIC data for this gene. |
| * From mRNA Sanger sequences, Chitars2.0 arranged chimeric transcripts. This table shows POLR3F related fusion information. |
| ID | Head Gene | Tail Gene | Accession | Gene_a | qStart_a | qEnd_a | Chromosome_a | tStart_a | tEnd_a | Gene_a | qStart_a | qEnd_a | Chromosome_a | tStart_a | tEnd_a |
| Top |
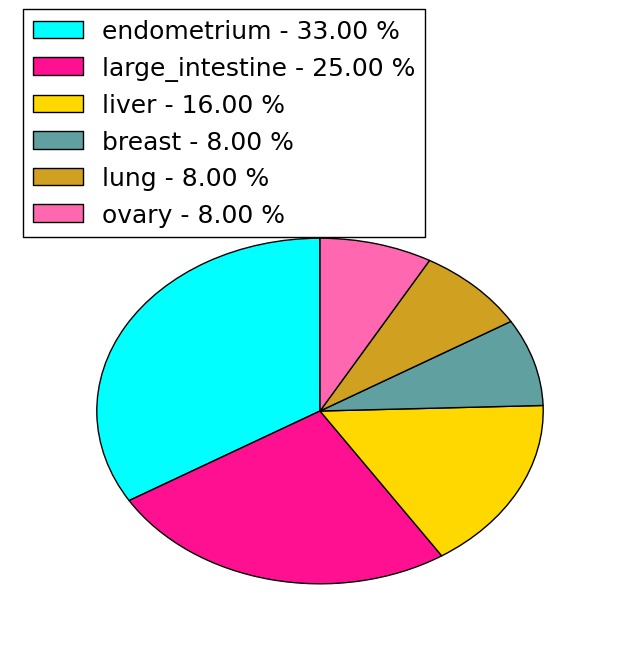
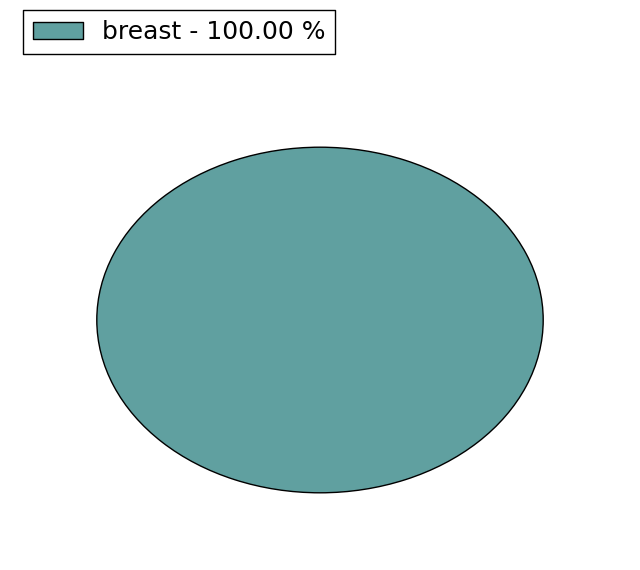
| Mutation type/ Tissue ID | brca | cns | cerv | endome | haematopo | kidn | Lintest | liver | lung | ns | ovary | pancre | prost | skin | stoma | thyro | urina | |||
| Total # sample | 1 | 1 | ||||||||||||||||||
| GAIN (# sample) | 1 | 1 | ||||||||||||||||||
| LOSS (# sample) |
| cf) Tissue ID; Tissue type (1; Breast, 2; Central_nervous_system, 3; Cervix, 4; Endometrium, 5; Haematopoietic_and_lymphoid_tissue, 6; Kidney, 7; Large_intestine, 8; Liver, 9; Lung, 10; NS, 11; Ovary, 12; Pancreas, 13; Prostate, 14; Skin, 15; Stomach, 16; Thyroid, 17; Urinary_tract) |
| Top |
|
 |
| Top |
| Stat. for Non-Synonymous SNVs (# total SNVs=12) | (# total SNVs=3) |
 |  |
(# total SNVs=1) | (# total SNVs=0) |
 |
| Top |
| * When you move the cursor on each content, you can see more deailed mutation information on the Tooltip. Those are primary_site,primary_histology,mutation(aa),pubmedID. |
| GRCh37 position | Mutation(aa) | Unique sampleID count |
| chr20:18464194-18464194 | p.E315Q | 4 |
| chr20:18460797-18460797 | p.Q182L | 2 |
| chr20:18461066-18461066 | p.S198R | 1 |
| chr20:18461089-18461089 | p.R206I | 1 |
| chr20:18461120-18461120 | p.V216V | 1 |
| chr20:18448195-18448195 | p.P15P | 1 |
| chr20:18461136-18461136 | p.E222K | 1 |
| chr20:18449589-18449589 | p.I22V | 1 |
| chr20:18462299-18462299 | p.N240H | 1 |
| chr20:18449658-18449658 | p.I45V | 1 |
| Top |
|
 |
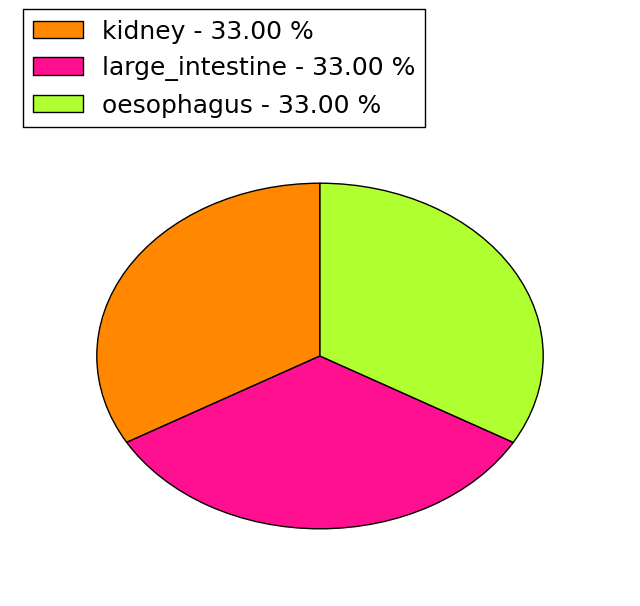
| Point Mutation/ Tissue ID | 1 | 2 | 3 | 4 | 5 | 6 | 7 | 8 | 9 | 10 | 11 | 12 | 13 | 14 | 15 | 16 | 17 | 18 | 19 | 20 |
| # sample | 1 | 3 | 1 | 1 | 1 | 2 | ||||||||||||||
| # mutation | 1 | 3 | 1 | 1 | 1 | 2 | ||||||||||||||
| nonsynonymous SNV | 1 | 2 | 1 | 1 | 1 | 2 | ||||||||||||||
| synonymous SNV | 1 |
| cf) Tissue ID; Tissue type (1; BLCA[Bladder Urothelial Carcinoma], 2; BRCA[Breast invasive carcinoma], 3; CESC[Cervical squamous cell carcinoma and endocervical adenocarcinoma], 4; COAD[Colon adenocarcinoma], 5; GBM[Glioblastoma multiforme], 6; Glioma Low Grade, 7; HNSC[Head and Neck squamous cell carcinoma], 8; KICH[Kidney Chromophobe], 9; KIRC[Kidney renal clear cell carcinoma], 10; KIRP[Kidney renal papillary cell carcinoma], 11; LAML[Acute Myeloid Leukemia], 12; LUAD[Lung adenocarcinoma], 13; LUSC[Lung squamous cell carcinoma], 14; OV[Ovarian serous cystadenocarcinoma ], 15; PAAD[Pancreatic adenocarcinoma], 16; PRAD[Prostate adenocarcinoma], 17; SKCM[Skin Cutaneous Melanoma], 18:STAD[Stomach adenocarcinoma], 19:THCA[Thyroid carcinoma], 20:UCEC[Uterine Corpus Endometrial Carcinoma]) |
| Top |
| * We represented just top 10 SNVs. When you move the cursor on each content, you can see more deailed mutation information on the Tooltip. Those are primary_site, primary_histology, mutation(aa), pubmedID. |
| Genomic Position | Mutation(aa) | Unique sampleID count |
| chr20:18464194 | p.E17K | 1 |
| chr20:18448199 | p.I4V,POLR3F | 1 |
| chr20:18449658 | p.I95M,POLR3F | 1 |
| chr20:18455810 | p.F131Y,POLR3F | 1 |
| chr20:18460767 | p.R165I,POLR3F | 1 |
| chr20:18461089 | p.V175V,POLR3F | 1 |
| chr20:18461120 | p.N199H,POLR3F | 1 |
| chr20:18462299 | p.K206N,POLR3F | 1 |
| chr20:18462322 | p.E274K,POLR3F | 1 |
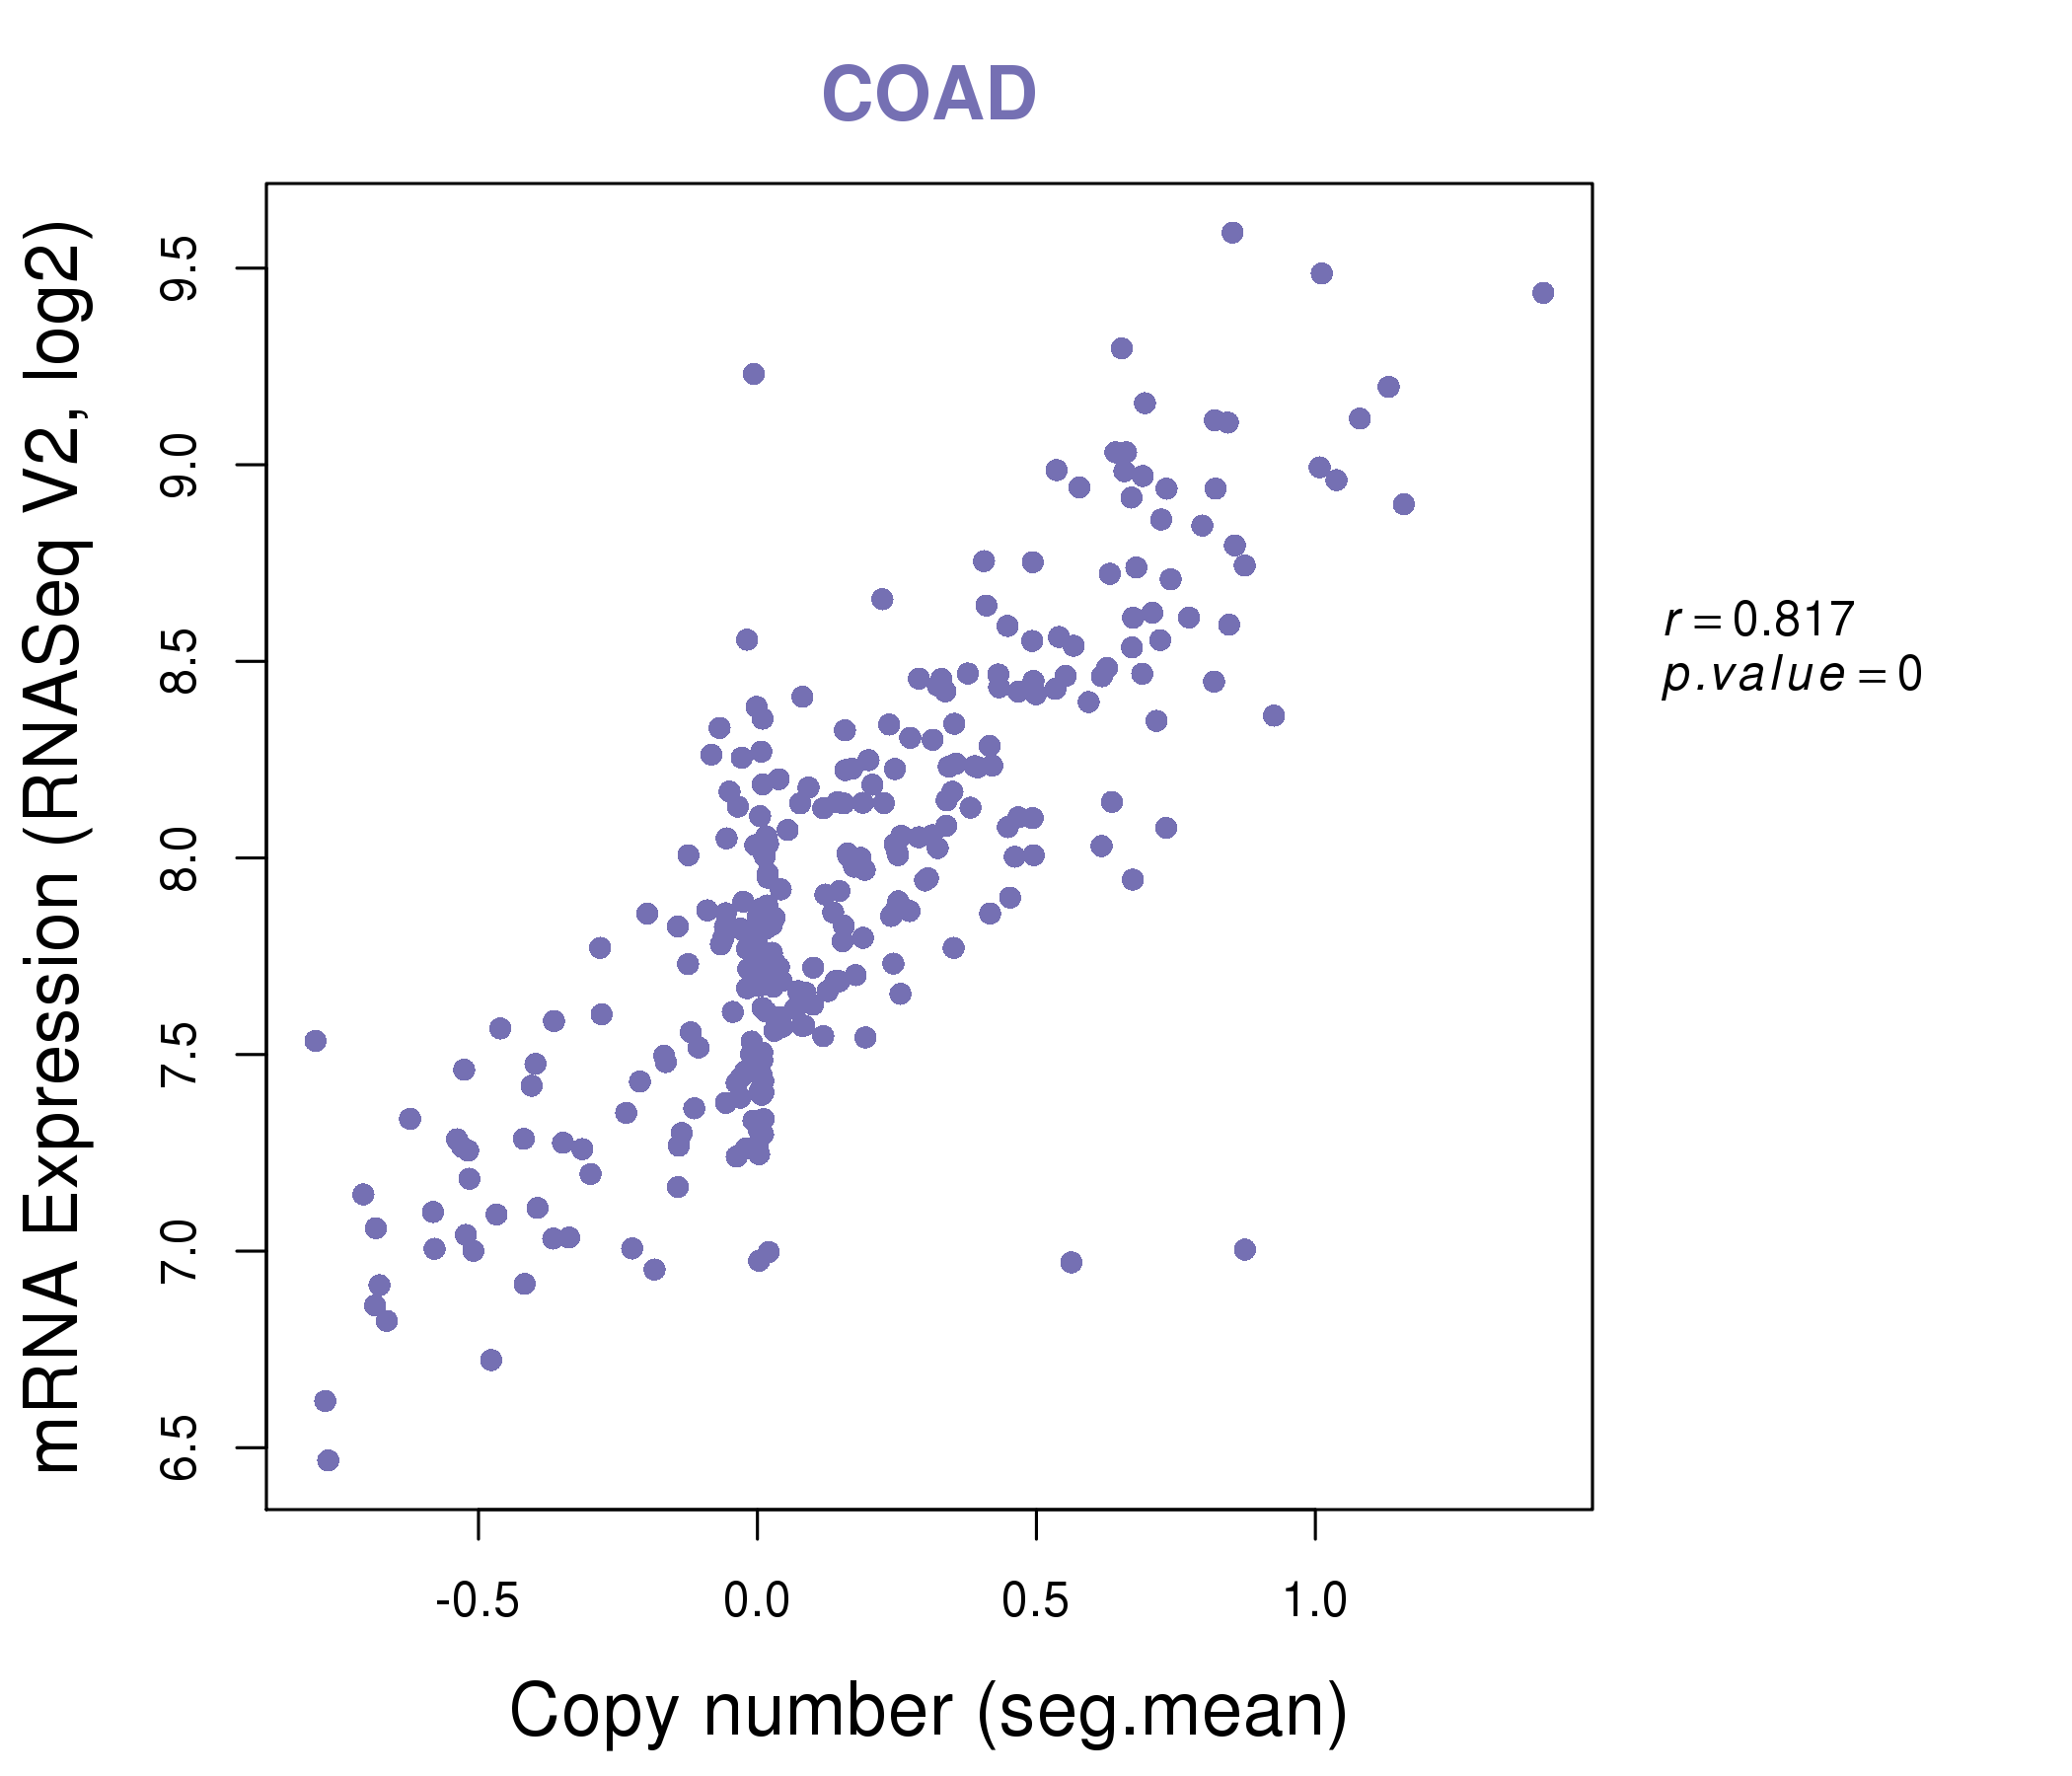
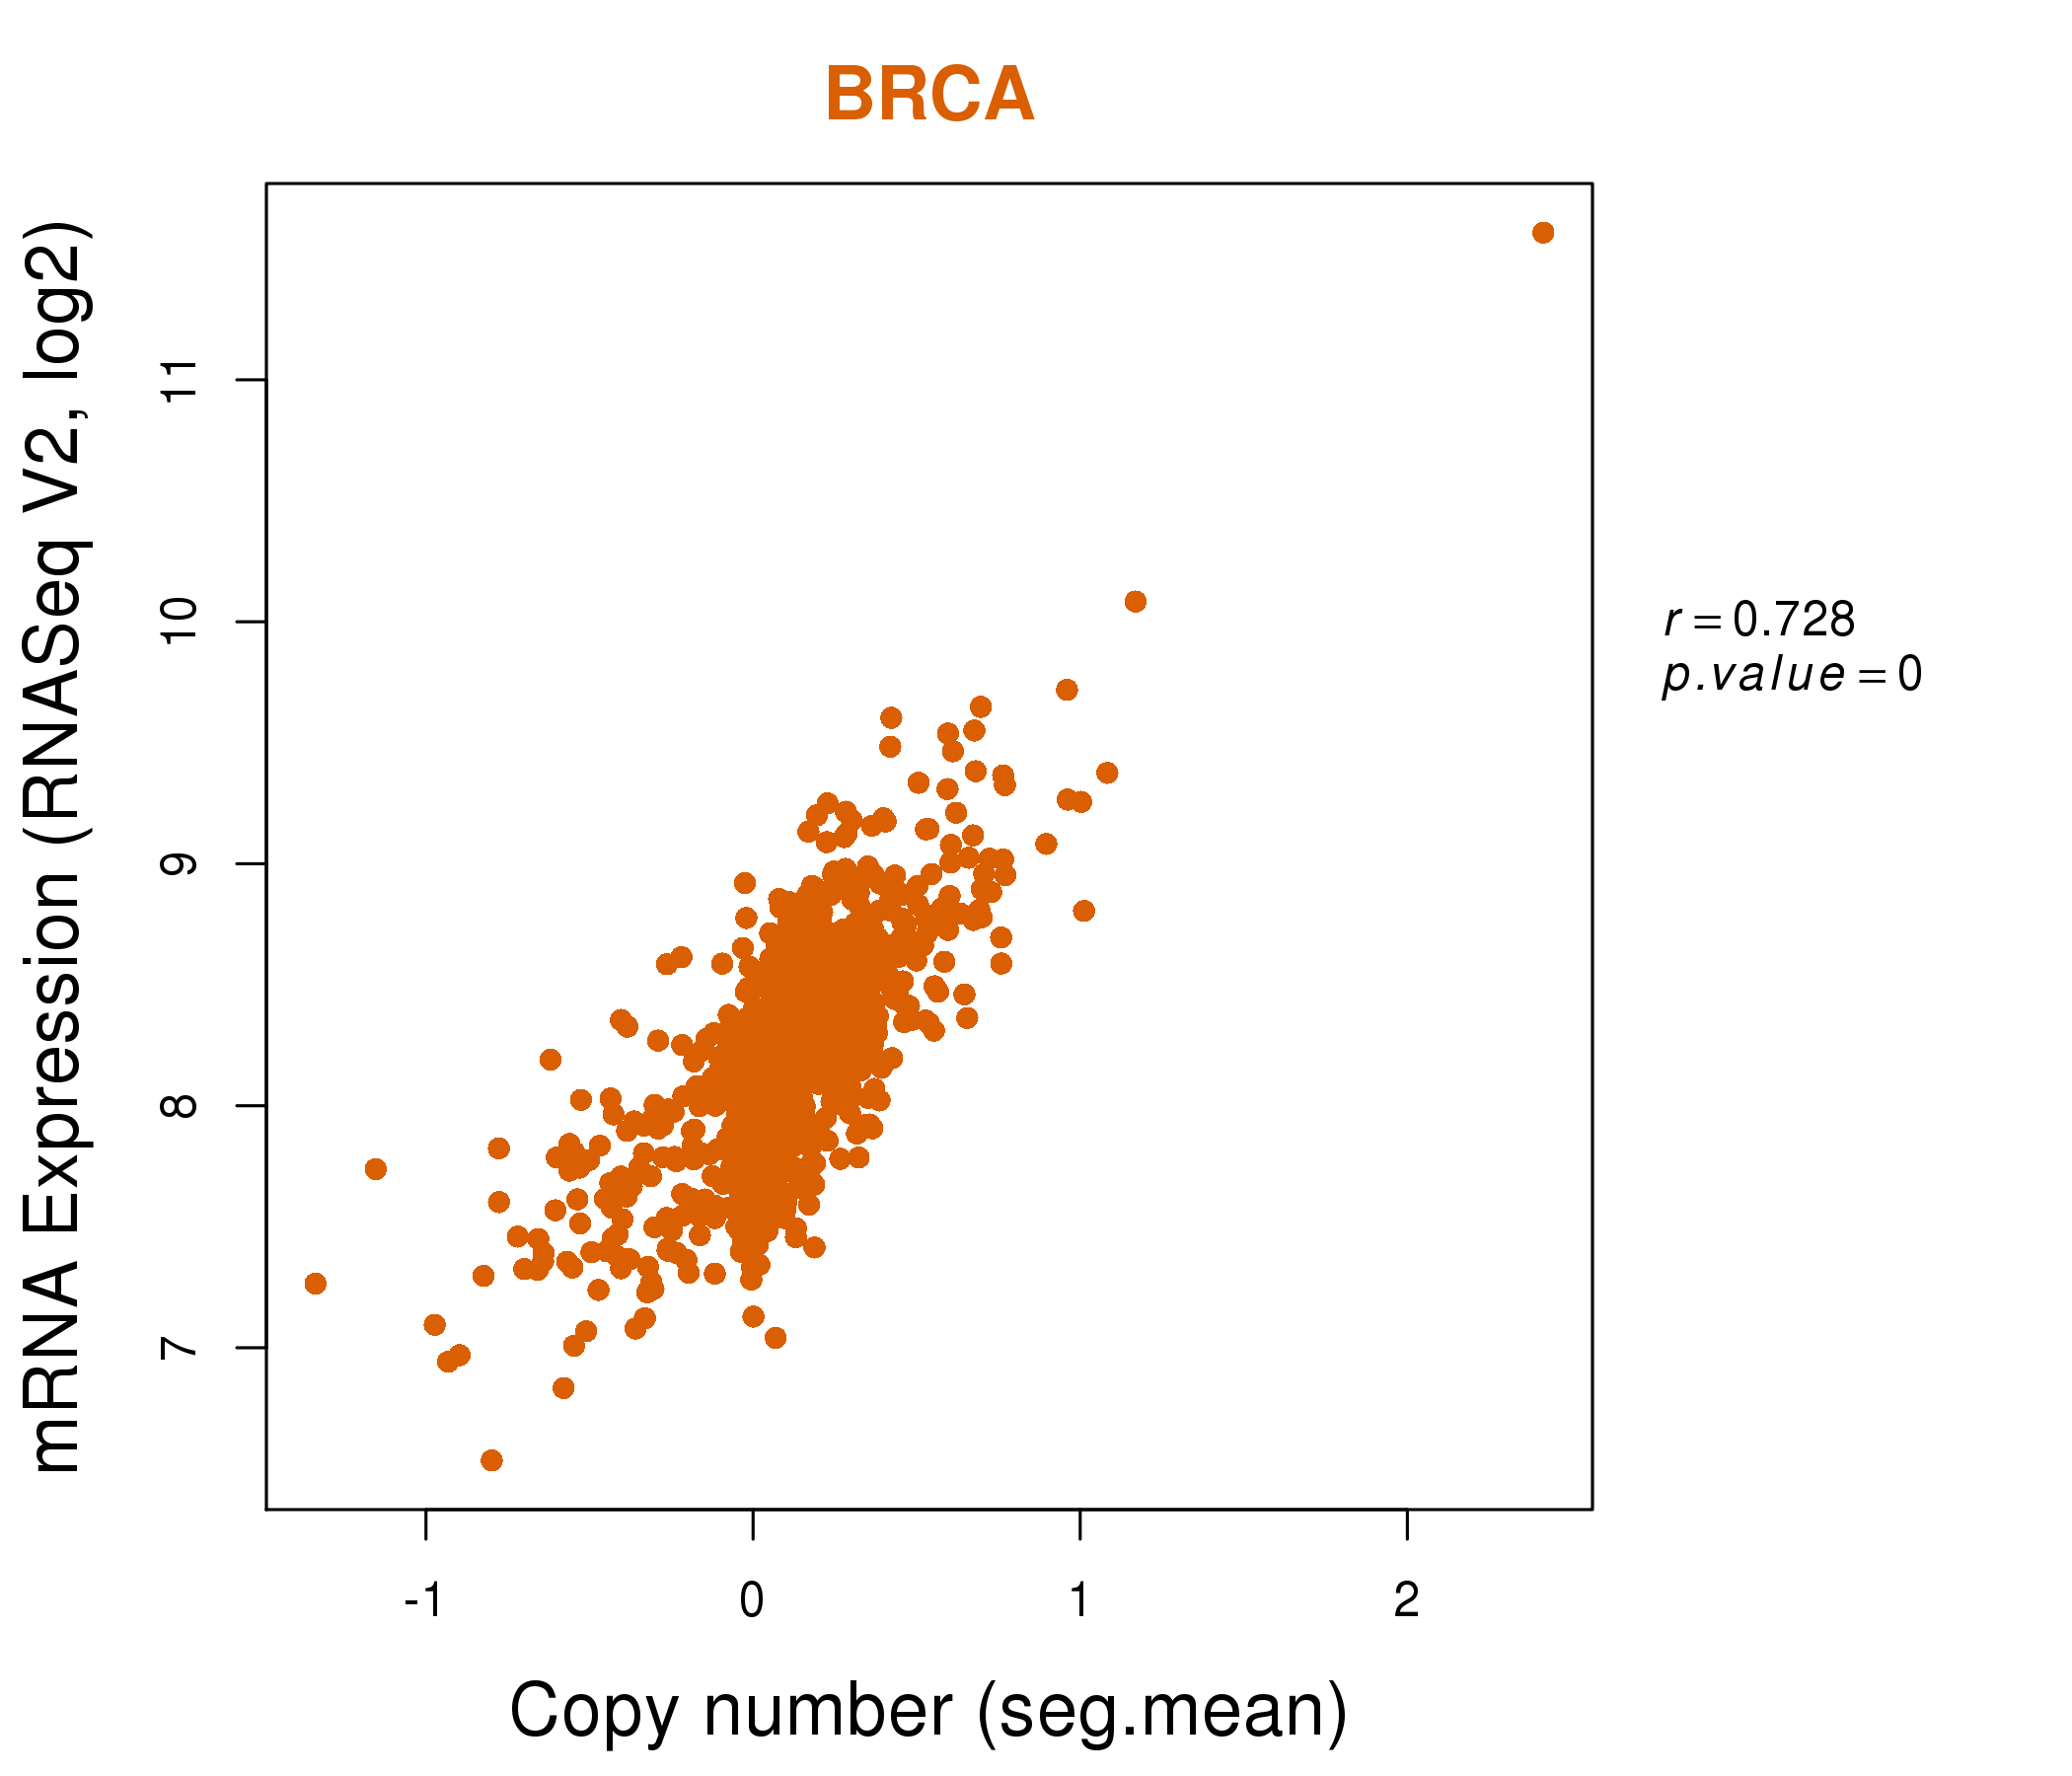
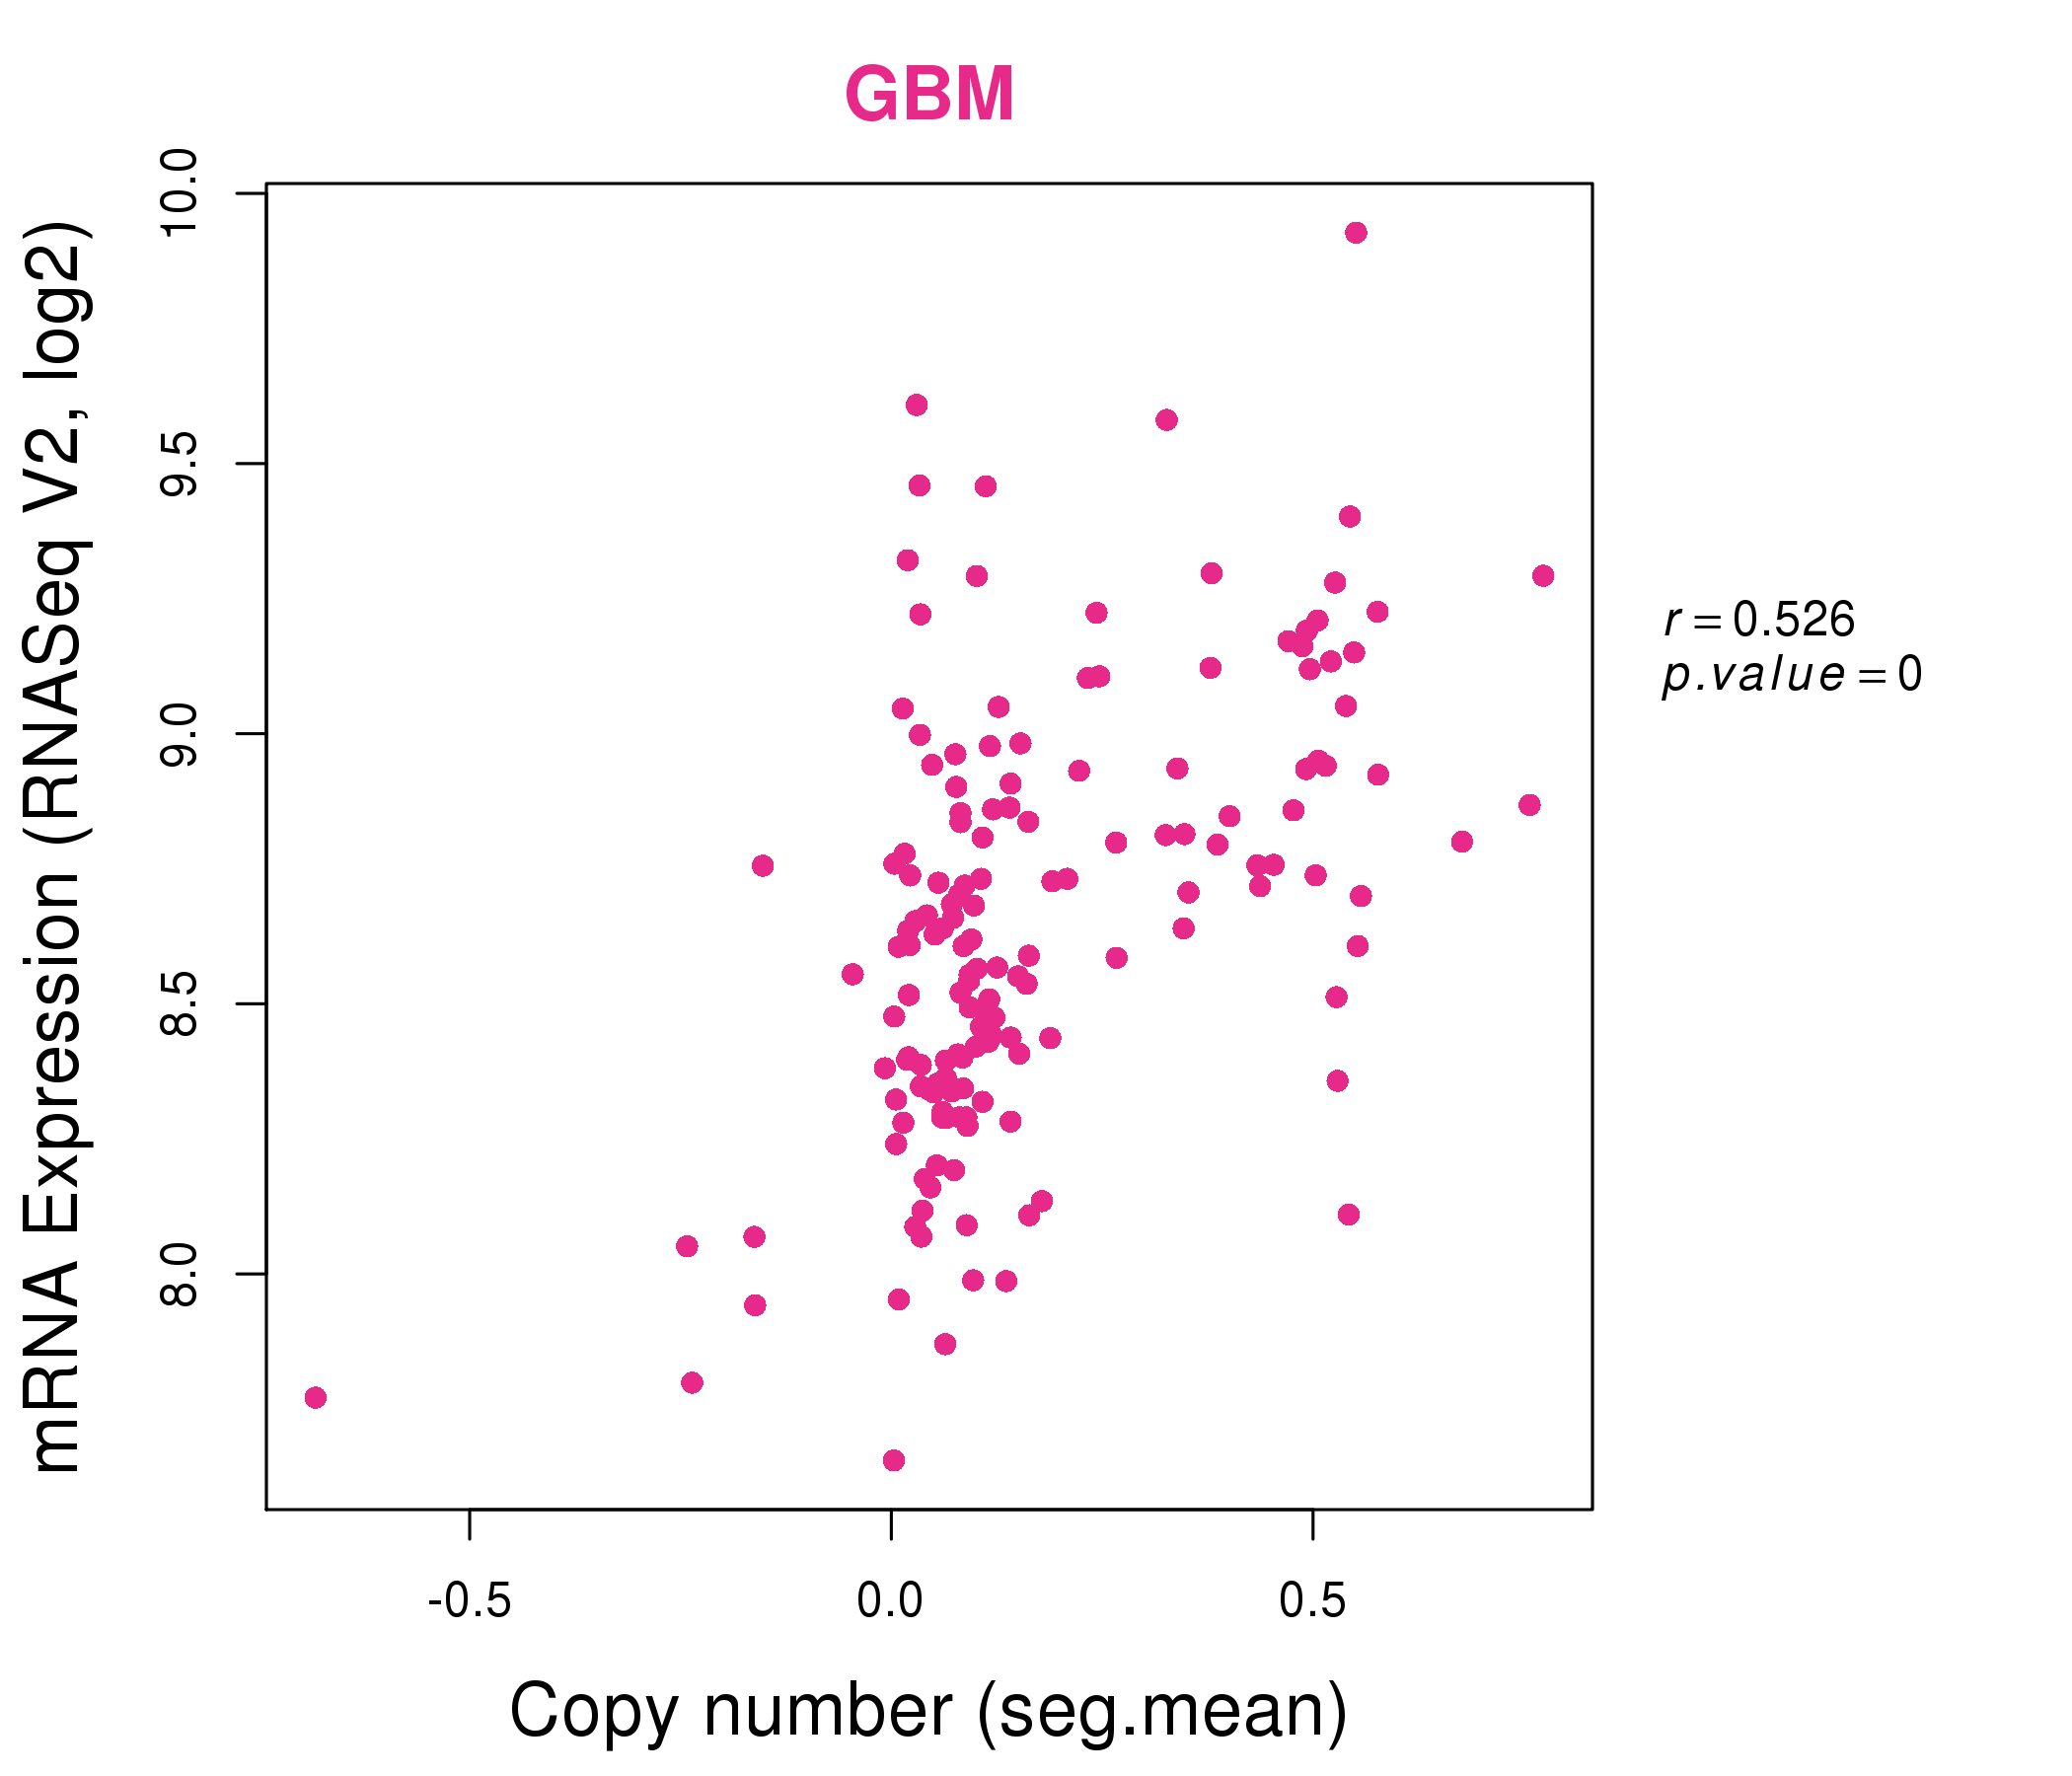
| * Copy number data were extracted from TCGA using R package TCGA-Assembler. The URLs of all public data files on TCGA DCC data server were gathered on Jan-05-2015. Function ProcessCNAData in TCGA-Assembler package was used to obtain gene-level copy number value which is calculated as the average copy number of the genomic region of a gene. |
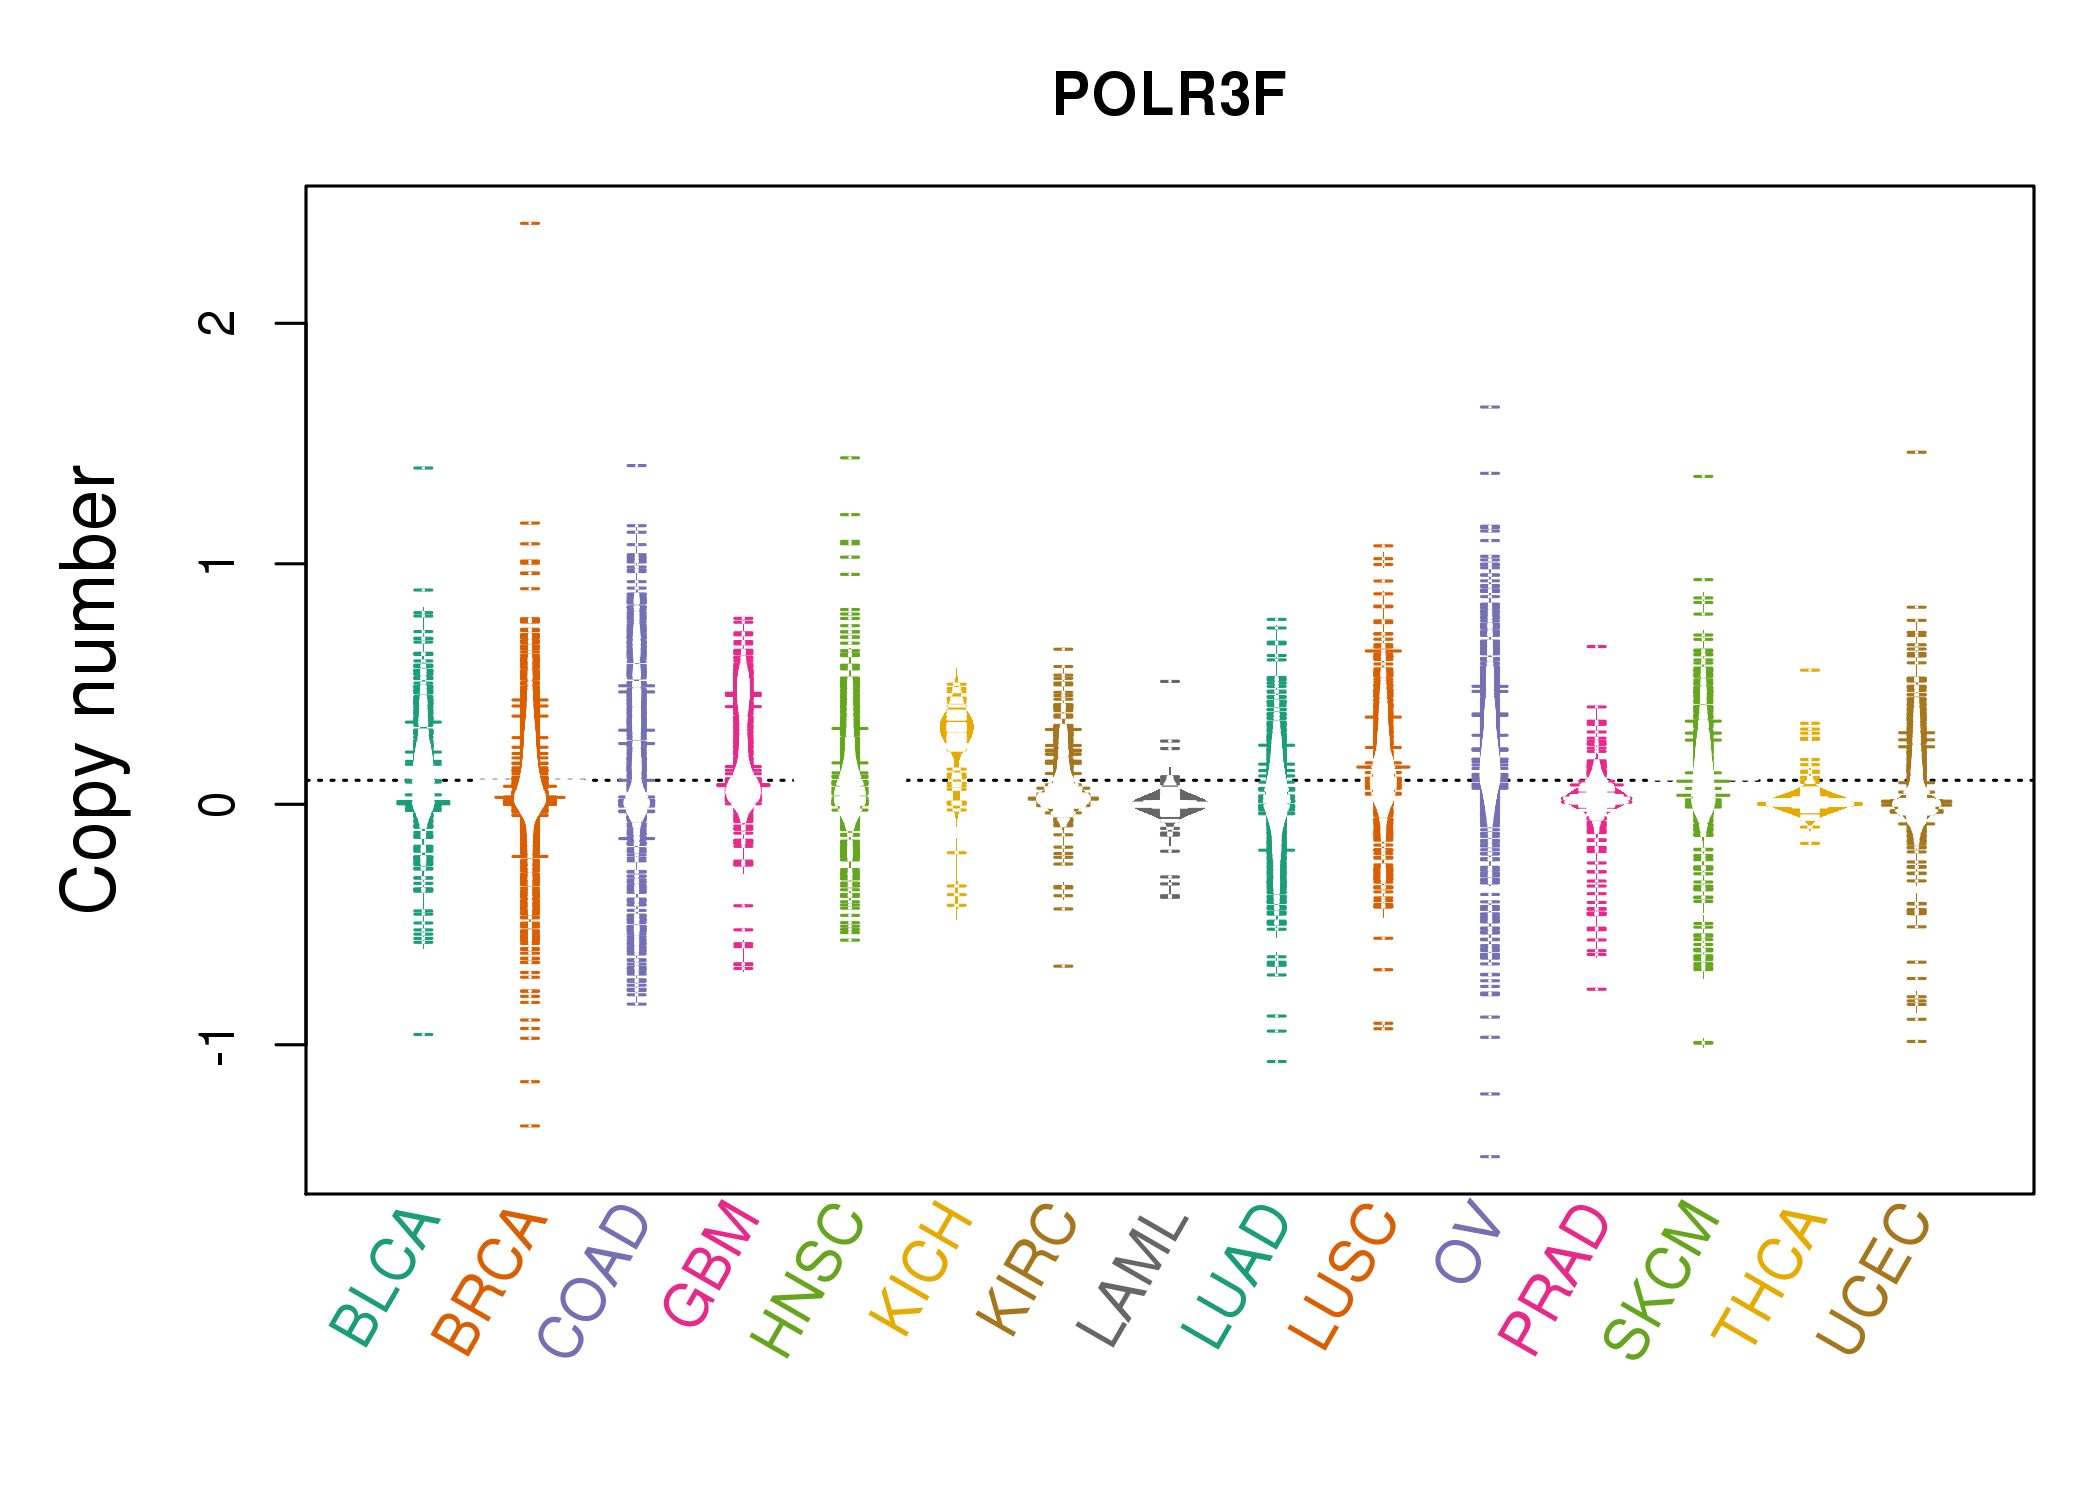 |
| cf) Tissue ID[Tissue type]: BLCA[Bladder Urothelial Carcinoma], BRCA[Breast invasive carcinoma], CESC[Cervical squamous cell carcinoma and endocervical adenocarcinoma], COAD[Colon adenocarcinoma], GBM[Glioblastoma multiforme], Glioma Low Grade, HNSC[Head and Neck squamous cell carcinoma], KICH[Kidney Chromophobe], KIRC[Kidney renal clear cell carcinoma], KIRP[Kidney renal papillary cell carcinoma], LAML[Acute Myeloid Leukemia], LUAD[Lung adenocarcinoma], LUSC[Lung squamous cell carcinoma], OV[Ovarian serous cystadenocarcinoma ], PAAD[Pancreatic adenocarcinoma], PRAD[Prostate adenocarcinoma], SKCM[Skin Cutaneous Melanoma], STAD[Stomach adenocarcinoma], THCA[Thyroid carcinoma], UCEC[Uterine Corpus Endometrial Carcinoma] |
| Top |
| Gene Expression for POLR3F |
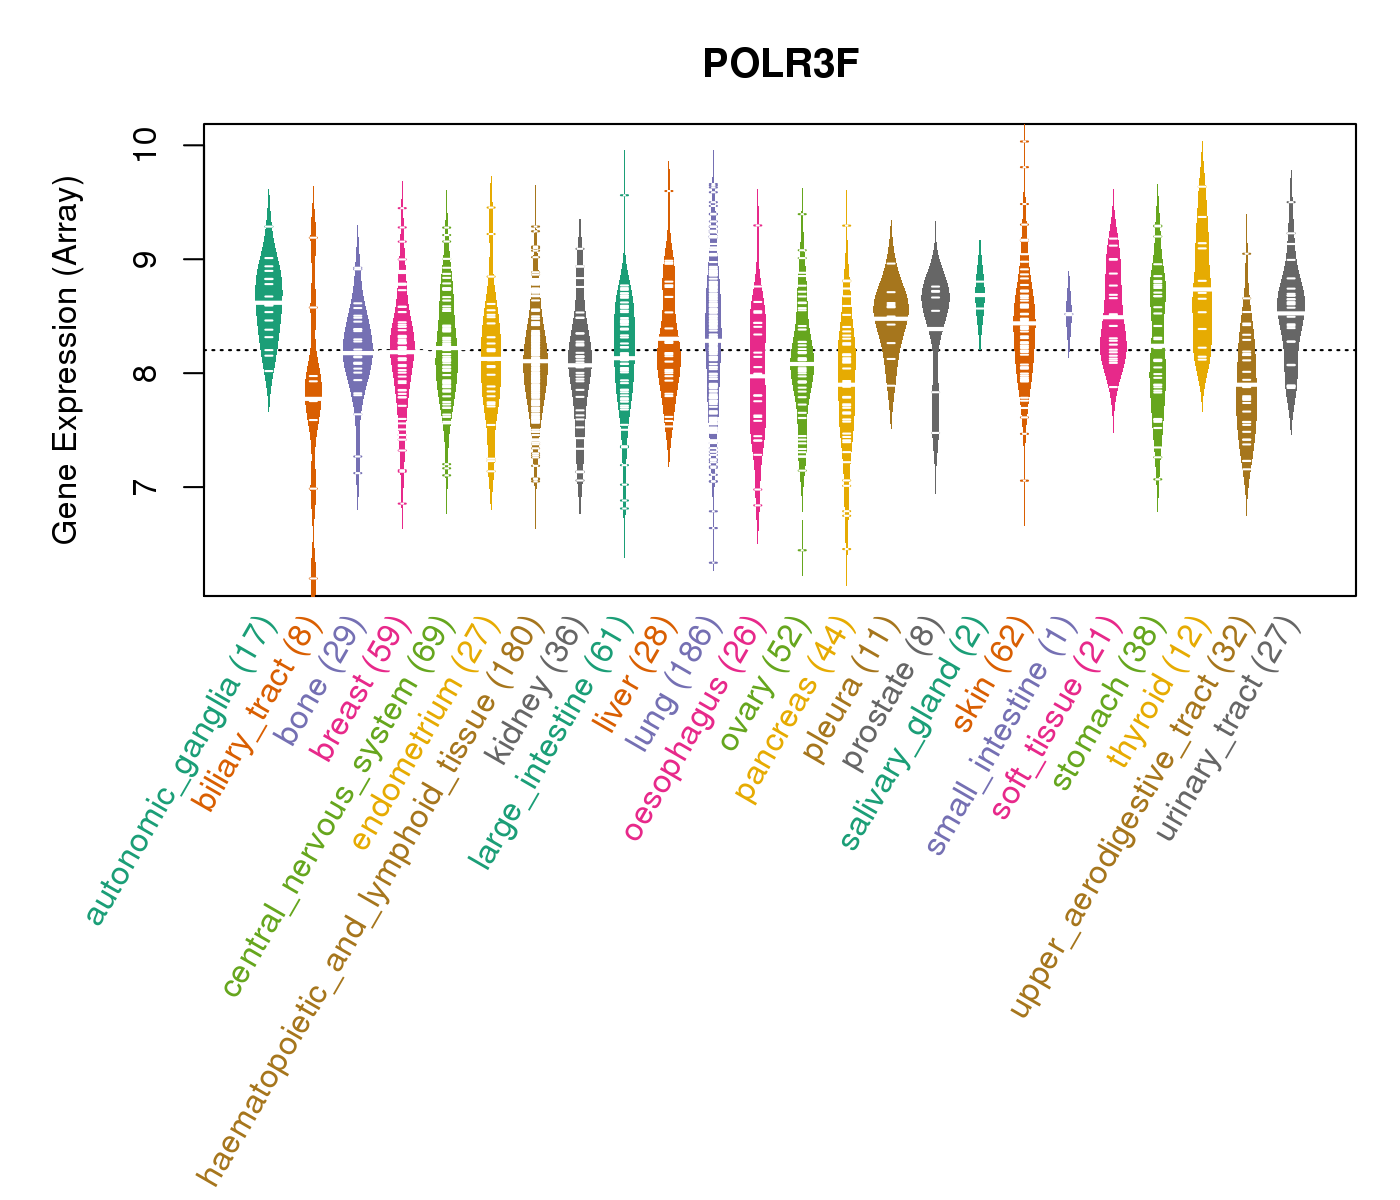
| * CCLE gene expression data were extracted from CCLE_Expression_Entrez_2012-10-18.res: Gene-centric RMA-normalized mRNA expression data. |
 |
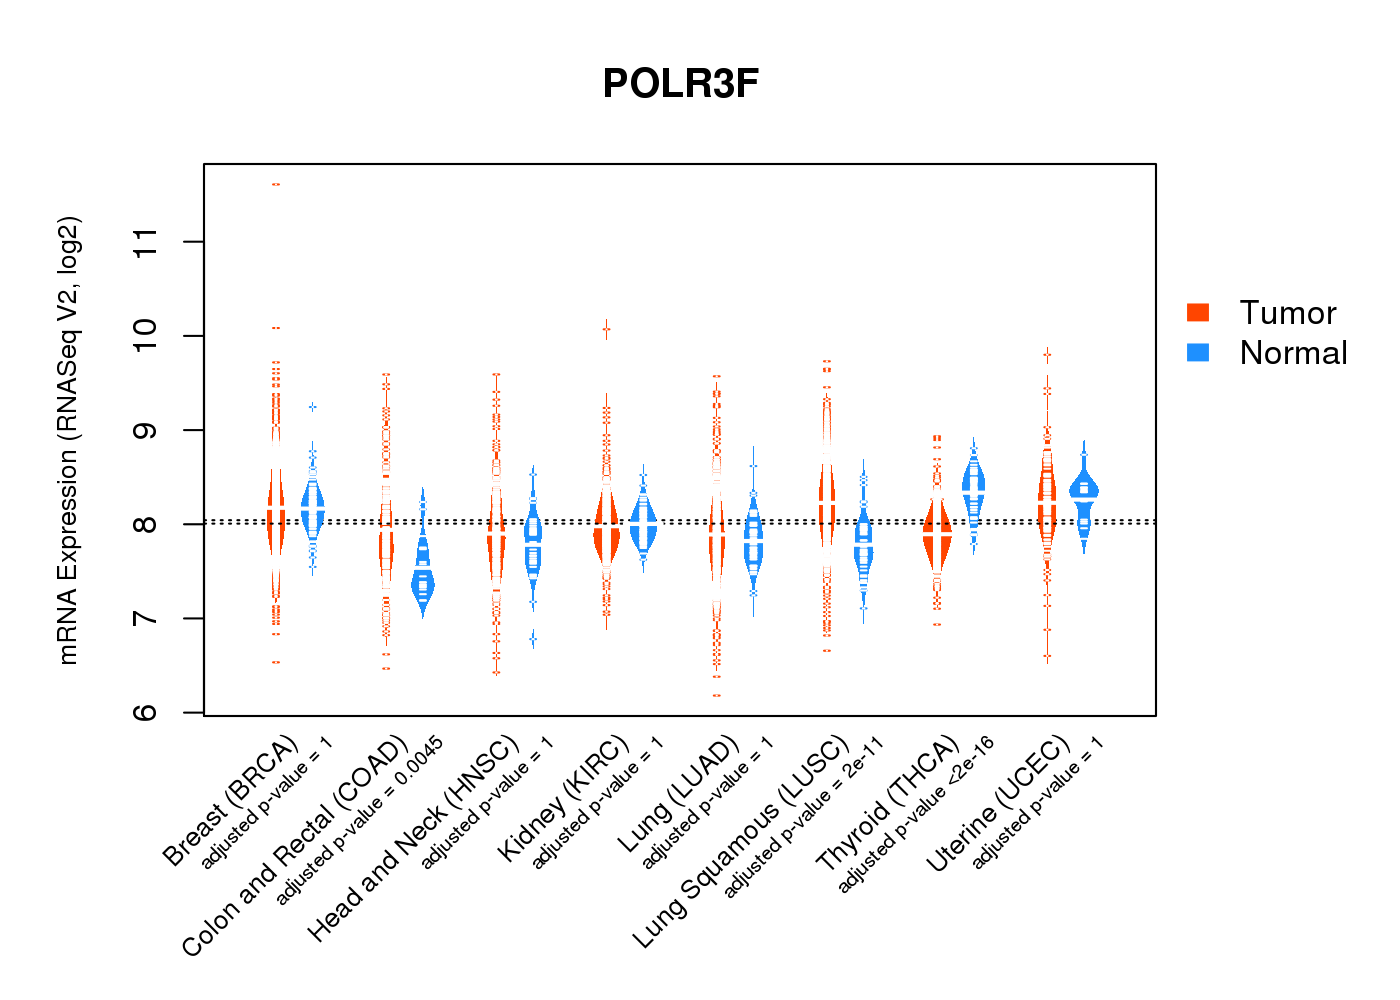
| * Normalized gene expression data of RNASeqV2 was extracted from TCGA using R package TCGA-Assembler. The URLs of all public data files on TCGA DCC data server were gathered at Jan-05-2015. Only eight cancer types have enough normal control samples for differential expression analysis. (t test, adjusted p<0.05 (using Benjamini-Hochberg FDR)) |
 |
| Top |
| * This plots show the correlation between CNV and gene expression. |
: Open all plots for all cancer types
 |
|
 |
|
| Top |
| Gene-Gene Network Information |
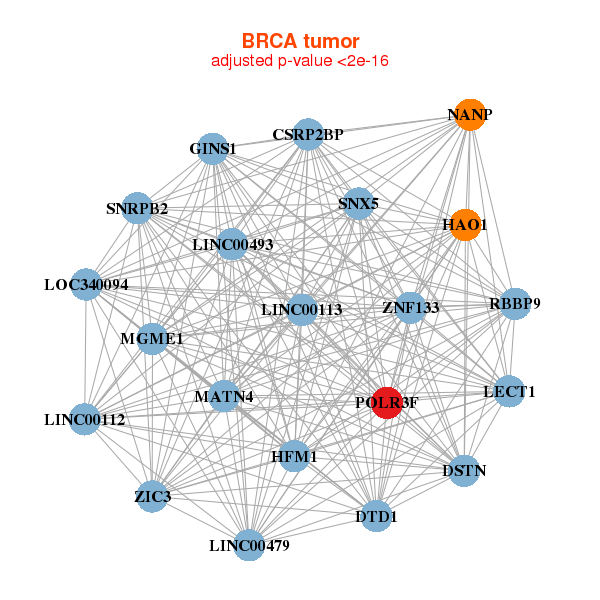
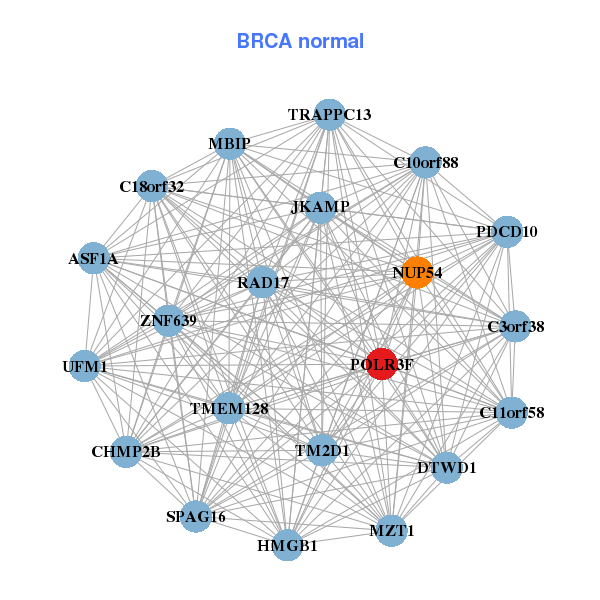
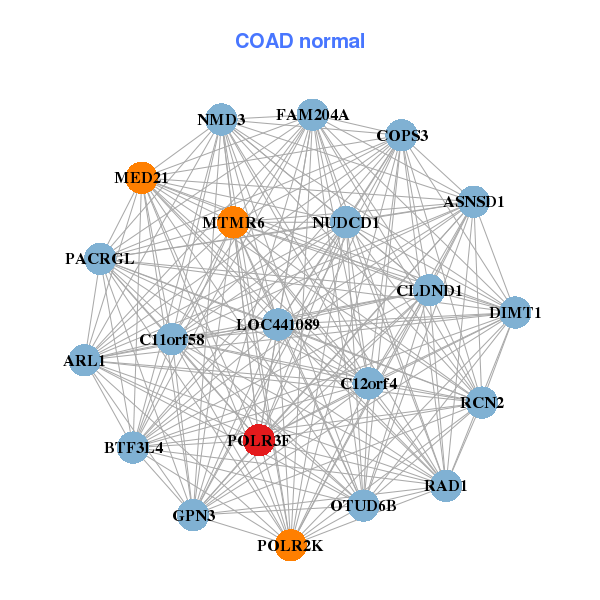
| * Co-Expression network figures were drawn using R package igraph. Only the top 20 genes with the highest correlations were shown. Red circle: input gene, orange circle: cell metabolism gene, sky circle: other gene |
: Open all plots for all cancer types
 |
|
| MGME1,LINC00479,CSRP2BP,DSTN,DTD1,GINS1,HAO1, HFM1,LECT1,LOC340094,LINC00493,MATN4,NANP,LINC00112, LINC00113,POLR3F,RBBP9,SNRPB2,SNX5,ZIC3,ZNF133 | ASF1A,C10orf88,C11orf58,MZT1,C18orf32,C3orf38,TRAPPC13, CHMP2B,DTWD1,HMGB1,JKAMP,MBIP,NUP54,PDCD10, POLR3F,RAD17,SPAG16,TM2D1,TMEM128,UFM1,ZNF639 |
 |
|
| TMEM230,MGME1,NDUFAF5,CRLS1,CRNKL1,CSRP2BP,DTD1, ESF1,LINC00493,MKKS,NAA20,PCNA,POLR3F,RBBP9, SEC23B,SNRPB2,SNX5,TASP1,TRMT6,XRN2,ZNF133 | ARL1,ASNSD1,BTF3L4,FAM204A,C11orf58,C12orf4,CLDND1, COPS3,DIMT1,GPN3,LOC441089,MED21,MTMR6,NMD3, NUDCD1,OTUD6B,PACRGL,POLR2K,POLR3F,RAD1,RCN2 |
| * Co-Expression network figures were drawn using R package igraph. Only the top 20 genes with the highest correlations were shown. Red circle: input gene, orange circle: cell metabolism gene, sky circle: other gene |
: Open all plots for all cancer types
| Top |
: Open all interacting genes' information including KEGG pathway for all interacting genes from DAVID
| Top |
| Pharmacological Information for POLR3F |
| There's no related Drug. |
| Top |
| Cross referenced IDs for POLR3F |
| * We obtained these cross-references from Uniprot database. It covers 150 different DBs, 18 categories. http://www.uniprot.org/help/cross_references_section |
: Open all cross reference information
|
Copyright © 2016-Present - The Univsersity of Texas Health Science Center at Houston @ |