|
||||||||||||||||||||||||||||||||||||||||||||||||||||||||||||||||||||||||||||||||||||||||||||||||||||||||||||||||||||||||||||||||||||||||||||||||||||||||||||||||||||||||||||||||||||||||||||||||||||||||||||||||||||||||||||||||||||||||||||||||||||||||||||||||||||||||||||||||||||||||||||||||||||||||||||||||||||||||||
| |
| Phenotypic Information (metabolism pathway, cancer, disease, phenome) |
| |
| |
| Gene-Gene Network Information: Co-Expression Network, Interacting Genes & KEGG |
| |
|


| Gene Summary for POLR3C |
| Basic gene info. | Gene symbol | POLR3C |
| Gene name | polymerase (RNA) III (DNA directed) polypeptide C (62kD) | |
| Synonyms | RPC3|RPC62 | |
| Cytomap | UCSC genome browser: 1q21.1 | |
| Genomic location | chr1 :145592604-145610884 | |
| Type of gene | protein-coding | |
| RefGenes | NM_006468.6, | |
| Ensembl id | ENSG00000264806 | |
| Description | DNA-directed III 62 kDa polypeptideDNA-directed RNA polymerase III subunit CDNA-directed RNA polymerase III subunit RPC3RNA polymerase III 62 kDa subunitRNA polymerase III subunit C3 | |
| Modification date | 20141207 | |
| dbXrefs | HGNC : HGNC | |
| Ensembl : ENSG00000186141 | ||
| HPRD : 17880 | ||
| Vega : OTTHUMG00000013753 | ||
| Protein | UniProt: go to UniProt's Cross Reference DB Table | |
| Expression | CleanEX: HS_POLR3C | |
| BioGPS: 10623 | ||
| Gene Expression Atlas: ENSG00000264806 | ||
| The Human Protein Atlas: ENSG00000264806 | ||
| Pathway | NCI Pathway Interaction Database: POLR3C | |
| KEGG: POLR3C | ||
| REACTOME: POLR3C | ||
| ConsensusPathDB | ||
| Pathway Commons: POLR3C | ||
| Metabolism | MetaCyc: POLR3C | |
| HUMANCyc: POLR3C | ||
| Regulation | Ensembl's Regulation: ENSG00000264806 | |
| miRBase: chr1 :145,592,604-145,610,884 | ||
| TargetScan: NM_006468 | ||
| cisRED: ENSG00000264806 | ||
| Context | iHOP: POLR3C | |
| cancer metabolism search in PubMed: POLR3C | ||
| UCL Cancer Institute: POLR3C | ||
| Assigned class in ccmGDB | C | |
| Top |
| Phenotypic Information for POLR3C(metabolism pathway, cancer, disease, phenome) |
| Cancer | CGAP: POLR3C |
| Familial Cancer Database: POLR3C | |
| * This gene is included in those cancer gene databases. |
|
|
|
|
|
| . | ||||||||||||||||||||||||||||||||||||||||||||||||||||||||||||||||||||||||||||||||||||||||||||||||||||||||||||||||||||||||||||||||||||||||||||||||||||||||||||||||||||||||||||||||||||||||||||||||||||||||||||||||||||||||||||||||||||||||||||||||||||||||||||||||||||||||||||||||||||||||||||||||||||||||||||||||||||
Oncogene 1 | Significant driver gene in | |||||||||||||||||||||||||||||||||||||||||||||||||||||||||||||||||||||||||||||||||||||||||||||||||||||||||||||||||||||||||||||||||||||||||||||||||||||||||||||||||||||||||||||||||||||||||||||||||||||||||||||||||||||||||||||||||||||||||||||||||||||||||||||||||||||||||||||||||||||||||||||||||||||||||||||||||||||||||
| cf) number; DB name 1 Oncogene; http://nar.oxfordjournals.org/content/35/suppl_1/D721.long, 2 Tumor Suppressor gene; https://bioinfo.uth.edu/TSGene/, 3 Cancer Gene Census; http://www.nature.com/nrc/journal/v4/n3/abs/nrc1299.html, 4 CancerGenes; http://nar.oxfordjournals.org/content/35/suppl_1/D721.long, 5 Network of Cancer Gene; http://ncg.kcl.ac.uk/index.php, 1Therapeutic Vulnerabilities in Cancer; http://cbio.mskcc.org/cancergenomics/statius/ |
| KEGG_PURINE_METABOLISM KEGG_PYRIMIDINE_METABOLISM | |
| OMIM | |
| Orphanet | |
| Disease | KEGG Disease: POLR3C |
| MedGen: POLR3C (Human Medical Genetics with Condition) | |
| ClinVar: POLR3C | |
| Phenotype | MGI: POLR3C (International Mouse Phenotyping Consortium) |
| PhenomicDB: POLR3C | |
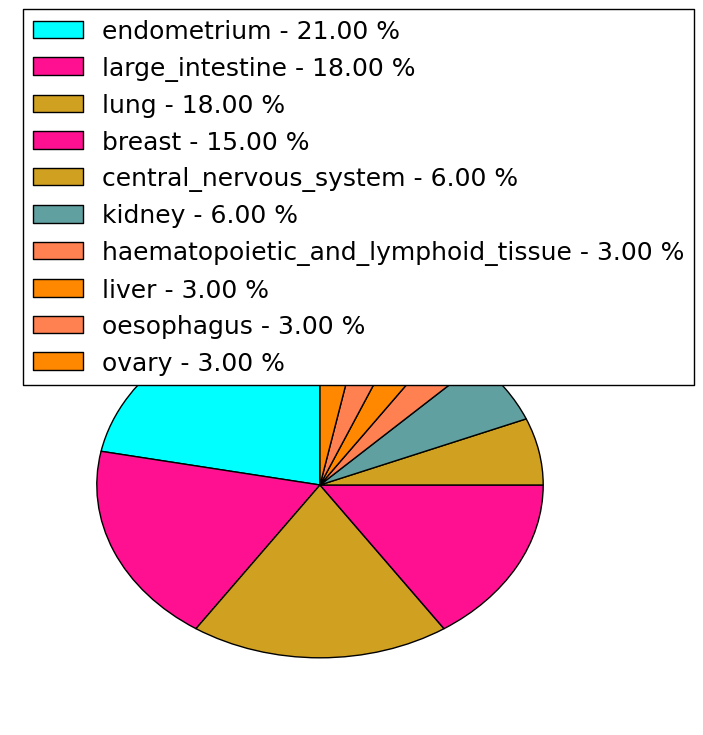
| Mutations for POLR3C |
| * Under tables are showing count per each tissue to give us broad intuition about tissue specific mutation patterns.You can go to the detailed page for each mutation database's web site. |
| - Statistics for Tissue and Mutation type | Top |
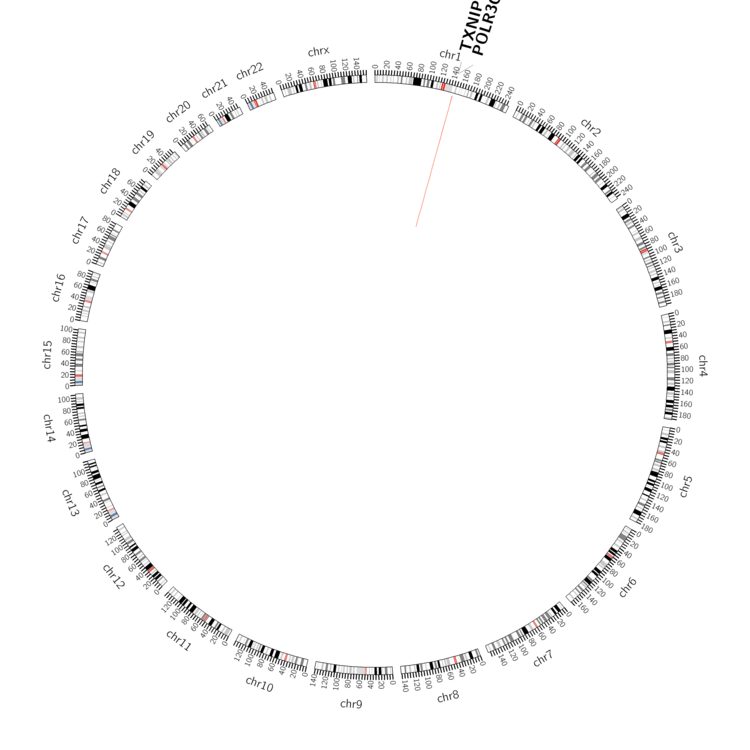 |
| - For Inter-chromosomal Variations |
| There's no inter-chromosomal structural variation. |
| - For Intra-chromosomal Variations |
| * Intra-chromosomal variantions includes 'intrachromosomal amplicon to amplicon', 'intrachromosomal amplicon to non-amplified dna', 'intrachromosomal deletion', 'intrachromosomal fold-back inversion', 'intrachromosomal inversion', 'intrachromosomal tandem duplication', 'Intrachromosomal unknown type', 'intrachromosomal with inverted orientation', 'intrachromosomal with non-inverted orientation'. |
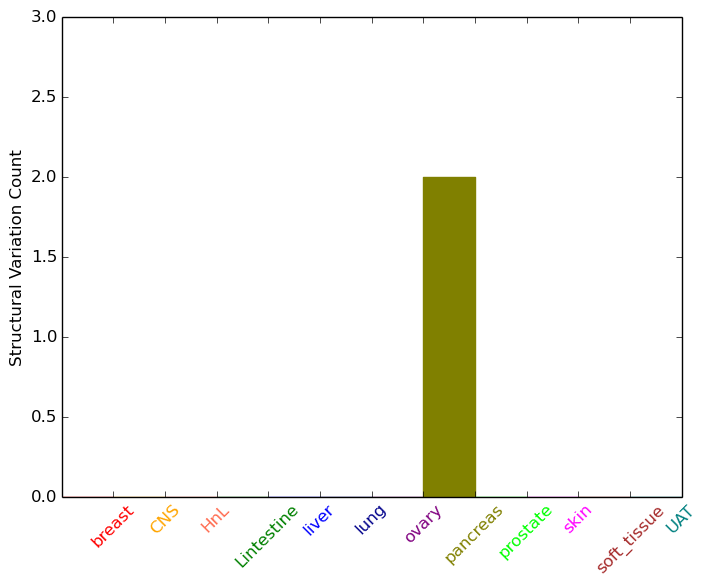 |
| Sample | Symbol_a | Chr_a | Start_a | End_a | Symbol_b | Chr_b | Start_b | End_b |
| pancreas | POLR3C | chr1 | 145600642 | 145600662 | TXNIP | chr1 | 145441422 | 145441442 |
| cf) Tissue number; Tissue name (1;Breast, 2;Central_nervous_system, 3;Haematopoietic_and_lymphoid_tissue, 4;Large_intestine, 5;Liver, 6;Lung, 7;Ovary, 8;Pancreas, 9;Prostate, 10;Skin, 11;Soft_tissue, 12;Upper_aerodigestive_tract) |
| * From mRNA Sanger sequences, Chitars2.0 arranged chimeric transcripts. This table shows POLR3C related fusion information. |
| ID | Head Gene | Tail Gene | Accession | Gene_a | qStart_a | qEnd_a | Chromosome_a | tStart_a | tEnd_a | Gene_a | qStart_a | qEnd_a | Chromosome_a | tStart_a | tEnd_a |
| BF335120 | POLR3C | 16 | 255 | 1 | 145605925 | 145606165 | POLR3C | 247 | 390 | 1 | 145606173 | 145606316 | |
| W23948 | BRK1 | 2 | 228 | 3 | 10157452 | 10168040 | POLR3C | 215 | 445 | 1 | 145601551 | 145606321 | |
| BI027593 | POLR3C | 1 | 156 | 1 | 145601562 | 145601839 | POLR3C | 155 | 229 | 1 | 145598536 | 145598610 | |
| Top |
| Mutation type/ Tissue ID | brca | cns | cerv | endome | haematopo | kidn | Lintest | liver | lung | ns | ovary | pancre | prost | skin | stoma | thyro | urina | |||
| Total # sample | 1 | |||||||||||||||||||
| GAIN (# sample) | 1 | |||||||||||||||||||
| LOSS (# sample) |
| cf) Tissue ID; Tissue type (1; Breast, 2; Central_nervous_system, 3; Cervix, 4; Endometrium, 5; Haematopoietic_and_lymphoid_tissue, 6; Kidney, 7; Large_intestine, 8; Liver, 9; Lung, 10; NS, 11; Ovary, 12; Pancreas, 13; Prostate, 14; Skin, 15; Stomach, 16; Thyroid, 17; Urinary_tract) |
| Top |
|
 |
| Top |
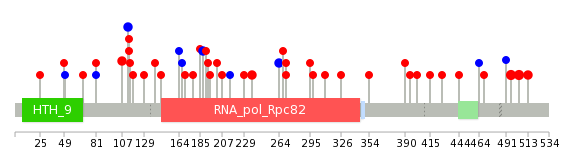
| Stat. for Non-Synonymous SNVs (# total SNVs=32) | (# total SNVs=10) |
 | 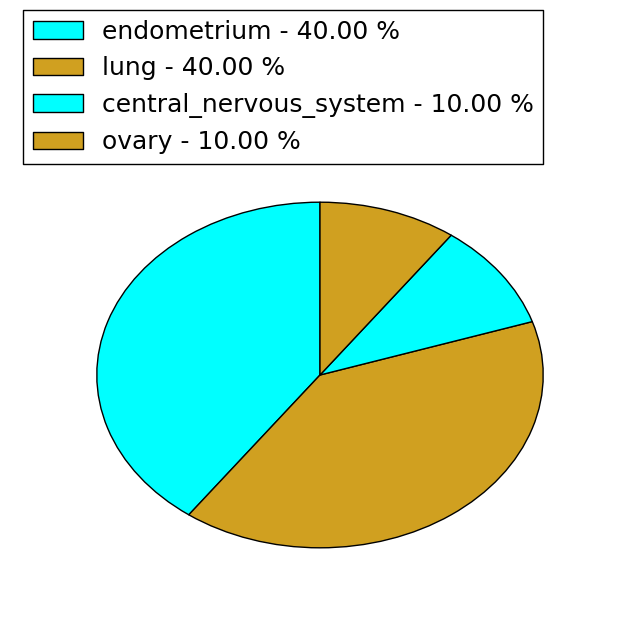 |
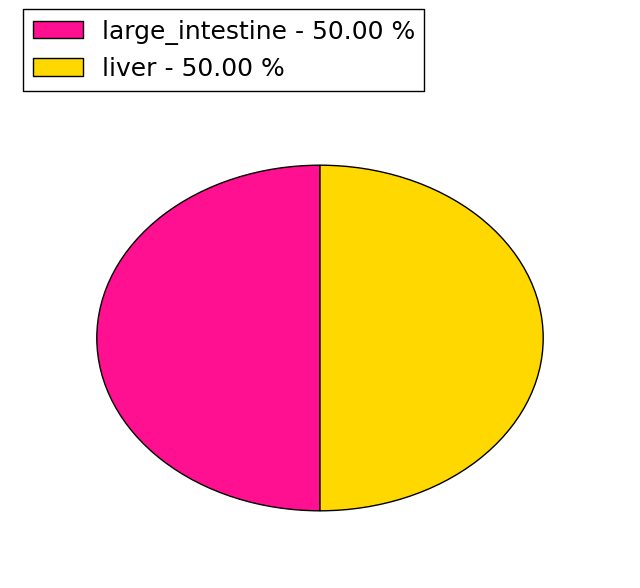
(# total SNVs=2) | (# total SNVs=0) |
 |
| Top |
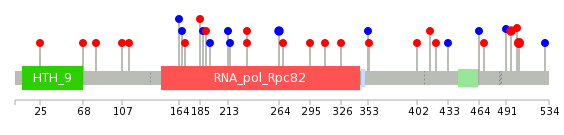
| * When you move the cursor on each content, you can see more deailed mutation information on the Tooltip. Those are primary_site,primary_histology,mutation(aa),pubmedID. |
| GRCh37 position | Mutation(aa) | Unique sampleID count |
| chr1:145608133-145608133 | p.Y188Y | 3 |
| chr1:145594051-145594051 | p.R504H | 3 |
| chr1:145594076-145594076 | p.R496C | 3 |
| chr1:145601595-145601595 | p.L271I | 2 |
| chr1:145592758-145592758 | p.E513K | 2 |
| chr1:145601614-145601614 | p.S264S | 2 |
| chr1:145601821-145601821 | p.A237G | 2 |
| chr1:145608468-145608468 | p.N113N | 2 |
| chr1:145608488-145608488 | p.V107I | 2 |
| chr1:145608566-145608566 | p.R81W | 2 |
| Top |
|
 |
| Point Mutation/ Tissue ID | 1 | 2 | 3 | 4 | 5 | 6 | 7 | 8 | 9 | 10 | 11 | 12 | 13 | 14 | 15 | 16 | 17 | 18 | 19 | 20 |
| # sample | 3 | 2 | 4 | 2 | 1 | 4 | 1 | 3 | 2 | 3 | 7 | |||||||||
| # mutation | 3 | 2 | 4 | 2 | 1 | 8 | 1 | 3 | 2 | 3 | 7 | |||||||||
| nonsynonymous SNV | 1 | 2 | 4 | 1 | 1 | 5 | 1 | 2 | 2 | 4 | ||||||||||
| synonymous SNV | 2 | 1 | 3 | 1 | 2 | 1 | 3 |
| cf) Tissue ID; Tissue type (1; BLCA[Bladder Urothelial Carcinoma], 2; BRCA[Breast invasive carcinoma], 3; CESC[Cervical squamous cell carcinoma and endocervical adenocarcinoma], 4; COAD[Colon adenocarcinoma], 5; GBM[Glioblastoma multiforme], 6; Glioma Low Grade, 7; HNSC[Head and Neck squamous cell carcinoma], 8; KICH[Kidney Chromophobe], 9; KIRC[Kidney renal clear cell carcinoma], 10; KIRP[Kidney renal papillary cell carcinoma], 11; LAML[Acute Myeloid Leukemia], 12; LUAD[Lung adenocarcinoma], 13; LUSC[Lung squamous cell carcinoma], 14; OV[Ovarian serous cystadenocarcinoma ], 15; PAAD[Pancreatic adenocarcinoma], 16; PRAD[Prostate adenocarcinoma], 17; SKCM[Skin Cutaneous Melanoma], 18:STAD[Stomach adenocarcinoma], 19:THCA[Thyroid carcinoma], 20:UCEC[Uterine Corpus Endometrial Carcinoma]) |
| Top |
| * We represented just top 10 SNVs. When you move the cursor on each content, you can see more deailed mutation information on the Tooltip. Those are primary_site, primary_histology, mutation(aa), pubmedID. |
| Genomic Position | Mutation(aa) | Unique sampleID count |
| chr1:145594051 | p.R504H | 3 |
| chr1:145601837 | p.S264S | 2 |
| chr1:145594076 | p.G232W | 2 |
| chr1:145601614 | p.R496C | 2 |
| chr1:145608488 | p.N402K | 1 |
| chr1:145595181 | p.E167E | 1 |
| chr1:145606308 | p.V354I | 1 |
| chr1:145608566 | p.P164P | 1 |
| chr1:145595199 | p.V353V | 1 |
| chr1:145606314 | p.G114S | 1 |
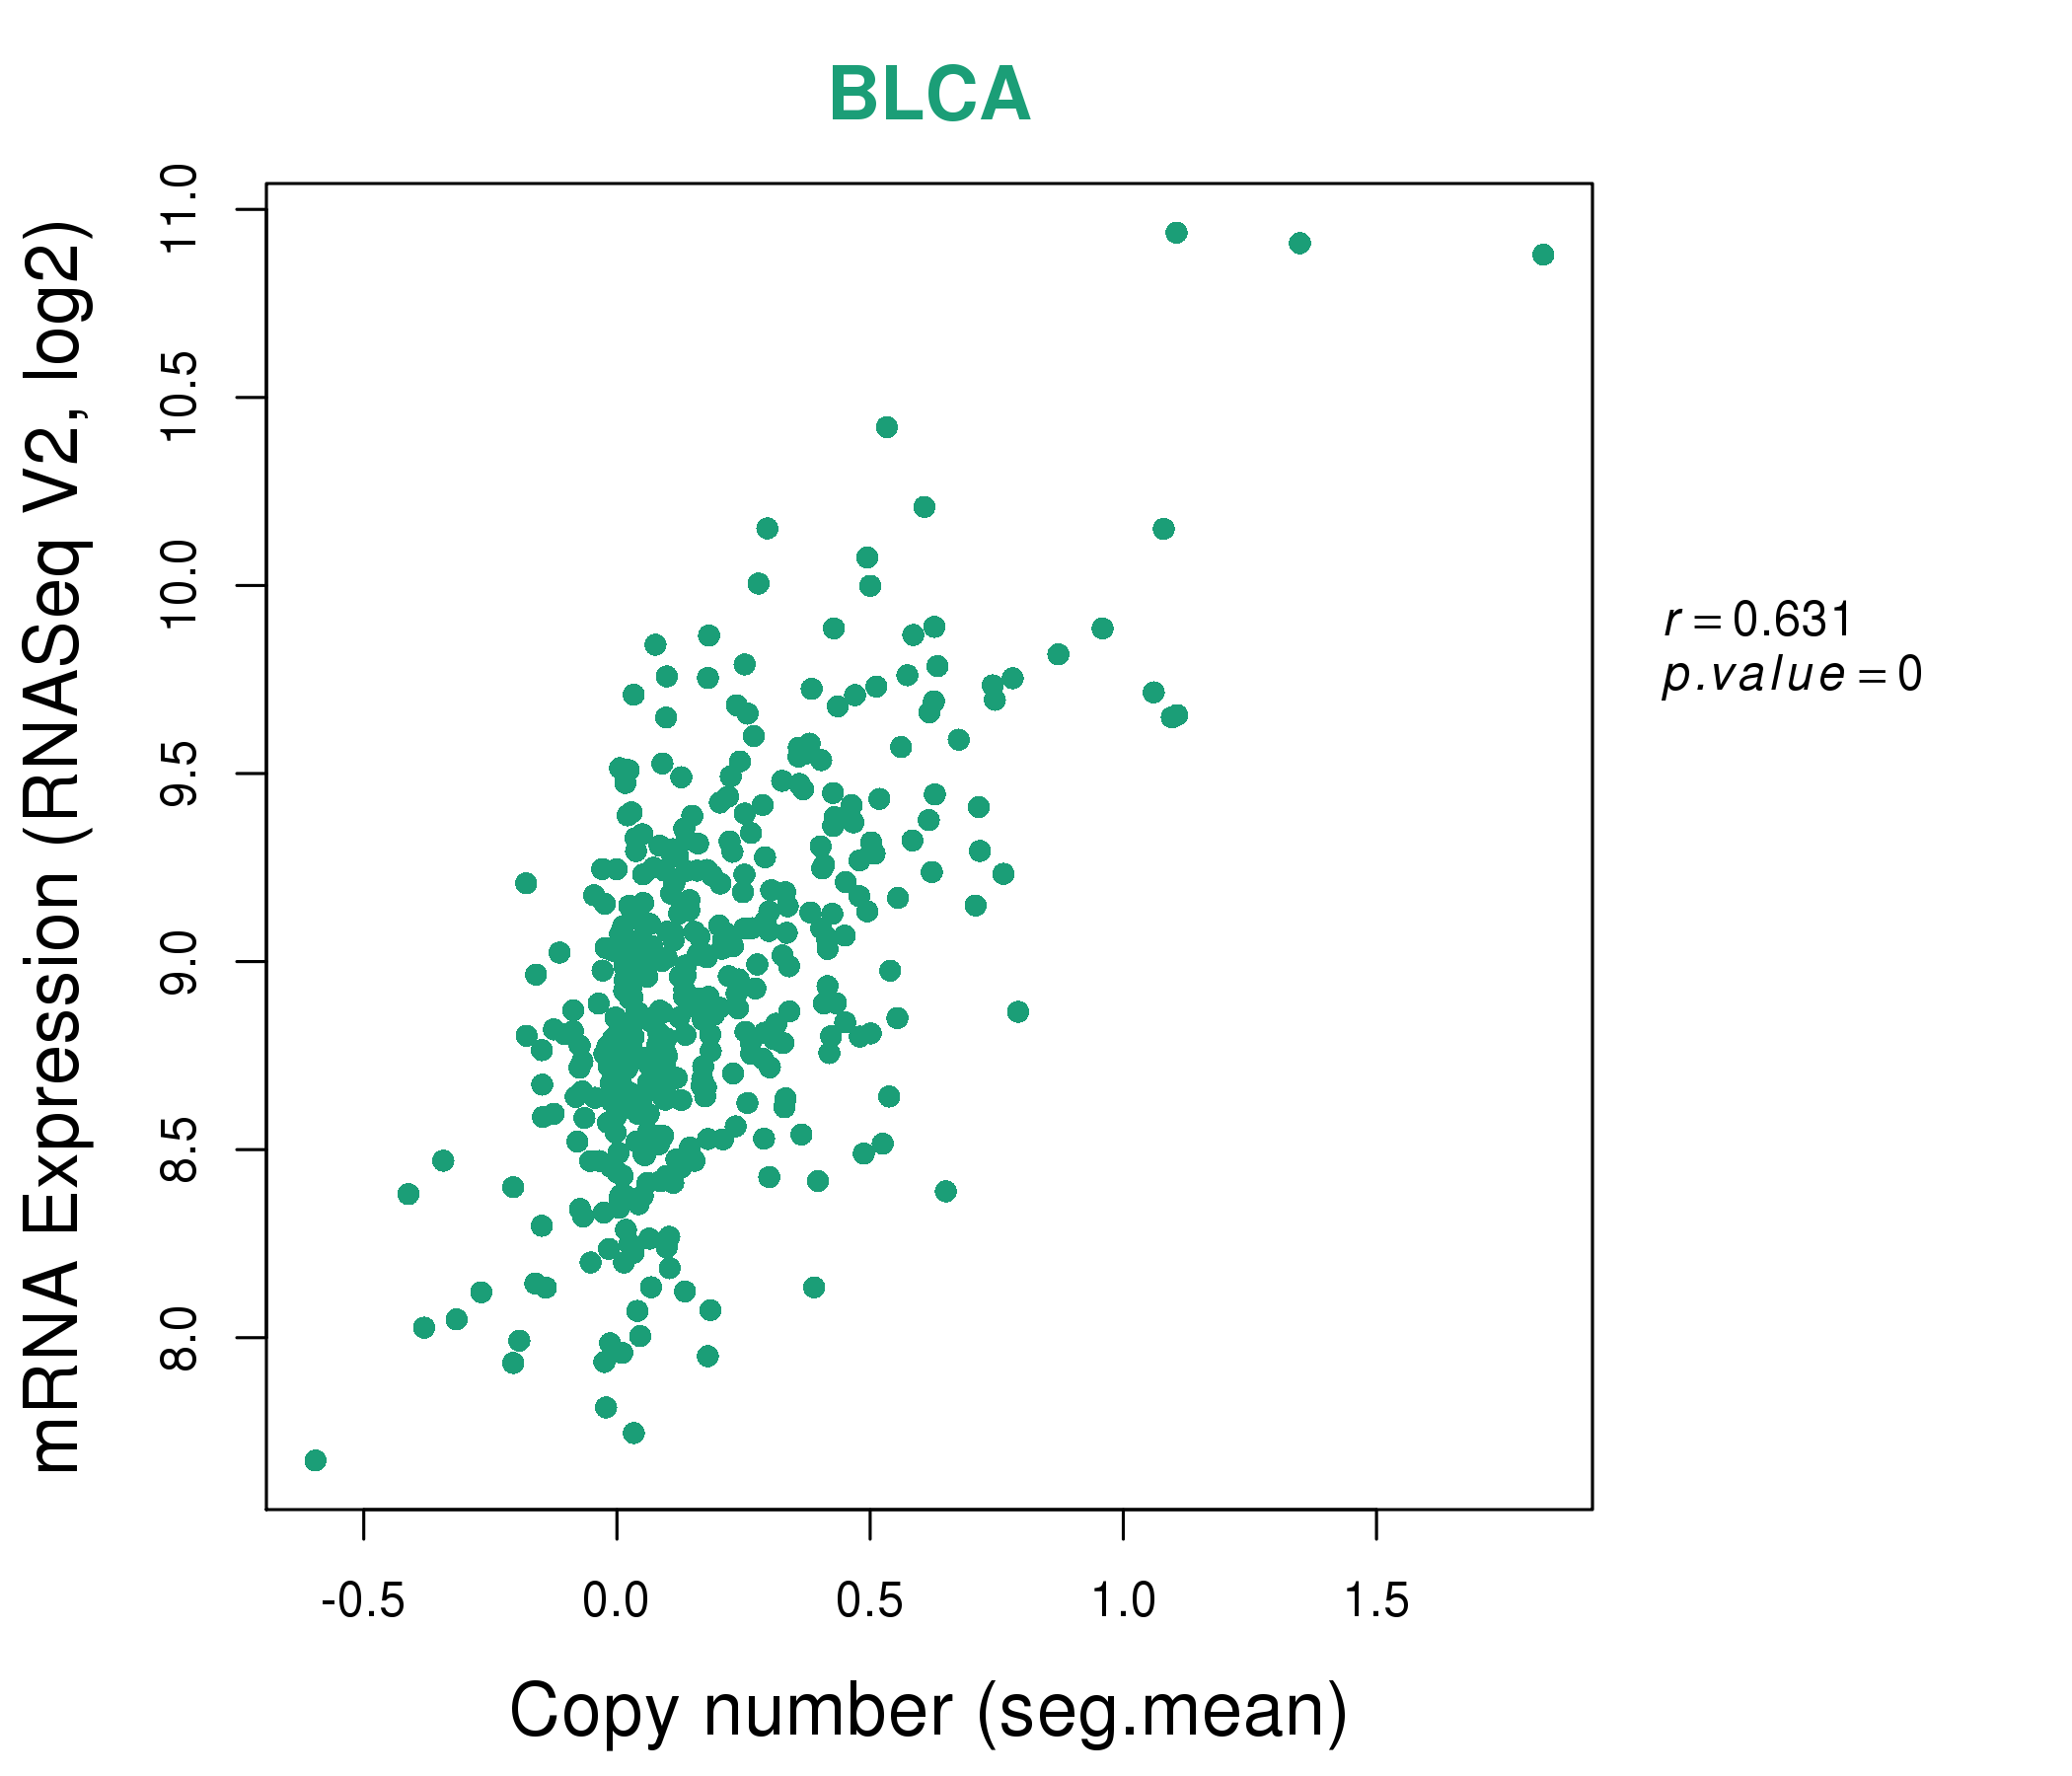
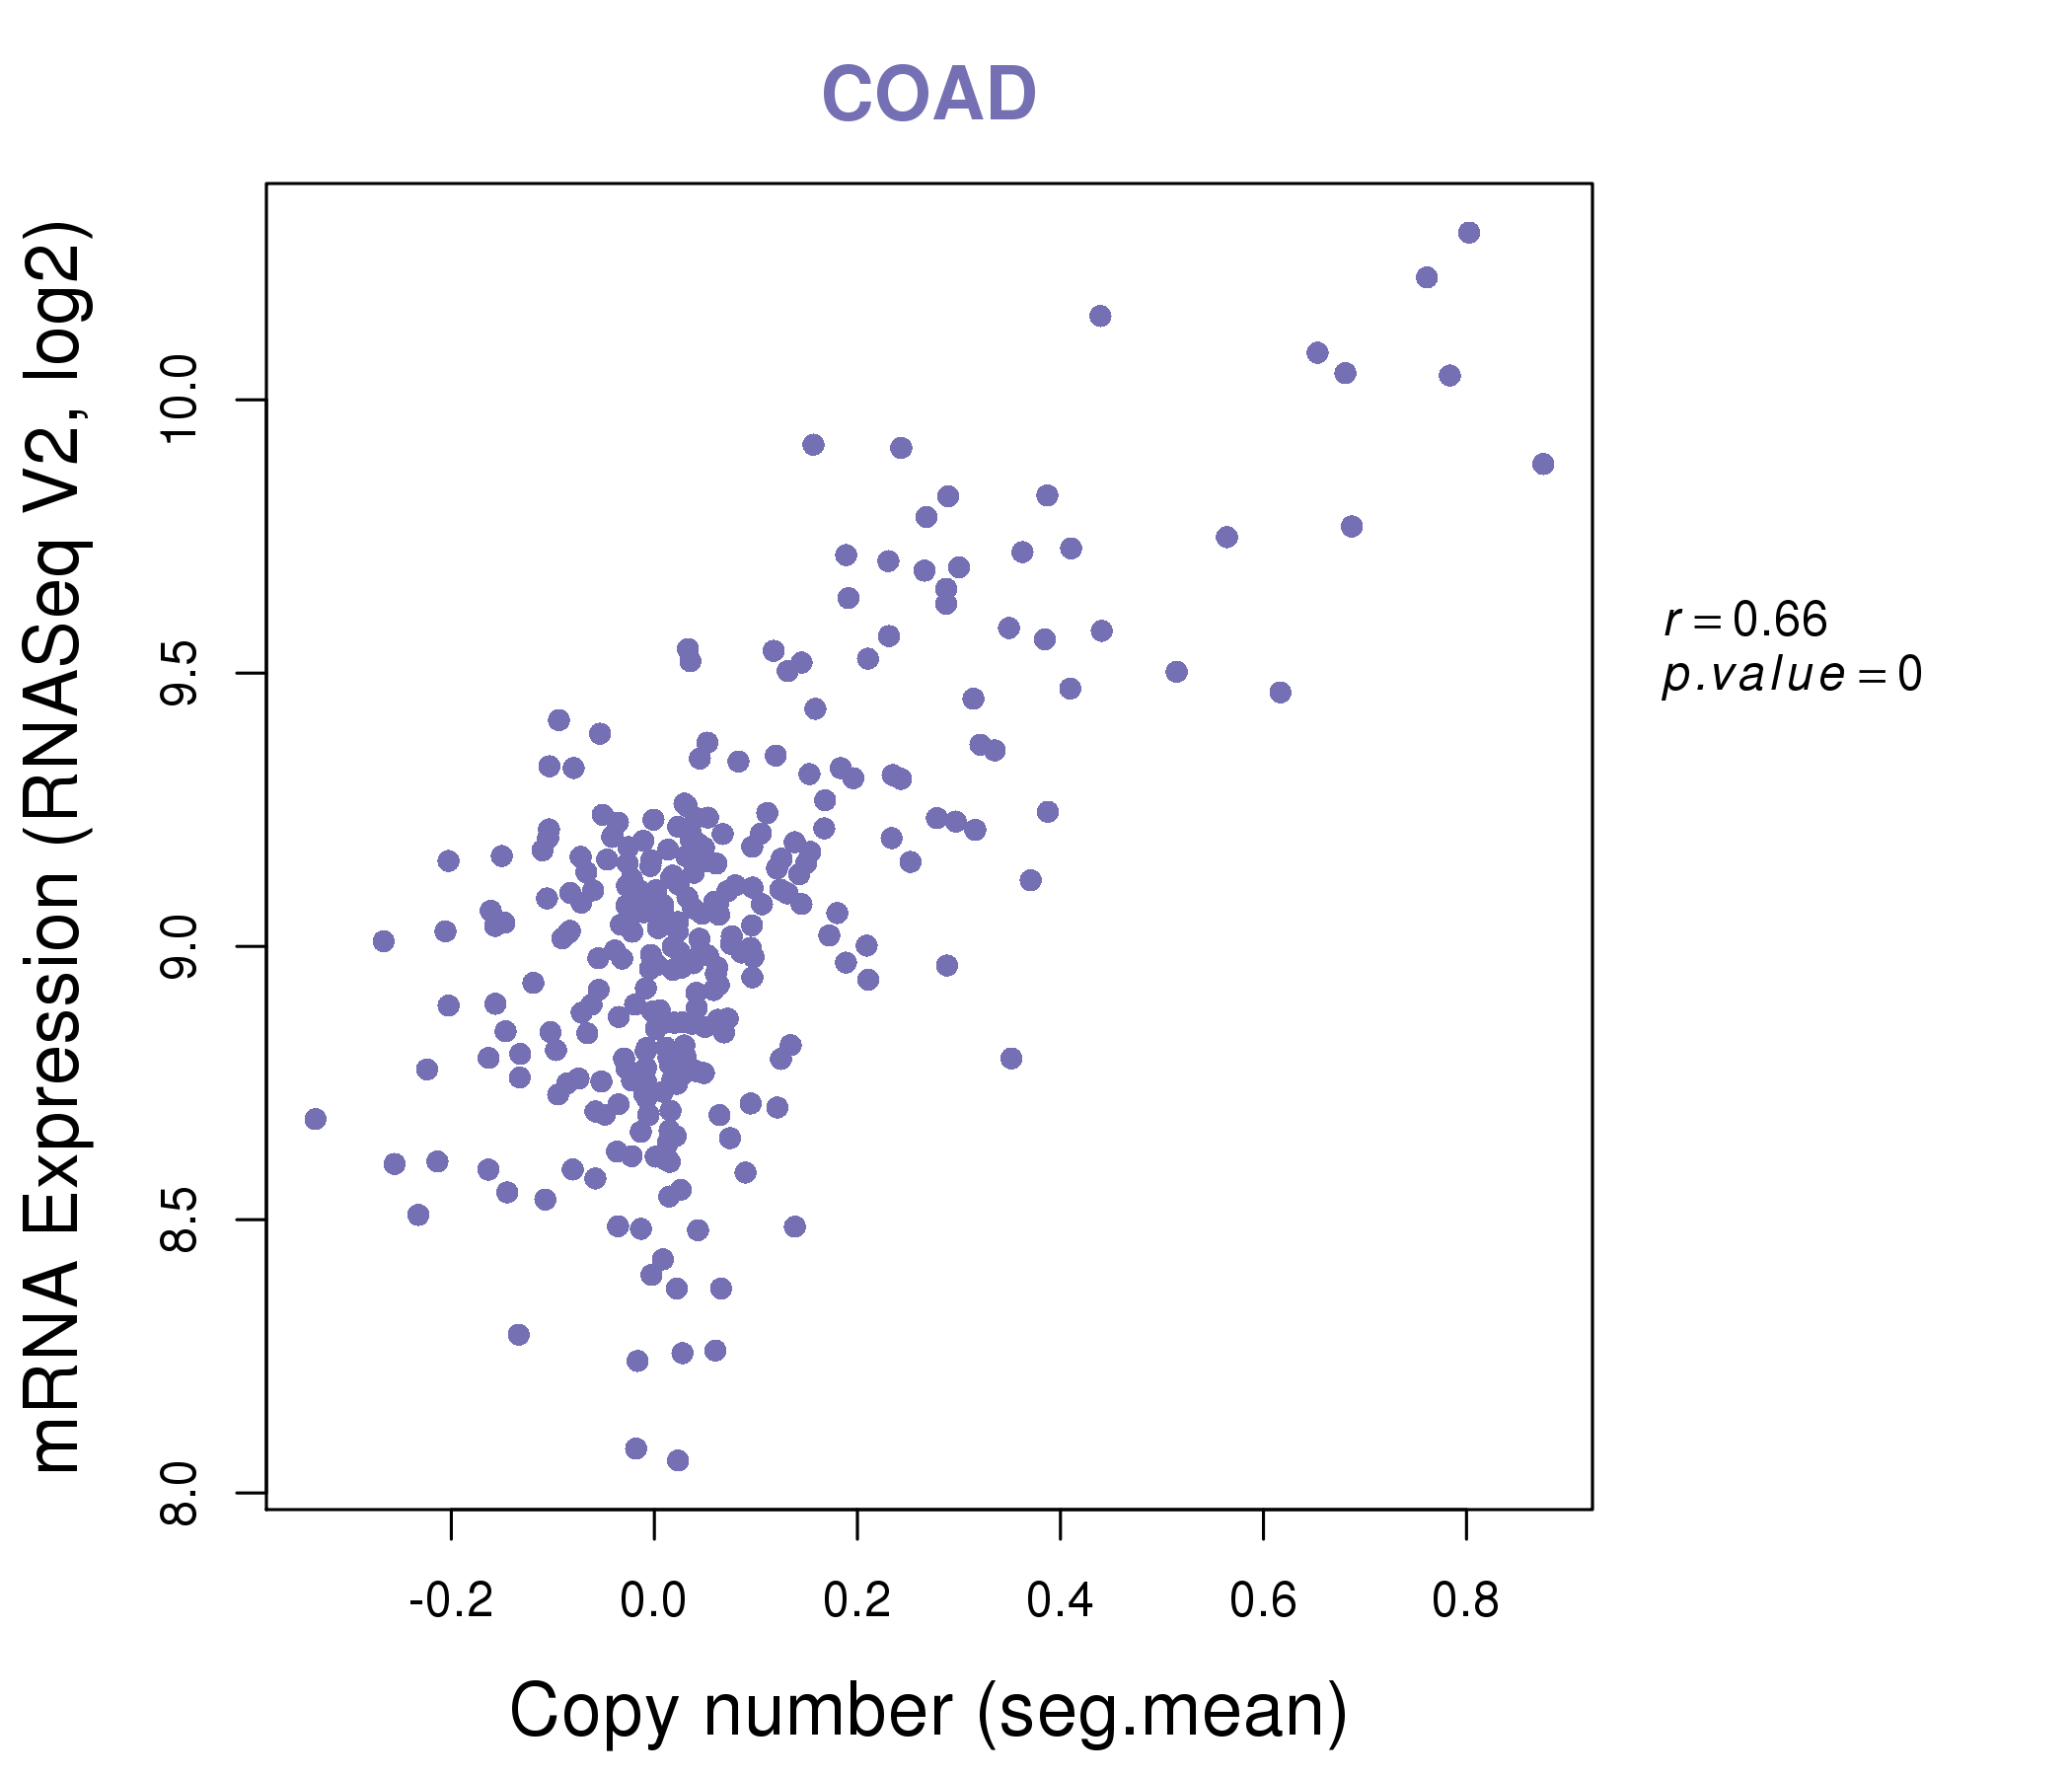
| * Copy number data were extracted from TCGA using R package TCGA-Assembler. The URLs of all public data files on TCGA DCC data server were gathered on Jan-05-2015. Function ProcessCNAData in TCGA-Assembler package was used to obtain gene-level copy number value which is calculated as the average copy number of the genomic region of a gene. |
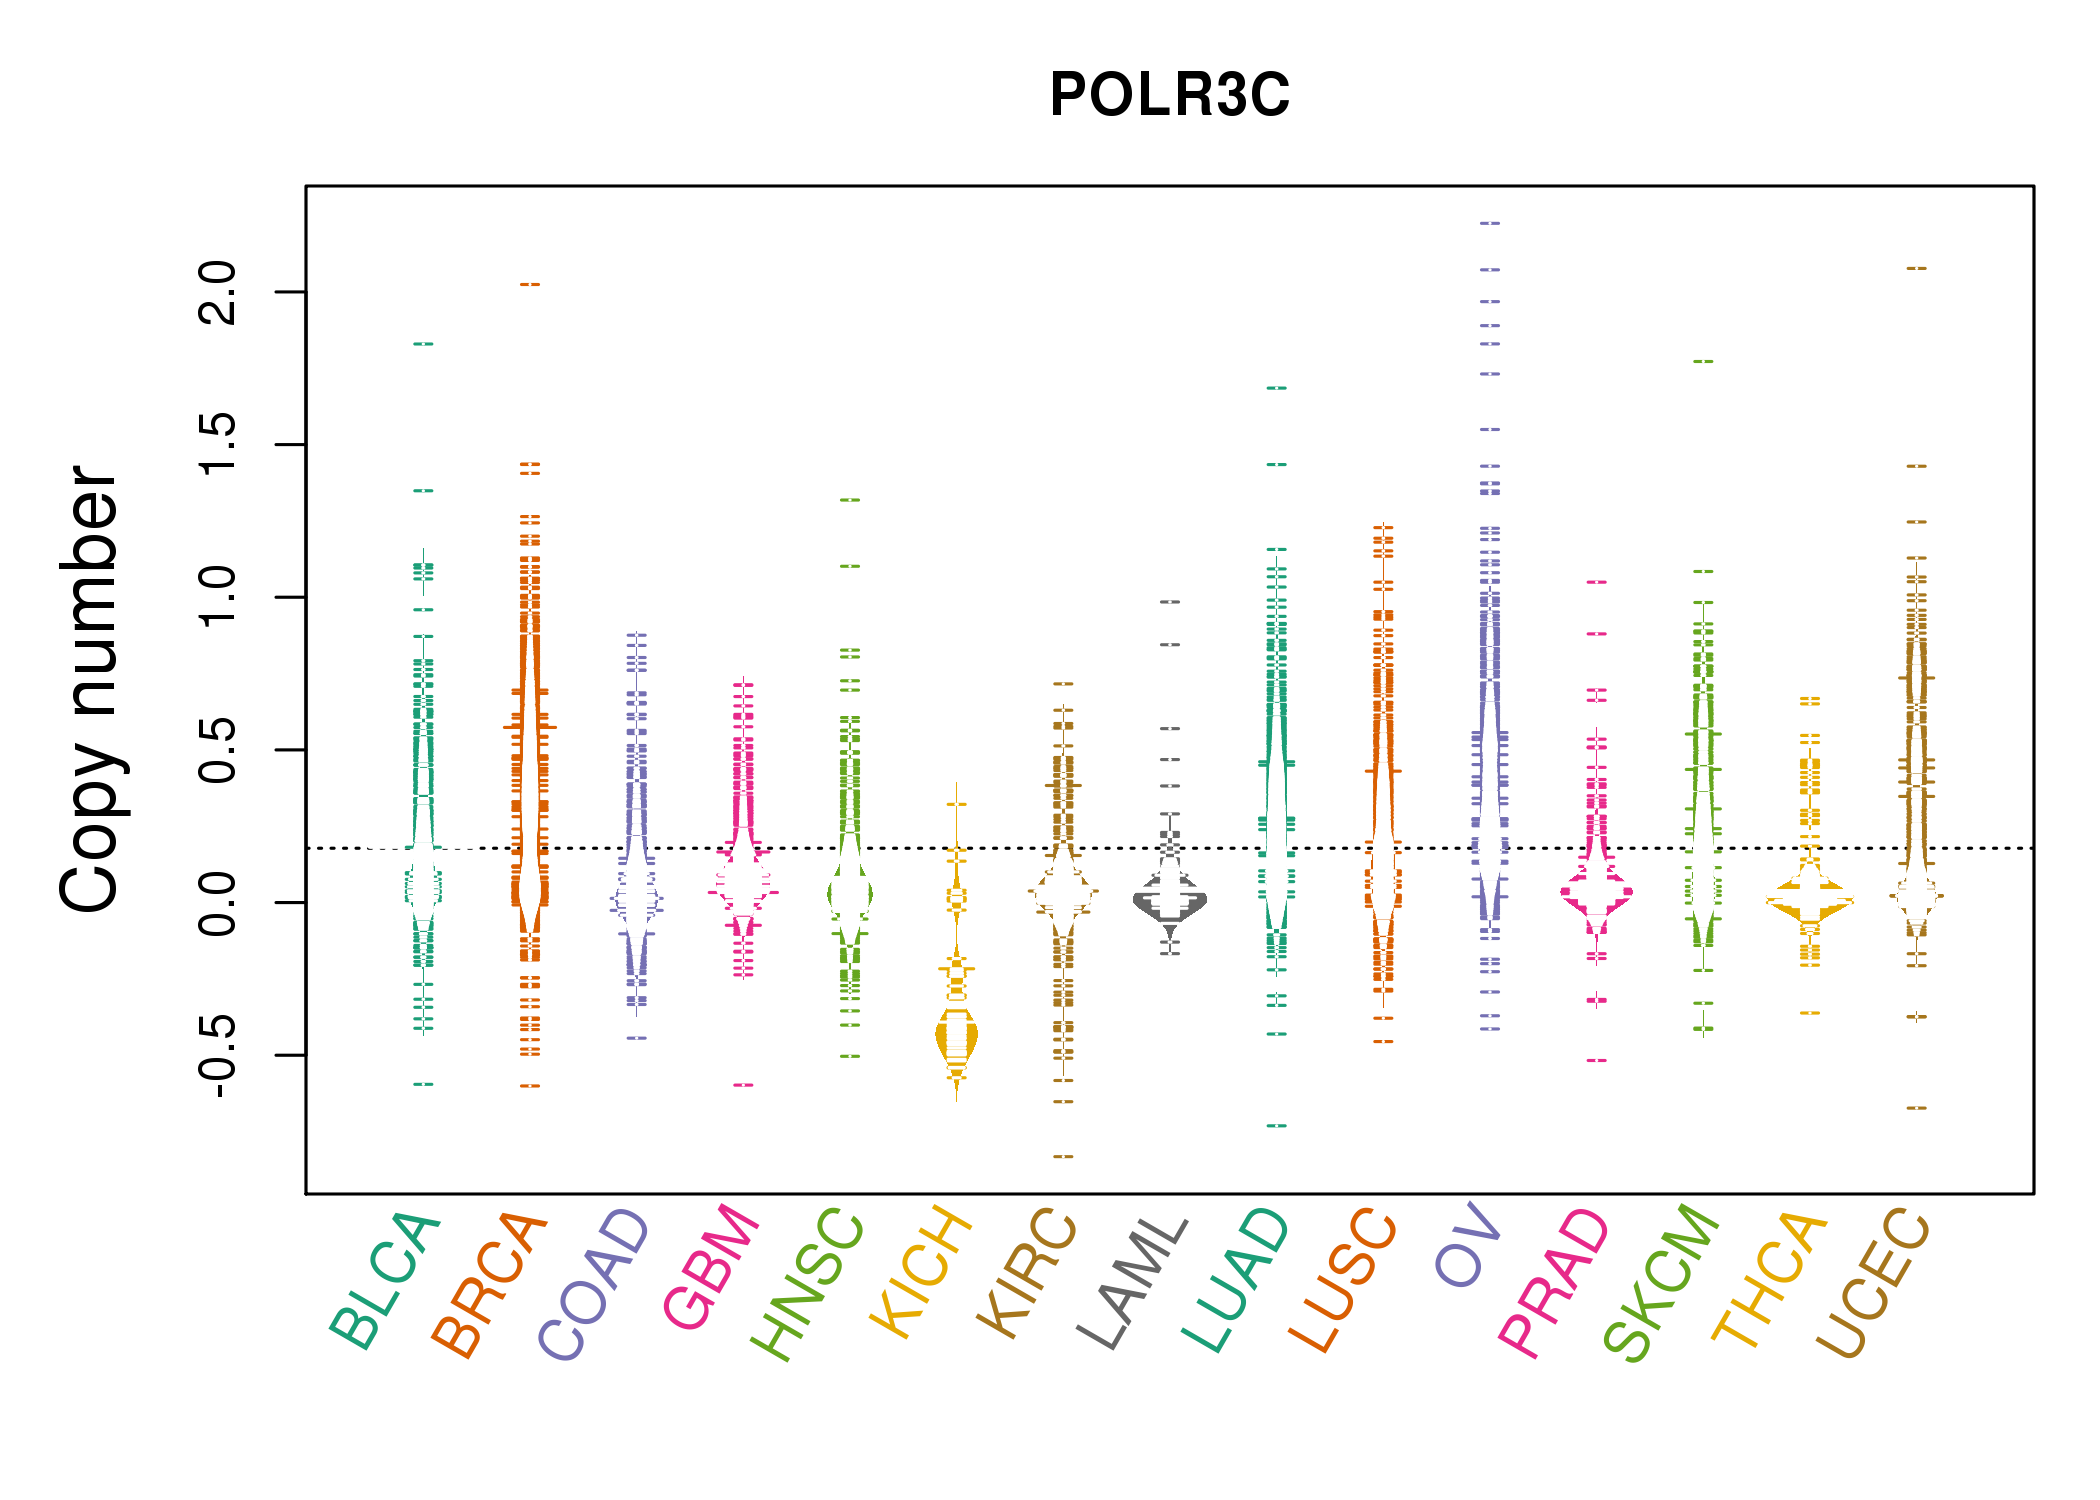 |
| cf) Tissue ID[Tissue type]: BLCA[Bladder Urothelial Carcinoma], BRCA[Breast invasive carcinoma], CESC[Cervical squamous cell carcinoma and endocervical adenocarcinoma], COAD[Colon adenocarcinoma], GBM[Glioblastoma multiforme], Glioma Low Grade, HNSC[Head and Neck squamous cell carcinoma], KICH[Kidney Chromophobe], KIRC[Kidney renal clear cell carcinoma], KIRP[Kidney renal papillary cell carcinoma], LAML[Acute Myeloid Leukemia], LUAD[Lung adenocarcinoma], LUSC[Lung squamous cell carcinoma], OV[Ovarian serous cystadenocarcinoma ], PAAD[Pancreatic adenocarcinoma], PRAD[Prostate adenocarcinoma], SKCM[Skin Cutaneous Melanoma], STAD[Stomach adenocarcinoma], THCA[Thyroid carcinoma], UCEC[Uterine Corpus Endometrial Carcinoma] |
| Top |
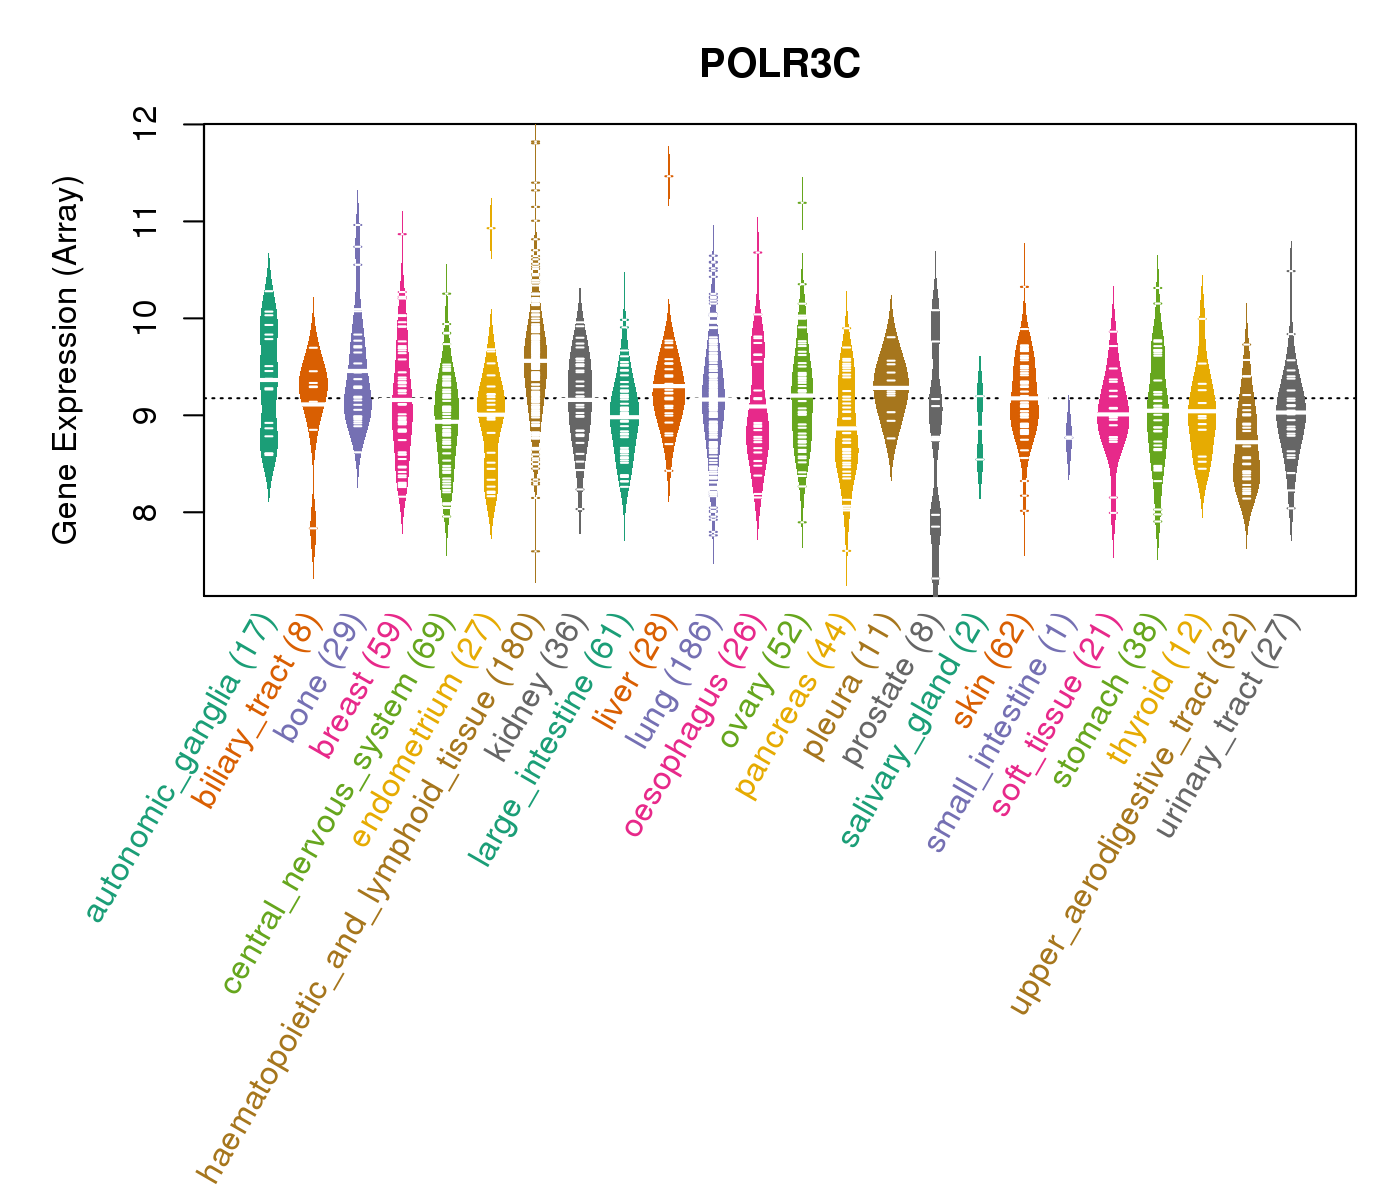
| Gene Expression for POLR3C |
| * CCLE gene expression data were extracted from CCLE_Expression_Entrez_2012-10-18.res: Gene-centric RMA-normalized mRNA expression data. |
 |
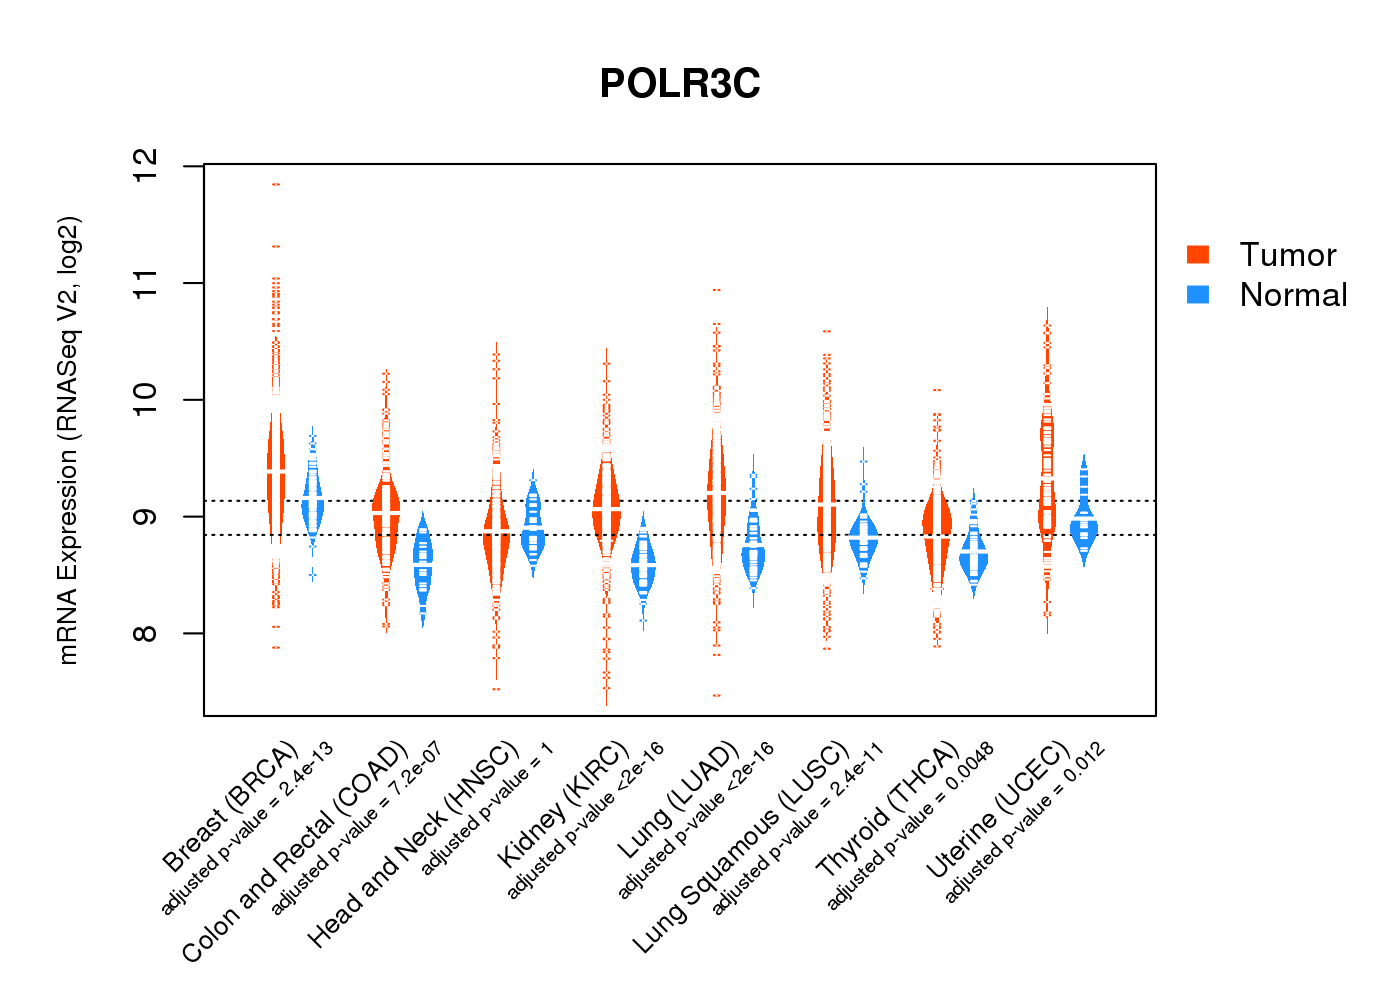
| * Normalized gene expression data of RNASeqV2 was extracted from TCGA using R package TCGA-Assembler. The URLs of all public data files on TCGA DCC data server were gathered at Jan-05-2015. Only eight cancer types have enough normal control samples for differential expression analysis. (t test, adjusted p<0.05 (using Benjamini-Hochberg FDR)) |
 |
| Top |
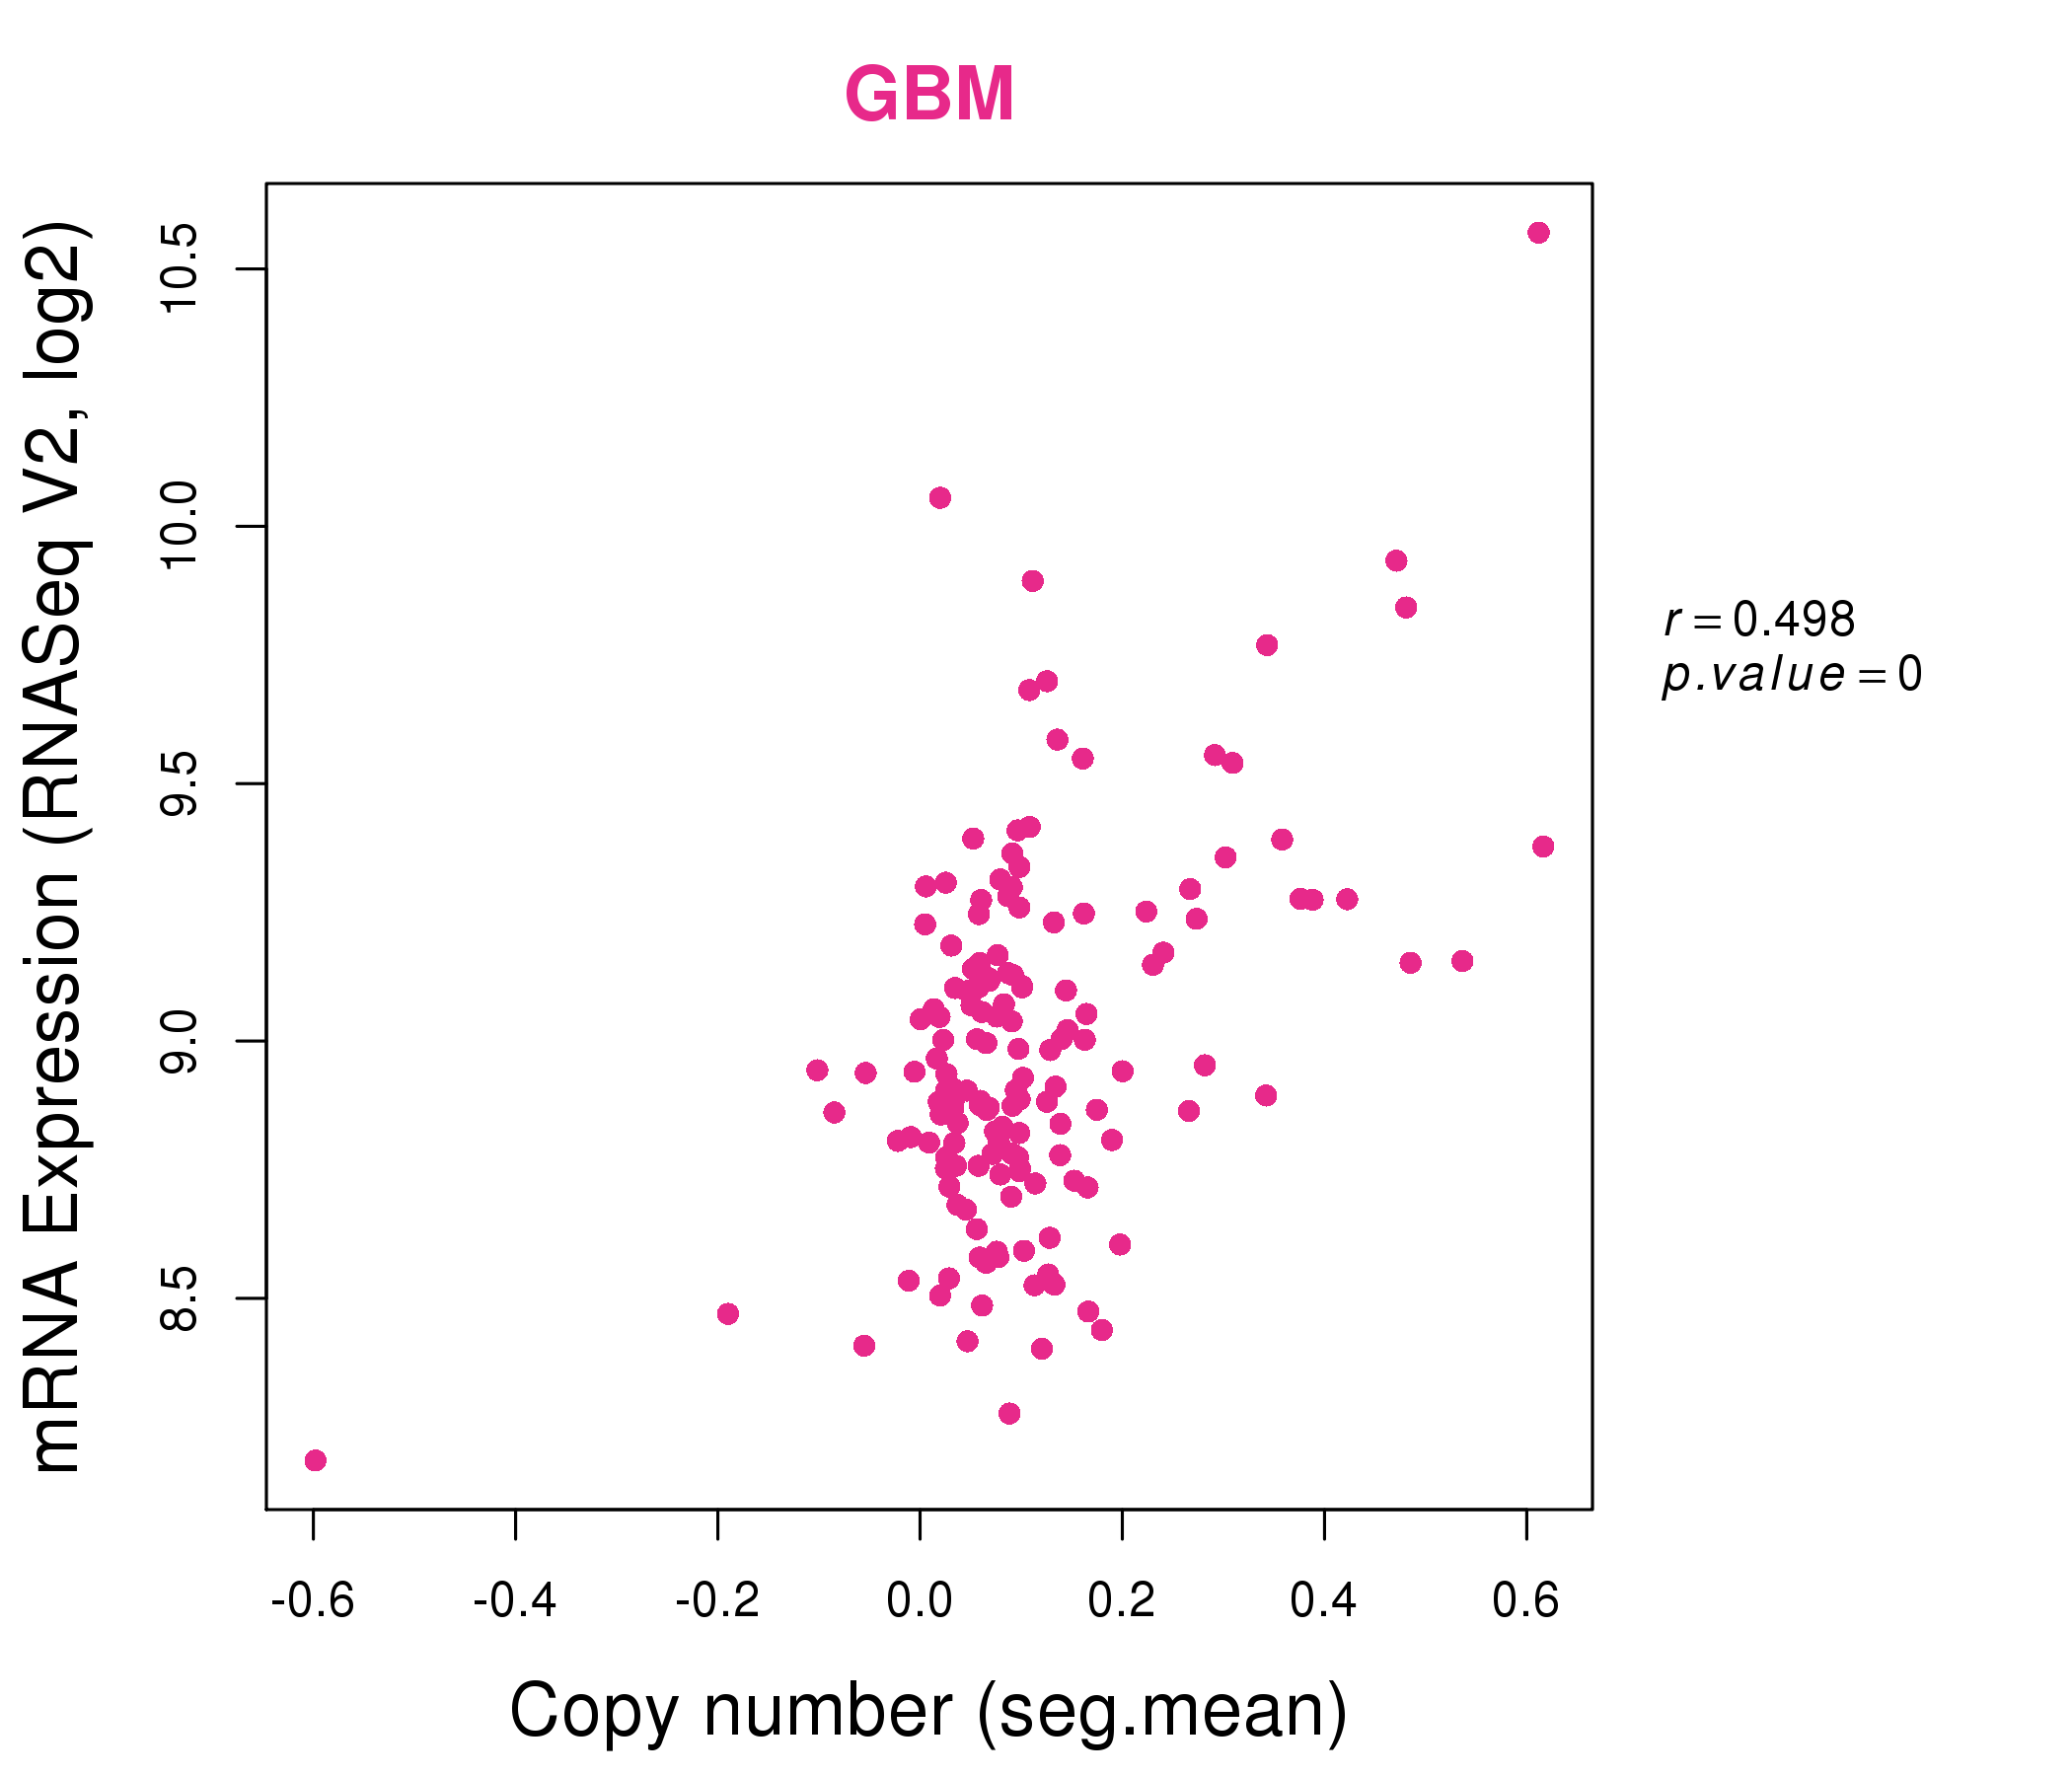
| * This plots show the correlation between CNV and gene expression. |
: Open all plots for all cancer types
 |
|
 |
|

| Top |
| Gene-Gene Network Information |
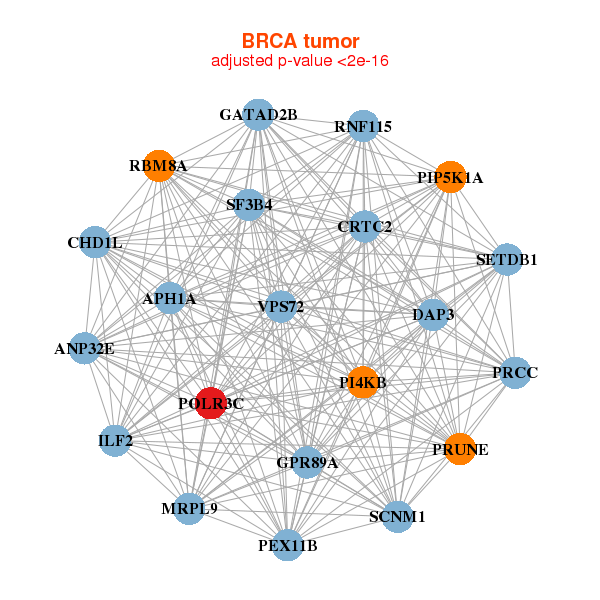
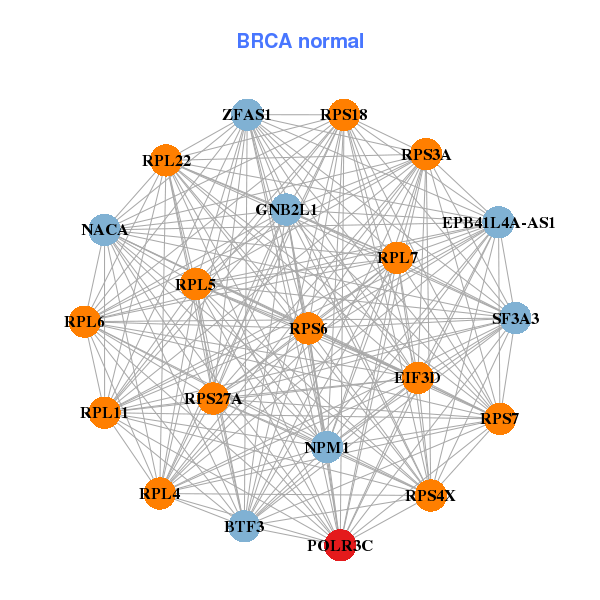
| * Co-Expression network figures were drawn using R package igraph. Only the top 20 genes with the highest correlations were shown. Red circle: input gene, orange circle: cell metabolism gene, sky circle: other gene |
: Open all plots for all cancer types
 |
|
| ANP32E,APH1A,CHD1L,CRTC2,DAP3,GATAD2B,GPR89A, ILF2,MRPL9,PEX11B,PI4KB,PIP5K1A,POLR3C,PRCC, PRUNE,RBM8A,RNF115,SCNM1,SETDB1,SF3B4,VPS72 | BTF3,ZFAS1,EIF3D,GNB2L1,NACA,EPB41L4A-AS1,NPM1, POLR3C,RPL11,RPL22,RPL4,RPL5,RPL6,RPL7, RPS18,RPS27A,RPS3A,RPS4X,RPS6,RPS7,SF3A3 |
 |
|
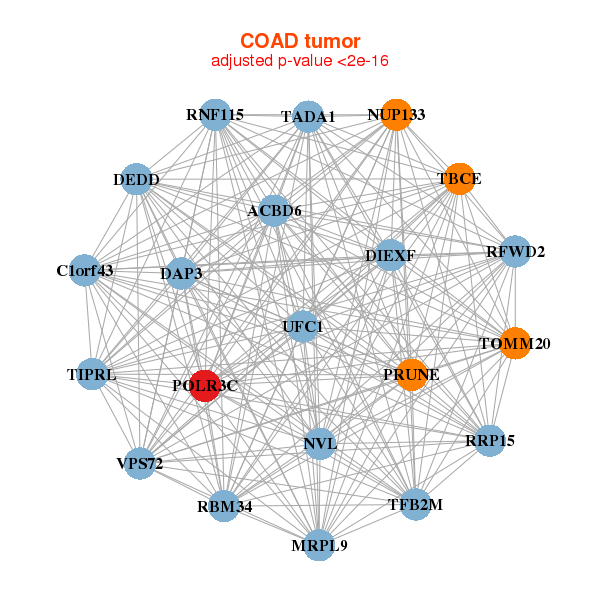
| ACBD6,DIEXF,C1orf43,DAP3,DEDD,MRPL9,NUP133, NVL,POLR3C,PRUNE,RBM34,RFWD2,RNF115,RRP15, TADA1,TBCE,TFB2M,TIPRL,TOMM20,UFC1,VPS72 | C12orf10,DRG2,EIF3M,GNB2L1,PEMT,POLR3C,RNMTL1, RPL10,RPL10A,RPL12,RPL18,RPL19,RPL30,RPL32, RPL3,RPL7,RPL7A,RPUSD4,RSL1D1,TOMM20,WDR74 |
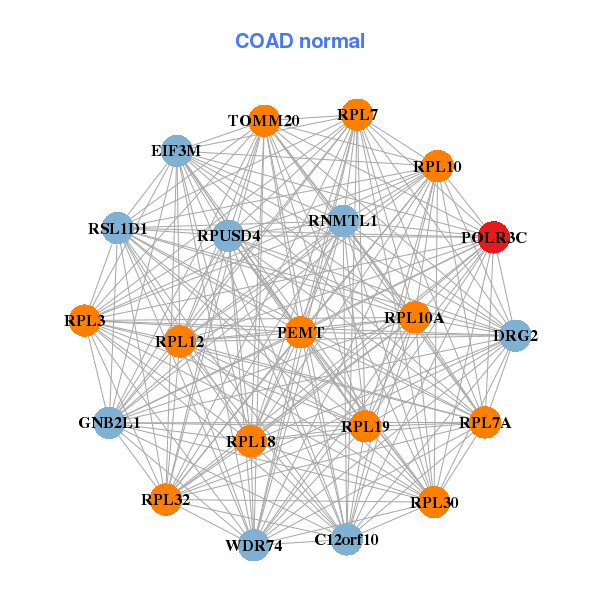
| * Co-Expression network figures were drawn using R package igraph. Only the top 20 genes with the highest correlations were shown. Red circle: input gene, orange circle: cell metabolism gene, sky circle: other gene |
: Open all plots for all cancer types
| Top |
: Open all interacting genes' information including KEGG pathway for all interacting genes from DAVID
| Top |
| Pharmacological Information for POLR3C |
| There's no related Drug. |
| Top |
| Cross referenced IDs for POLR3C |
| * We obtained these cross-references from Uniprot database. It covers 150 different DBs, 18 categories. http://www.uniprot.org/help/cross_references_section |
: Open all cross reference information
|
Copyright © 2016-Present - The Univsersity of Texas Health Science Center at Houston @ |