|
||||||||||||||||||||||||||||||||||||||||||||||||||||||||||||||||||||||||||||||||||||||||||||||||||||||||||||||||||||||||||||||||||||||||||||||||||||||||||||||||||||||||||||||||||||||||||||||||||||||||||||||||||||||||||||||||||||||||||||||||||||||||||||||||||||||||||||||||||||||||||||||||||||||||||||||||||||||||||
| |
| Phenotypic Information (metabolism pathway, cancer, disease, phenome) |
| |
| |
| Gene-Gene Network Information: Co-Expression Network, Interacting Genes & KEGG |
| |
|


| Gene Summary for MTX2 |
| Basic gene info. | Gene symbol | MTX2 |
| Gene name | metaxin 2 | |
| Synonyms | - | |
| Cytomap | UCSC genome browser: 2q31.1 | |
| Genomic location | chr2 :177134122-177202753 | |
| Type of gene | protein-coding | |
| RefGenes | NM_006554.4, NR_027850.1,NM_001006635.1, | |
| Ensembl id | ENSG00000128654 | |
| Description | metaxin-2mitochondrial outer membrane import complex protein 2 | |
| Modification date | 20141207 | |
| dbXrefs | MIM : 608555 | |
| HGNC : HGNC | ||
| Ensembl : ENSG00000128654 | ||
| HPRD : 09777 | ||
| Vega : OTTHUMG00000132514 | ||
| Protein | UniProt: go to UniProt's Cross Reference DB Table | |
| Expression | CleanEX: HS_MTX2 | |
| BioGPS: 10651 | ||
| Gene Expression Atlas: ENSG00000128654 | ||
| The Human Protein Atlas: ENSG00000128654 | ||
| Pathway | NCI Pathway Interaction Database: MTX2 | |
| KEGG: MTX2 | ||
| REACTOME: MTX2 | ||
| ConsensusPathDB | ||
| Pathway Commons: MTX2 | ||
| Metabolism | MetaCyc: MTX2 | |
| HUMANCyc: MTX2 | ||
| Regulation | Ensembl's Regulation: ENSG00000128654 | |
| miRBase: chr2 :177,134,122-177,202,753 | ||
| TargetScan: NM_006554 | ||
| cisRED: ENSG00000128654 | ||
| Context | iHOP: MTX2 | |
| cancer metabolism search in PubMed: MTX2 | ||
| UCL Cancer Institute: MTX2 | ||
| Assigned class in ccmGDB | C | |
| Top |
| Phenotypic Information for MTX2(metabolism pathway, cancer, disease, phenome) |
| Cancer | CGAP: MTX2 |
| Familial Cancer Database: MTX2 | |
| * This gene is included in those cancer gene databases. |
|
|
|
|
|
| . | ||||||||||||||||||||||||||||||||||||||||||||||||||||||||||||||||||||||||||||||||||||||||||||||||||||||||||||||||||||||||||||||||||||||||||||||||||||||||||||||||||||||||||||||||||||||||||||||||||||||||||||||||||||||||||||||||||||||||||||||||||||||||||||||||||||||||||||||||||||||||||||||||||||||||||||||||||||
Oncogene 1 | Significant driver gene in | |||||||||||||||||||||||||||||||||||||||||||||||||||||||||||||||||||||||||||||||||||||||||||||||||||||||||||||||||||||||||||||||||||||||||||||||||||||||||||||||||||||||||||||||||||||||||||||||||||||||||||||||||||||||||||||||||||||||||||||||||||||||||||||||||||||||||||||||||||||||||||||||||||||||||||||||||||||||||
| cf) number; DB name 1 Oncogene; http://nar.oxfordjournals.org/content/35/suppl_1/D721.long, 2 Tumor Suppressor gene; https://bioinfo.uth.edu/TSGene/, 3 Cancer Gene Census; http://www.nature.com/nrc/journal/v4/n3/abs/nrc1299.html, 4 CancerGenes; http://nar.oxfordjournals.org/content/35/suppl_1/D721.long, 5 Network of Cancer Gene; http://ncg.kcl.ac.uk/index.php, 1Therapeutic Vulnerabilities in Cancer; http://cbio.mskcc.org/cancergenomics/statius/ |
| REACTOME_METABOLISM_OF_PROTEINS | |
| OMIM | |
| Orphanet | |
| Disease | KEGG Disease: MTX2 |
| MedGen: MTX2 (Human Medical Genetics with Condition) | |
| ClinVar: MTX2 | |
| Phenotype | MGI: MTX2 (International Mouse Phenotyping Consortium) |
| PhenomicDB: MTX2 | |
| Mutations for MTX2 |
| * Under tables are showing count per each tissue to give us broad intuition about tissue specific mutation patterns.You can go to the detailed page for each mutation database's web site. |
| There's no structural variation information in COSMIC data for this gene. |
| * From mRNA Sanger sequences, Chitars2.0 arranged chimeric transcripts. This table shows MTX2 related fusion information. |
| ID | Head Gene | Tail Gene | Accession | Gene_a | qStart_a | qEnd_a | Chromosome_a | tStart_a | tEnd_a | Gene_a | qStart_a | qEnd_a | Chromosome_a | tStart_a | tEnd_a |
| BU153892 | MTX2 | 1 | 53 | 2 | 177134207 | 177134259 | AFAP1-AS1 | 49 | 748 | 4 | 7765046 | 7774603 | |
| CA449952 | MTX2 | 18 | 194 | 2 | 177202487 | 177202663 | MTX2 | 194 | 423 | 2 | 177202221 | 177202450 | |
| BC015588 | MTX2 | 27 | 47 | 2 | 177178119 | 177178139 | RPL8 | 45 | 867 | 8 | 146015154 | 146017528 | |
| BX950959 | MTX2 | 2 | 248 | 2 | 177134151 | 177134397 | KIAA1715 | 246 | 613 | 2 | 176803066 | 176812423 | |
| Top |
| Mutation type/ Tissue ID | brca | cns | cerv | endome | haematopo | kidn | Lintest | liver | lung | ns | ovary | pancre | prost | skin | stoma | thyro | urina | |||
| Total # sample | 1 | 1 | ||||||||||||||||||
| GAIN (# sample) | 1 | |||||||||||||||||||
| LOSS (# sample) | 1 |
| cf) Tissue ID; Tissue type (1; Breast, 2; Central_nervous_system, 3; Cervix, 4; Endometrium, 5; Haematopoietic_and_lymphoid_tissue, 6; Kidney, 7; Large_intestine, 8; Liver, 9; Lung, 10; NS, 11; Ovary, 12; Pancreas, 13; Prostate, 14; Skin, 15; Stomach, 16; Thyroid, 17; Urinary_tract) |
| Top |
|
 |
| Top |
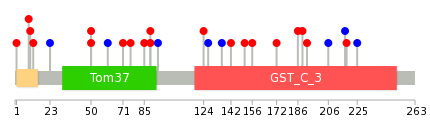
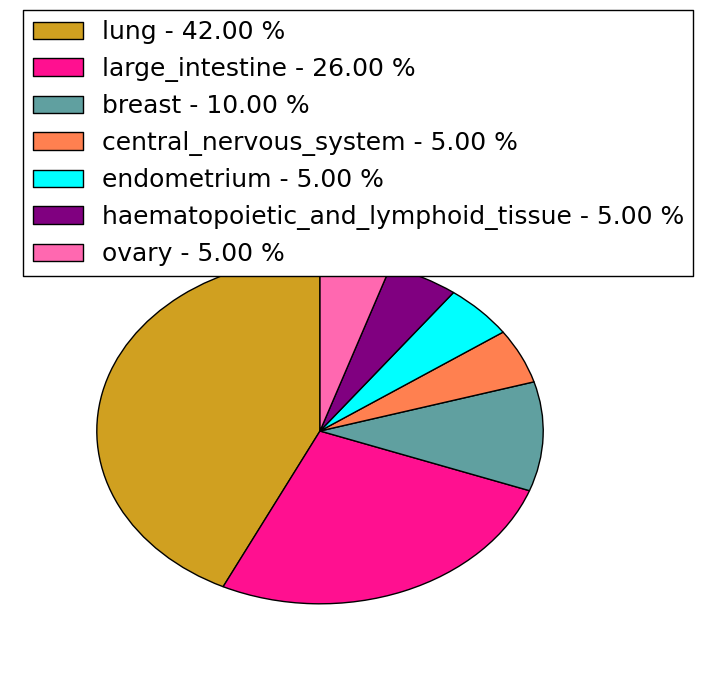
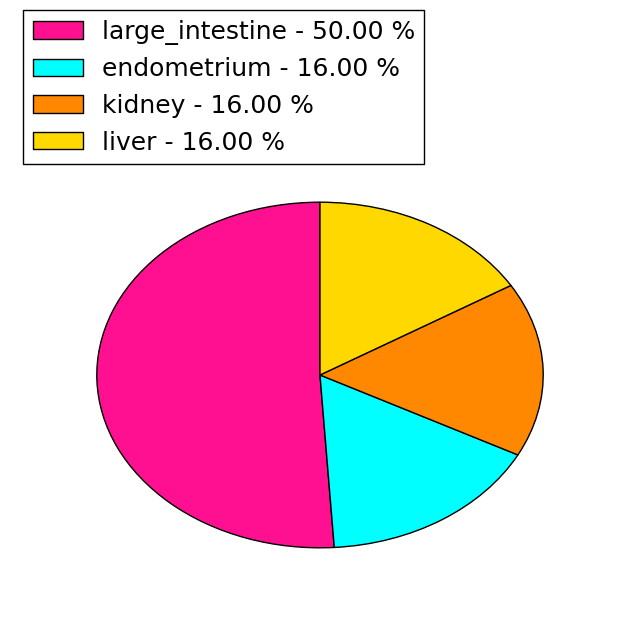
| Stat. for Non-Synonymous SNVs (# total SNVs=19) | (# total SNVs=6) |
 |  |
(# total SNVs=0) | (# total SNVs=0) |
| Top |
| * When you move the cursor on each content, you can see more deailed mutation information on the Tooltip. Those are primary_site,primary_histology,mutation(aa),pubmedID. |
| GRCh37 position | Mutation(aa) | Unique sampleID count |
| chr2:177195343-177195343 | p.A192V | 1 |
| chr2:177188133-177188133 | p.M50T | 1 |
| chr2:177193105-177193105 | p.T124A | 1 |
| chr2:177195386-177195386 | p.K206K | 1 |
| chr2:177188134-177188134 | p.M50I | 1 |
| chr2:177193604-177193604 | p.L127L | 1 |
| chr2:177195389-177195389 | p.? | 1 |
| chr2:177188167-177188167 | p.A61A | 1 |
| chr2:177193611-177193611 | p.Q130* | 1 |
| chr2:177202251-177202251 | p.G217G | 1 |
| Top |
|
 |
| Point Mutation/ Tissue ID | 1 | 2 | 3 | 4 | 5 | 6 | 7 | 8 | 9 | 10 | 11 | 12 | 13 | 14 | 15 | 16 | 17 | 18 | 19 | 20 |
| # sample | 1 | 1 | 6 | 4 | 1 | 1 | 3 | 2 | ||||||||||||
| # mutation | 1 | 1 | 6 | 5 | 1 | 1 | 3 | 2 | ||||||||||||
| nonsynonymous SNV | 1 | 4 | 5 | 1 | 1 | 2 | 1 | |||||||||||||
| synonymous SNV | 1 | 2 | 1 | 1 |
| cf) Tissue ID; Tissue type (1; BLCA[Bladder Urothelial Carcinoma], 2; BRCA[Breast invasive carcinoma], 3; CESC[Cervical squamous cell carcinoma and endocervical adenocarcinoma], 4; COAD[Colon adenocarcinoma], 5; GBM[Glioblastoma multiforme], 6; Glioma Low Grade, 7; HNSC[Head and Neck squamous cell carcinoma], 8; KICH[Kidney Chromophobe], 9; KIRC[Kidney renal clear cell carcinoma], 10; KIRP[Kidney renal papillary cell carcinoma], 11; LAML[Acute Myeloid Leukemia], 12; LUAD[Lung adenocarcinoma], 13; LUSC[Lung squamous cell carcinoma], 14; OV[Ovarian serous cystadenocarcinoma ], 15; PAAD[Pancreatic adenocarcinoma], 16; PRAD[Prostate adenocarcinoma], 17; SKCM[Skin Cutaneous Melanoma], 18:STAD[Stomach adenocarcinoma], 19:THCA[Thyroid carcinoma], 20:UCEC[Uterine Corpus Endometrial Carcinoma]) |
| Top |
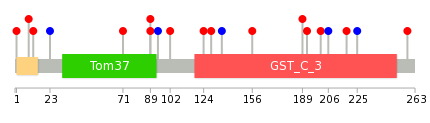
| * We represented just top 10 SNVs. When you move the cursor on each content, you can see more deailed mutation information on the Tooltip. Those are primary_site, primary_histology, mutation(aa), pubmedID. |
| Genomic Position | Mutation(aa) | Unique sampleID count |
| chr2:177191609 | p.V89A | 1 |
| chr2:177195386 | p.A94A | 1 |
| chr2:177191610 | p.G102W | 1 |
| chr2:177202252 | p.T124A | 1 |
| chr2:177191626 | p.L129F | 1 |
| chr2:177202275 | p.T136T | 1 |
| chr2:177193039 | p.I156S | 1 |
| chr2:177202373 | p.C189W | 1 |
| chr2:177193105 | p.A192V | 1 |
| chr2:177193608 | p.P201Q | 1 |
| * Copy number data were extracted from TCGA using R package TCGA-Assembler. The URLs of all public data files on TCGA DCC data server were gathered on Jan-05-2015. Function ProcessCNAData in TCGA-Assembler package was used to obtain gene-level copy number value which is calculated as the average copy number of the genomic region of a gene. |
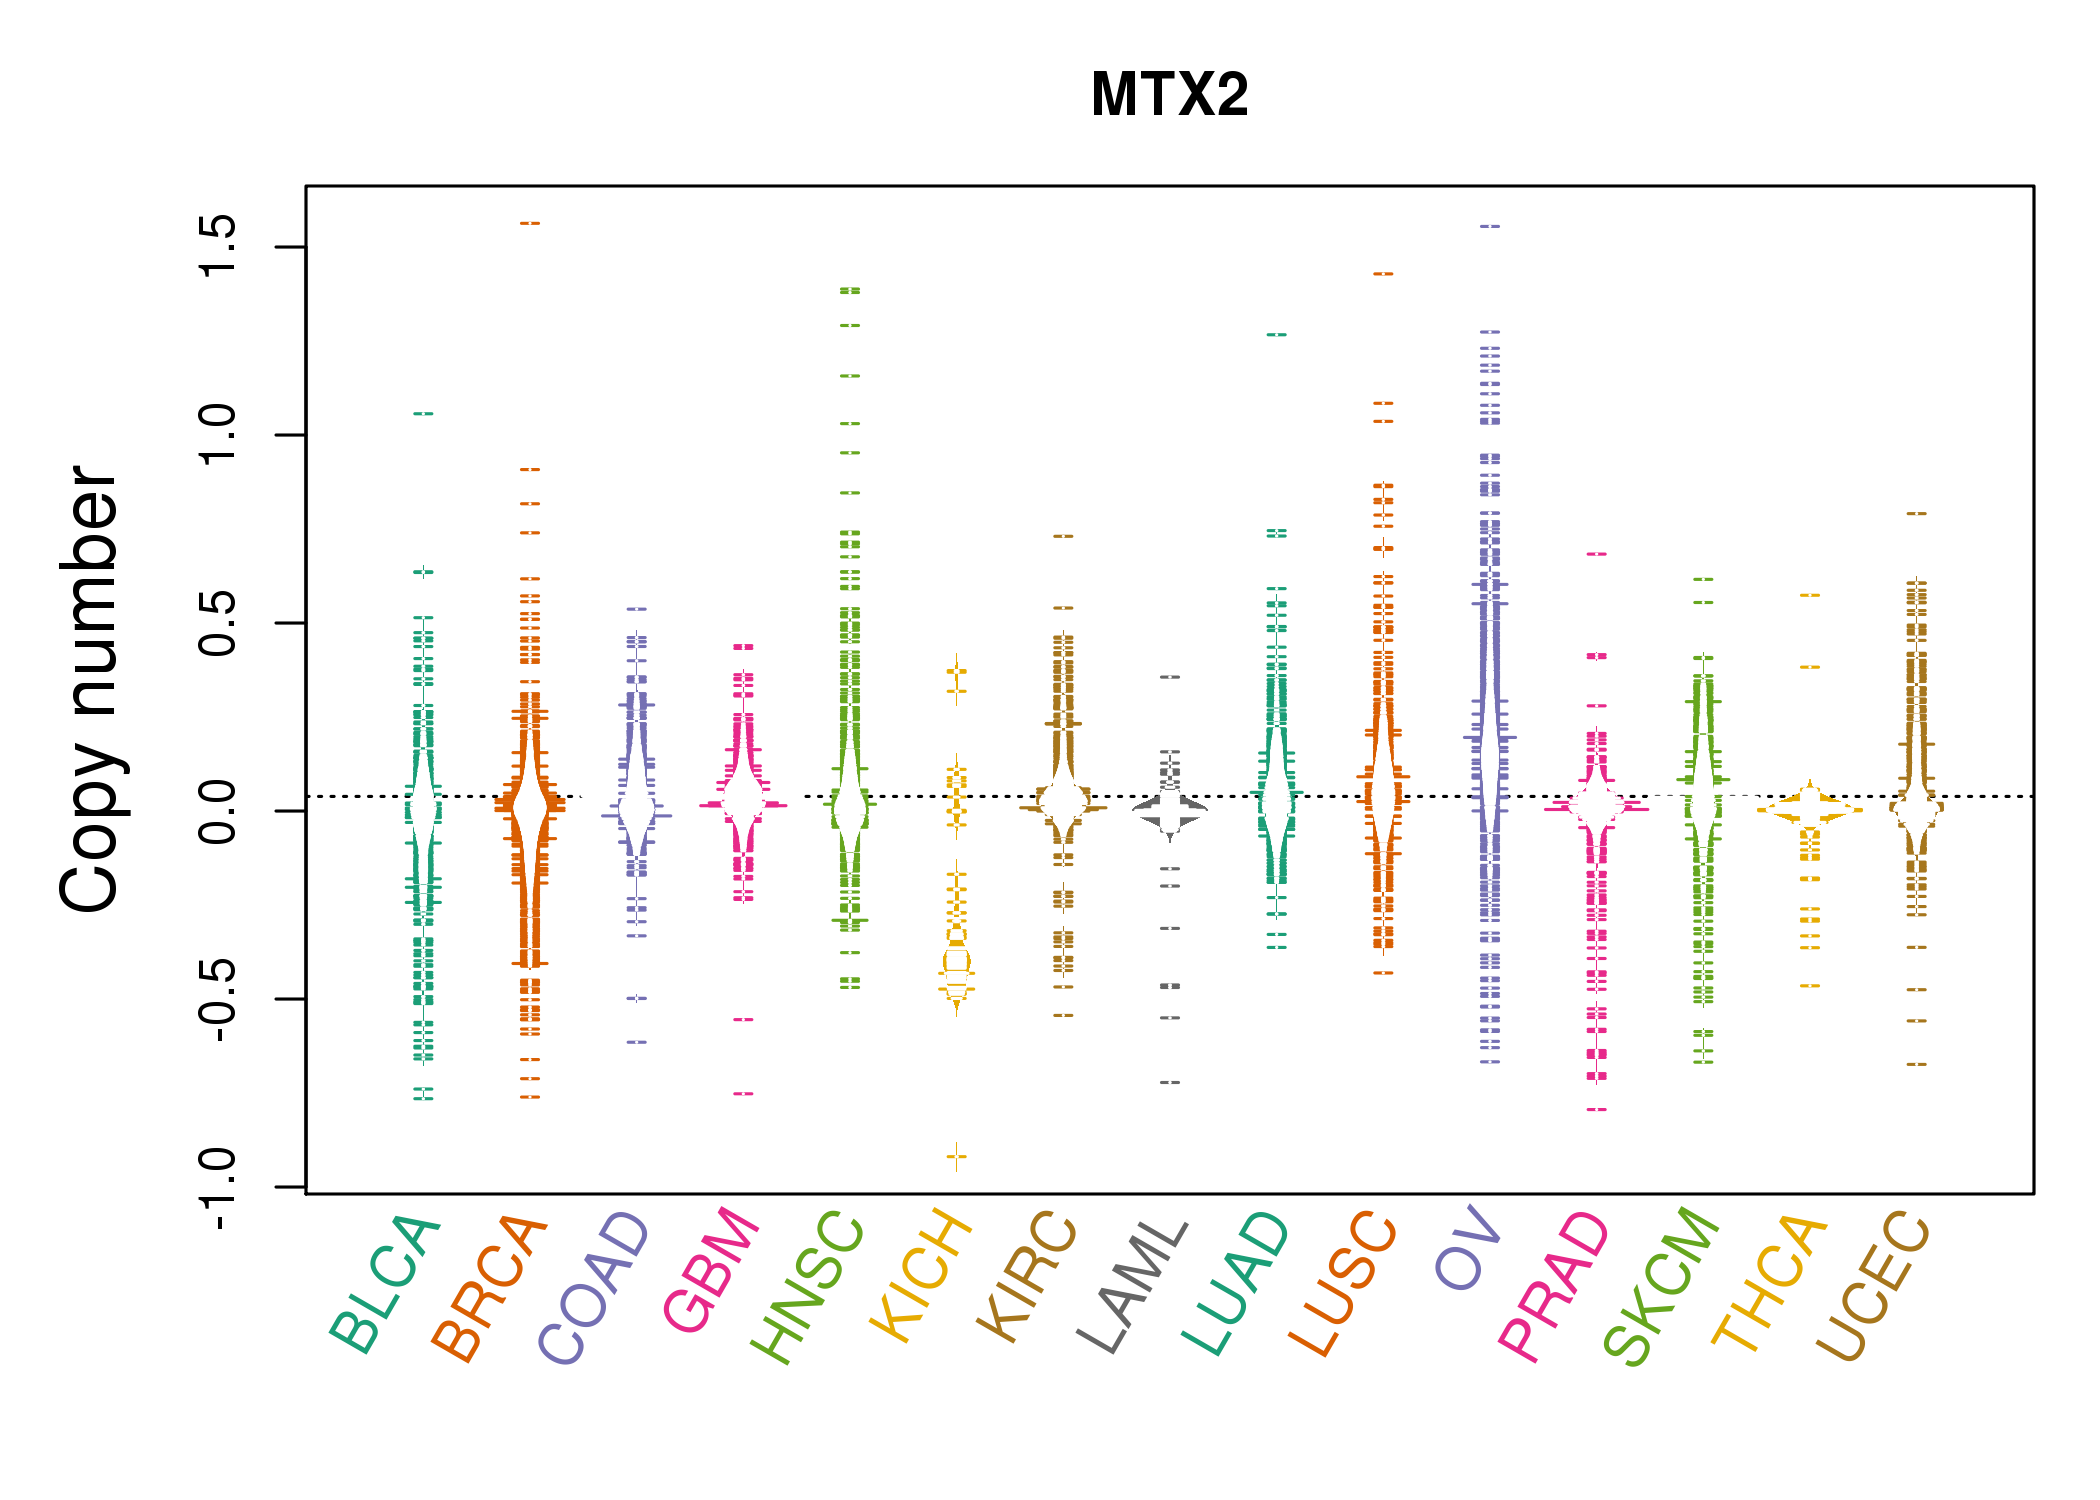 |
| cf) Tissue ID[Tissue type]: BLCA[Bladder Urothelial Carcinoma], BRCA[Breast invasive carcinoma], CESC[Cervical squamous cell carcinoma and endocervical adenocarcinoma], COAD[Colon adenocarcinoma], GBM[Glioblastoma multiforme], Glioma Low Grade, HNSC[Head and Neck squamous cell carcinoma], KICH[Kidney Chromophobe], KIRC[Kidney renal clear cell carcinoma], KIRP[Kidney renal papillary cell carcinoma], LAML[Acute Myeloid Leukemia], LUAD[Lung adenocarcinoma], LUSC[Lung squamous cell carcinoma], OV[Ovarian serous cystadenocarcinoma ], PAAD[Pancreatic adenocarcinoma], PRAD[Prostate adenocarcinoma], SKCM[Skin Cutaneous Melanoma], STAD[Stomach adenocarcinoma], THCA[Thyroid carcinoma], UCEC[Uterine Corpus Endometrial Carcinoma] |
| Top |
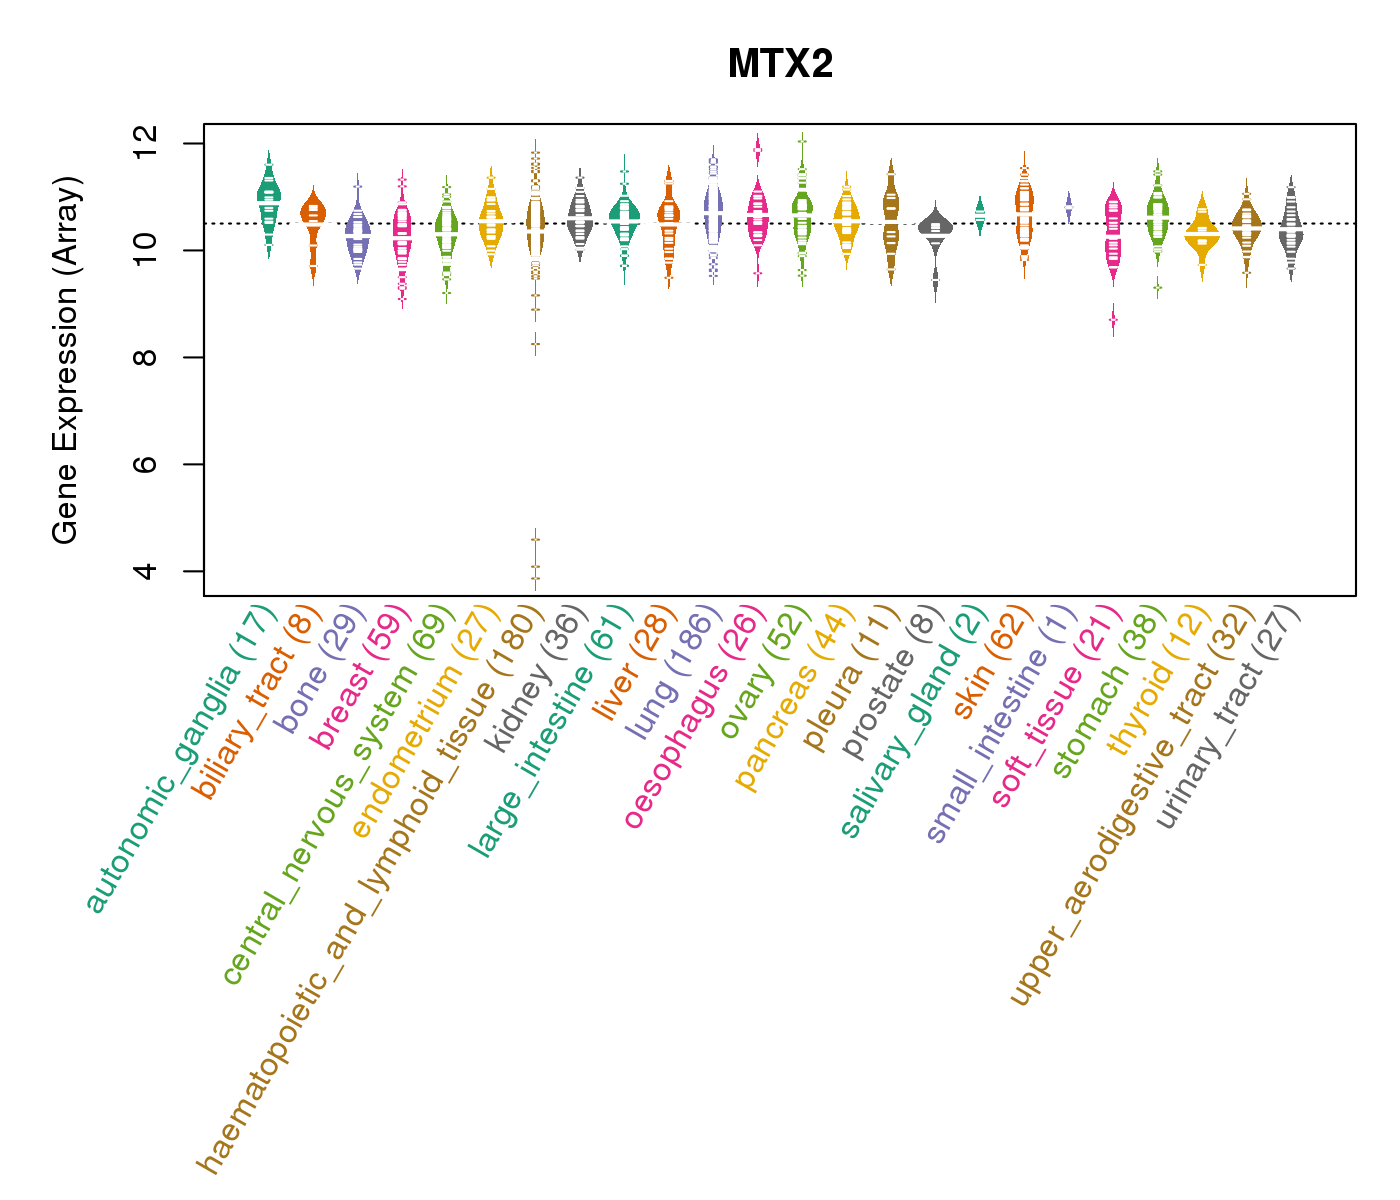
| Gene Expression for MTX2 |
| * CCLE gene expression data were extracted from CCLE_Expression_Entrez_2012-10-18.res: Gene-centric RMA-normalized mRNA expression data. |
 |
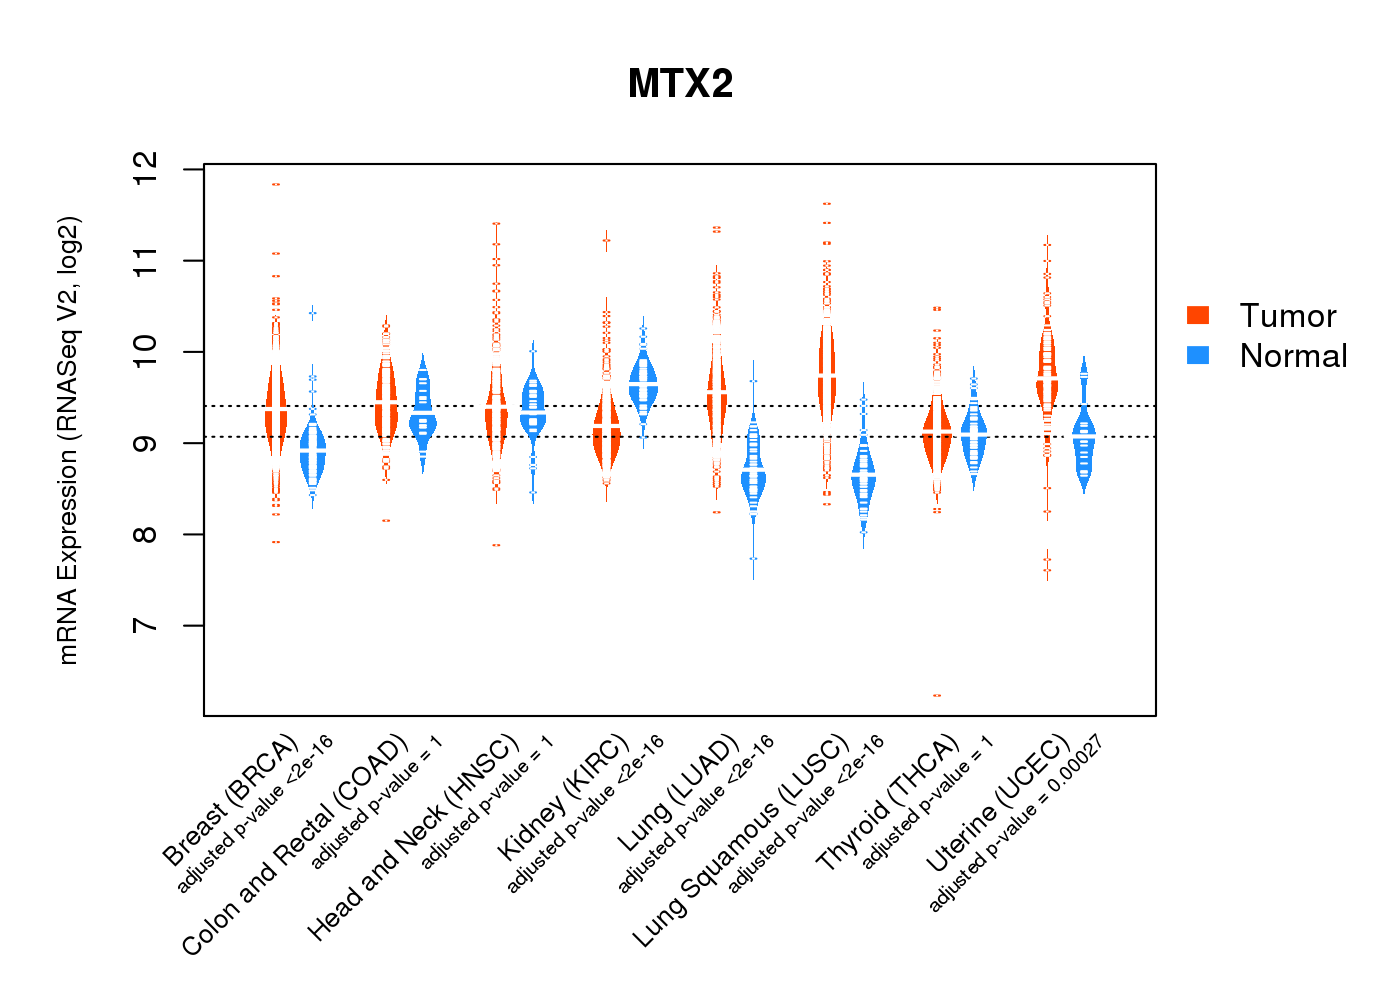
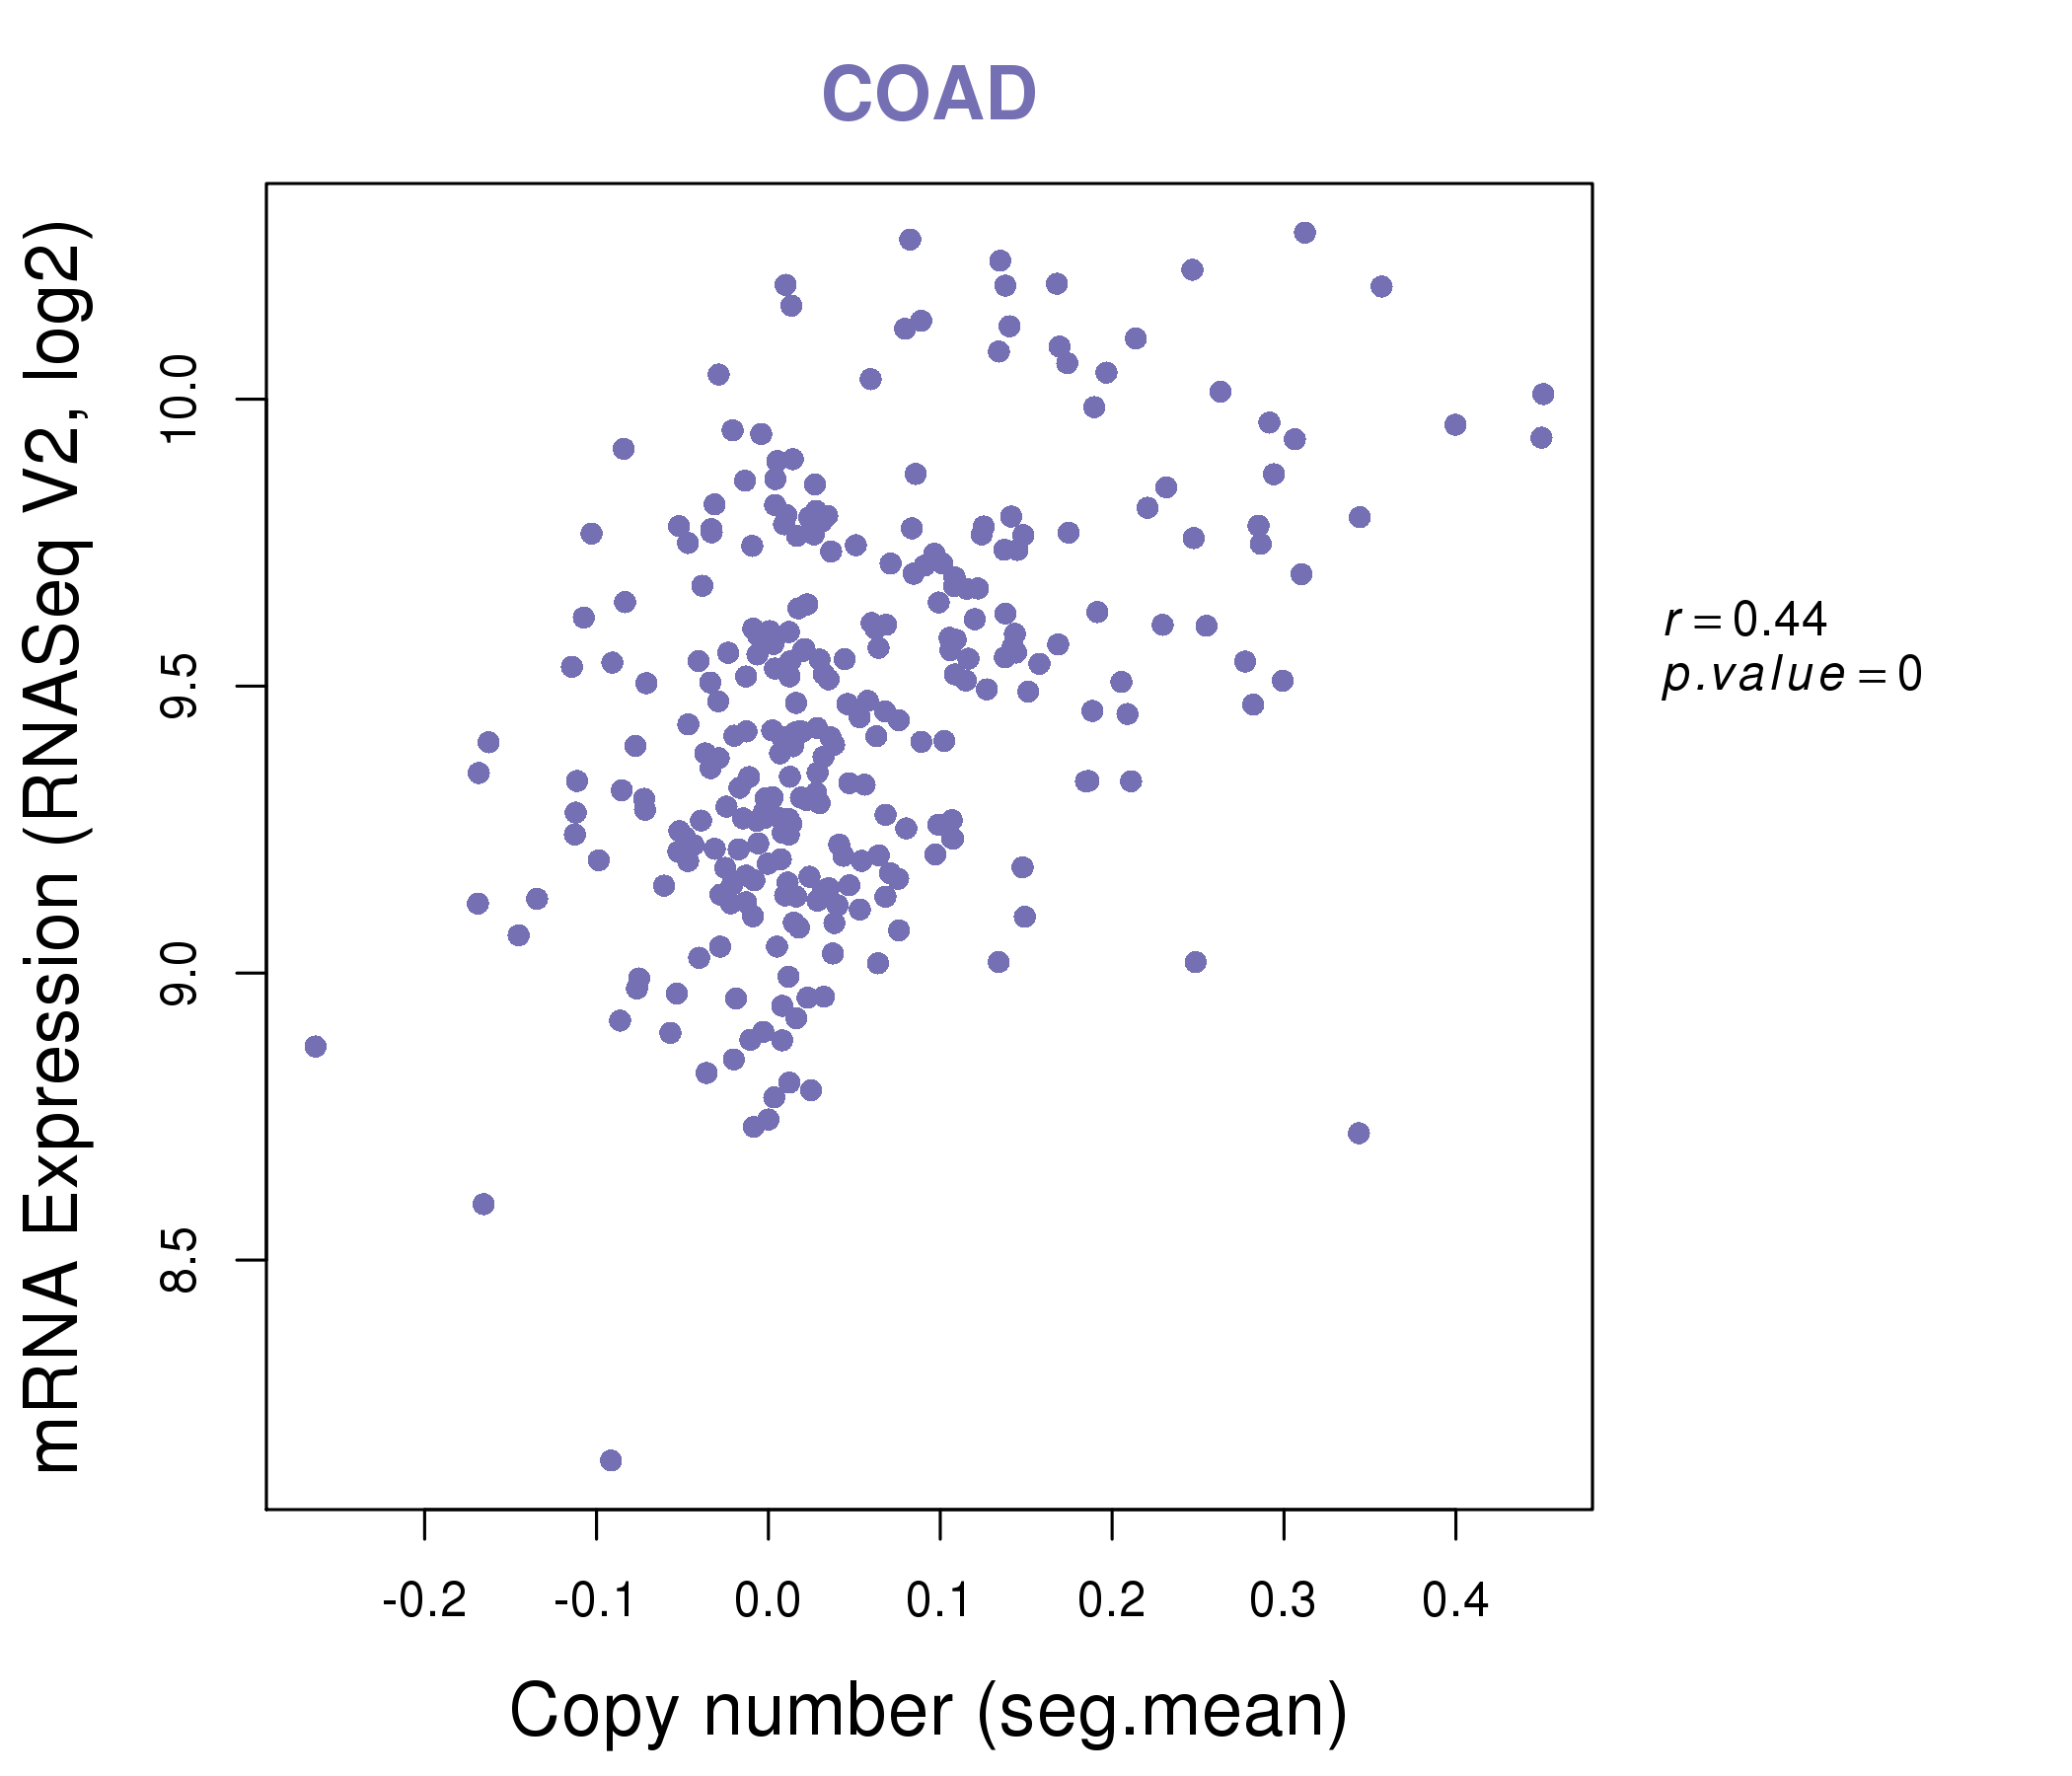
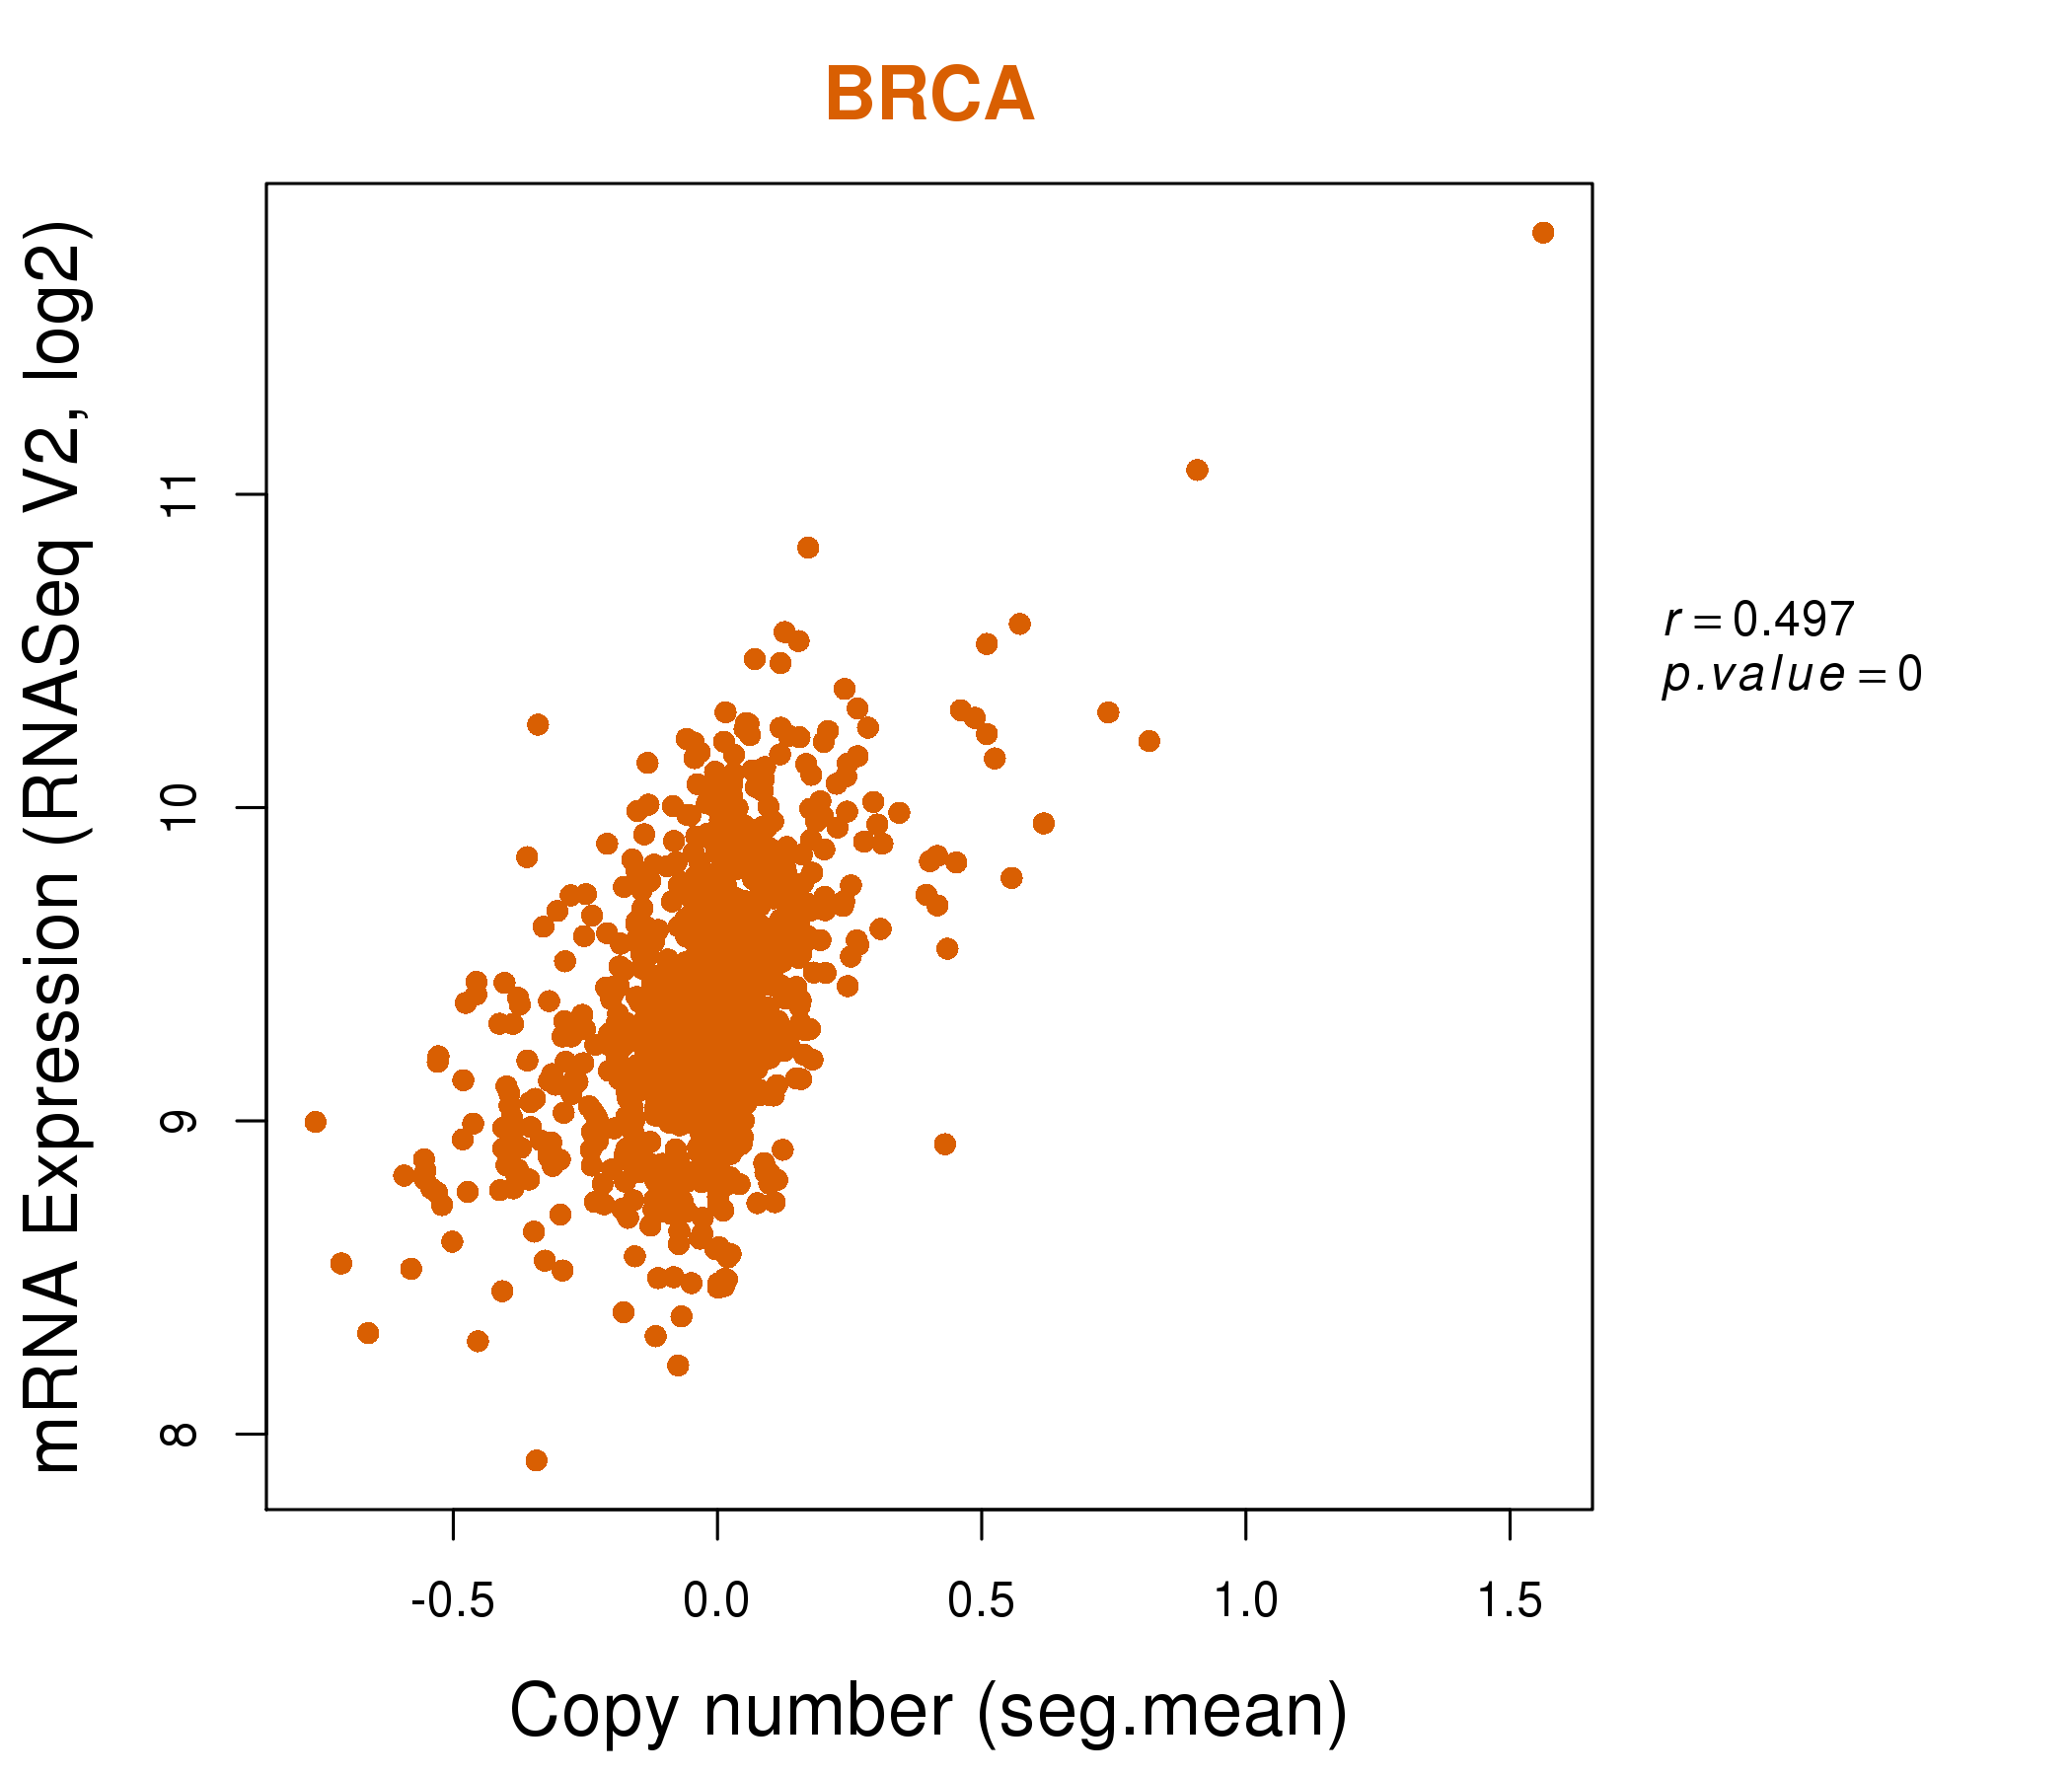
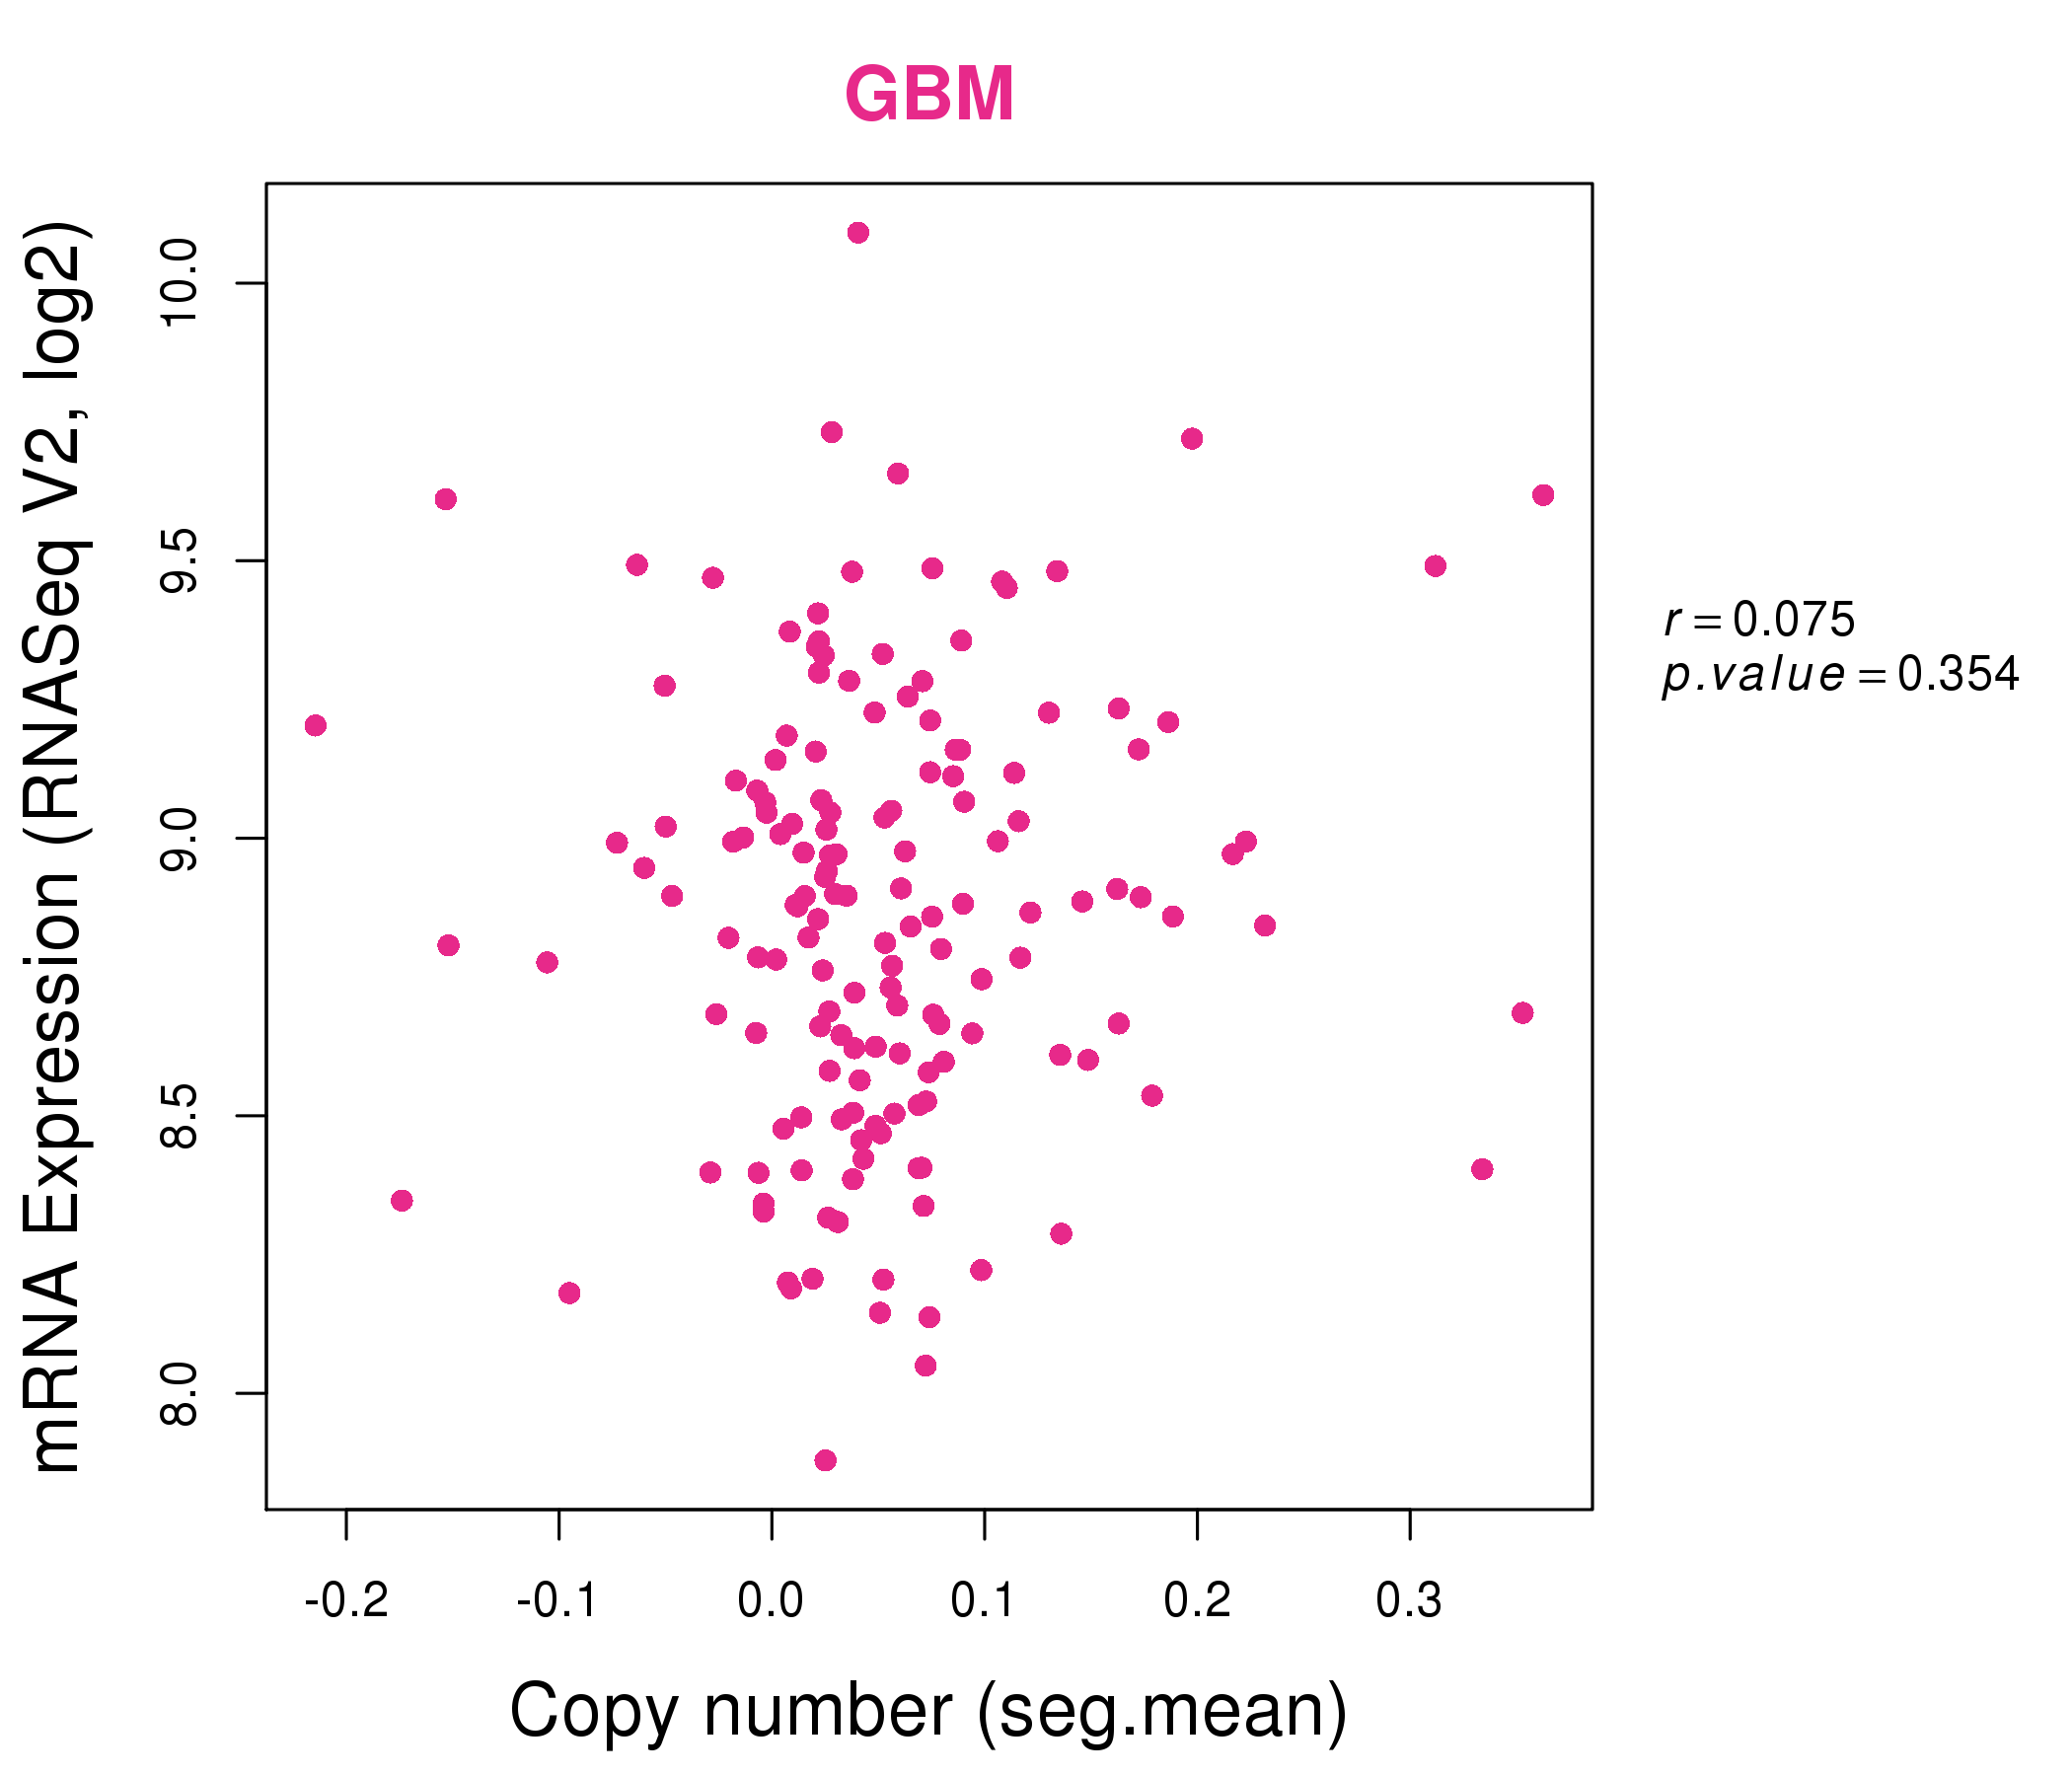
| * Normalized gene expression data of RNASeqV2 was extracted from TCGA using R package TCGA-Assembler. The URLs of all public data files on TCGA DCC data server were gathered at Jan-05-2015. Only eight cancer types have enough normal control samples for differential expression analysis. (t test, adjusted p<0.05 (using Benjamini-Hochberg FDR)) |
 |
| Top |
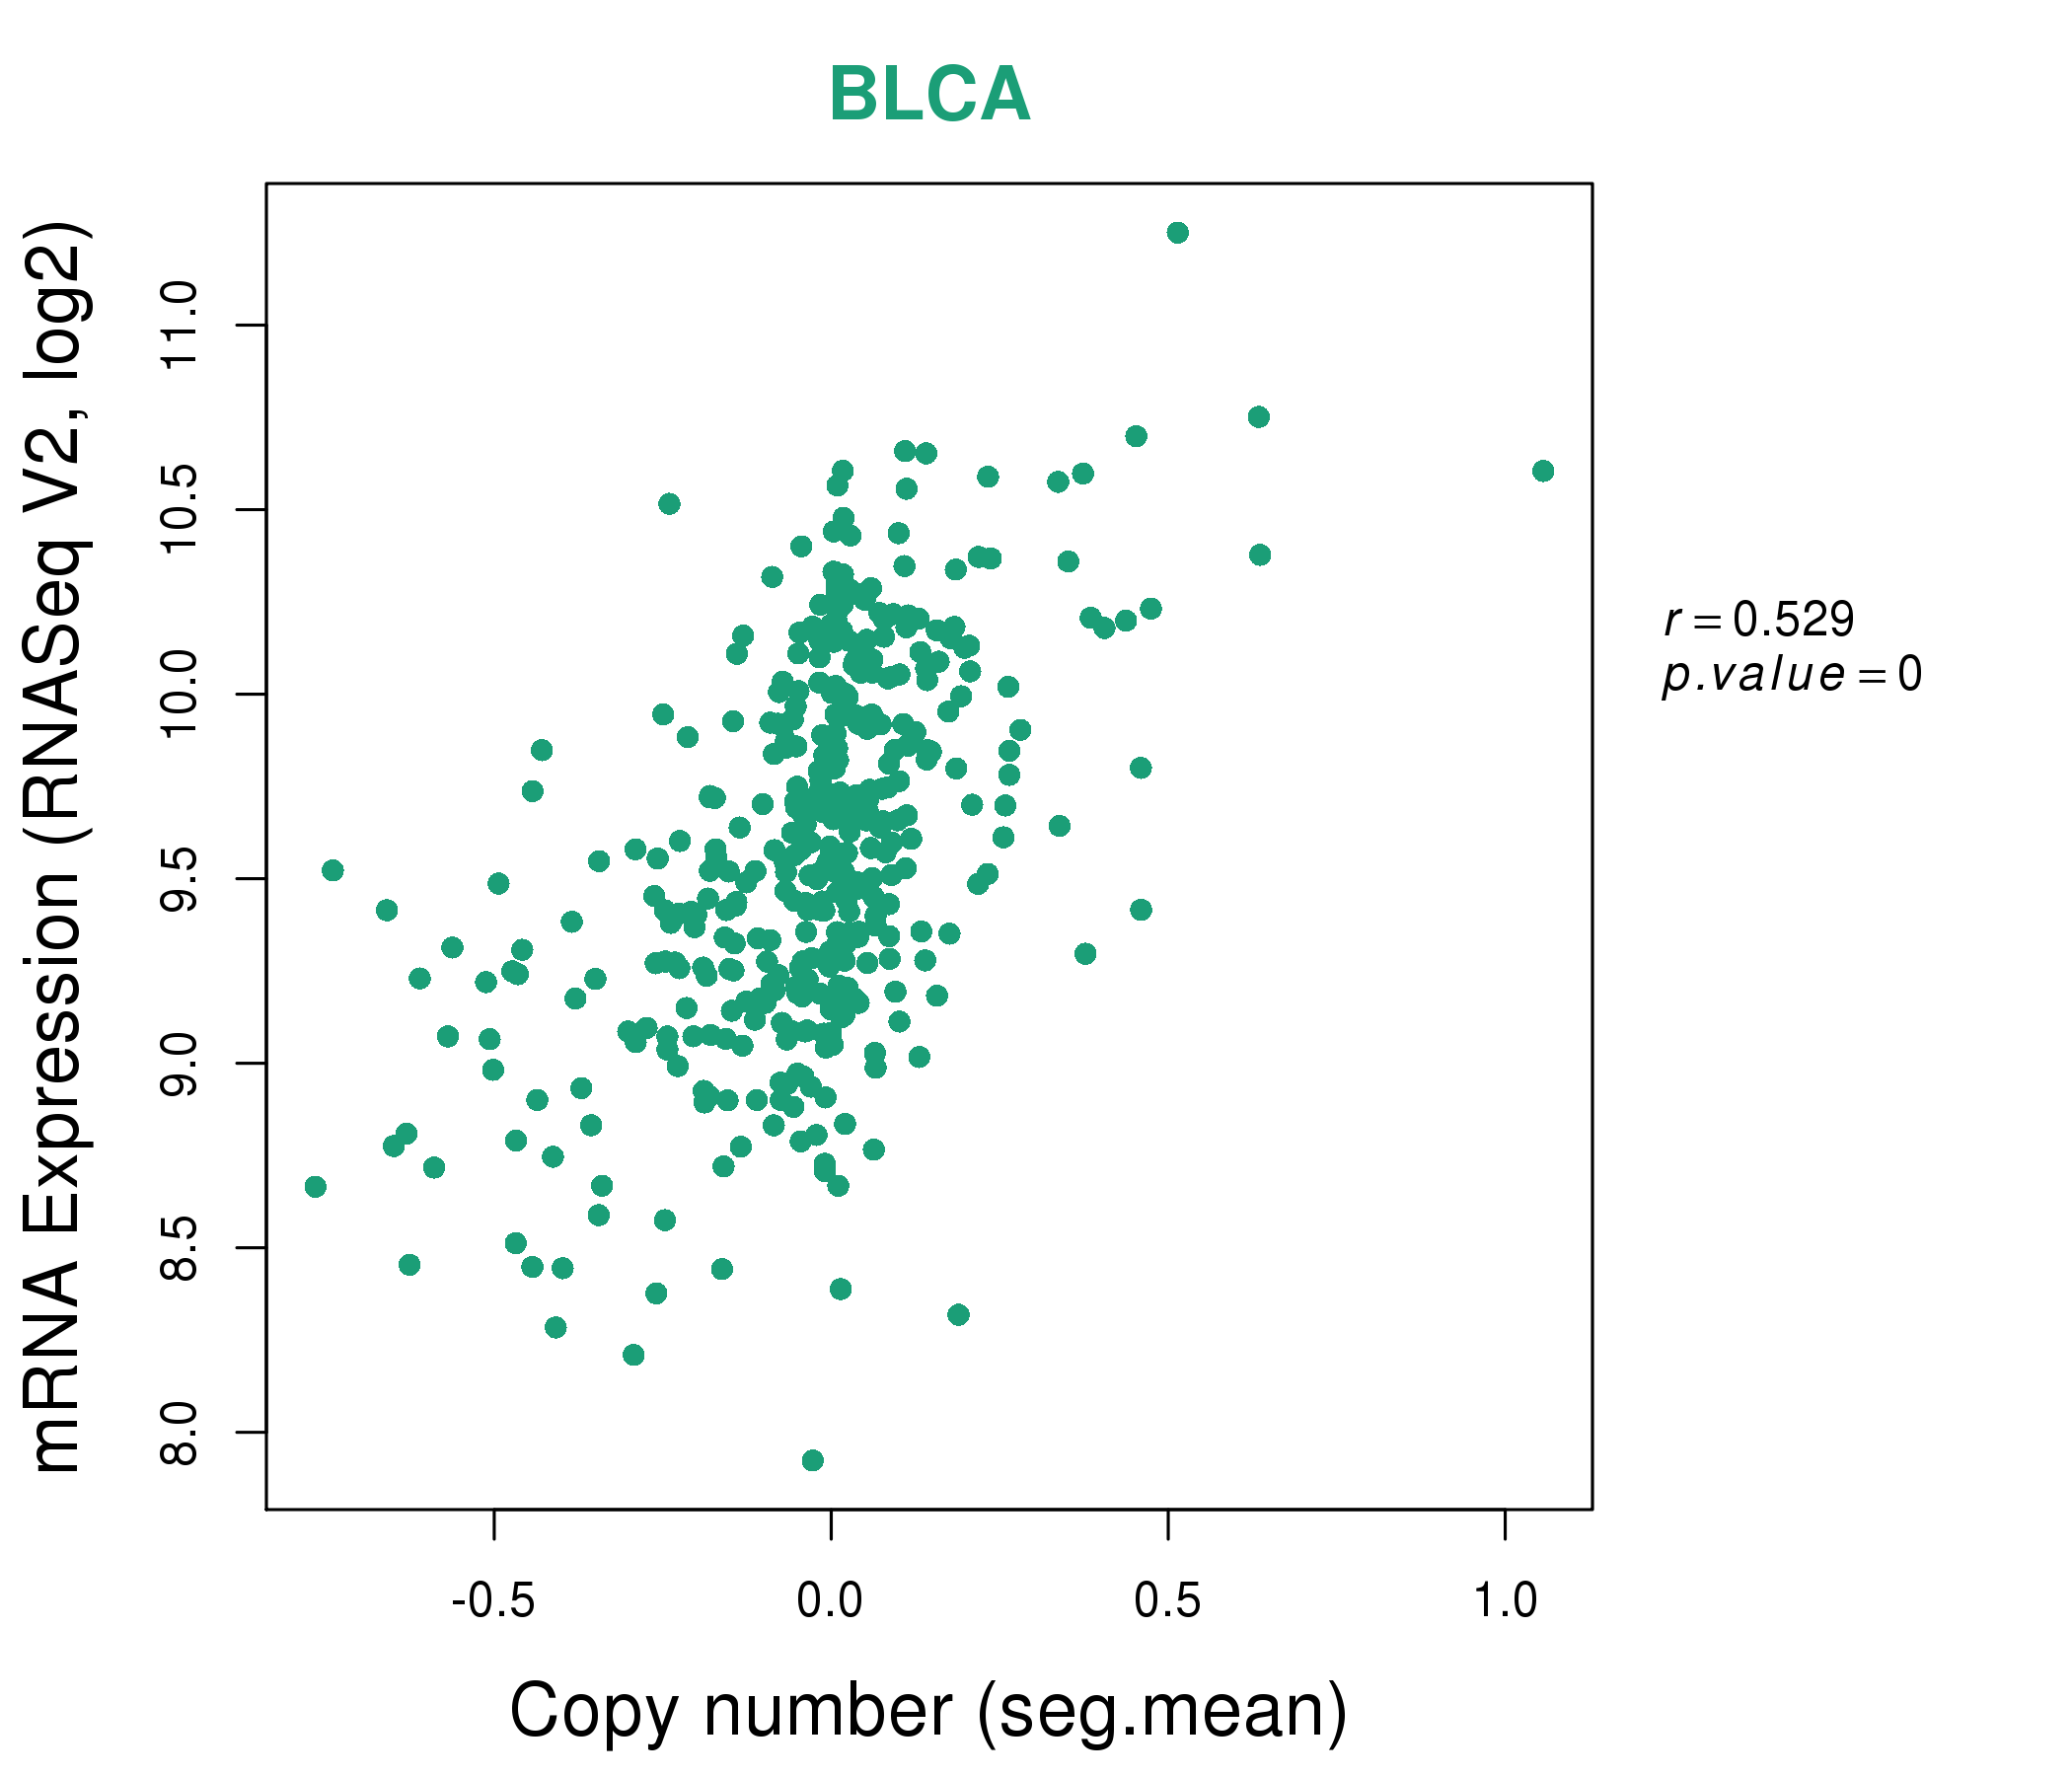
| * This plots show the correlation between CNV and gene expression. |
: Open all plots for all cancer types
 |
|
 |
|
| Top |
| Gene-Gene Network Information |
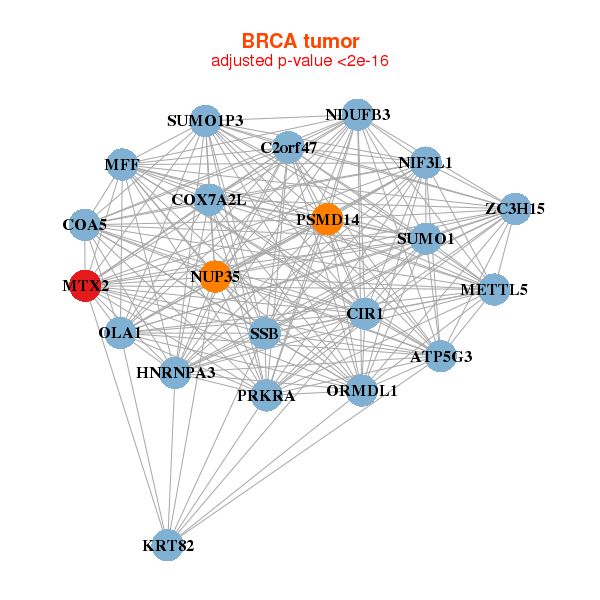
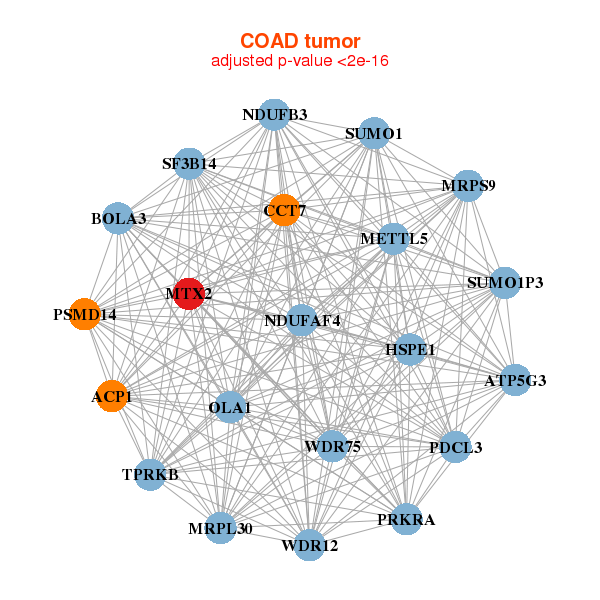
| * Co-Expression network figures were drawn using R package igraph. Only the top 20 genes with the highest correlations were shown. Red circle: input gene, orange circle: cell metabolism gene, sky circle: other gene |
: Open all plots for all cancer types
 |
|
| ATP5G3,C2orf47,COA5,CIR1,COX7A2L,HNRNPA3,KRT82, METTL5,MFF,MTX2,NDUFB3,NIF3L1,NUP35,OLA1, ORMDL1,PRKRA,PSMD14,SSB,SUMO1,SUMO1P3,ZC3H15 | ACYP2,ATP5C1,ATP5F1,C12orf73,CDKN2AIPNL,COPS3,COPS4, COPS5,COQ3,COX7B,FKBP3,HCCS,MRPL15,MRPL1, MRPL33,MTX2,NDUFA4,NDUFAB1,NDUFB4,NDUFS3,NDUFV2 |
 |
|
| ACP1,ATP5G3,BOLA3,CCT7,HSPE1,METTL5,MRPL30, MRPS9,MTX2,NDUFAF4,NDUFB3,OLA1,PDCL3,PRKRA, PSMD14,SF3B14,SUMO1,SUMO1P3,TPRKB,WDR12,WDR75 | ACTR6,ARFIP1,BTBD10,C1GALT1C1,CETN3,CMC1,ITGB3BP, KRCC1,MRPL21,MRPL35,MTX2,OCIAD1,PEX11B,RBM7, RPF1,RWDD4,SCFD1,SRP9,TGDS,TIAL1,TMEM167A |
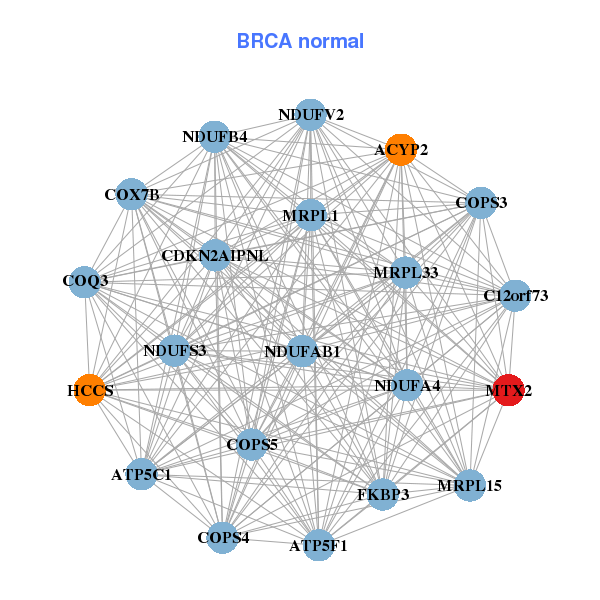
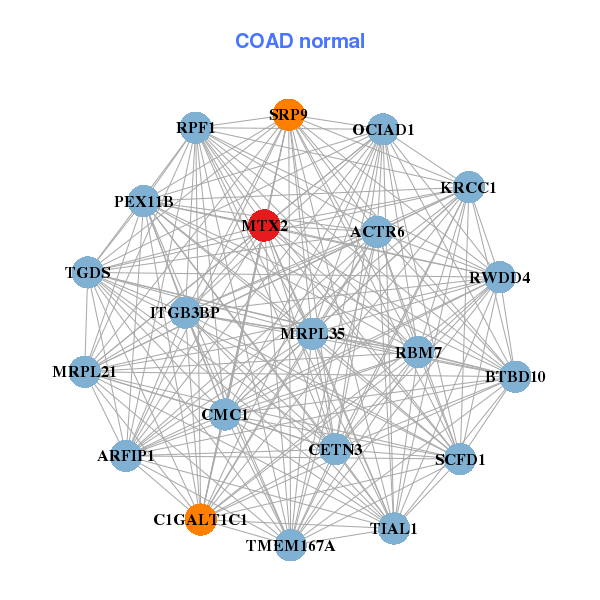
| * Co-Expression network figures were drawn using R package igraph. Only the top 20 genes with the highest correlations were shown. Red circle: input gene, orange circle: cell metabolism gene, sky circle: other gene |
: Open all plots for all cancer types
| Top |
: Open all interacting genes' information including KEGG pathway for all interacting genes from DAVID
| Top |
| Pharmacological Information for MTX2 |
| There's no related Drug. |
| Top |
| Cross referenced IDs for MTX2 |
| * We obtained these cross-references from Uniprot database. It covers 150 different DBs, 18 categories. http://www.uniprot.org/help/cross_references_section |
: Open all cross reference information
|
Copyright © 2016-Present - The Univsersity of Texas Health Science Center at Houston @ |