|
||||||||||||||||||||
| |
| Phenotypic Information (metabolism pathway, cancer, disease, phenome) |
| |
| |
| Gene-Gene Network Information: Co-Expression Network, Interacting Genes & KEGG |
| |
|


| Gene Summary for B3GNT2 |
| Basic gene info. | Gene symbol | B3GNT2 |
| Gene name | UDP-GlcNAc:betaGal beta-1,3-N-acetylglucosaminyltransferase 2 | |
| Synonyms | B3GN-T2|B3GNT|B3GNT-2|B3GNT1|BETA3GNT|BGNT2|BGnT-2 | |
| Cytomap | UCSC genome browser: 2p15 | |
| Genomic location | chr2 :62423261-62451866 | |
| Type of gene | protein-coding | |
| RefGenes | NM_006577.5, NM_033252.1, | |
| Ensembl id | ENSG00000170340 | |
| Description | UDP-GlcNAc:betaGal beta-1,3-N-acetylglucosaminyltransferase 1beta-1,3-Gn-T1beta-1,3-Gn-T2beta-1,3-N-acetylglucosaminyltransferase bGnT-1beta-1,3-N-acetylglucosaminyltransferase bGnT-2beta3Gn-T1beta3Gn-T2 | |
| Modification date | 20141207 | |
| dbXrefs | MIM : 605581 | |
| HGNC : HGNC | ||
| Ensembl : ENSG00000170340 | ||
| HPRD : 09279 | ||
| Vega : OTTHUMG00000129444 | ||
| Protein | UniProt: go to UniProt's Cross Reference DB Table | |
| Expression | CleanEX: HS_B3GNT2 | |
| BioGPS: 10678 | ||
| Gene Expression Atlas: ENSG00000170340 | ||
| The Human Protein Atlas: ENSG00000170340 | ||
| Pathway | NCI Pathway Interaction Database: B3GNT2 | |
| KEGG: B3GNT2 | ||
| REACTOME: B3GNT2 | ||
| ConsensusPathDB | ||
| Pathway Commons: B3GNT2 | ||
| Metabolism | MetaCyc: B3GNT2 | |
| HUMANCyc: B3GNT2 | ||
| Regulation | Ensembl's Regulation: ENSG00000170340 | |
| miRBase: chr2 :62,423,261-62,451,866 | ||
| TargetScan: NM_006577 | ||
| cisRED: ENSG00000170340 | ||
| Context | iHOP: B3GNT2 | |
| cancer metabolism search in PubMed: B3GNT2 | ||
| UCL Cancer Institute: B3GNT2 | ||
| Assigned class in ccmGDB | C | |
| Top |
| Phenotypic Information for B3GNT2(metabolism pathway, cancer, disease, phenome) |
| Cancer | CGAP: B3GNT2 |
| Familial Cancer Database: B3GNT2 | |
| * This gene is included in those cancer gene databases. |
|
|
|
|
|
|
| ||||||||||||||
Oncogene 1 | Significant driver gene in | |||||||||||||||||||
| cf) number; DB name 1 Oncogene; http://nar.oxfordjournals.org/content/35/suppl_1/D721.long, 2 Tumor Suppressor gene; https://bioinfo.uth.edu/TSGene/, 3 Cancer Gene Census; http://www.nature.com/nrc/journal/v4/n3/abs/nrc1299.html, 4 CancerGenes; http://nar.oxfordjournals.org/content/35/suppl_1/D721.long, 5 Network of Cancer Gene; http://ncg.kcl.ac.uk/index.php, 1Therapeutic Vulnerabilities in Cancer; http://cbio.mskcc.org/cancergenomics/statius/ |
| REACTOME_METABOLISM_OF_PROTEINS REACTOME_METABOLISM_OF_CARBOHYDRATES | |
| OMIM | |
| Orphanet | |
| Disease | KEGG Disease: B3GNT2 |
| MedGen: B3GNT2 (Human Medical Genetics with Condition) | |
| ClinVar: B3GNT2 | |
| Phenotype | MGI: B3GNT2 (International Mouse Phenotyping Consortium) |
| PhenomicDB: B3GNT2 | |
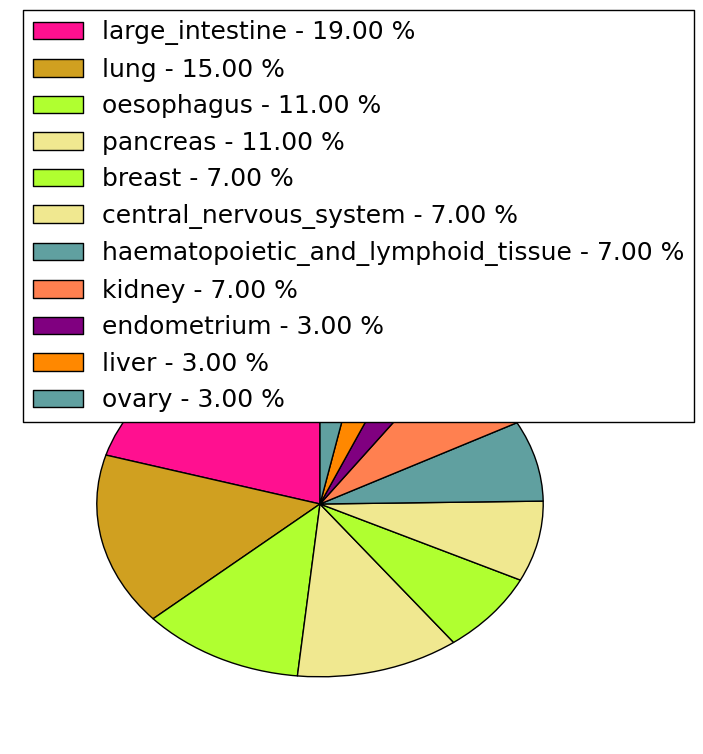
| Mutations for B3GNT2 |
| * Under tables are showing count per each tissue to give us broad intuition about tissue specific mutation patterns.You can go to the detailed page for each mutation database's web site. |
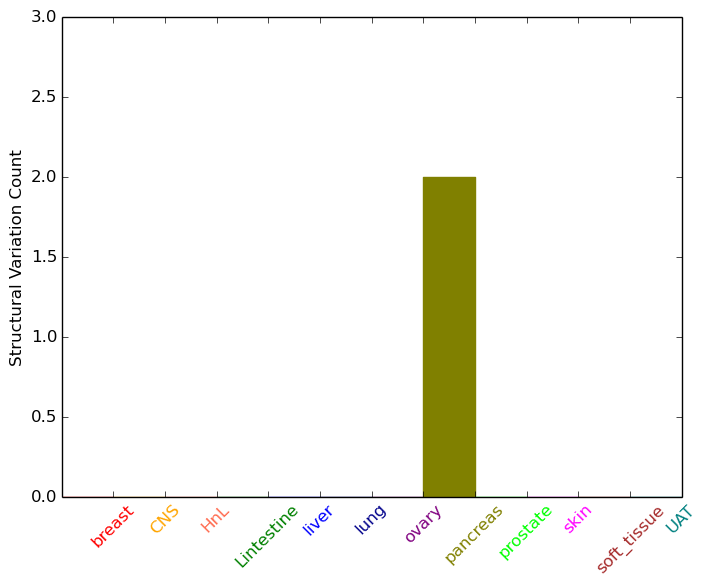
| - Statistics for Tissue and Mutation type | Top |
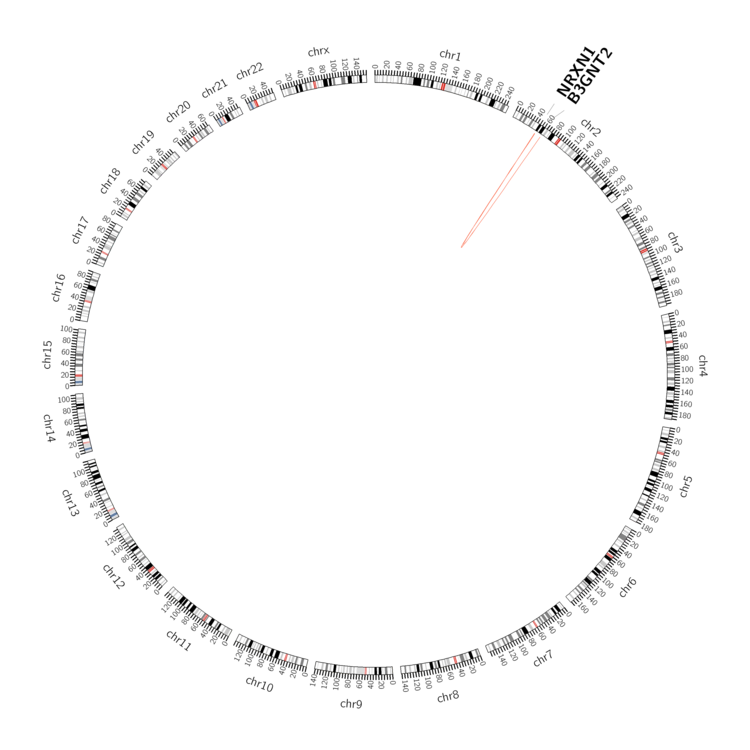 |
| - For Inter-chromosomal Variations |
| There's no inter-chromosomal structural variation. |
| - For Intra-chromosomal Variations |
| * Intra-chromosomal variantions includes 'intrachromosomal amplicon to amplicon', 'intrachromosomal amplicon to non-amplified dna', 'intrachromosomal deletion', 'intrachromosomal fold-back inversion', 'intrachromosomal inversion', 'intrachromosomal tandem duplication', 'Intrachromosomal unknown type', 'intrachromosomal with inverted orientation', 'intrachromosomal with non-inverted orientation'. |
 |
| Sample | Symbol_a | Chr_a | Start_a | End_a | Symbol_b | Chr_b | Start_b | End_b |
| pancreas | B3GNT2 | chr2 | 62447053 | 62447073 | NRXN1 | chr2 | 50360125 | 50360145 |
| pancreas | B3GNT2 | chr2 | 62448454 | 62448474 | NRXN1 | chr2 | 50879715 | 50879735 |
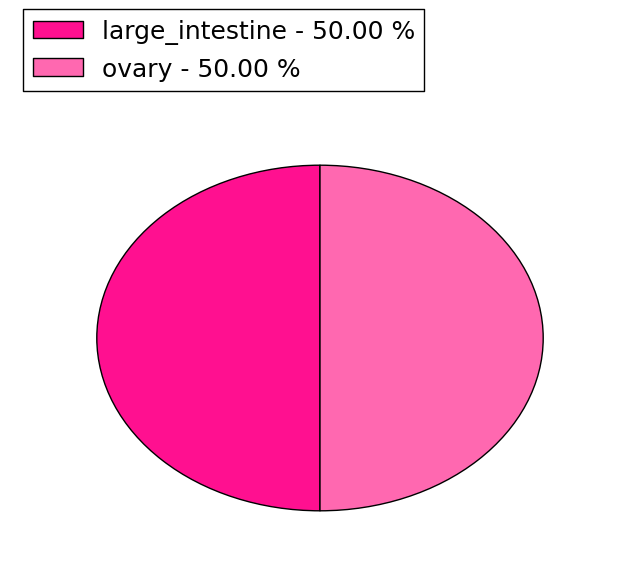
| cf) Tissue number; Tissue name (1;Breast, 2;Central_nervous_system, 3;Haematopoietic_and_lymphoid_tissue, 4;Large_intestine, 5;Liver, 6;Lung, 7;Ovary, 8;Pancreas, 9;Prostate, 10;Skin, 11;Soft_tissue, 12;Upper_aerodigestive_tract) |
| * From mRNA Sanger sequences, Chitars2.0 arranged chimeric transcripts. This table shows B3GNT2 related fusion information. |
| ID | Head Gene | Tail Gene | Accession | Gene_a | qStart_a | qEnd_a | Chromosome_a | tStart_a | tEnd_a | Gene_a | qStart_a | qEnd_a | Chromosome_a | tStart_a | tEnd_a |
| AF288209 | MALAT1 | 1 | 66 | 11 | 65273098 | 65273163 | B3GNT2 | 62 | 2498 | 2 | 62449387 | 62451866 | |
| AV724042 | CNTN4 | 1 | 120 | 3 | 3078893 | 3079012 | B3GNT2 | 117 | 693 | 2 | 62449613 | 62450198 | |
| Top |
| There's no copy number variation information in COSMIC data for this gene. |
| Top |
|
 |
| Top |
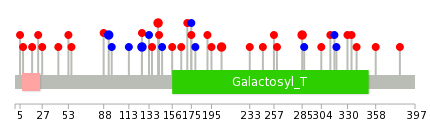
| Stat. for Non-Synonymous SNVs (# total SNVs=26) | (# total SNVs=10) |
 |  |
(# total SNVs=2) | (# total SNVs=0) |
 |
| Top |
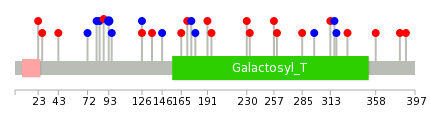
| * When you move the cursor on each content, you can see more deailed mutation information on the Tooltip. Those are primary_site,primary_histology,mutation(aa),pubmedID. |
| GRCh37 position | Mutation(aa) | Unique sampleID count |
| chr2:62449733-62449733 | p.R126R | 2 |
| chr2:62449779-62449779 | p.P142S | 2 |
| chr2:62449968-62449968 | p.H205Y | 2 |
| chr2:62449632-62449632 | p.L93L | 2 |
| chr2:62450208-62450208 | p.K285E | 2 |
| chr2:62450265-62450265 | p.A304T | 1 |
| chr2:62449434-62449434 | p.V27I | 1 |
| chr2:62449892-62449892 | p.V179V | 1 |
| chr2:62450292-62450292 | p.G313S | 1 |
| chr2:62449456-62449456 | p.N36fs*6 | 1 |
| Top |
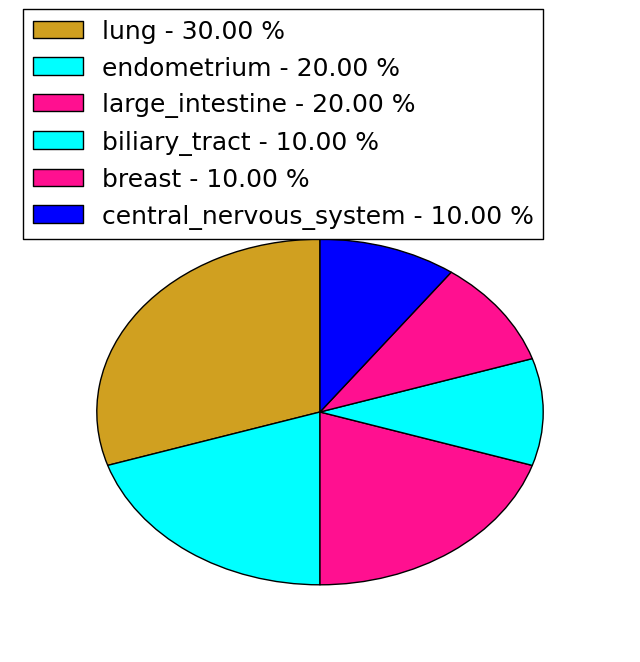
|
 |
| Point Mutation/ Tissue ID | 1 | 2 | 3 | 4 | 5 | 6 | 7 | 8 | 9 | 10 | 11 | 12 | 13 | 14 | 15 | 16 | 17 | 18 | 19 | 20 |
| # sample | 2 | 1 | 5 | 1 | 1 | 2 | 4 | 2 | 1 | 4 | 2 | 3 | ||||||||
| # mutation | 2 | 1 | 6 | 1 | 1 | 2 | 7 | 2 | 1 | 4 | 2 | 3 | ||||||||
| nonsynonymous SNV | 1 | 1 | 4 | 1 | 1 | 2 | 3 | 1 | 1 | 2 | 2 | 1 | ||||||||
| synonymous SNV | 1 | 2 | 4 | 1 | 2 | 2 |
| cf) Tissue ID; Tissue type (1; BLCA[Bladder Urothelial Carcinoma], 2; BRCA[Breast invasive carcinoma], 3; CESC[Cervical squamous cell carcinoma and endocervical adenocarcinoma], 4; COAD[Colon adenocarcinoma], 5; GBM[Glioblastoma multiforme], 6; Glioma Low Grade, 7; HNSC[Head and Neck squamous cell carcinoma], 8; KICH[Kidney Chromophobe], 9; KIRC[Kidney renal clear cell carcinoma], 10; KIRP[Kidney renal papillary cell carcinoma], 11; LAML[Acute Myeloid Leukemia], 12; LUAD[Lung adenocarcinoma], 13; LUSC[Lung squamous cell carcinoma], 14; OV[Ovarian serous cystadenocarcinoma ], 15; PAAD[Pancreatic adenocarcinoma], 16; PRAD[Prostate adenocarcinoma], 17; SKCM[Skin Cutaneous Melanoma], 18:STAD[Stomach adenocarcinoma], 19:THCA[Thyroid carcinoma], 20:UCEC[Uterine Corpus Endometrial Carcinoma]) |
| Top |
| * We represented just top 10 SNVs. When you move the cursor on each content, you can see more deailed mutation information on the Tooltip. Those are primary_site, primary_histology, mutation(aa), pubmedID. |
| Genomic Position | Mutation(aa) | Unique sampleID count |
| chr2:62449632 | p.L93L | 2 |
| chr2:62449598 | p.K285E | 1 |
| chr2:62449880 | p.S297S | 1 |
| chr2:62450306 | p.C96C | 1 |
| chr2:62449607 | p.R126H | 1 |
| chr2:62449892 | p.G313S | 1 |
| chr2:62450312 | p.R126R | 1 |
| chr2:62449618 | p.L317L | 1 |
| chr2:62449926 | p.D136H | 1 |
| chr2:62450343 | p.L319L | 1 |
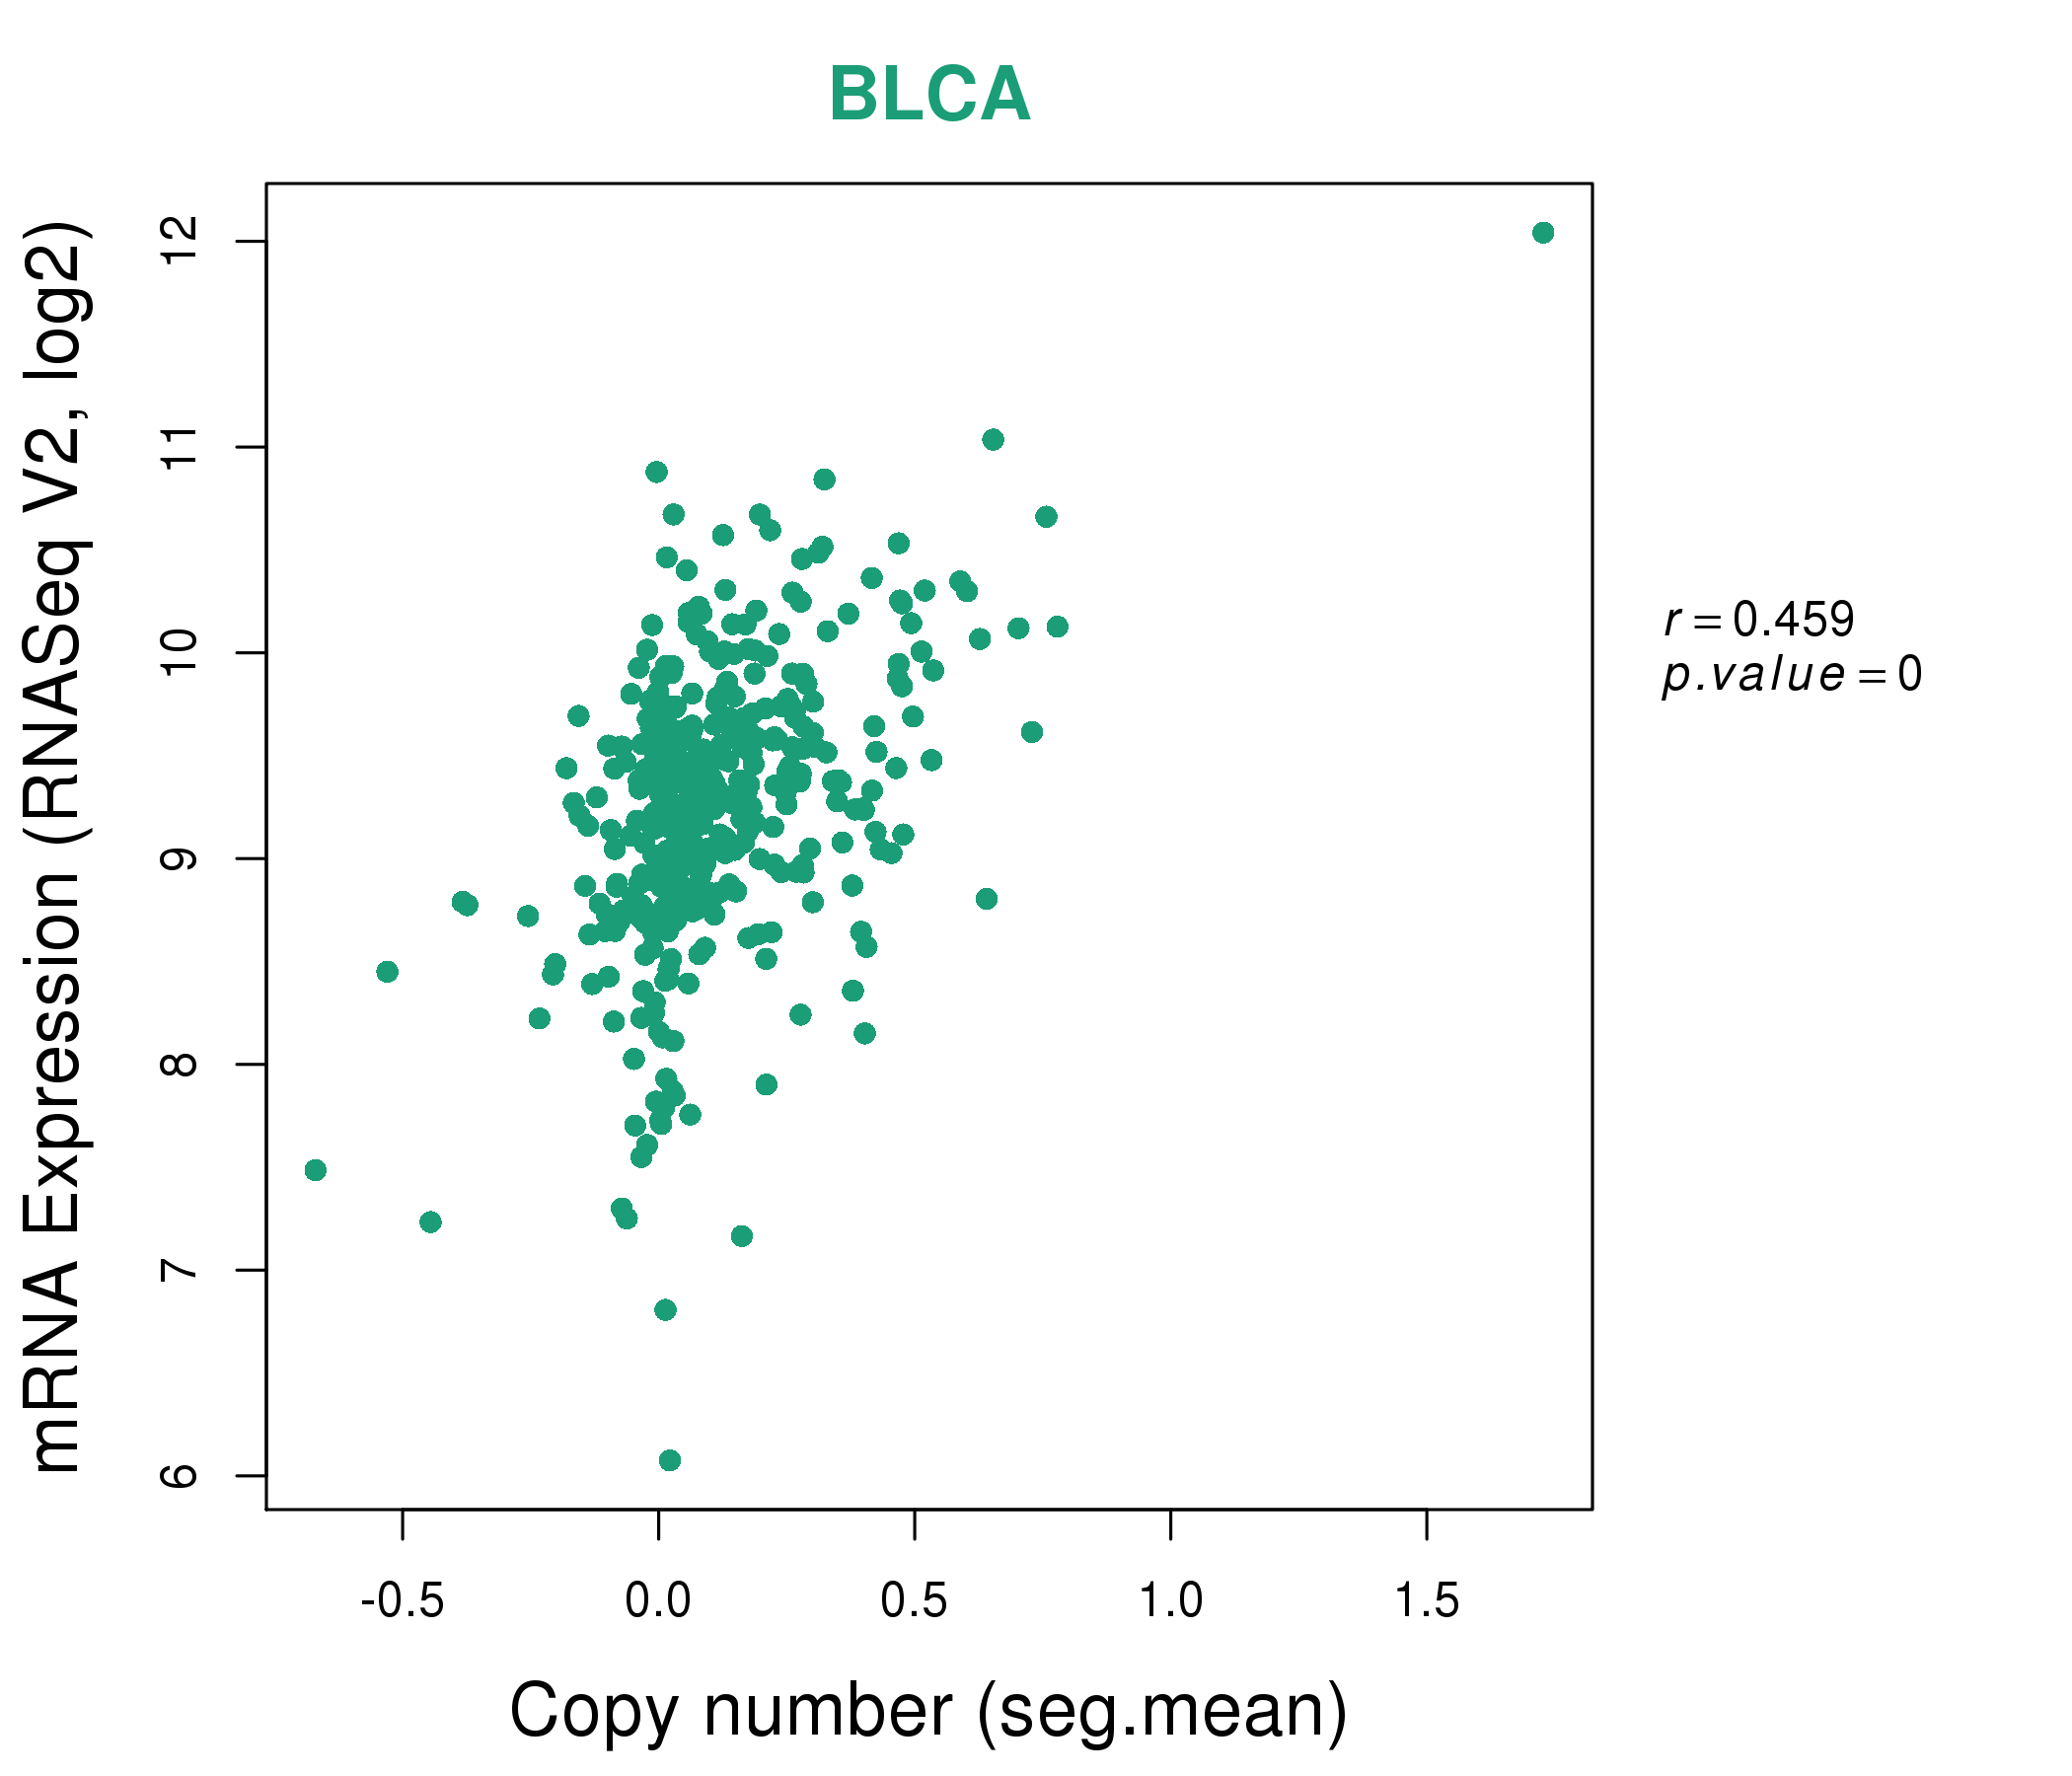
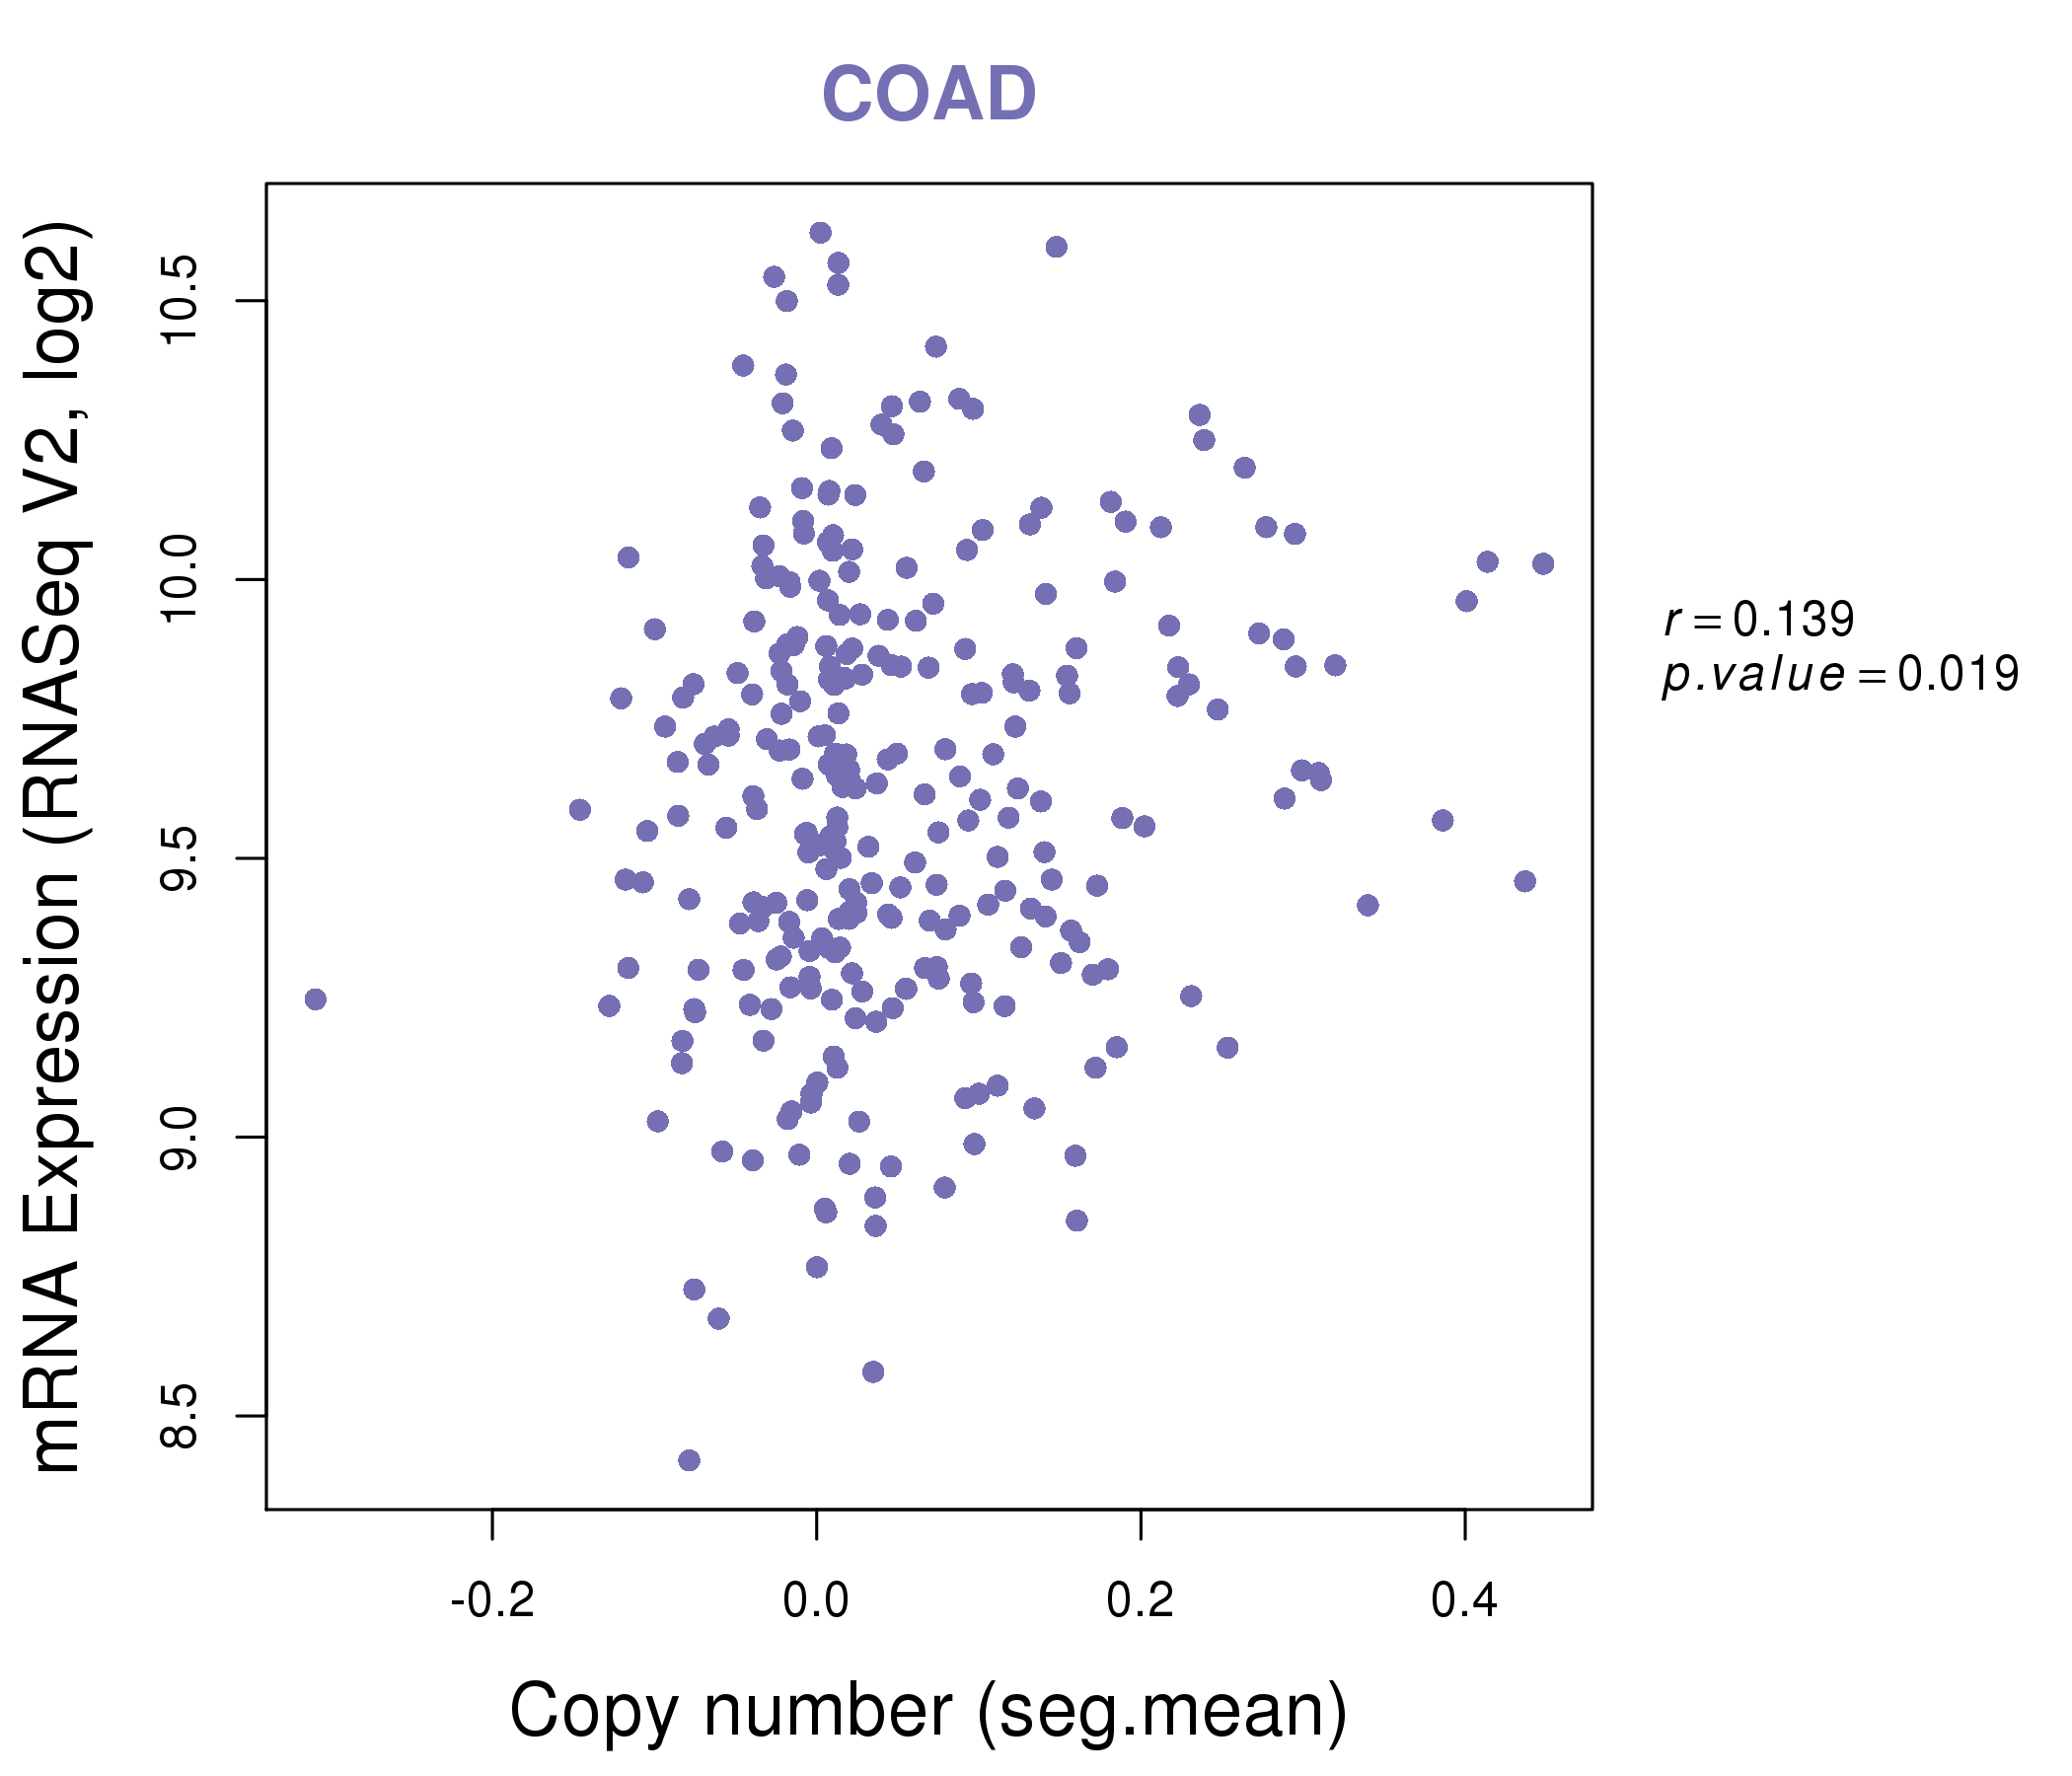
| * Copy number data were extracted from TCGA using R package TCGA-Assembler. The URLs of all public data files on TCGA DCC data server were gathered on Jan-05-2015. Function ProcessCNAData in TCGA-Assembler package was used to obtain gene-level copy number value which is calculated as the average copy number of the genomic region of a gene. |
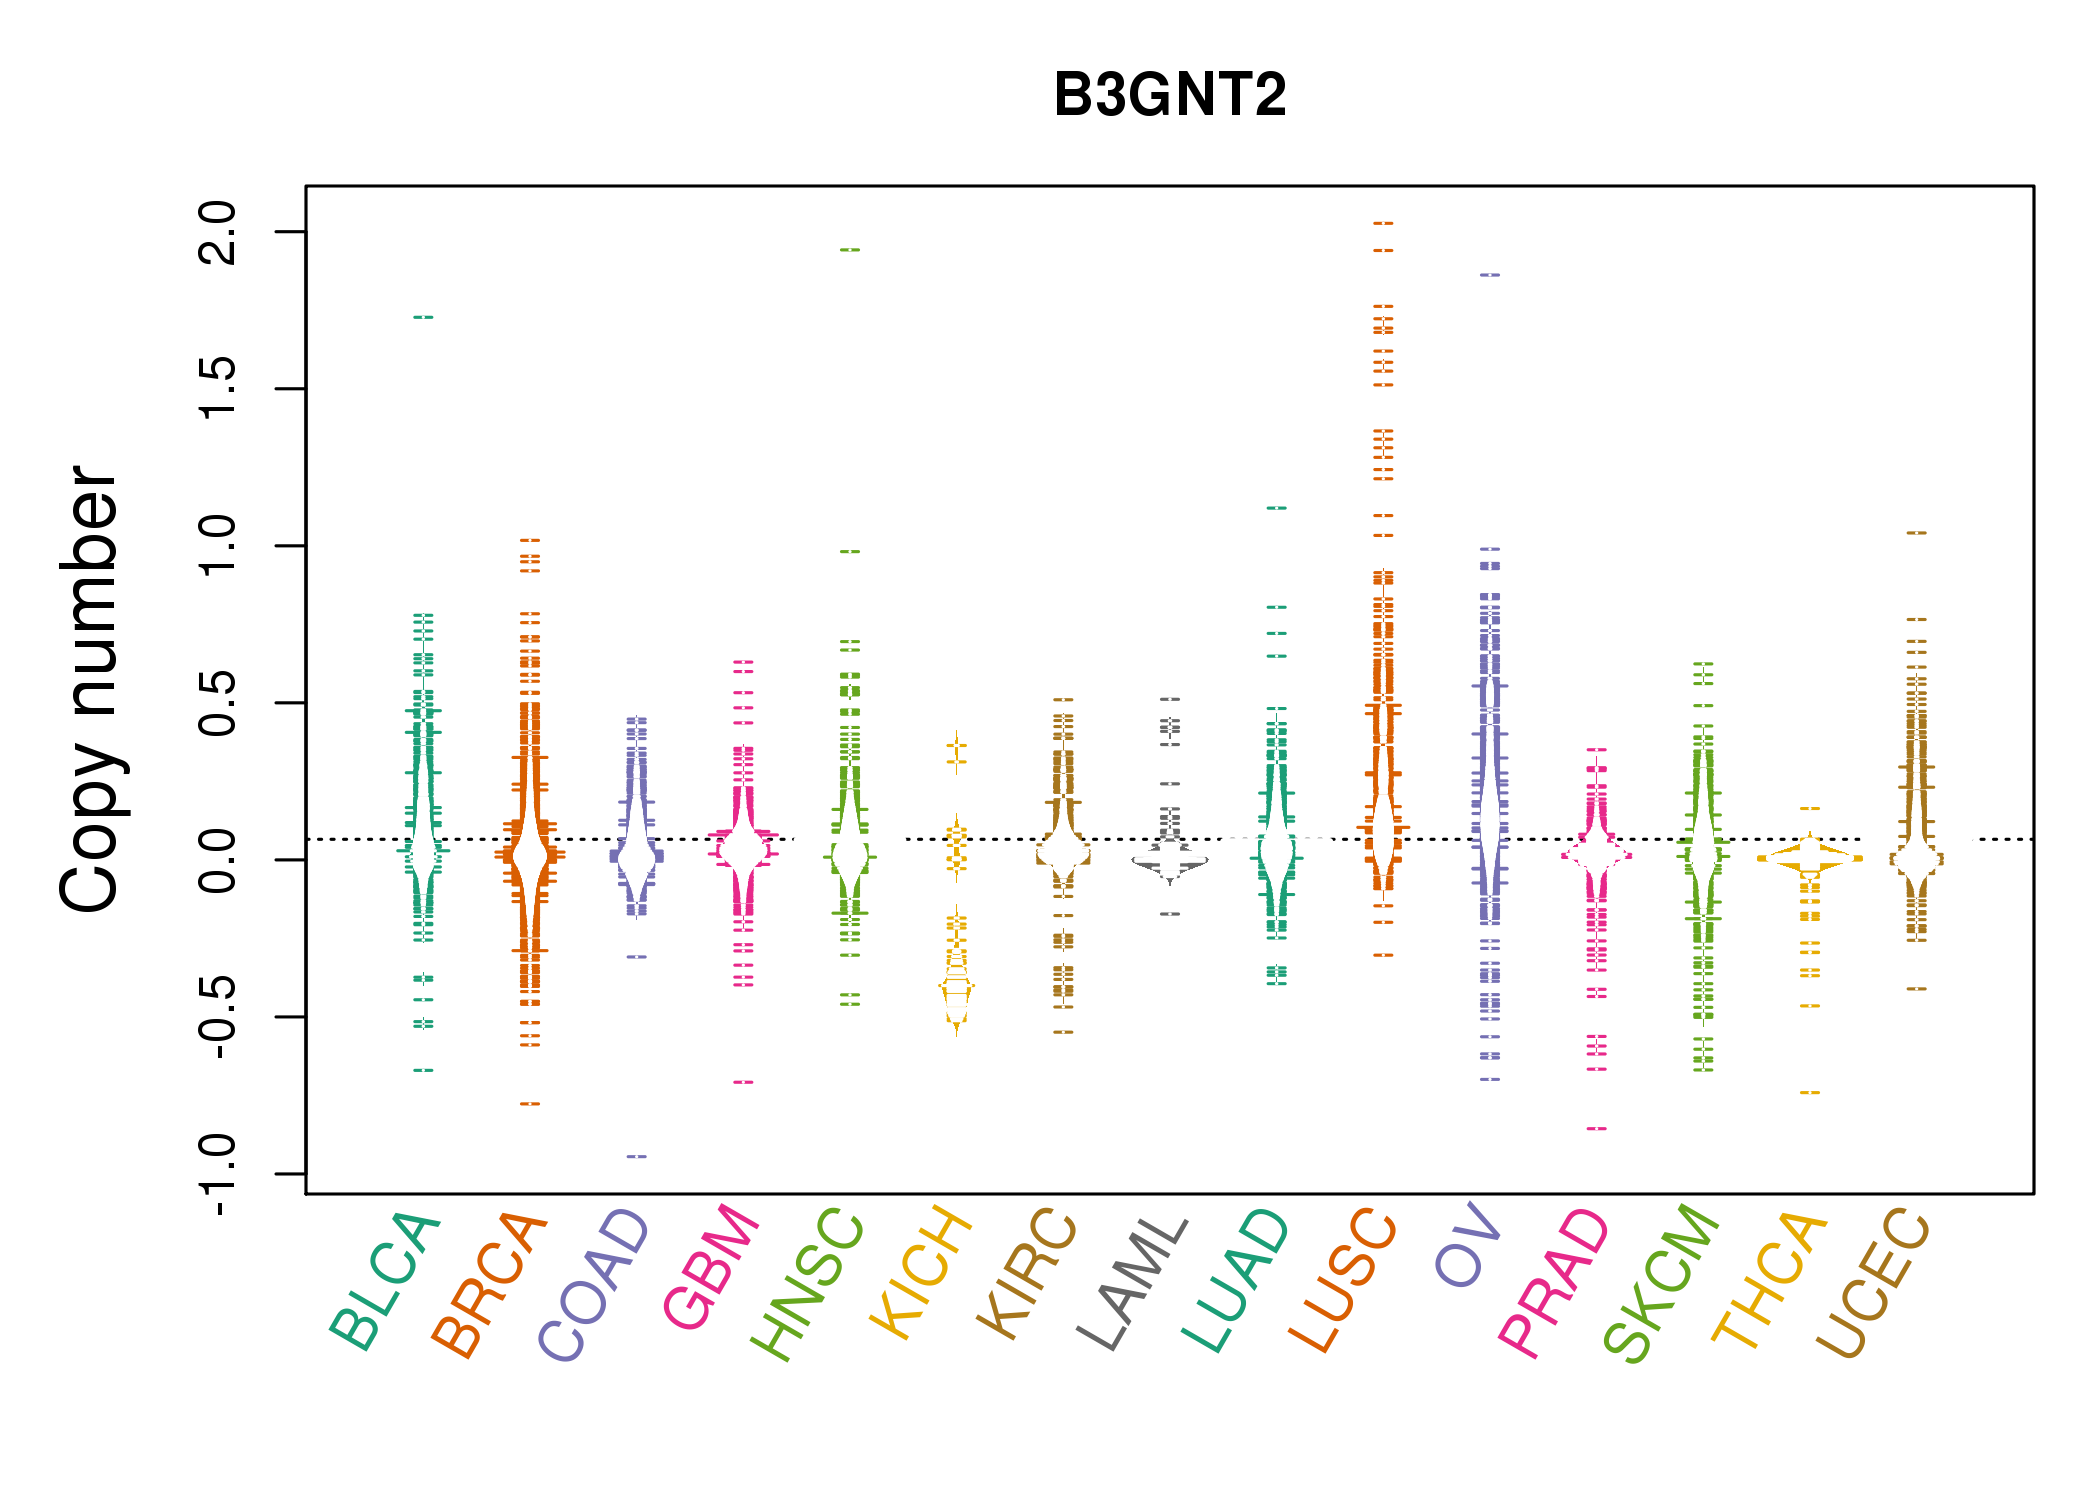 |
| cf) Tissue ID[Tissue type]: BLCA[Bladder Urothelial Carcinoma], BRCA[Breast invasive carcinoma], CESC[Cervical squamous cell carcinoma and endocervical adenocarcinoma], COAD[Colon adenocarcinoma], GBM[Glioblastoma multiforme], Glioma Low Grade, HNSC[Head and Neck squamous cell carcinoma], KICH[Kidney Chromophobe], KIRC[Kidney renal clear cell carcinoma], KIRP[Kidney renal papillary cell carcinoma], LAML[Acute Myeloid Leukemia], LUAD[Lung adenocarcinoma], LUSC[Lung squamous cell carcinoma], OV[Ovarian serous cystadenocarcinoma ], PAAD[Pancreatic adenocarcinoma], PRAD[Prostate adenocarcinoma], SKCM[Skin Cutaneous Melanoma], STAD[Stomach adenocarcinoma], THCA[Thyroid carcinoma], UCEC[Uterine Corpus Endometrial Carcinoma] |
| Top |
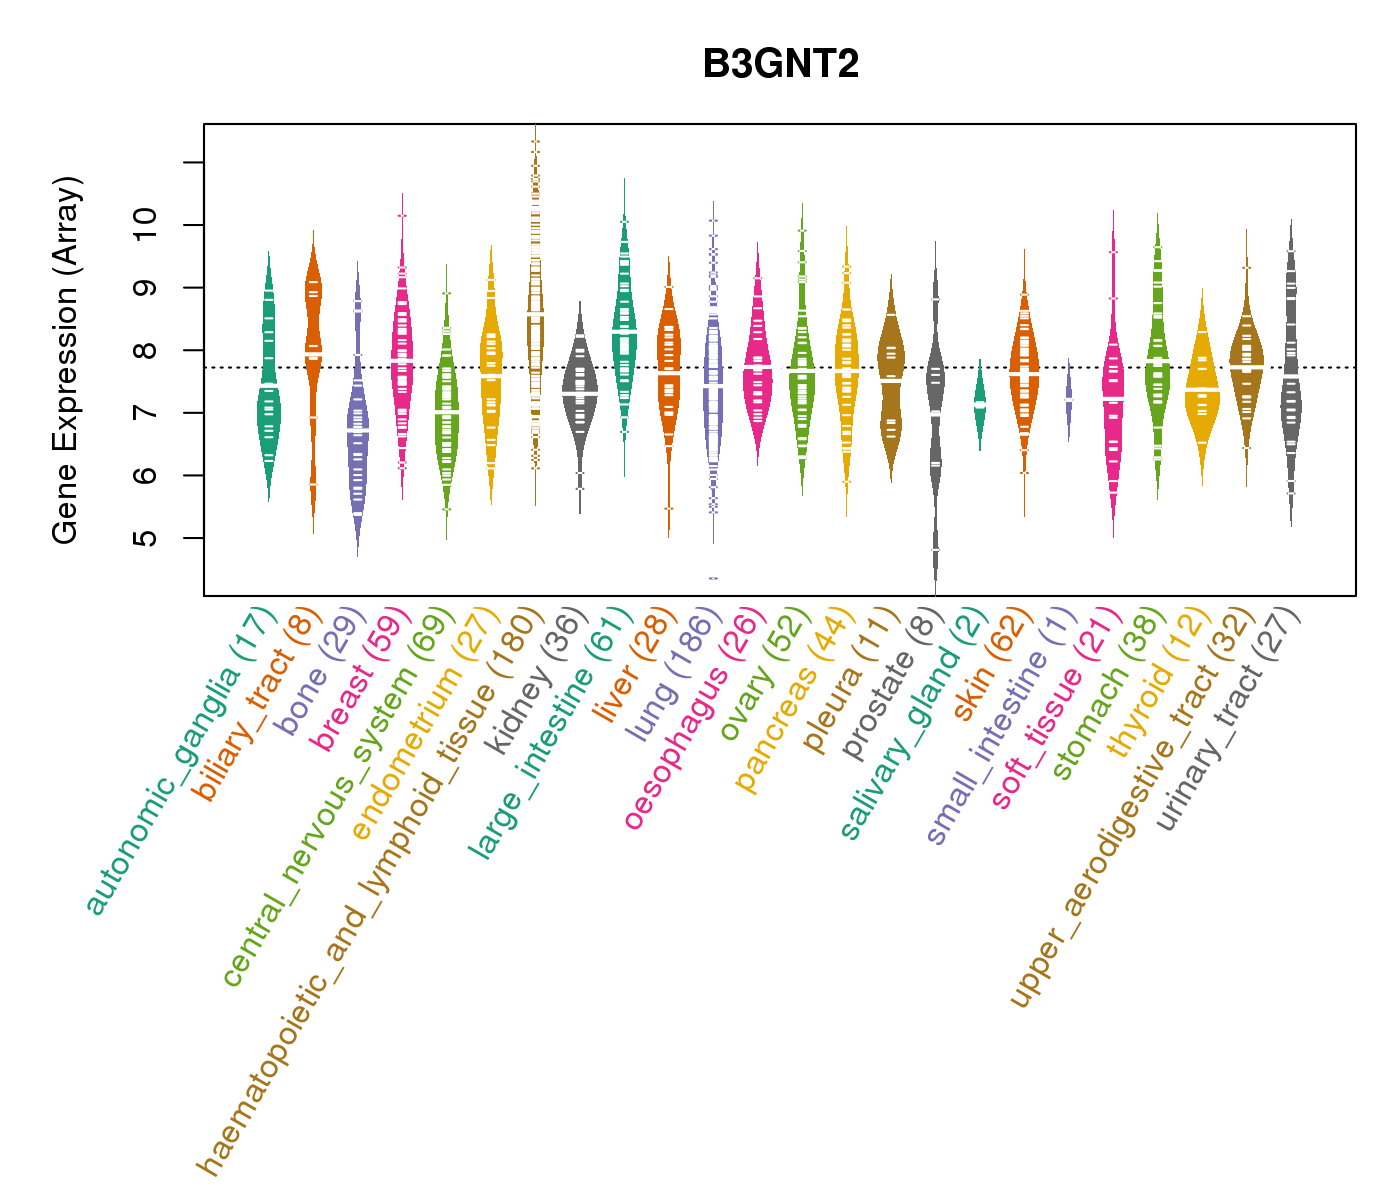
| Gene Expression for B3GNT2 |
| * CCLE gene expression data were extracted from CCLE_Expression_Entrez_2012-10-18.res: Gene-centric RMA-normalized mRNA expression data. |
 |
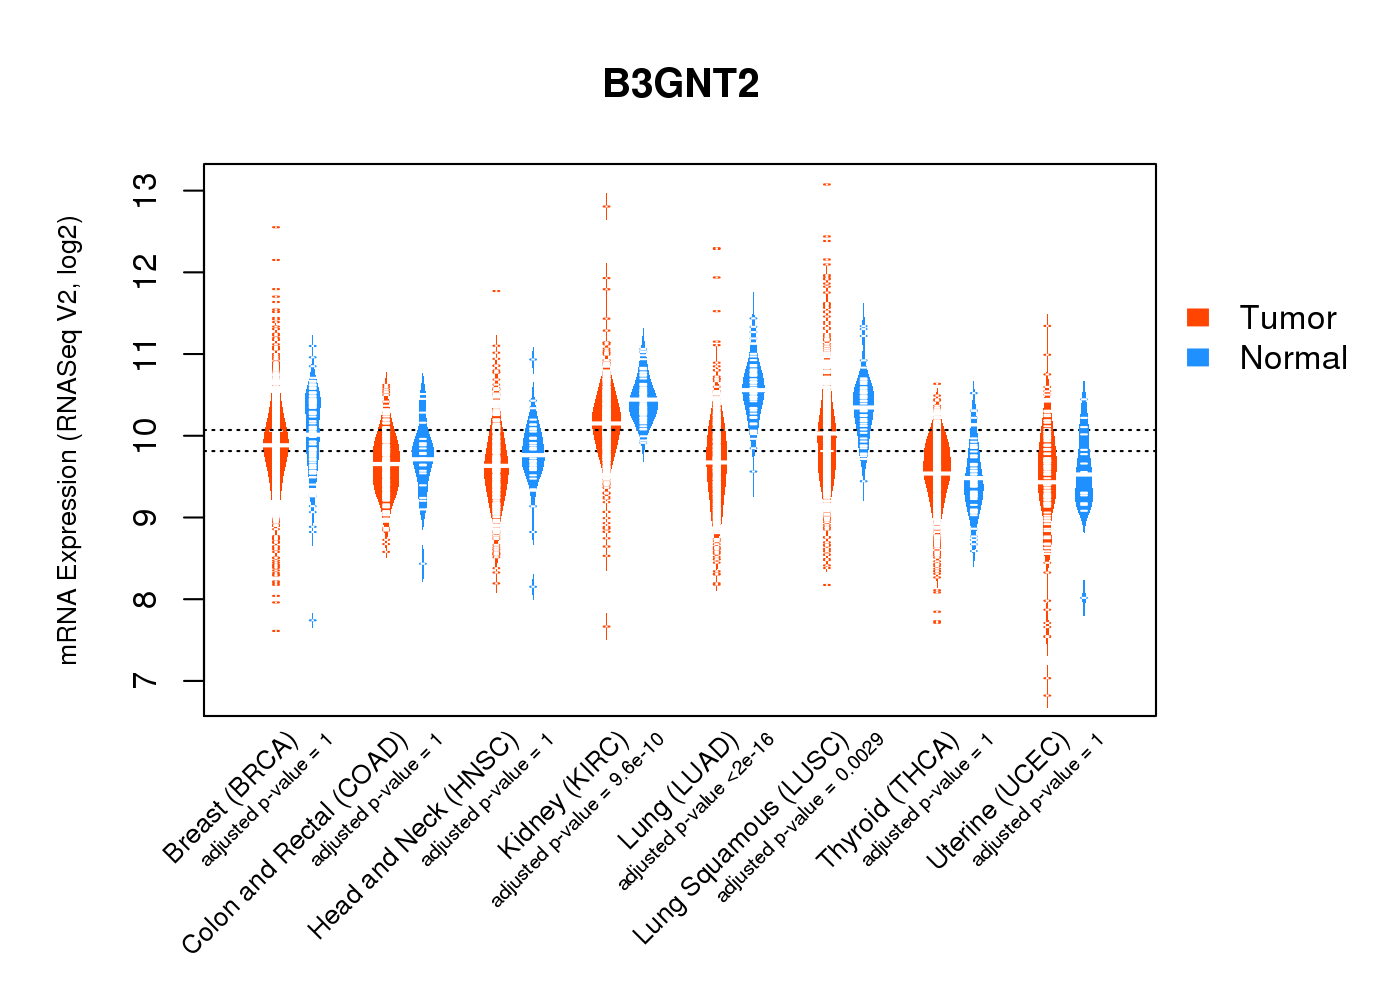
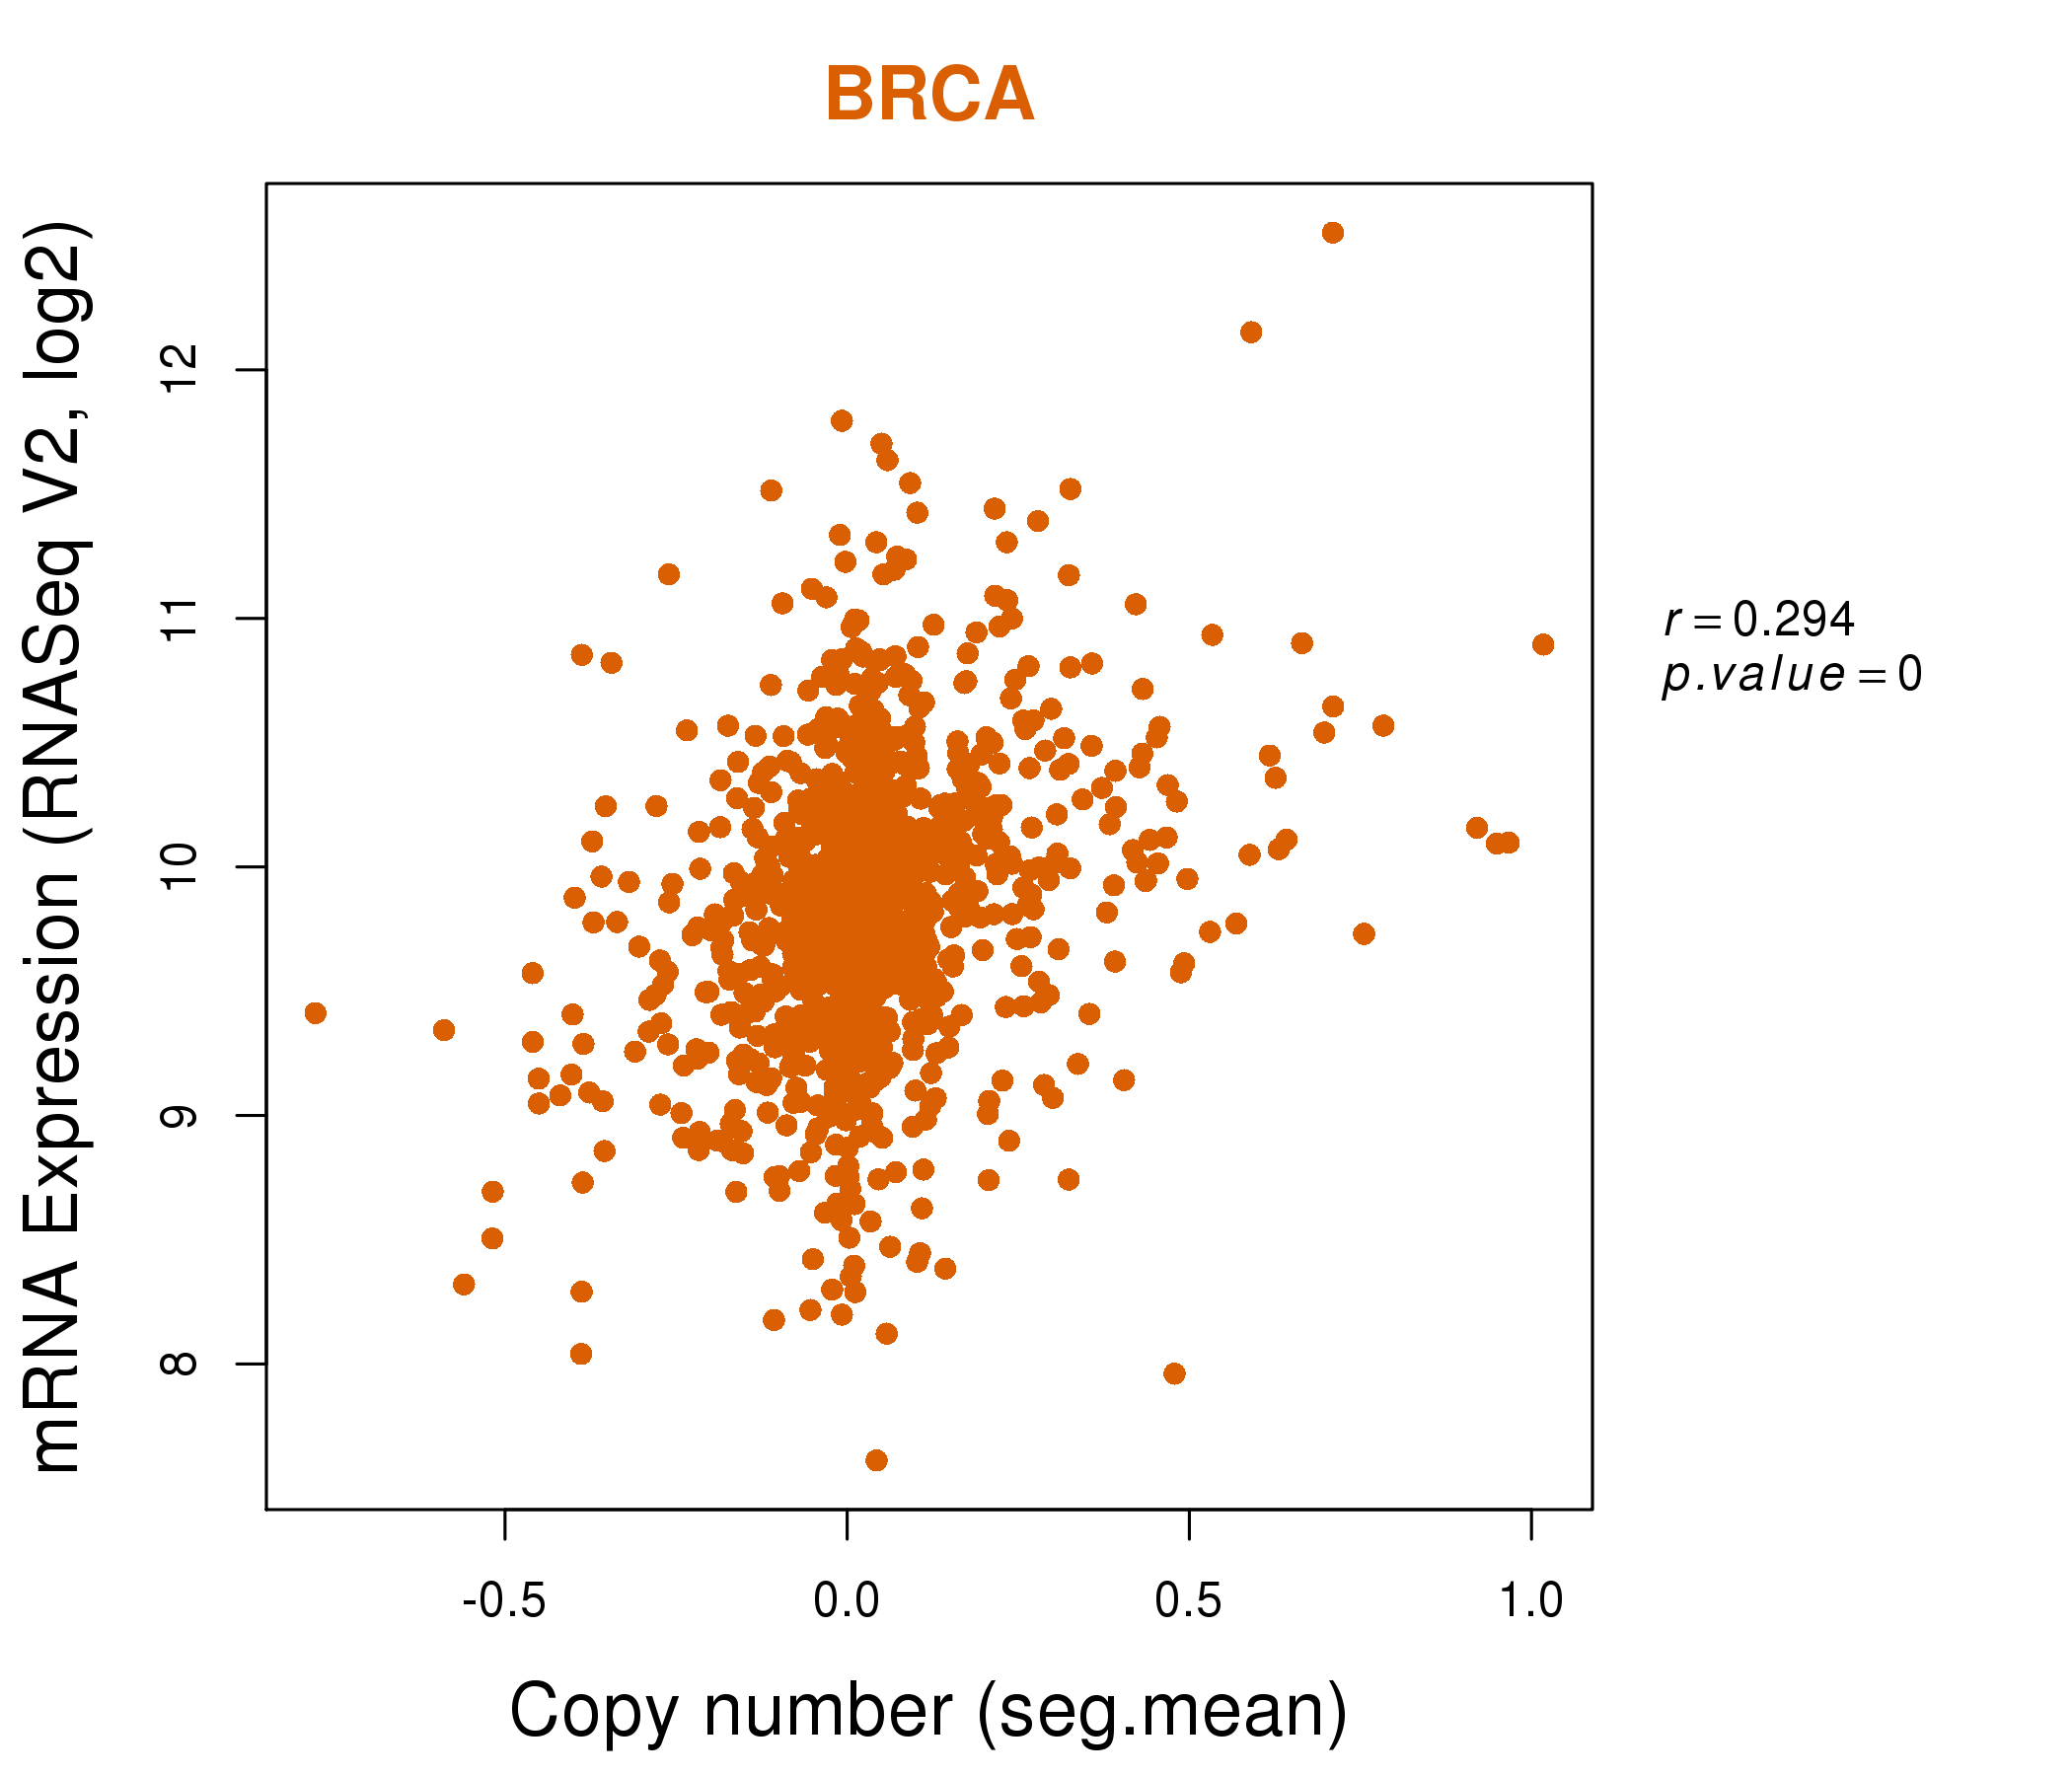
| * Normalized gene expression data of RNASeqV2 was extracted from TCGA using R package TCGA-Assembler. The URLs of all public data files on TCGA DCC data server were gathered at Jan-05-2015. Only eight cancer types have enough normal control samples for differential expression analysis. (t test, adjusted p<0.05 (using Benjamini-Hochberg FDR)) |
 |
| Top |
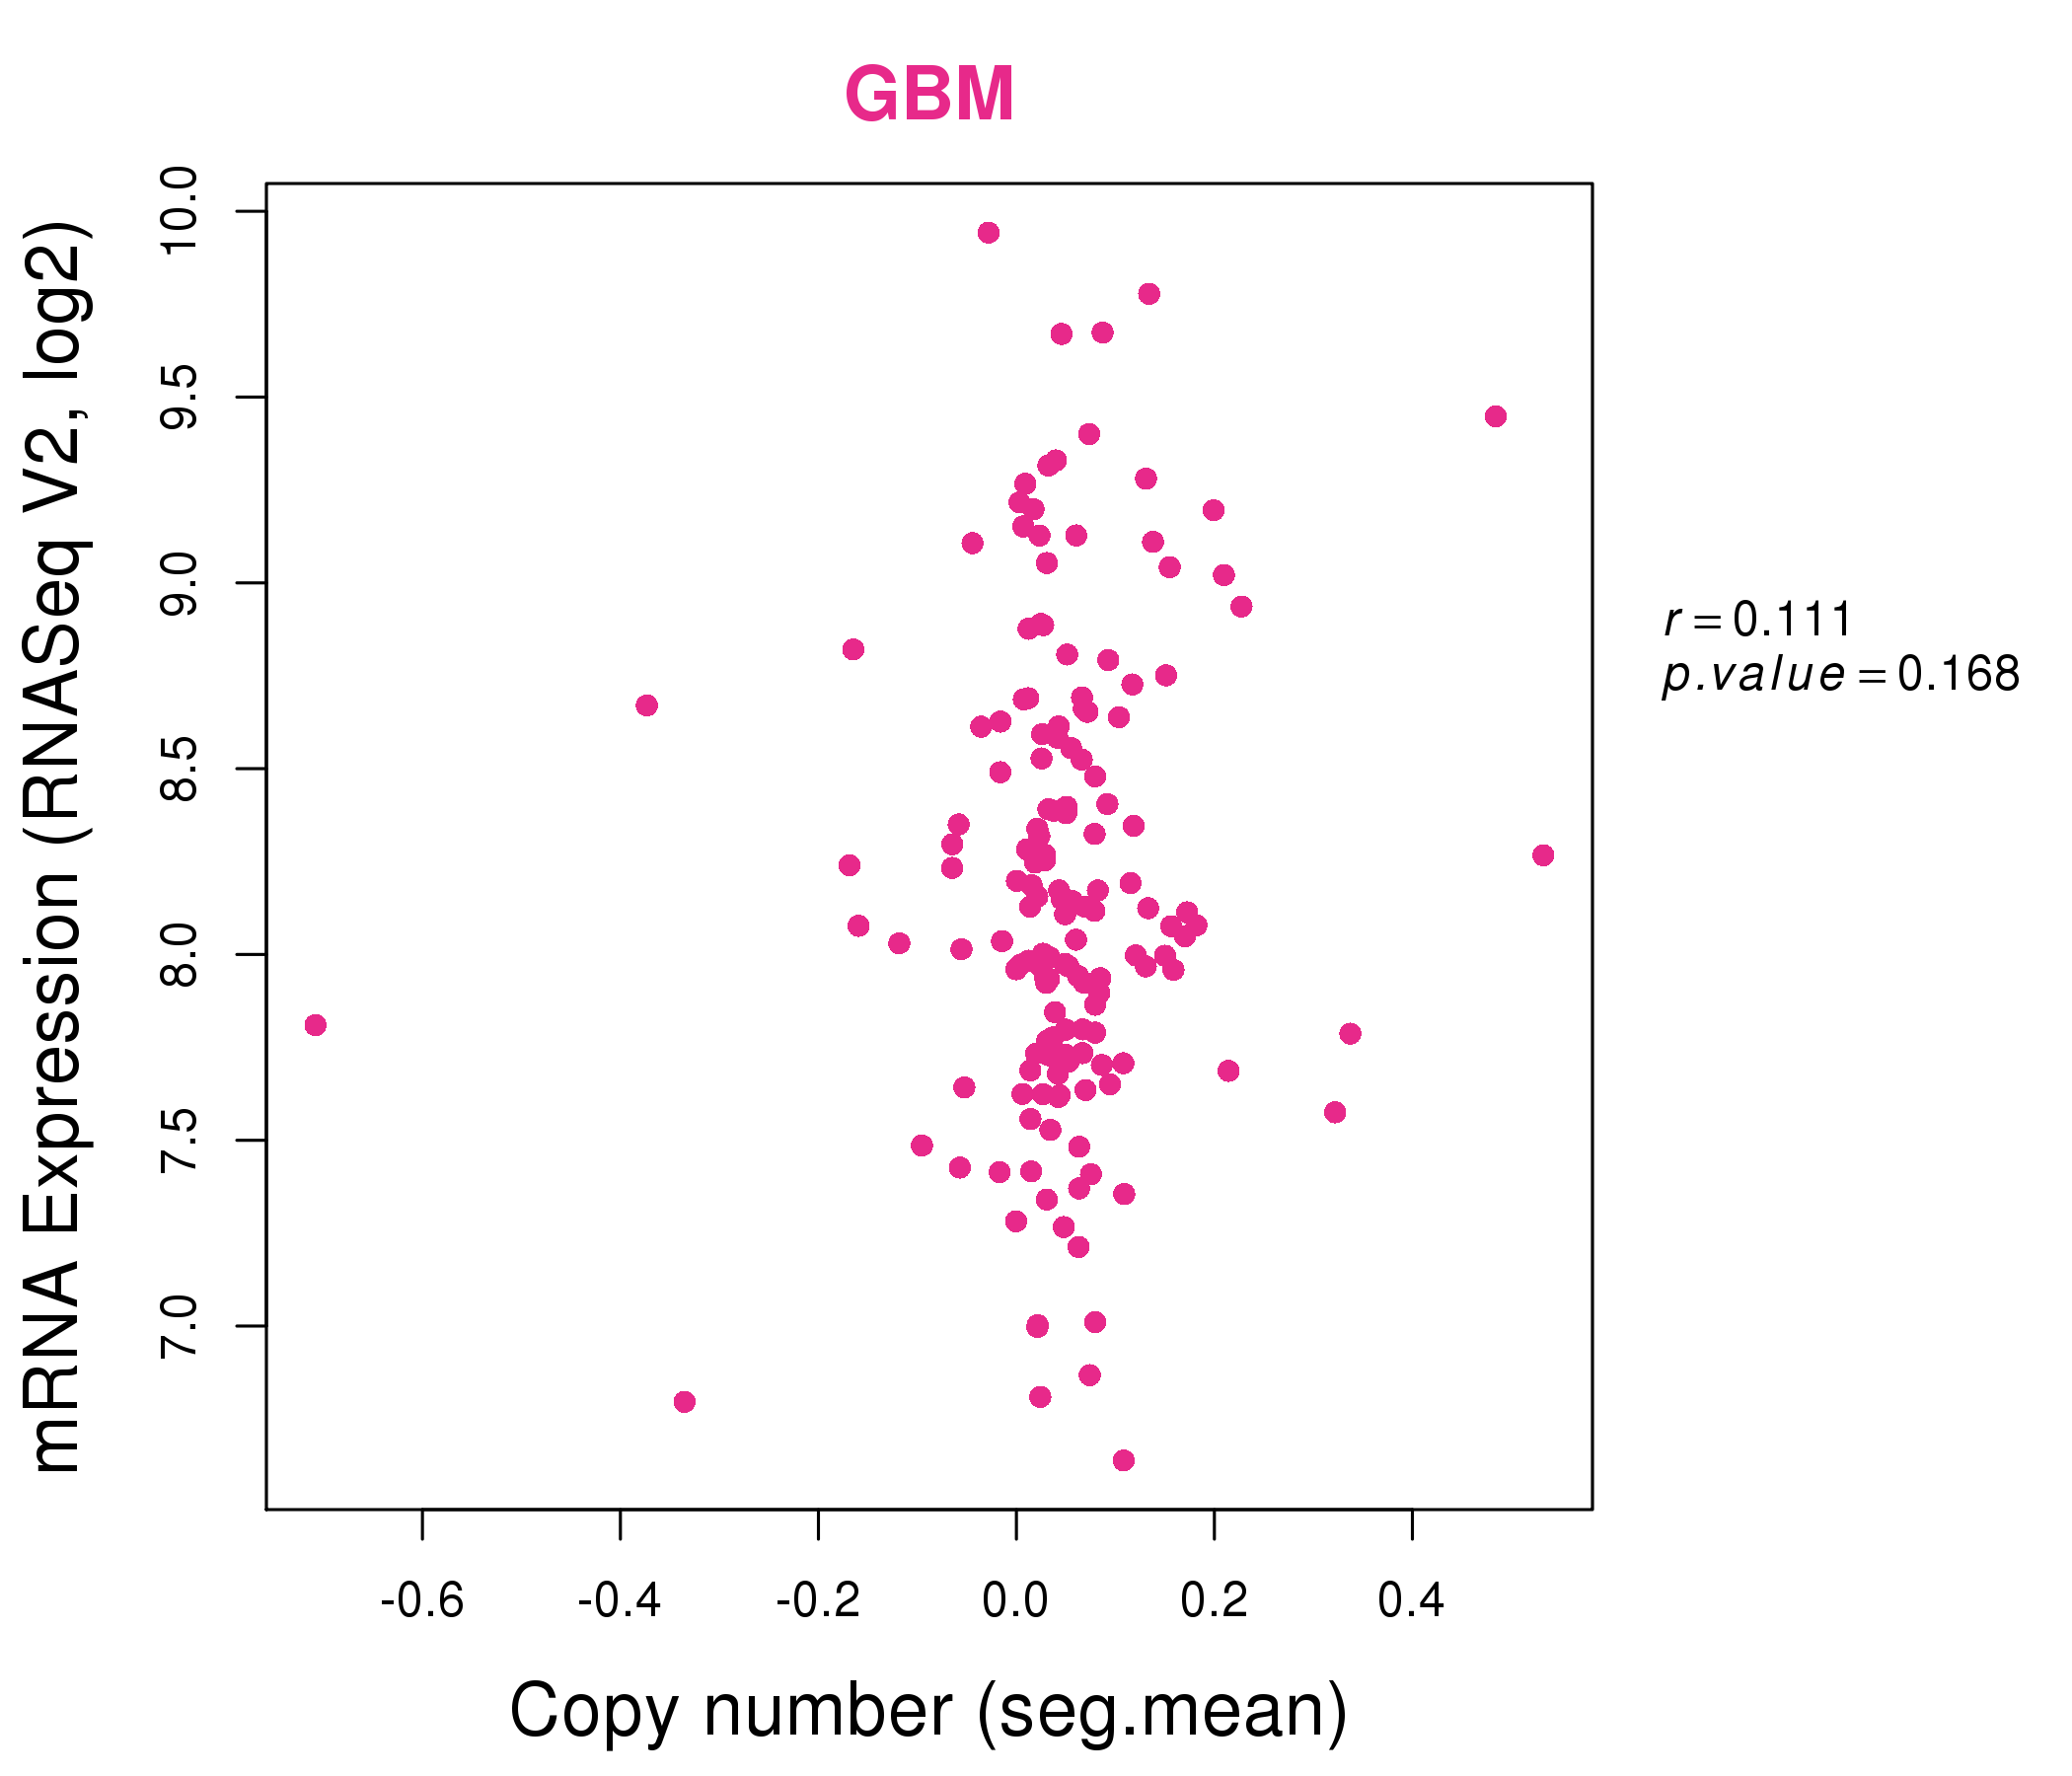
| * This plots show the correlation between CNV and gene expression. |
: Open all plots for all cancer types
 |
|
 |
|
| Top |
| Gene-Gene Network Information |
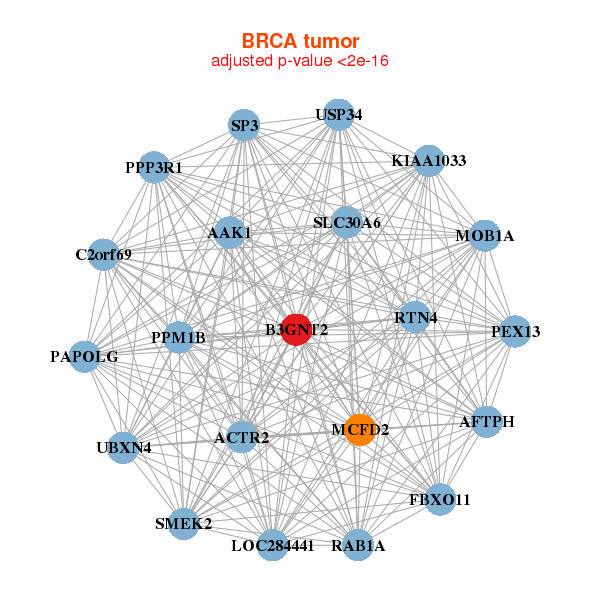
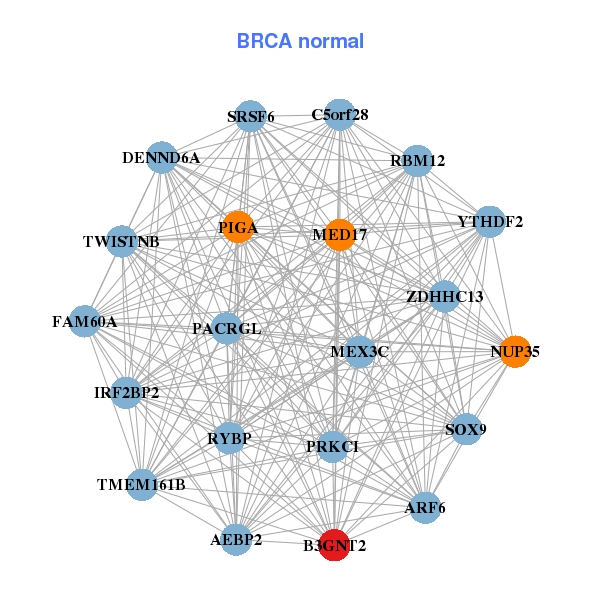
| * Co-Expression network figures were drawn using R package igraph. Only the top 20 genes with the highest correlations were shown. Red circle: input gene, orange circle: cell metabolism gene, sky circle: other gene |
: Open all plots for all cancer types
 |
|
| AAK1,ACTR2,AFTPH,B3GNT2,C2orf69,FBXO11,KIAA1033, LOC284441,MCFD2,MOB1A,PAPOLG,PEX13,PPM1B,PPP3R1, RAB1A,RTN4,SLC30A6,SMEK2,SP3,UBXN4,USP34 | AEBP2,ARF6,B3GNT2,C5orf28,DENND6A,FAM60A,IRF2BP2, MED17,MEX3C,NUP35,PACRGL,PIGA,PRKCI,RBM12, RYBP,SRSF6,SOX9,TMEM161B,TWISTNB,YTHDF2,ZDHHC13 |
 |
|
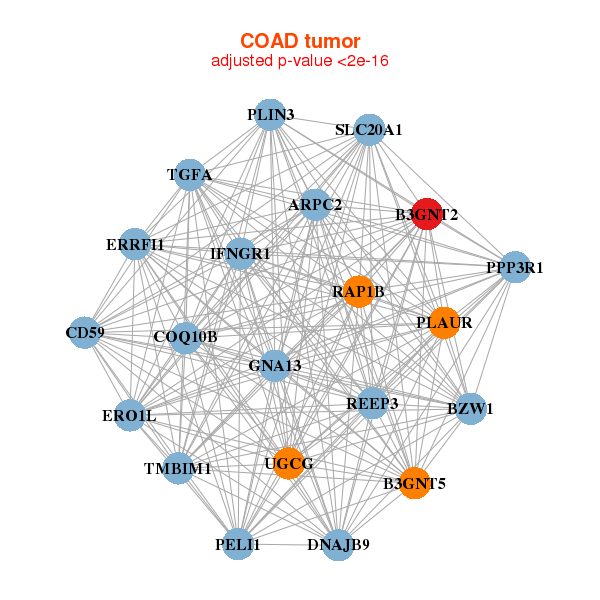
| ARPC2,B3GNT2,B3GNT5,BZW1,CD59,COQ10B,DNAJB9, ERO1L,ERRFI1,GNA13,IFNGR1,PELI1,PLAUR,PLIN3, PPP3R1,RAP1B,REEP3,SLC20A1,TGFA,TMBIM1,UGCG | AMACR,ATP1B3,B3GNT2,C12orf75,CYB5B,DHX32,EPS8, FKBP1A,LNX2,LOC100130933,MINPP1,NCEH1,NUDT4,PIP5K1B, RNF138,SLC17A5,STYK1,TMCO1,TSPAN1,TSPAN3,VAPA |
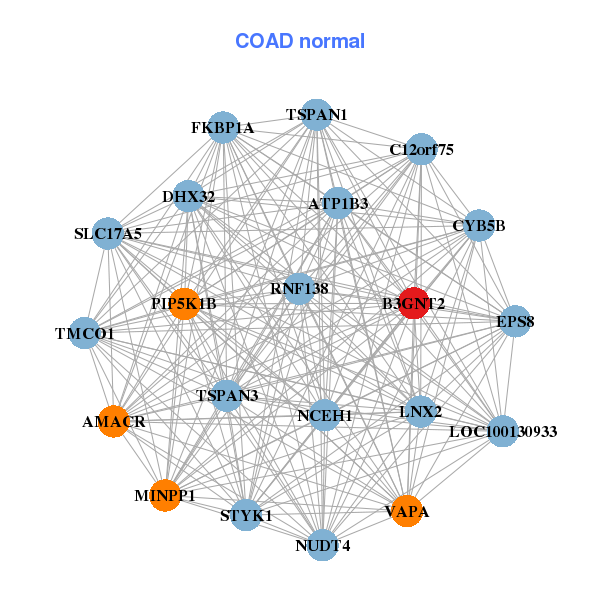
| * Co-Expression network figures were drawn using R package igraph. Only the top 20 genes with the highest correlations were shown. Red circle: input gene, orange circle: cell metabolism gene, sky circle: other gene |
: Open all plots for all cancer types
| Top |
: Open all interacting genes' information including KEGG pathway for all interacting genes from DAVID
| Top |
| Pharmacological Information for B3GNT2 |
| There's no related Drug. |
| Top |
| Cross referenced IDs for B3GNT2 |
| * We obtained these cross-references from Uniprot database. It covers 150 different DBs, 18 categories. http://www.uniprot.org/help/cross_references_section |
: Open all cross reference information
|
Copyright © 2016-Present - The Univsersity of Texas Health Science Center at Houston @ |