|
||||||||||||||||||||
| |
| Phenotypic Information (metabolism pathway, cancer, disease, phenome) |
| |
| |
| Gene-Gene Network Information: Co-Expression Network, Interacting Genes & KEGG |
| |
|


| Gene Summary for EBP |
| Basic gene info. | Gene symbol | EBP |
| Gene name | emopamil binding protein (sterol isomerase) | |
| Synonyms | CDPX2|CHO2|CPX|CPXD | |
| Cytomap | UCSC genome browser: Xp11.23-p11.22 | |
| Genomic location | chrX :48380163-48387104 | |
| Type of gene | protein-coding | |
| RefGenes | NM_006579.2, | |
| Ensembl id | ENSG00000268394 | |
| Description | 3-beta-hydroxysteroid-Delta(8),Delta(7)-isomerase3-beta-hydroxysteroid-delta-8,delta-7-isomeraseChondrodysplasia punctata-2, X-linked dominant (Happle syndrome)D8-D7 sterol isomerasecholestenol Delta-isomerasedelta(8)-Delta(7) sterol isomeraseemopam | |
| Modification date | 20141222 | |
| dbXrefs | MIM : 300205 | |
| HGNC : HGNC | ||
| HPRD : 02192 | ||
| Protein | UniProt: go to UniProt's Cross Reference DB Table | |
| Expression | CleanEX: HS_EBP | |
| BioGPS: 10682 | ||
| Gene Expression Atlas: ENSG00000268394 | ||
| The Human Protein Atlas: ENSG00000268394 | ||
| Pathway | NCI Pathway Interaction Database: EBP | |
| KEGG: EBP | ||
| REACTOME: EBP | ||
| ConsensusPathDB | ||
| Pathway Commons: EBP | ||
| Metabolism | MetaCyc: EBP | |
| HUMANCyc: EBP | ||
| Regulation | Ensembl's Regulation: ENSG00000268394 | |
| miRBase: chrX :48,380,163-48,387,104 | ||
| TargetScan: NM_006579 | ||
| cisRED: ENSG00000268394 | ||
| Context | iHOP: EBP | |
| cancer metabolism search in PubMed: EBP | ||
| UCL Cancer Institute: EBP | ||
| Assigned class in ccmGDB | C | |
| Top |
| Phenotypic Information for EBP(metabolism pathway, cancer, disease, phenome) |
| Cancer | CGAP: EBP |
| Familial Cancer Database: EBP | |
| * This gene is included in those cancer gene databases. |
|
|
|
|
|
| . | ||||||||||||||
Oncogene 1 | Significant driver gene in | |||||||||||||||||||
| cf) number; DB name 1 Oncogene; http://nar.oxfordjournals.org/content/35/suppl_1/D721.long, 2 Tumor Suppressor gene; https://bioinfo.uth.edu/TSGene/, 3 Cancer Gene Census; http://www.nature.com/nrc/journal/v4/n3/abs/nrc1299.html, 4 CancerGenes; http://nar.oxfordjournals.org/content/35/suppl_1/D721.long, 5 Network of Cancer Gene; http://ncg.kcl.ac.uk/index.php, 1Therapeutic Vulnerabilities in Cancer; http://cbio.mskcc.org/cancergenomics/statius/ |
| REACTOME_METABOLISM_OF_LIPIDS_AND_LIPOPROTEINS | |
| OMIM | |
| Orphanet | |
| Disease | KEGG Disease: EBP |
| MedGen: EBP (Human Medical Genetics with Condition) | |
| ClinVar: EBP | |
| Phenotype | MGI: EBP (International Mouse Phenotyping Consortium) |
| PhenomicDB: EBP | |
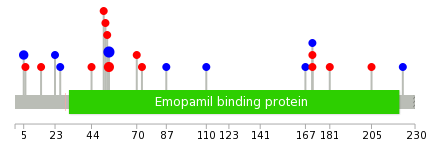
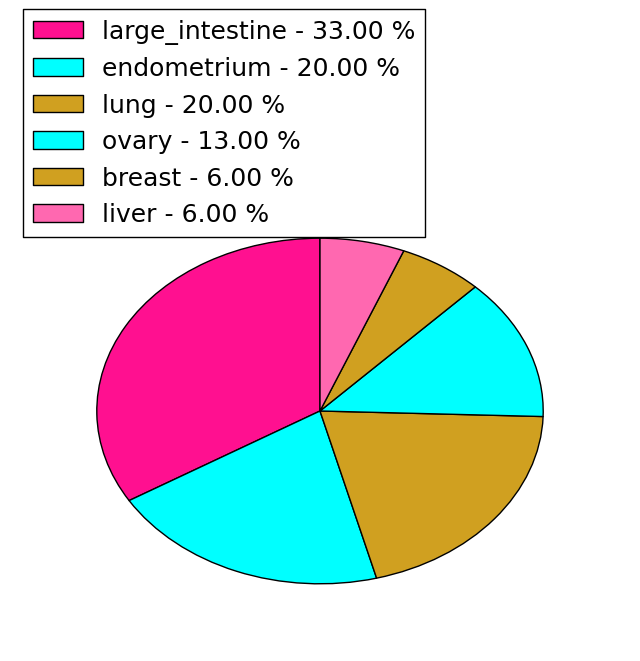
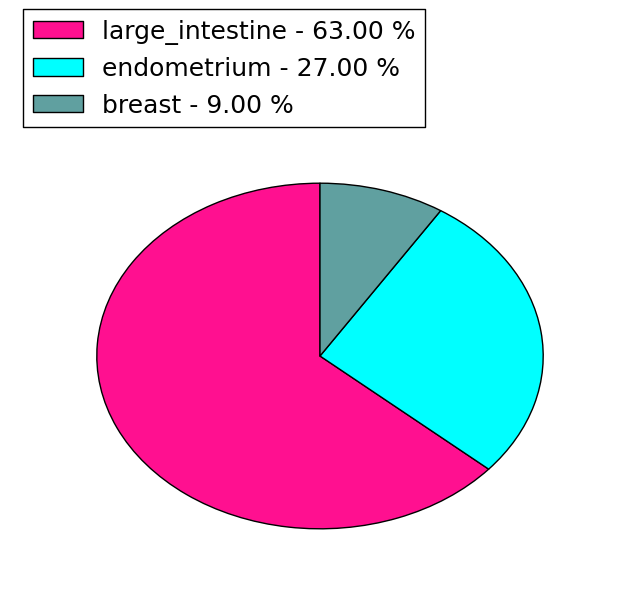
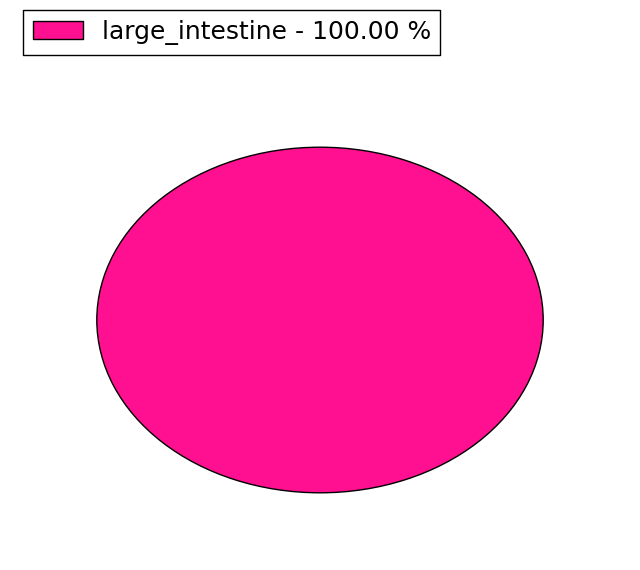
| Mutations for EBP |
| * Under tables are showing count per each tissue to give us broad intuition about tissue specific mutation patterns.You can go to the detailed page for each mutation database's web site. |
| There's no structural variation information in COSMIC data for this gene. |
| * From mRNA Sanger sequences, Chitars2.0 arranged chimeric transcripts. This table shows EBP related fusion information. |
| ID | Head Gene | Tail Gene | Accession | Gene_a | qStart_a | qEnd_a | Chromosome_a | tStart_a | tEnd_a | Gene_a | qStart_a | qEnd_a | Chromosome_a | tStart_a | tEnd_a |
| Top |
| There's no copy number variation information in COSMIC data for this gene. |
| Top |
|
 |
| Top |
| Stat. for Non-Synonymous SNVs (# total SNVs=15) | (# total SNVs=11) |
 |  |
(# total SNVs=1) | (# total SNVs=0) |
 |
| Top |
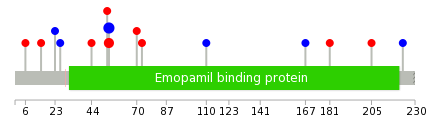
| * When you move the cursor on each content, you can see more deailed mutation information on the Tooltip. Those are primary_site,primary_histology,mutation(aa),pubmedID. |
| GRCh37 position | Mutation(aa) | Unique sampleID count |
| chr23:48382321-48382321 | p.A54A | 5 |
| chr23:48382320-48382320 | p.A54V | 3 |
| chr23:48382174-48382174 | p.A5A | 2 |
| chr23:48386663-48386663 | p.R171C | 2 |
| chr23:48382367-48382367 | p.A70S | 1 |
| chr23:48386709-48386709 | p.W186* | 1 |
| chr23:48382176-48382176 | p.G6V | 1 |
| chr23:48382377-48382377 | p.G73V | 1 |
| chr23:48386765-48386765 | p.L205F | 1 |
| chr23:48382202-48382202 | p.H15Y | 1 |
| Top |
|
 |
| Point Mutation/ Tissue ID | 1 | 2 | 3 | 4 | 5 | 6 | 7 | 8 | 9 | 10 | 11 | 12 | 13 | 14 | 15 | 16 | 17 | 18 | 19 | 20 |
| # sample | 2 | 10 | 1 | 2 | 1 | 5 | ||||||||||||||
| # mutation | 2 | 5 | 1 | 2 | 1 | 5 | ||||||||||||||
| nonsynonymous SNV | 1 | 3 | 1 | 2 | 1 | 2 | ||||||||||||||
| synonymous SNV | 1 | 2 | 3 |
| cf) Tissue ID; Tissue type (1; BLCA[Bladder Urothelial Carcinoma], 2; BRCA[Breast invasive carcinoma], 3; CESC[Cervical squamous cell carcinoma and endocervical adenocarcinoma], 4; COAD[Colon adenocarcinoma], 5; GBM[Glioblastoma multiforme], 6; Glioma Low Grade, 7; HNSC[Head and Neck squamous cell carcinoma], 8; KICH[Kidney Chromophobe], 9; KIRC[Kidney renal clear cell carcinoma], 10; KIRP[Kidney renal papillary cell carcinoma], 11; LAML[Acute Myeloid Leukemia], 12; LUAD[Lung adenocarcinoma], 13; LUSC[Lung squamous cell carcinoma], 14; OV[Ovarian serous cystadenocarcinoma ], 15; PAAD[Pancreatic adenocarcinoma], 16; PRAD[Prostate adenocarcinoma], 17; SKCM[Skin Cutaneous Melanoma], 18:STAD[Stomach adenocarcinoma], 19:THCA[Thyroid carcinoma], 20:UCEC[Uterine Corpus Endometrial Carcinoma]) |
| Top |
| * We represented just top 10 SNVs. When you move the cursor on each content, you can see more deailed mutation information on the Tooltip. Those are primary_site, primary_histology, mutation(aa), pubmedID. |
| Genomic Position | Mutation(aa) | Unique sampleID count |
| chrX:48382321 | p.A54A | 5 |
| chrX:48382320 | p.A54V | 3 |
| chrX:48382176 | p.G6V | 1 |
| chrX:48386651 | p.H15Y | 1 |
| chrX:48382202 | p.P23P | 1 |
| chrX:48386694 | p.R26R | 1 |
| chrX:48382228 | p.V44M | 1 |
| chrX:48386765 | p.A53V | 1 |
| chrX:48382237 | p.A70S | 1 |
| chrX:48386821 | p.G73V | 1 |
| * Copy number data were extracted from TCGA using R package TCGA-Assembler. The URLs of all public data files on TCGA DCC data server were gathered on Jan-05-2015. Function ProcessCNAData in TCGA-Assembler package was used to obtain gene-level copy number value which is calculated as the average copy number of the genomic region of a gene. |
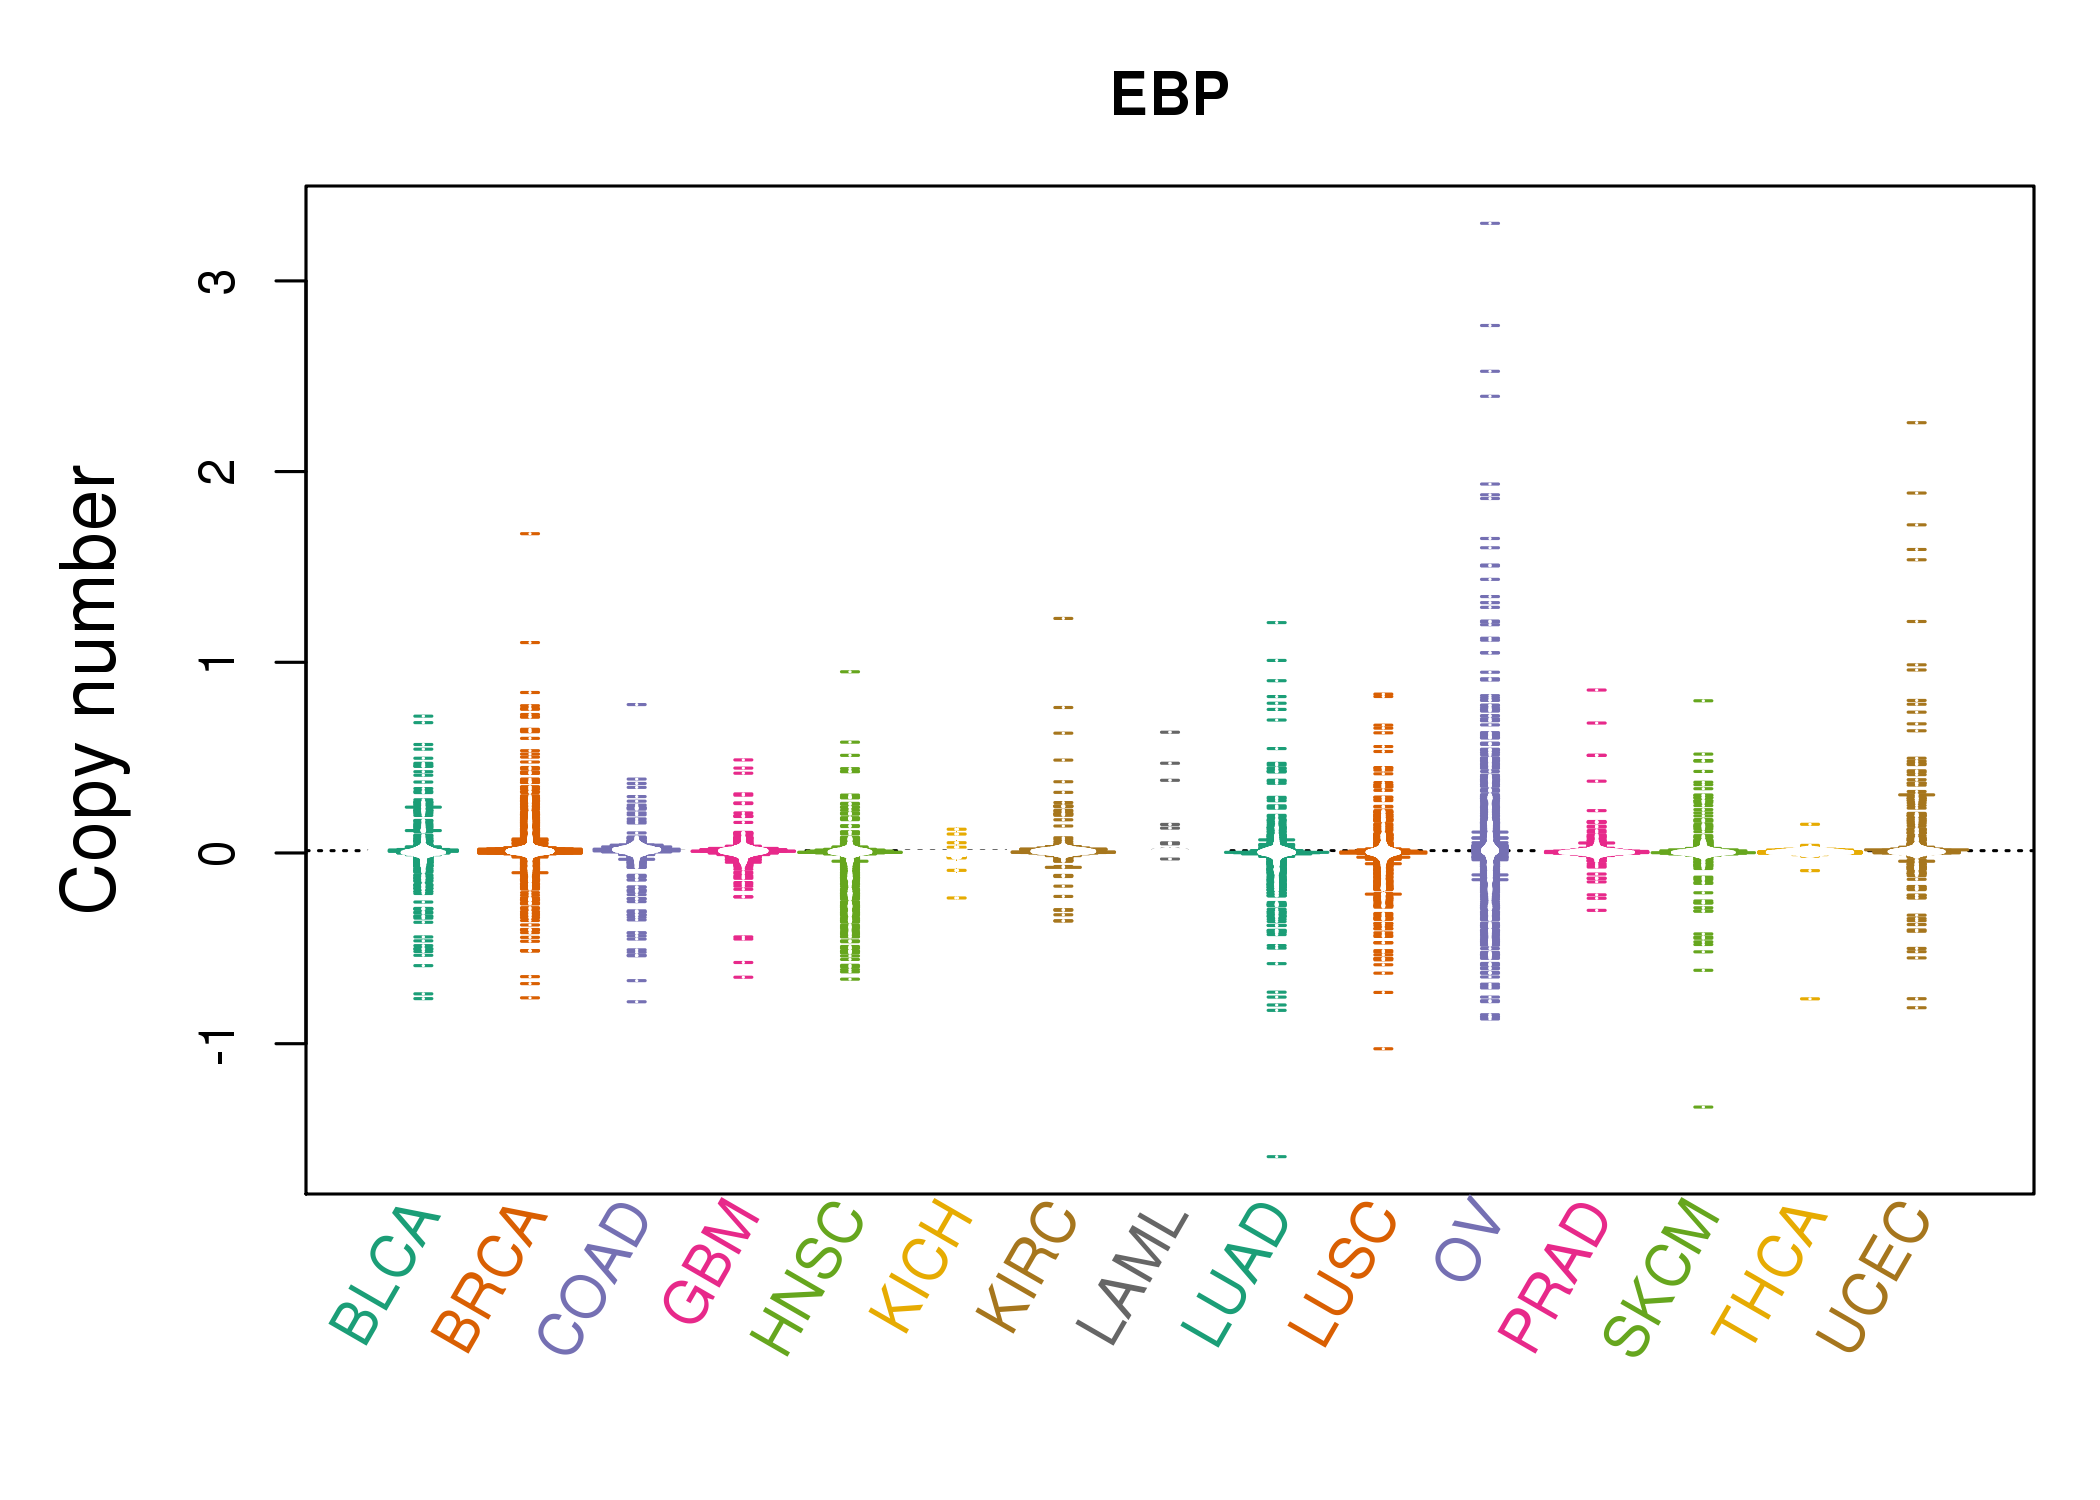 |
| cf) Tissue ID[Tissue type]: BLCA[Bladder Urothelial Carcinoma], BRCA[Breast invasive carcinoma], CESC[Cervical squamous cell carcinoma and endocervical adenocarcinoma], COAD[Colon adenocarcinoma], GBM[Glioblastoma multiforme], Glioma Low Grade, HNSC[Head and Neck squamous cell carcinoma], KICH[Kidney Chromophobe], KIRC[Kidney renal clear cell carcinoma], KIRP[Kidney renal papillary cell carcinoma], LAML[Acute Myeloid Leukemia], LUAD[Lung adenocarcinoma], LUSC[Lung squamous cell carcinoma], OV[Ovarian serous cystadenocarcinoma ], PAAD[Pancreatic adenocarcinoma], PRAD[Prostate adenocarcinoma], SKCM[Skin Cutaneous Melanoma], STAD[Stomach adenocarcinoma], THCA[Thyroid carcinoma], UCEC[Uterine Corpus Endometrial Carcinoma] |
| Top |
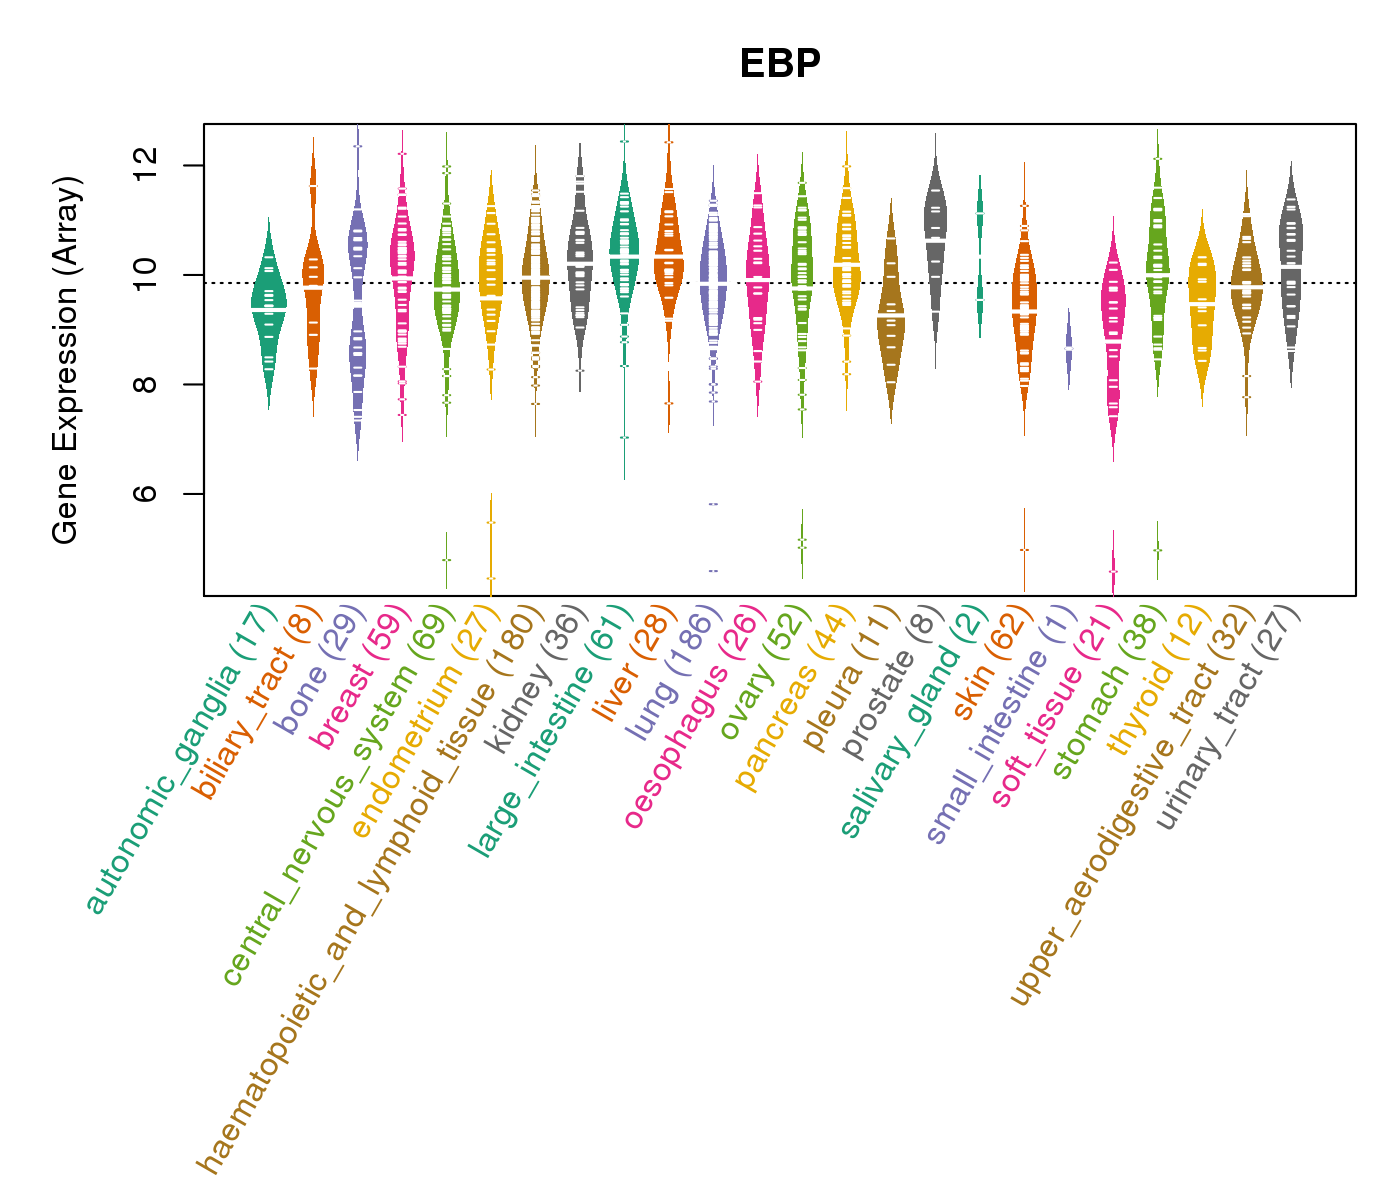
| Gene Expression for EBP |
| * CCLE gene expression data were extracted from CCLE_Expression_Entrez_2012-10-18.res: Gene-centric RMA-normalized mRNA expression data. |
 |
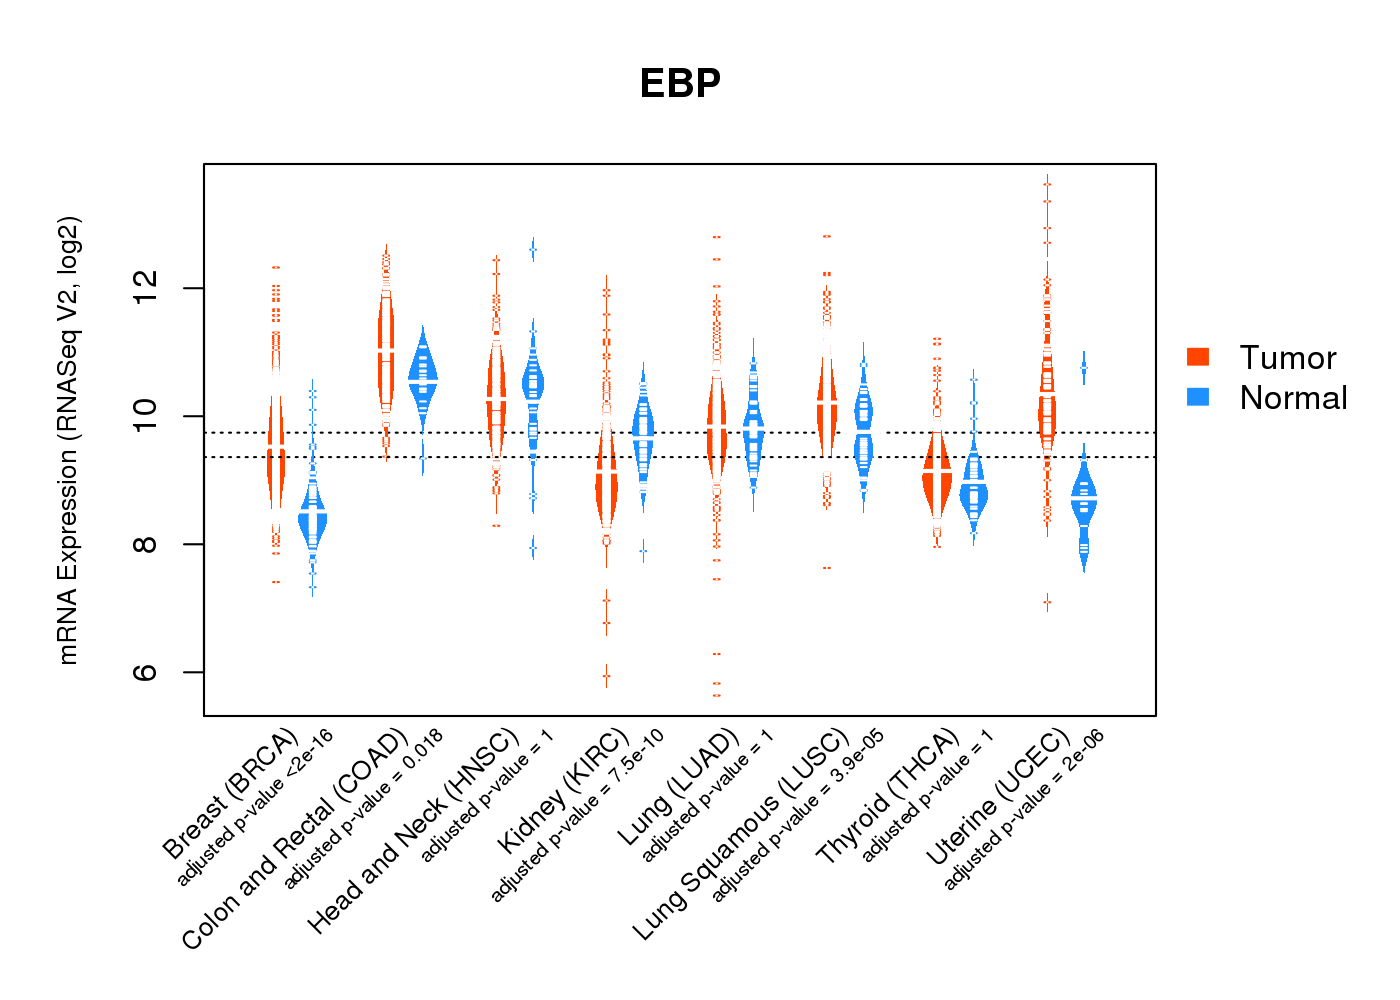
| * Normalized gene expression data of RNASeqV2 was extracted from TCGA using R package TCGA-Assembler. The URLs of all public data files on TCGA DCC data server were gathered at Jan-05-2015. Only eight cancer types have enough normal control samples for differential expression analysis. (t test, adjusted p<0.05 (using Benjamini-Hochberg FDR)) |
 |
| Top |
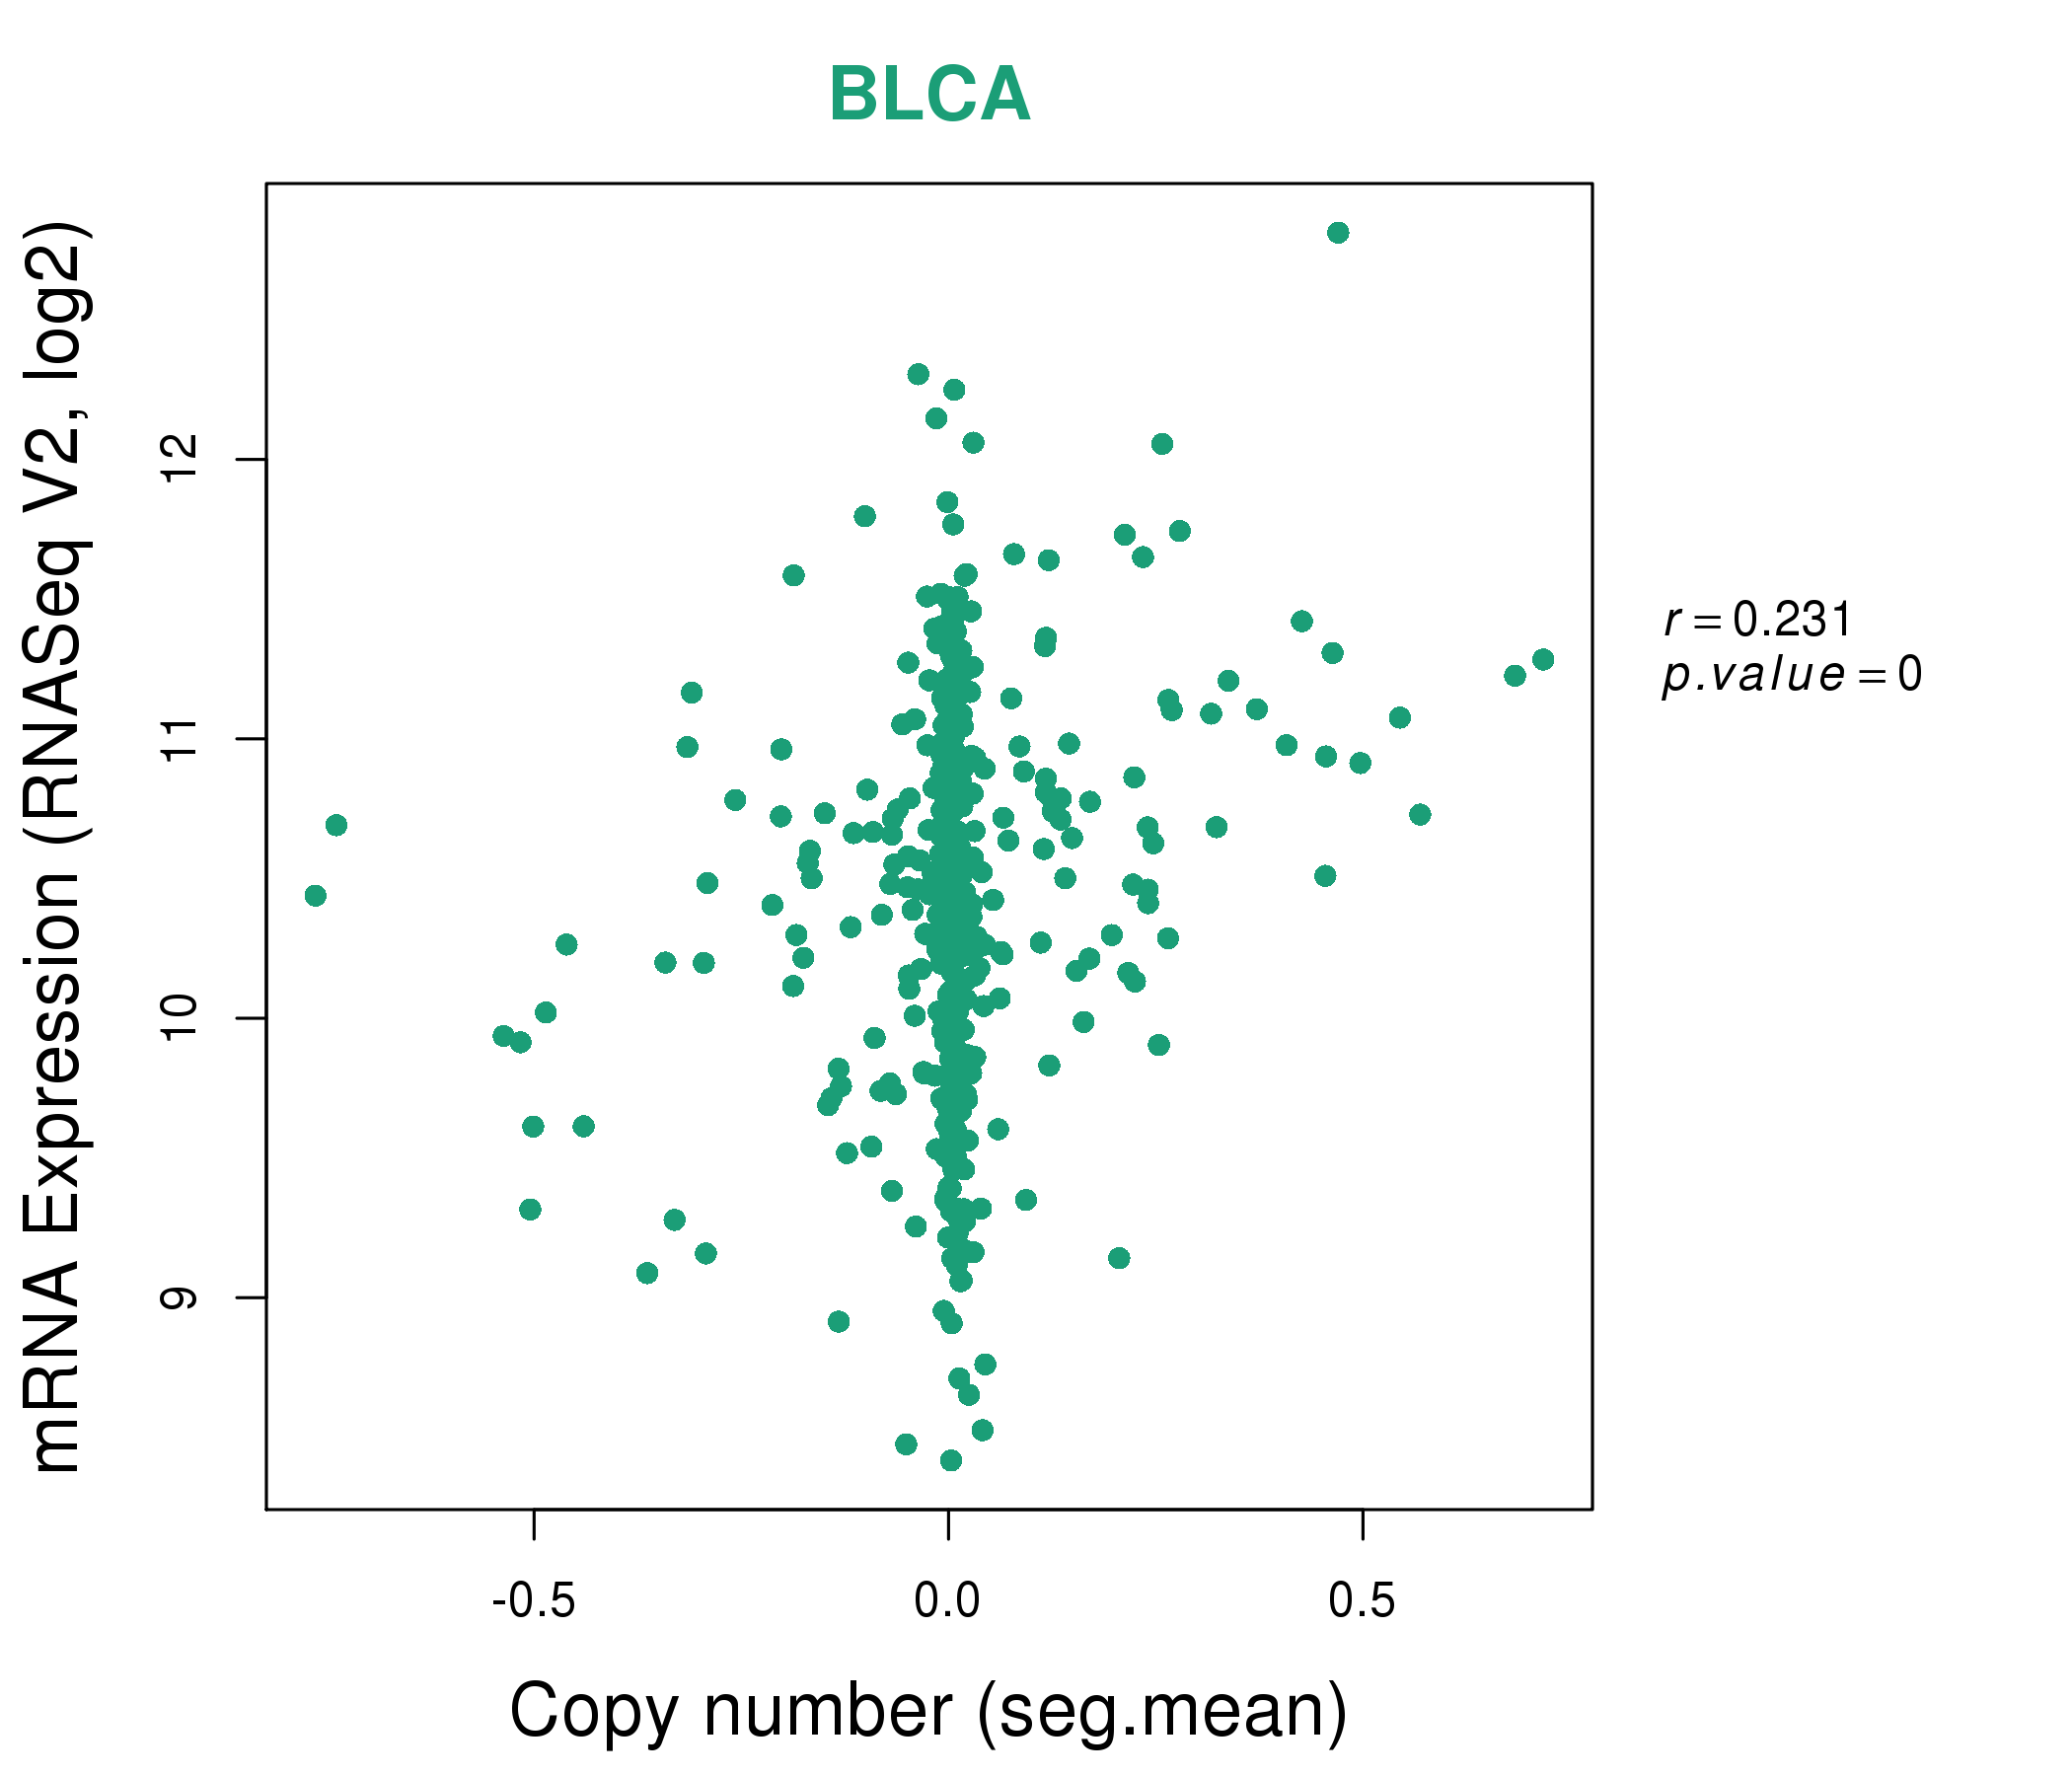
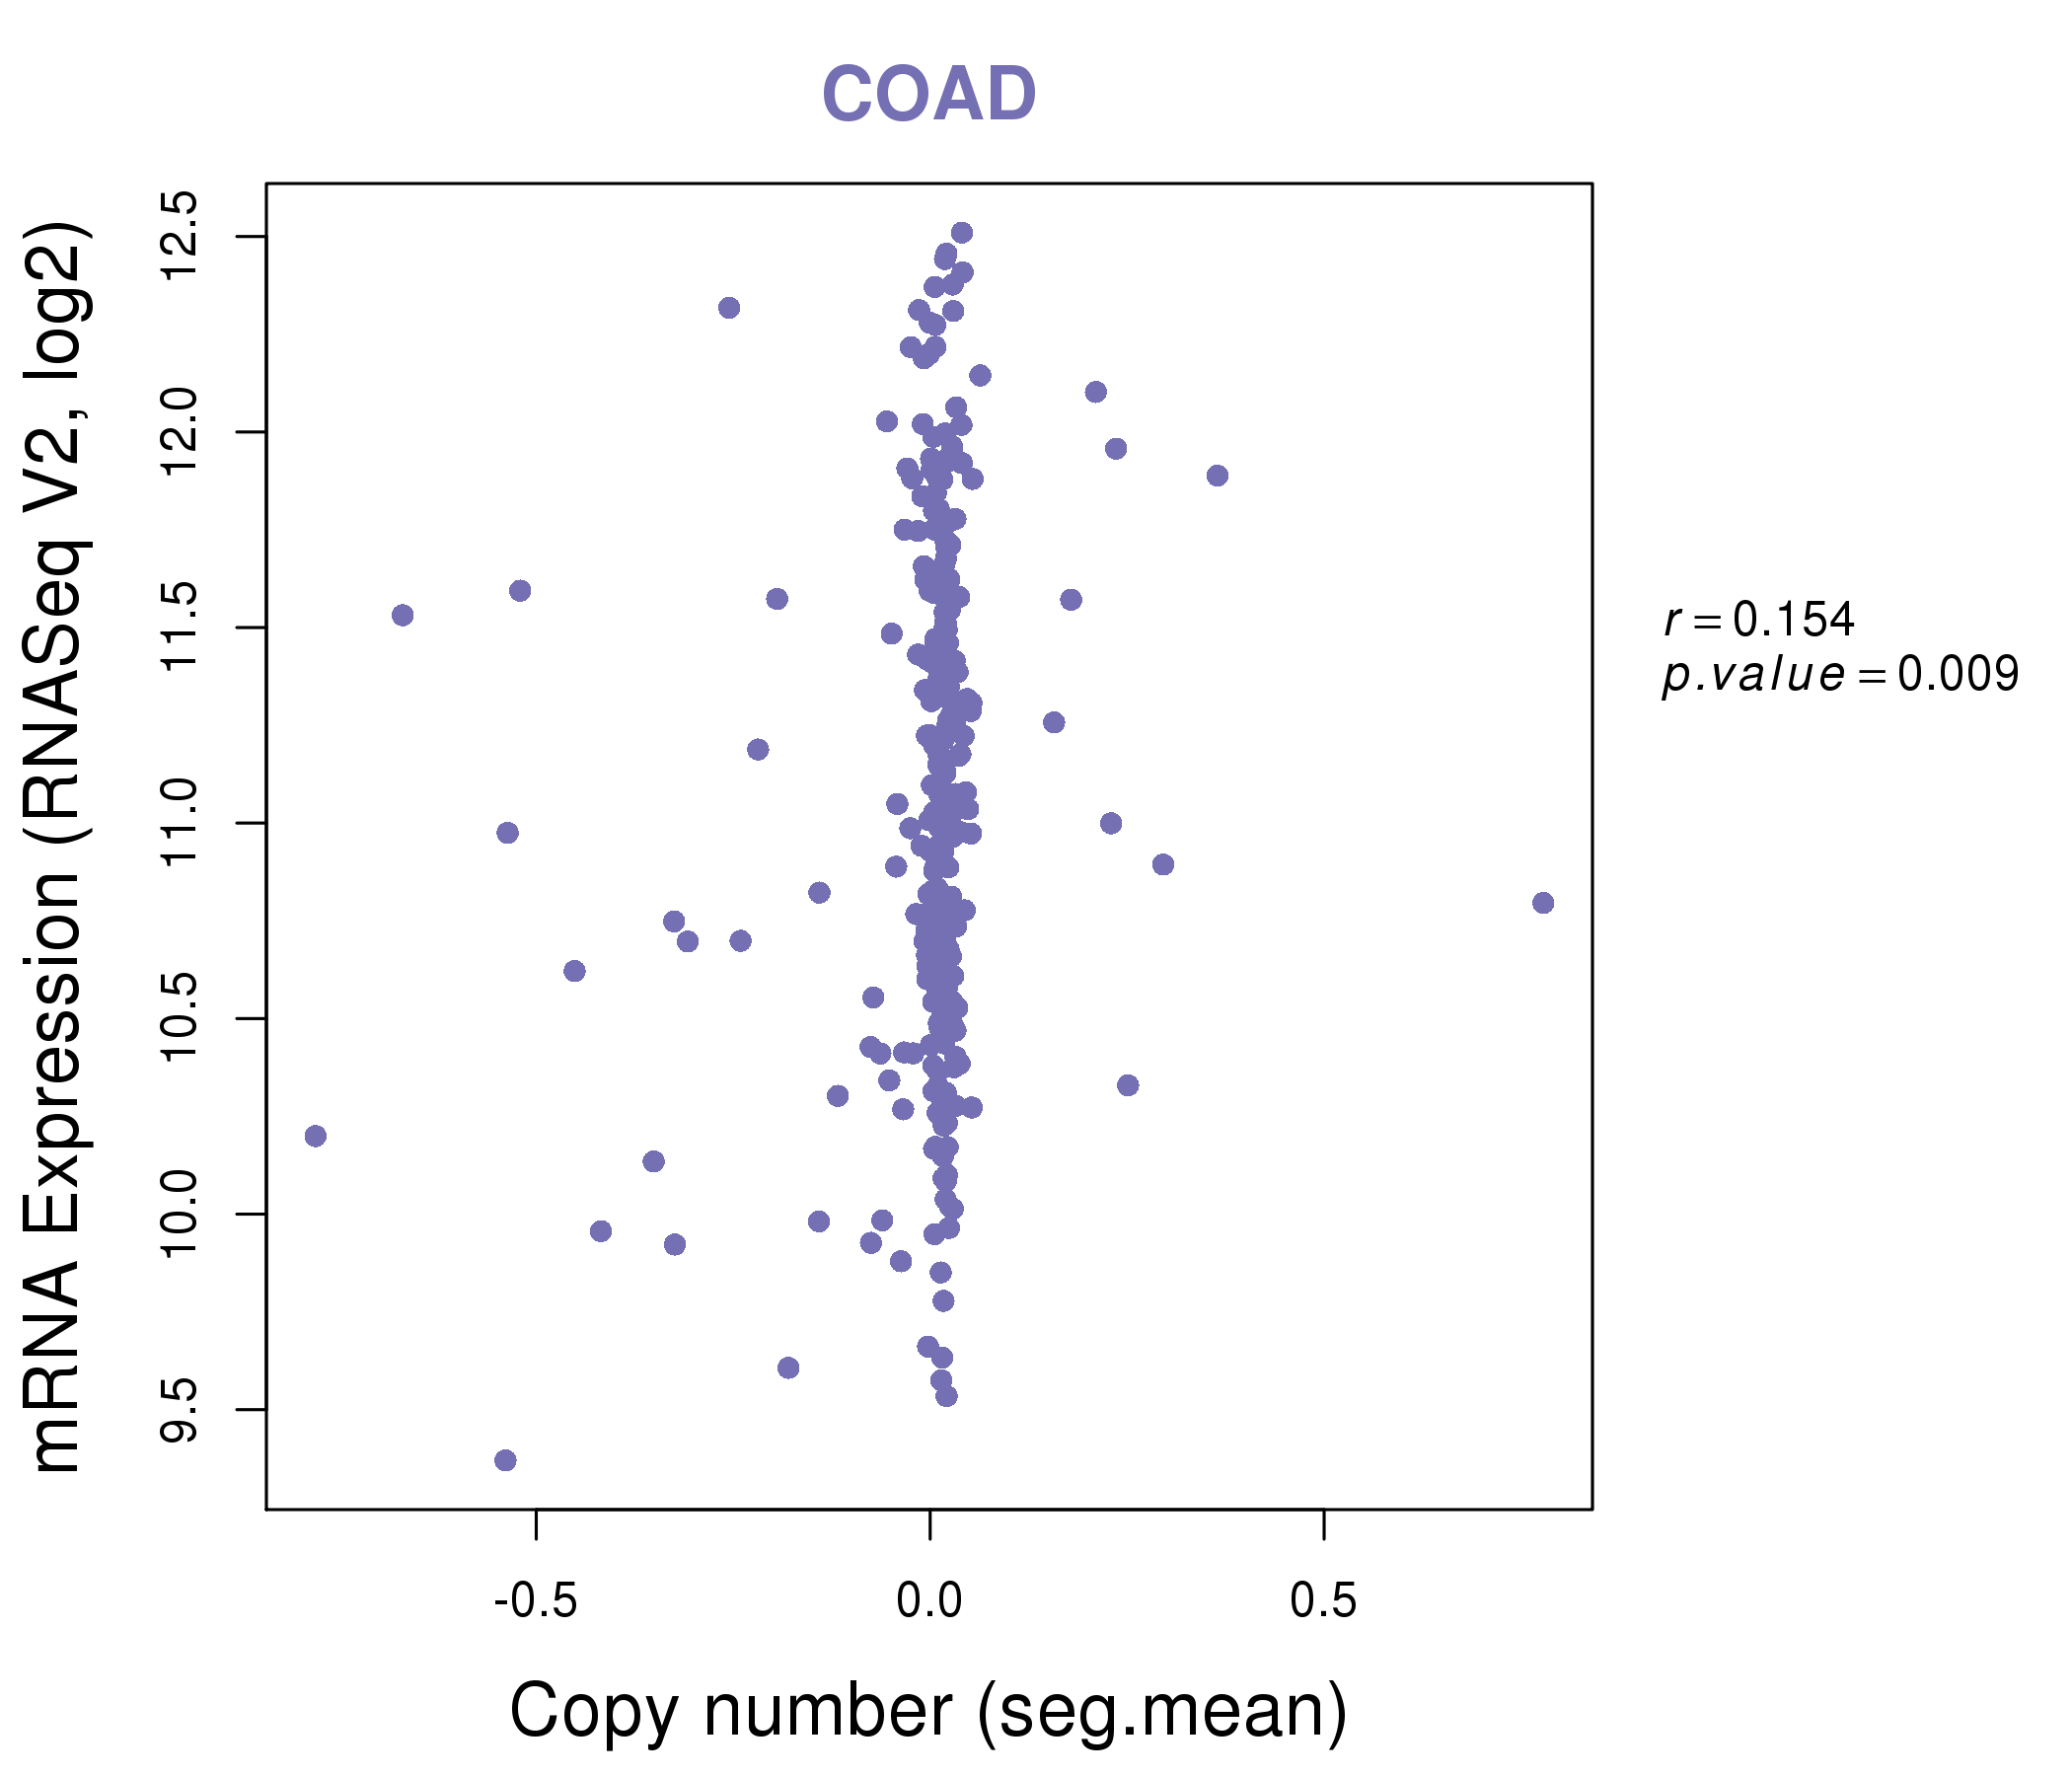
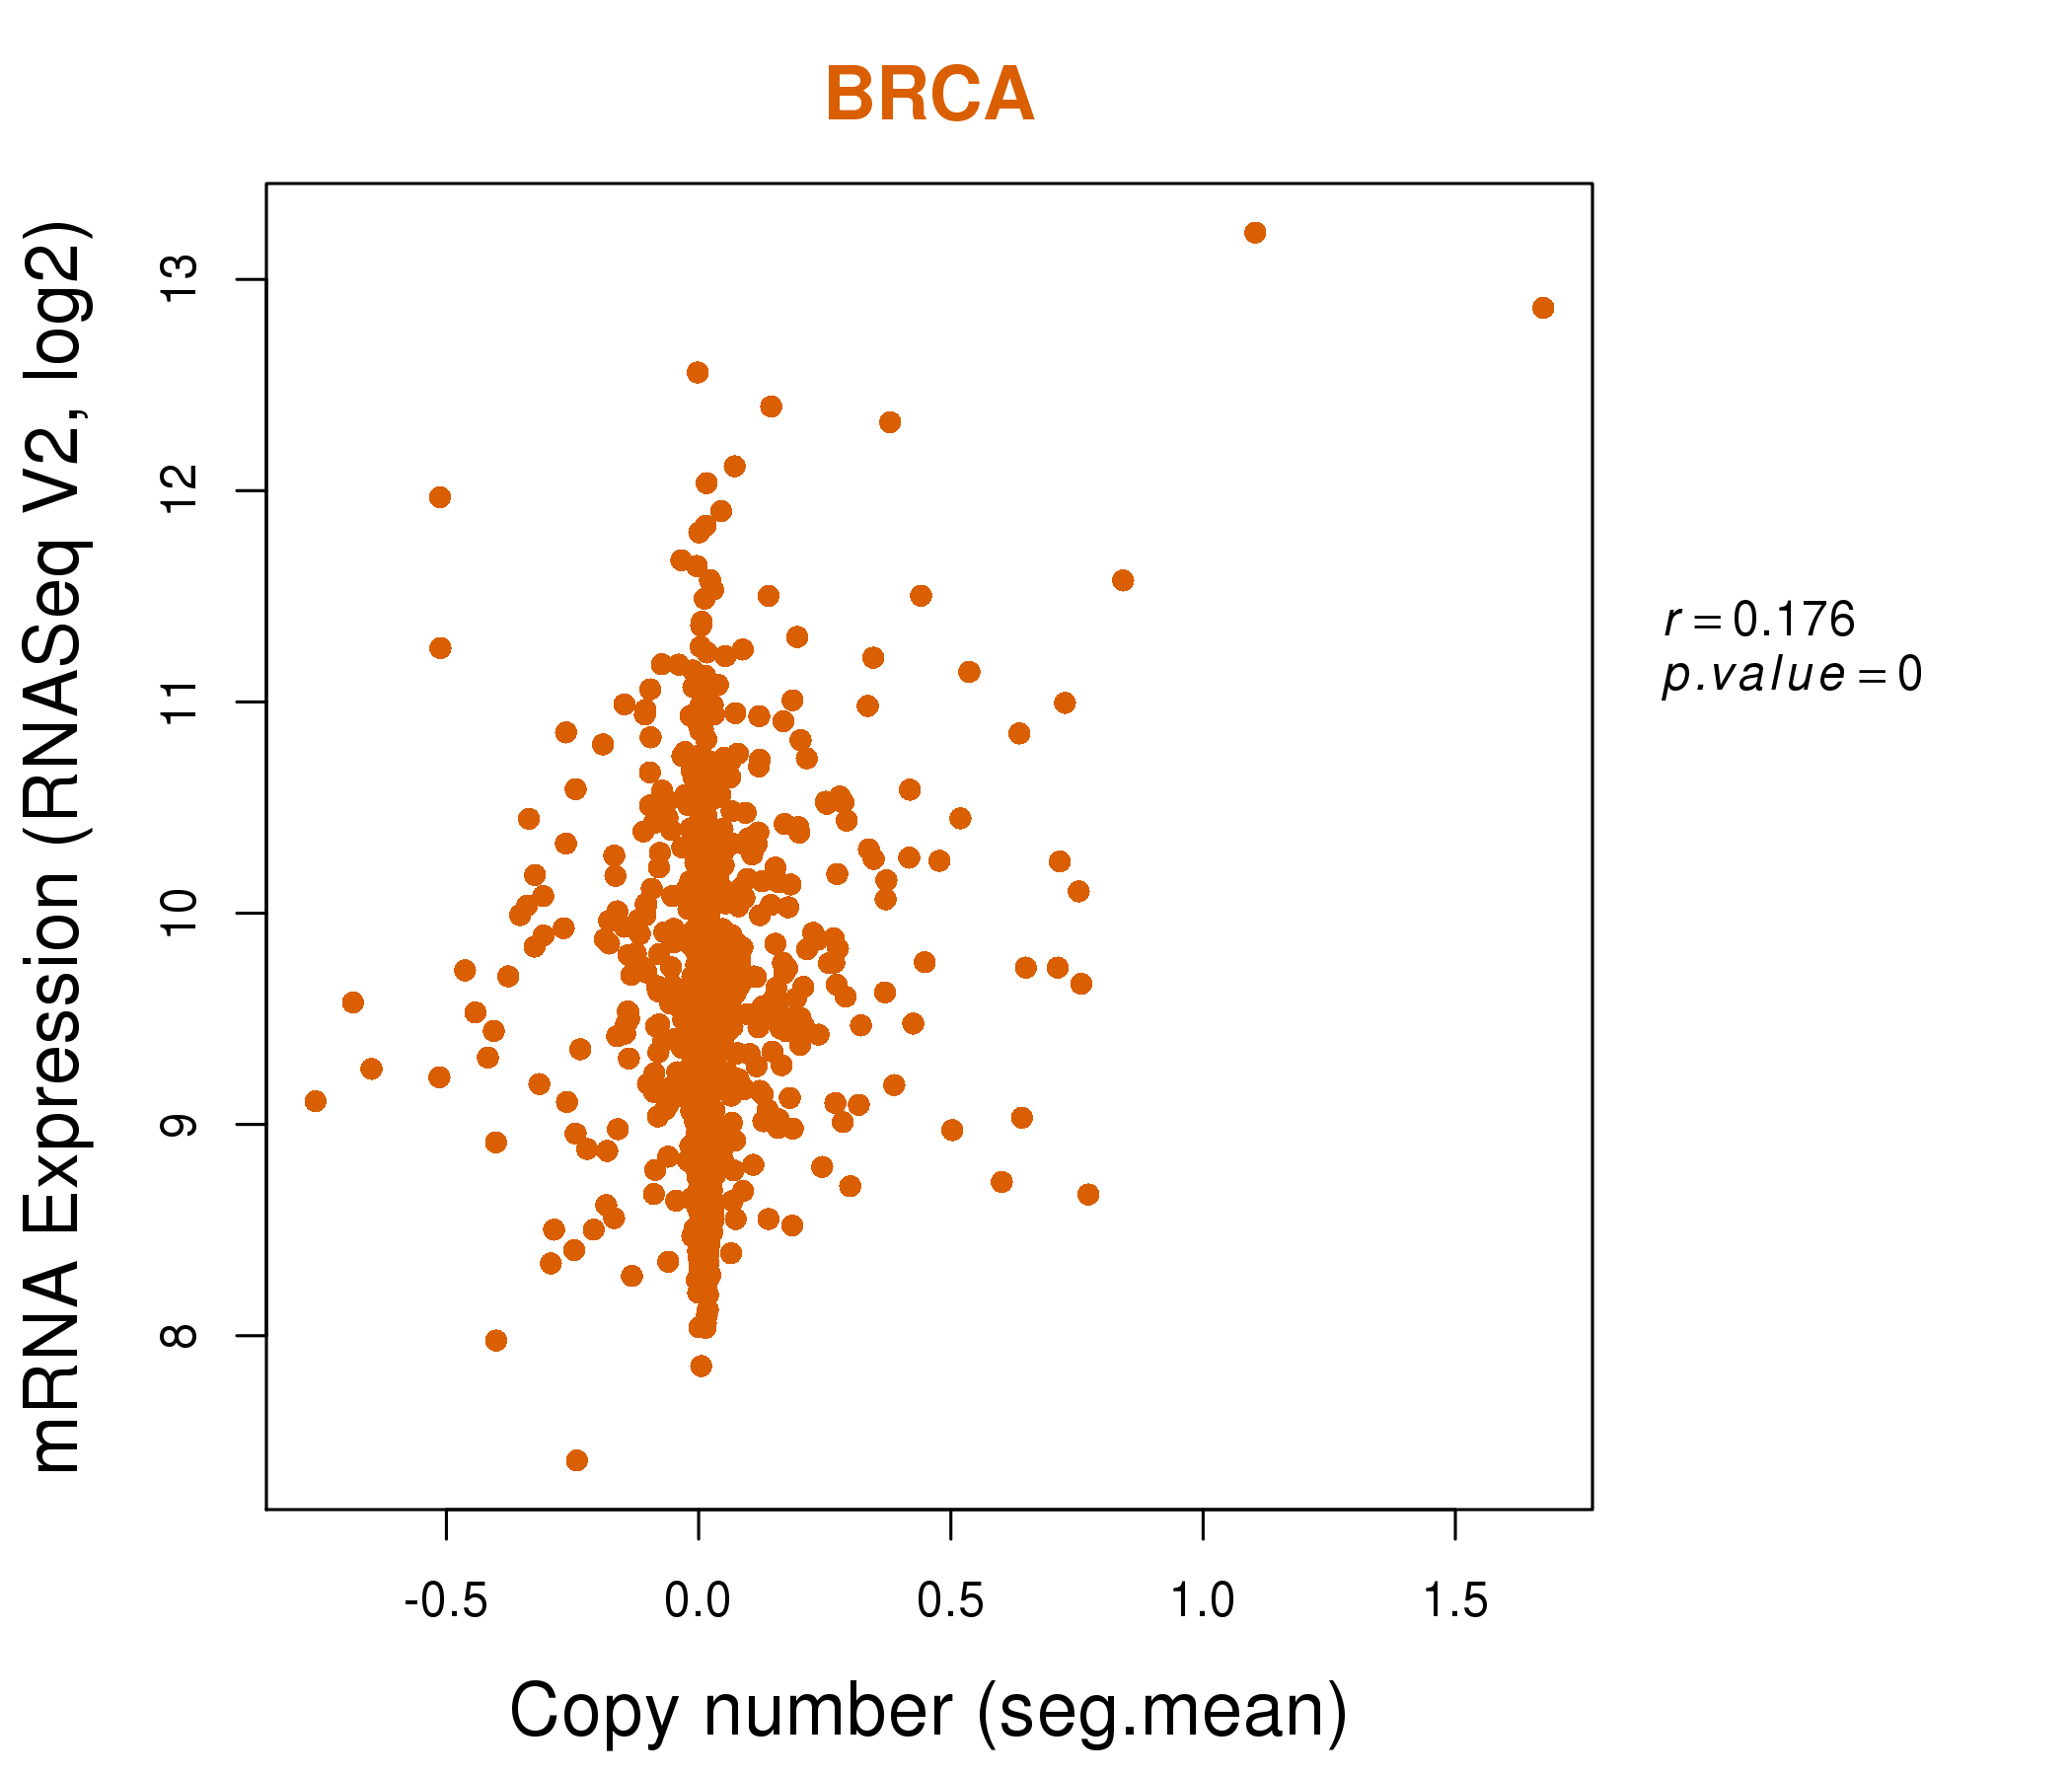
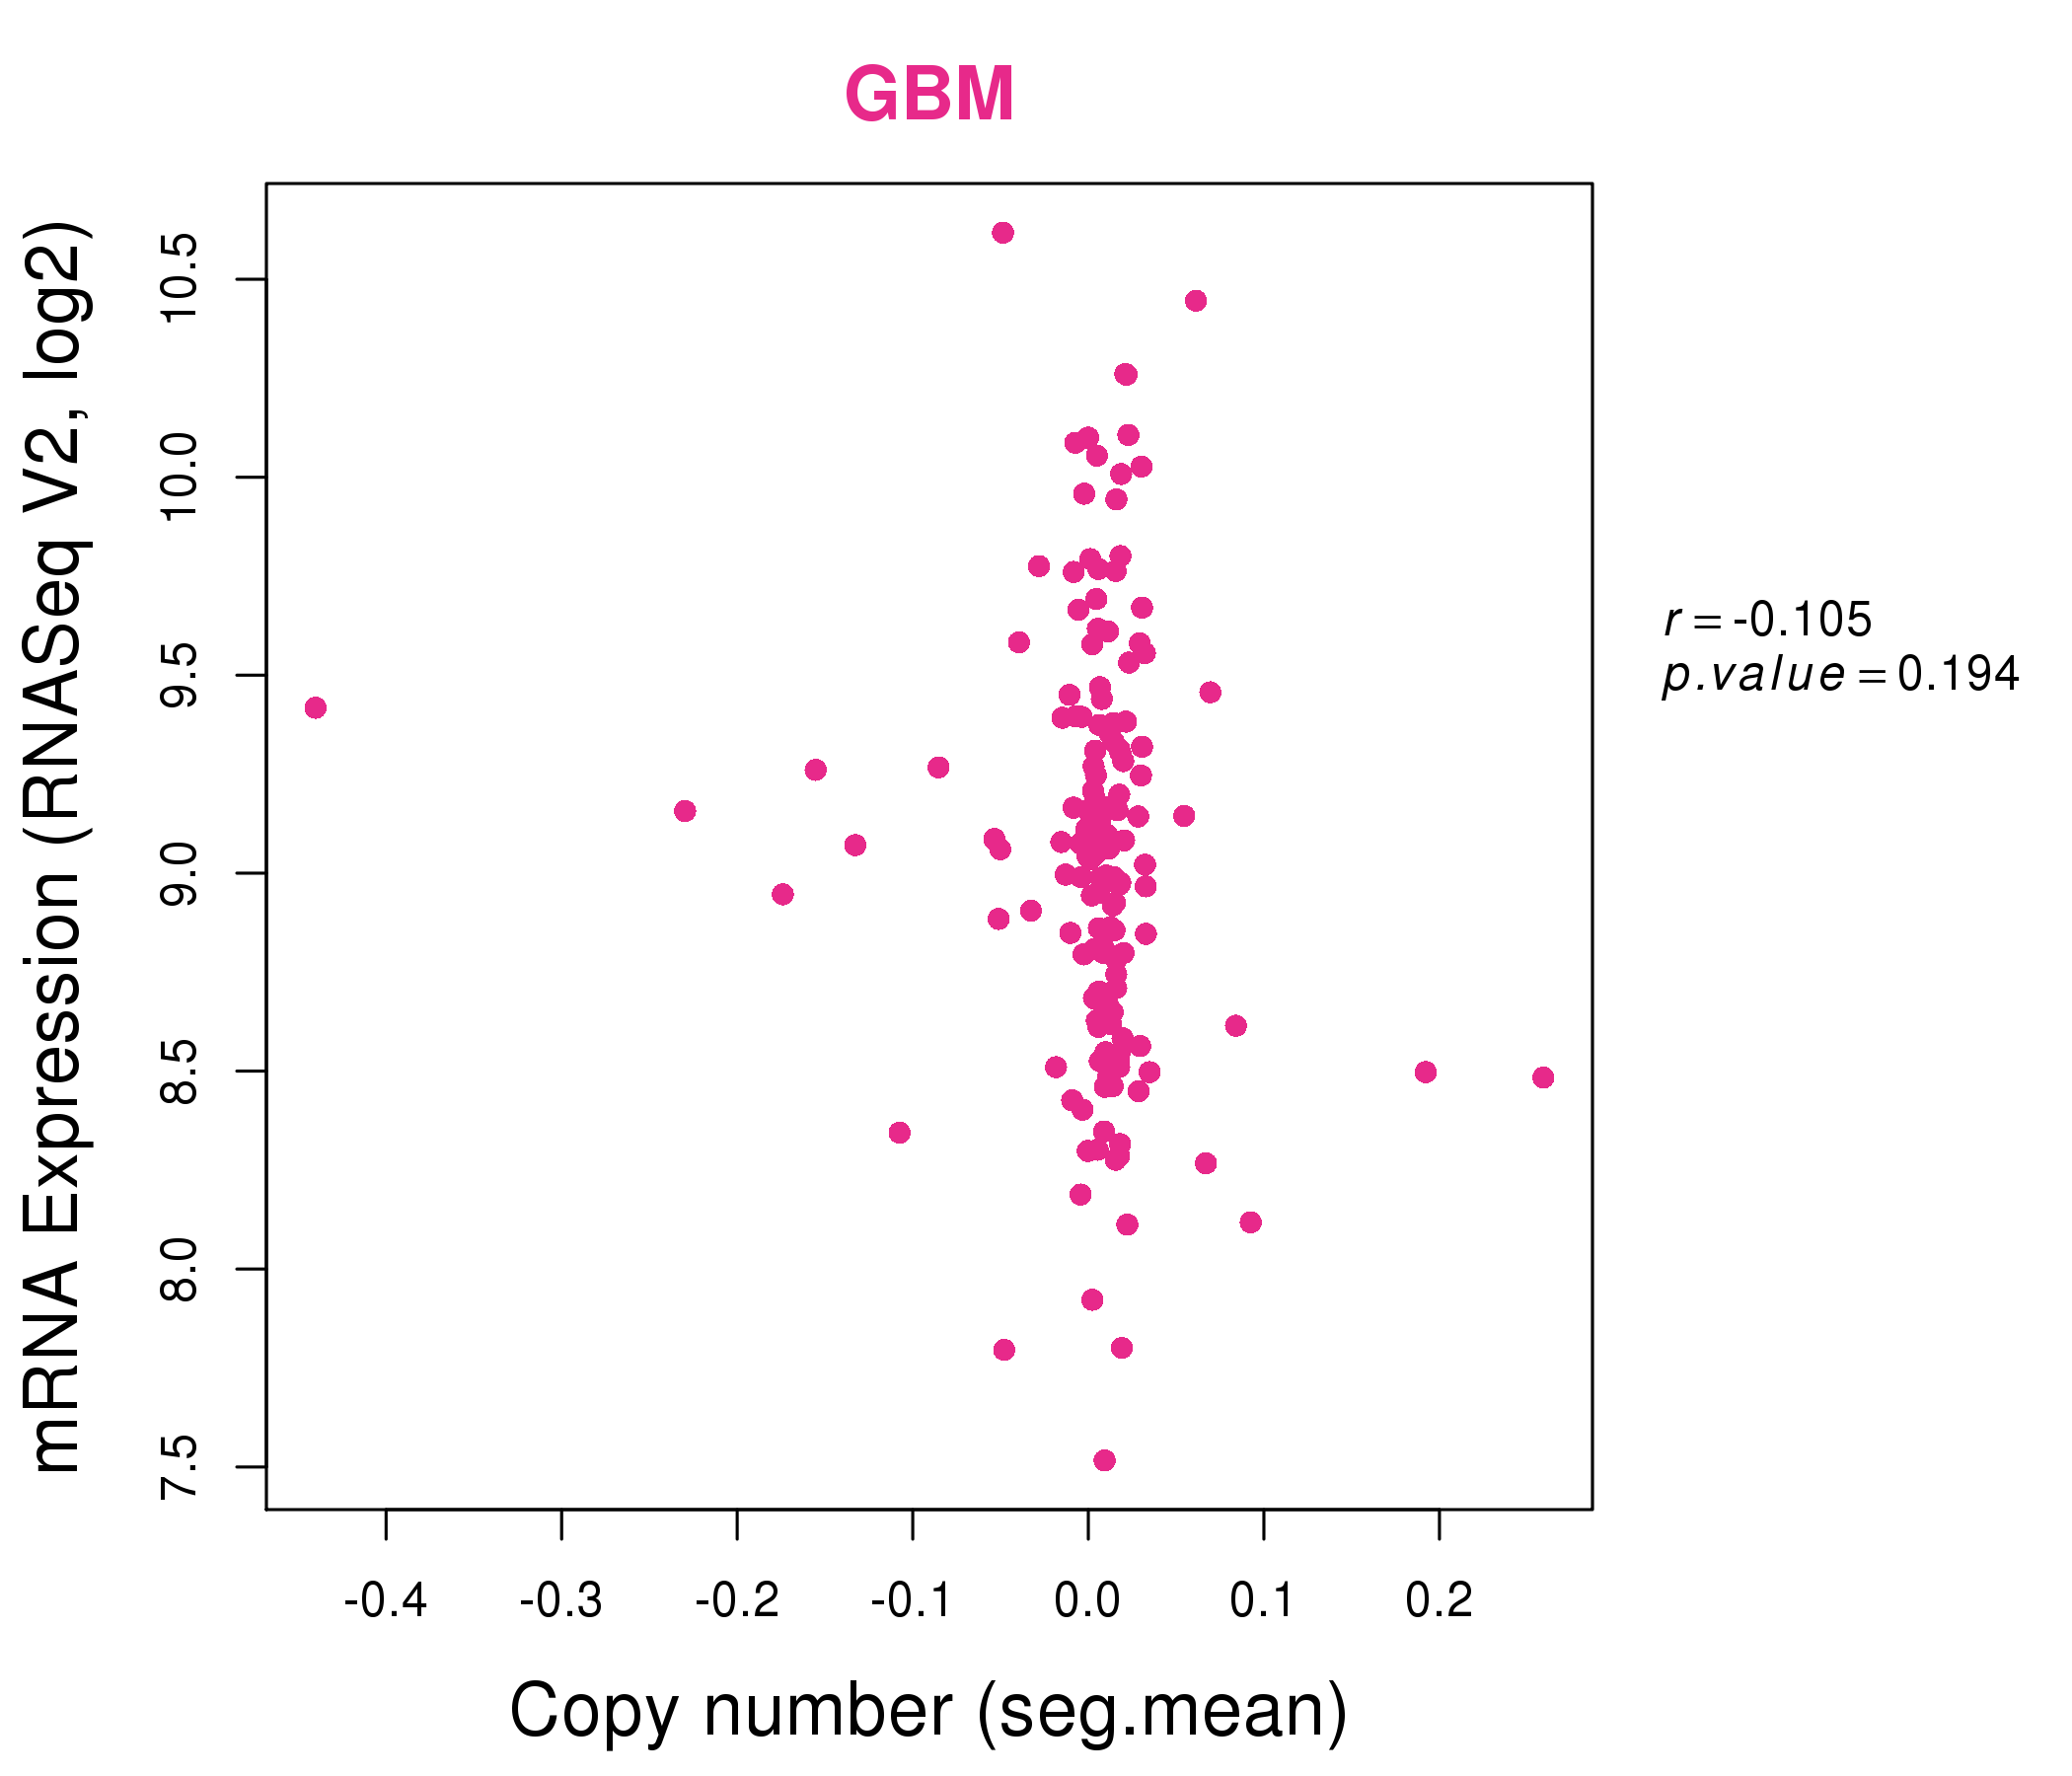
| * This plots show the correlation between CNV and gene expression. |
: Open all plots for all cancer types
 |
|
 |
|
| Top |
| Gene-Gene Network Information |
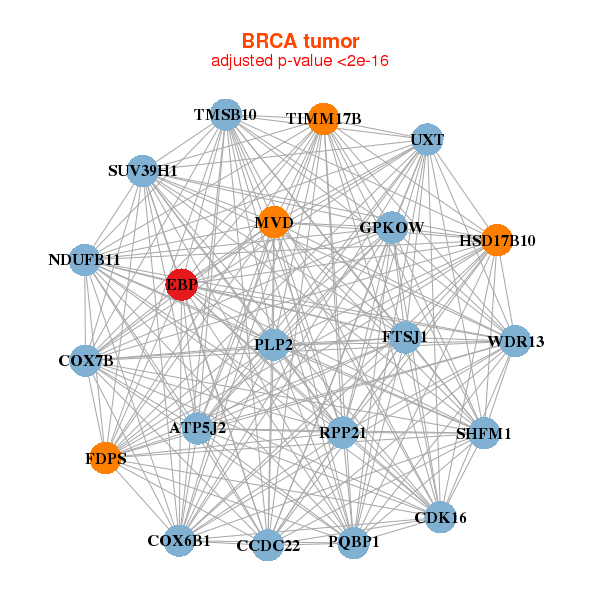
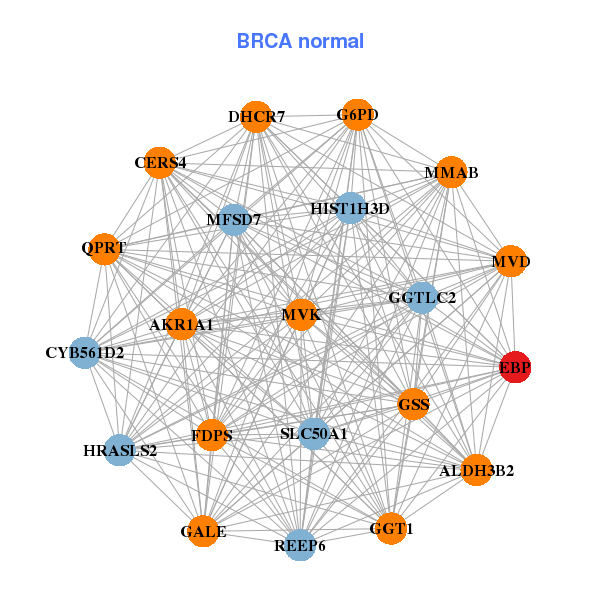
| * Co-Expression network figures were drawn using R package igraph. Only the top 20 genes with the highest correlations were shown. Red circle: input gene, orange circle: cell metabolism gene, sky circle: other gene |
: Open all plots for all cancer types
 |
|
| ATP5J2,CCDC22,CDK16,COX6B1,COX7B,EBP,FDPS, FTSJ1,GPKOW,HSD17B10,MVD,NDUFB11,PLP2,PQBP1, RPP21,SHFM1,SUV39H1,TIMM17B,TMSB10,UXT,WDR13 | AKR1A1,ALDH3B2,CYB561D2,DHCR7,EBP,FDPS,G6PD, GALE,GGT1,GGTLC2,GSS,HIST1H3D,HRASLS2,CERS4, MFSD7,MMAB,MVD,MVK,QPRT,SLC50A1,REEP6 |
 |
|
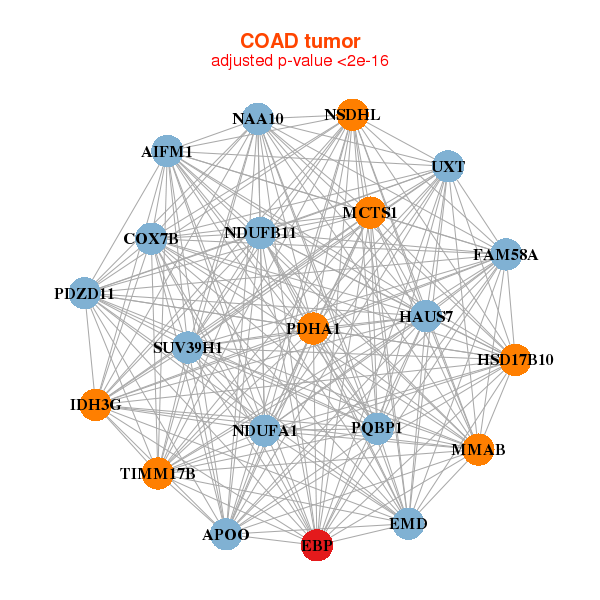
| AIFM1,APOO,COX7B,EBP,EMD,FAM58A,HAUS7, HSD17B10,IDH3G,MCTS1,MMAB,NAA10,NDUFA1,NDUFB11, NSDHL,PDHA1,PDZD11,PQBP1,SUV39H1,TIMM17B,UXT | ATP6V0A2,BRI3BP,C1GALT1,EBP,FDFT1,FDPS,GSR, H2AFY,IDI1,MGST2,MMAB,MPDU1,NSDHL,NUDT8, PCYT2,PI4K2B,PLEK2,S100A14,STARD4,TALDO1,TXNDC17 |
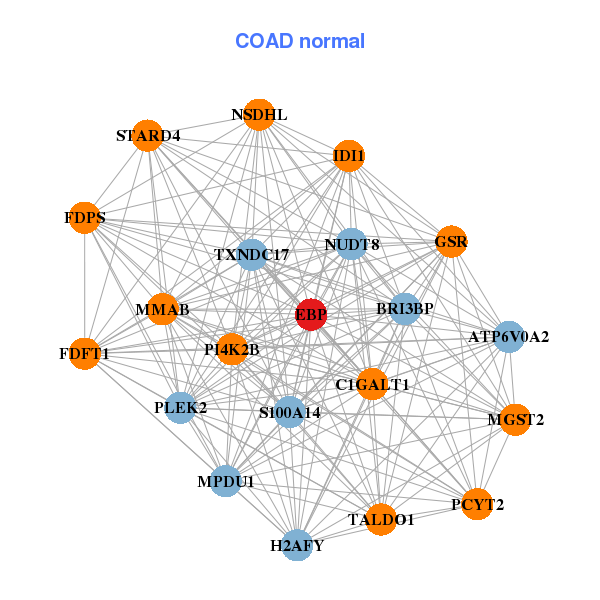
| * Co-Expression network figures were drawn using R package igraph. Only the top 20 genes with the highest correlations were shown. Red circle: input gene, orange circle: cell metabolism gene, sky circle: other gene |
: Open all plots for all cancer types
| Top |
: Open all interacting genes' information including KEGG pathway for all interacting genes from DAVID
| Top |
| Pharmacological Information for EBP |
| There's no related Drug. |
| Top |
| Cross referenced IDs for EBP |
| * We obtained these cross-references from Uniprot database. It covers 150 different DBs, 18 categories. http://www.uniprot.org/help/cross_references_section |
: Open all cross reference information
|
Copyright © 2016-Present - The Univsersity of Texas Health Science Center at Houston @ |