|
||||||||||||||||||||
| |
| Phenotypic Information (metabolism pathway, cancer, disease, phenome) |
| |
| |
| Gene-Gene Network Information: Co-Expression Network, Interacting Genes & KEGG |
| |
|


| Gene Summary for CCT8 |
| Top |
| Phenotypic Information for CCT8(metabolism pathway, cancer, disease, phenome) |
| Cancer | CGAP: CCT8 |
| Familial Cancer Database: CCT8 | |
| * This gene is included in those cancer gene databases. |
|
|
|
|
|
| . | ||||||||||||||
Oncogene 1 | Significant driver gene in | |||||||||||||||||||
| cf) number; DB name 1 Oncogene; http://nar.oxfordjournals.org/content/35/suppl_1/D721.long, 2 Tumor Suppressor gene; https://bioinfo.uth.edu/TSGene/, 3 Cancer Gene Census; http://www.nature.com/nrc/journal/v4/n3/abs/nrc1299.html, 4 CancerGenes; http://nar.oxfordjournals.org/content/35/suppl_1/D721.long, 5 Network of Cancer Gene; http://ncg.kcl.ac.uk/index.php, 1Therapeutic Vulnerabilities in Cancer; http://cbio.mskcc.org/cancergenomics/statius/ |
| REACTOME_METABOLISM_OF_PROTEINS | |
| OMIM | |
| Orphanet | |
| Disease | KEGG Disease: CCT8 |
| MedGen: CCT8 (Human Medical Genetics with Condition) | |
| ClinVar: CCT8 | |
| Phenotype | MGI: CCT8 (International Mouse Phenotyping Consortium) |
| PhenomicDB: CCT8 | |
| Mutations for CCT8 |
| * Under tables are showing count per each tissue to give us broad intuition about tissue specific mutation patterns.You can go to the detailed page for each mutation database's web site. |
| There's no structural variation information in COSMIC data for this gene. |
| * From mRNA Sanger sequences, Chitars2.0 arranged chimeric transcripts. This table shows CCT8 related fusion information. |
| ID | Head Gene | Tail Gene | Accession | Gene_a | qStart_a | qEnd_a | Chromosome_a | tStart_a | tEnd_a | Gene_a | qStart_a | qEnd_a | Chromosome_a | tStart_a | tEnd_a |
| BG991440 | FBXO7 | 35 | 146 | 22 | 32888763 | 32888879 | CCT8 | 139 | 236 | 21 | 30432926 | 30433614 | |
| DA276711 | LOC100507412 | 2 | 156 | ? | 112025 | 112179 | CCT8 | 154 | 569 | 21 | 30439912 | 30445981 | |
| Top |
| There's no copy number variation information in COSMIC data for this gene. |
| Top |
|
 |
| Top |
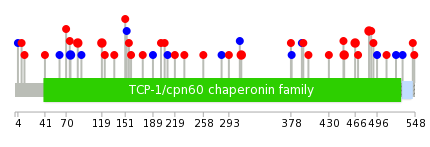
| Stat. for Non-Synonymous SNVs (# total SNVs=30) | (# total SNVs=13) |
 |  |
(# total SNVs=0) | (# total SNVs=0) |
| Top |
| * When you move the cursor on each content, you can see more deailed mutation information on the Tooltip. Those are primary_site,primary_histology,mutation(aa),pubmedID. |
| GRCh37 position | Mutation(aa) | Unique sampleID count |
| chr21:30437428-30437428 | p.? | 2 |
| chr21:30433625-30433625 | p.K466N | 2 |
| chr21:30439902-30439902 | p.L119R | 2 |
| chr21:30435686-30435686 | p.I310V | 2 |
| chr21:30433672-30433672 | p.A451T | 2 |
| chr21:30440001-30440001 | p.I86T | 2 |
| chr21:30441747-30441747 | p.L76L | 2 |
| chr21:30441831-30441831 | p.? | 2 |
| chr21:30432976-30432976 | p.E485D | 2 |
| chr21:30437424-30437424 | p.G209G | 1 |
| Top |
|
 |
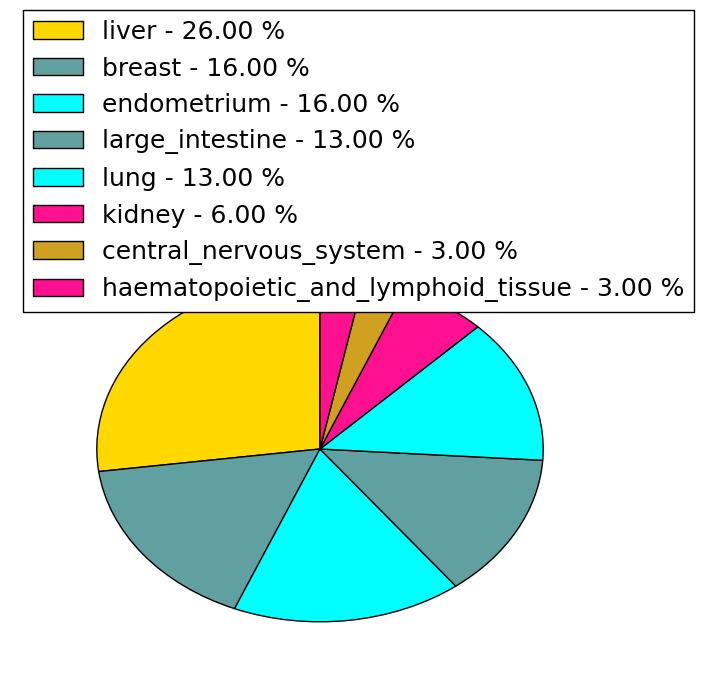
| Point Mutation/ Tissue ID | 1 | 2 | 3 | 4 | 5 | 6 | 7 | 8 | 9 | 10 | 11 | 12 | 13 | 14 | 15 | 16 | 17 | 18 | 19 | 20 |
| # sample | 1 | 2 | 1 | 6 | 3 | 2 | 1 | 1 | 3 | 5 | ||||||||||
| # mutation | 1 | 2 | 1 | 6 | 3 | 2 | 1 | 1 | 3 | 7 | ||||||||||
| nonsynonymous SNV | 2 | 1 | 2 | 2 | 2 | 1 | 3 | 4 | ||||||||||||
| synonymous SNV | 1 | 4 | 1 | 1 | 3 |
| cf) Tissue ID; Tissue type (1; BLCA[Bladder Urothelial Carcinoma], 2; BRCA[Breast invasive carcinoma], 3; CESC[Cervical squamous cell carcinoma and endocervical adenocarcinoma], 4; COAD[Colon adenocarcinoma], 5; GBM[Glioblastoma multiforme], 6; Glioma Low Grade, 7; HNSC[Head and Neck squamous cell carcinoma], 8; KICH[Kidney Chromophobe], 9; KIRC[Kidney renal clear cell carcinoma], 10; KIRP[Kidney renal papillary cell carcinoma], 11; LAML[Acute Myeloid Leukemia], 12; LUAD[Lung adenocarcinoma], 13; LUSC[Lung squamous cell carcinoma], 14; OV[Ovarian serous cystadenocarcinoma ], 15; PAAD[Pancreatic adenocarcinoma], 16; PRAD[Prostate adenocarcinoma], 17; SKCM[Skin Cutaneous Melanoma], 18:STAD[Stomach adenocarcinoma], 19:THCA[Thyroid carcinoma], 20:UCEC[Uterine Corpus Endometrial Carcinoma]) |
| Top |
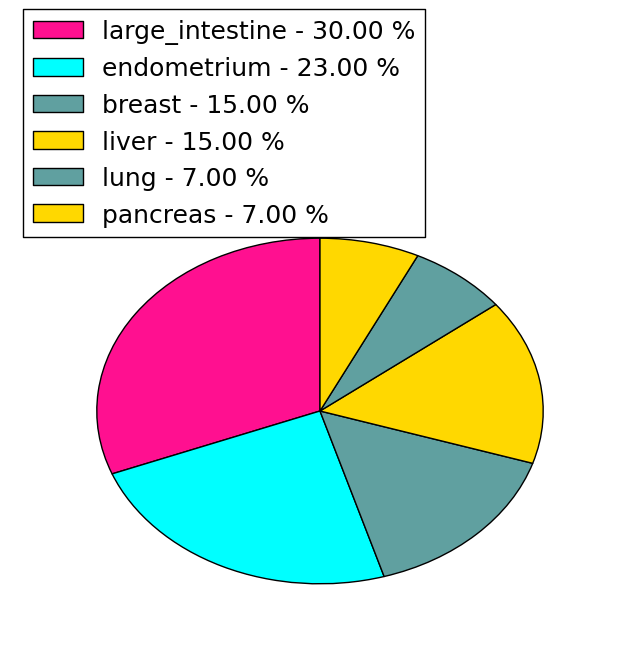
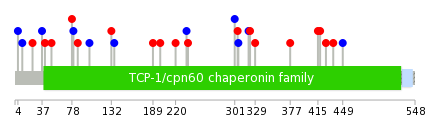
| * We represented just top 10 SNVs. When you move the cursor on each content, you can see more deailed mutation information on the Tooltip. Those are primary_site, primary_histology, mutation(aa), pubmedID. |
| Genomic Position | Mutation(aa) | Unique sampleID count |
| chr21:30434524 | p.I237V,CCT8 | 1 |
| chr21:30439299 | p.H4H | 1 |
| chr21:30434528 | p.Y235Y,CCT8 | 1 |
| chr21:30439315 | p.T220S,CCT8 | 1 |
| chr21:30432865 | p.E199K,CCT8 | 1 |
| chr21:30434539 | p.D449D,CCT8 | 1 |
| chr21:30439323 | p.A189T,CCT8 | 1 |
| chr21:30432906 | p.K436E,CCT8 | 1 |
| chr21:30435686 | p.G136G,CCT8 | 1 |
| chr21:30439891 | p.D426Y,CCT8 | 1 |
| * Copy number data were extracted from TCGA using R package TCGA-Assembler. The URLs of all public data files on TCGA DCC data server were gathered on Jan-05-2015. Function ProcessCNAData in TCGA-Assembler package was used to obtain gene-level copy number value which is calculated as the average copy number of the genomic region of a gene. |
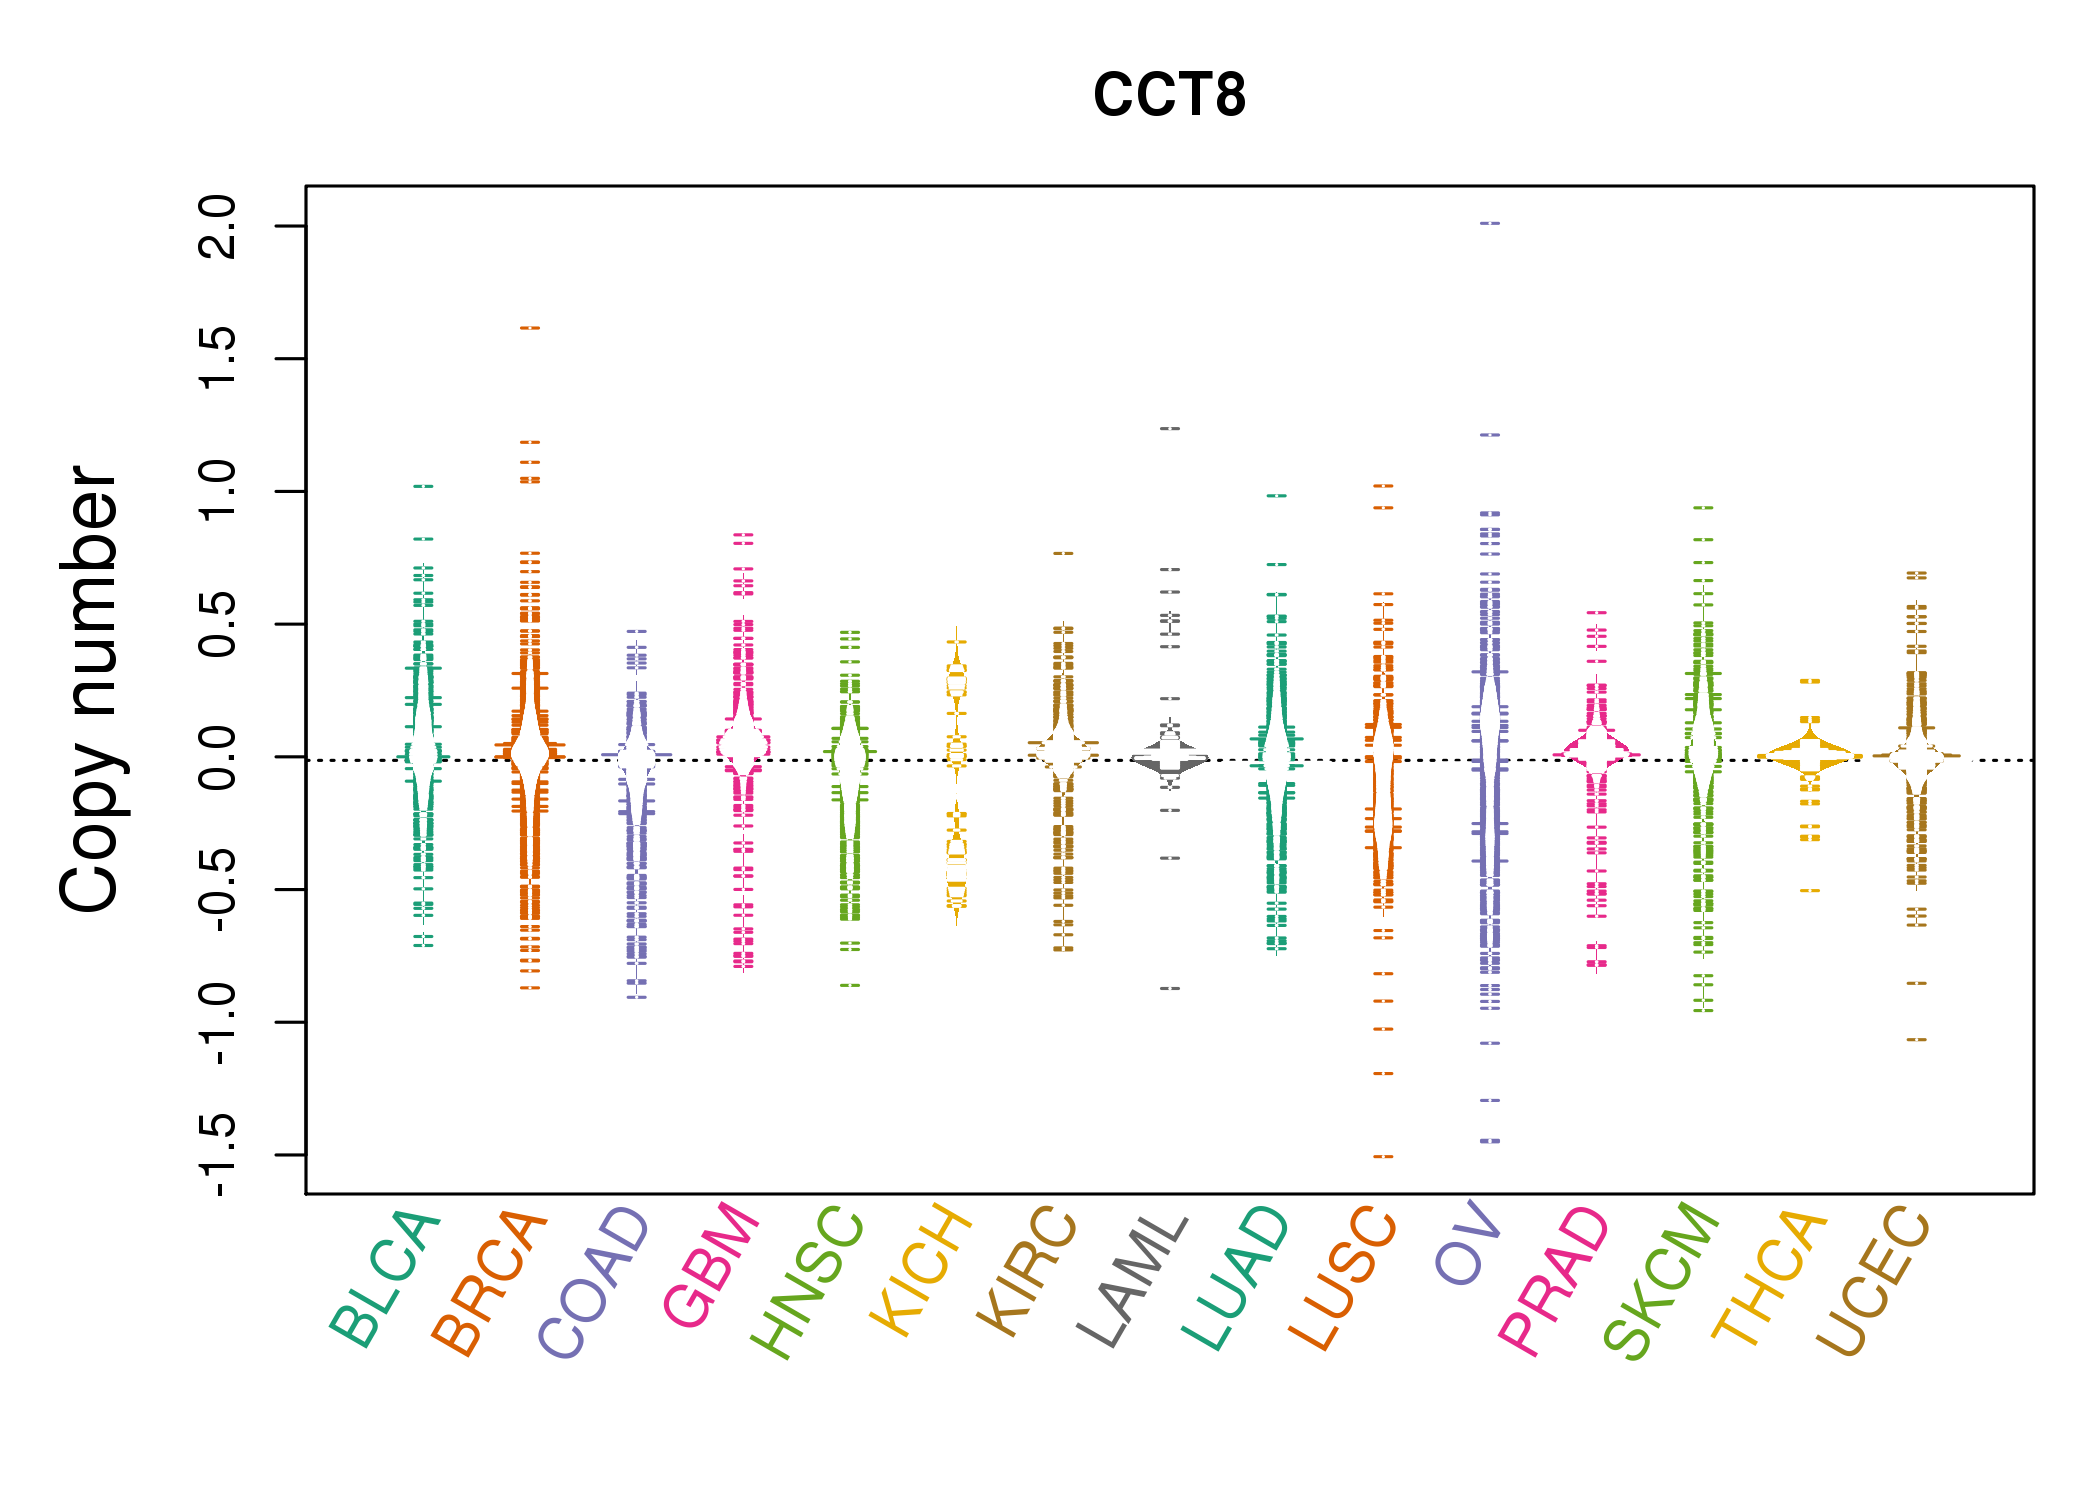 |
| cf) Tissue ID[Tissue type]: BLCA[Bladder Urothelial Carcinoma], BRCA[Breast invasive carcinoma], CESC[Cervical squamous cell carcinoma and endocervical adenocarcinoma], COAD[Colon adenocarcinoma], GBM[Glioblastoma multiforme], Glioma Low Grade, HNSC[Head and Neck squamous cell carcinoma], KICH[Kidney Chromophobe], KIRC[Kidney renal clear cell carcinoma], KIRP[Kidney renal papillary cell carcinoma], LAML[Acute Myeloid Leukemia], LUAD[Lung adenocarcinoma], LUSC[Lung squamous cell carcinoma], OV[Ovarian serous cystadenocarcinoma ], PAAD[Pancreatic adenocarcinoma], PRAD[Prostate adenocarcinoma], SKCM[Skin Cutaneous Melanoma], STAD[Stomach adenocarcinoma], THCA[Thyroid carcinoma], UCEC[Uterine Corpus Endometrial Carcinoma] |
| Top |
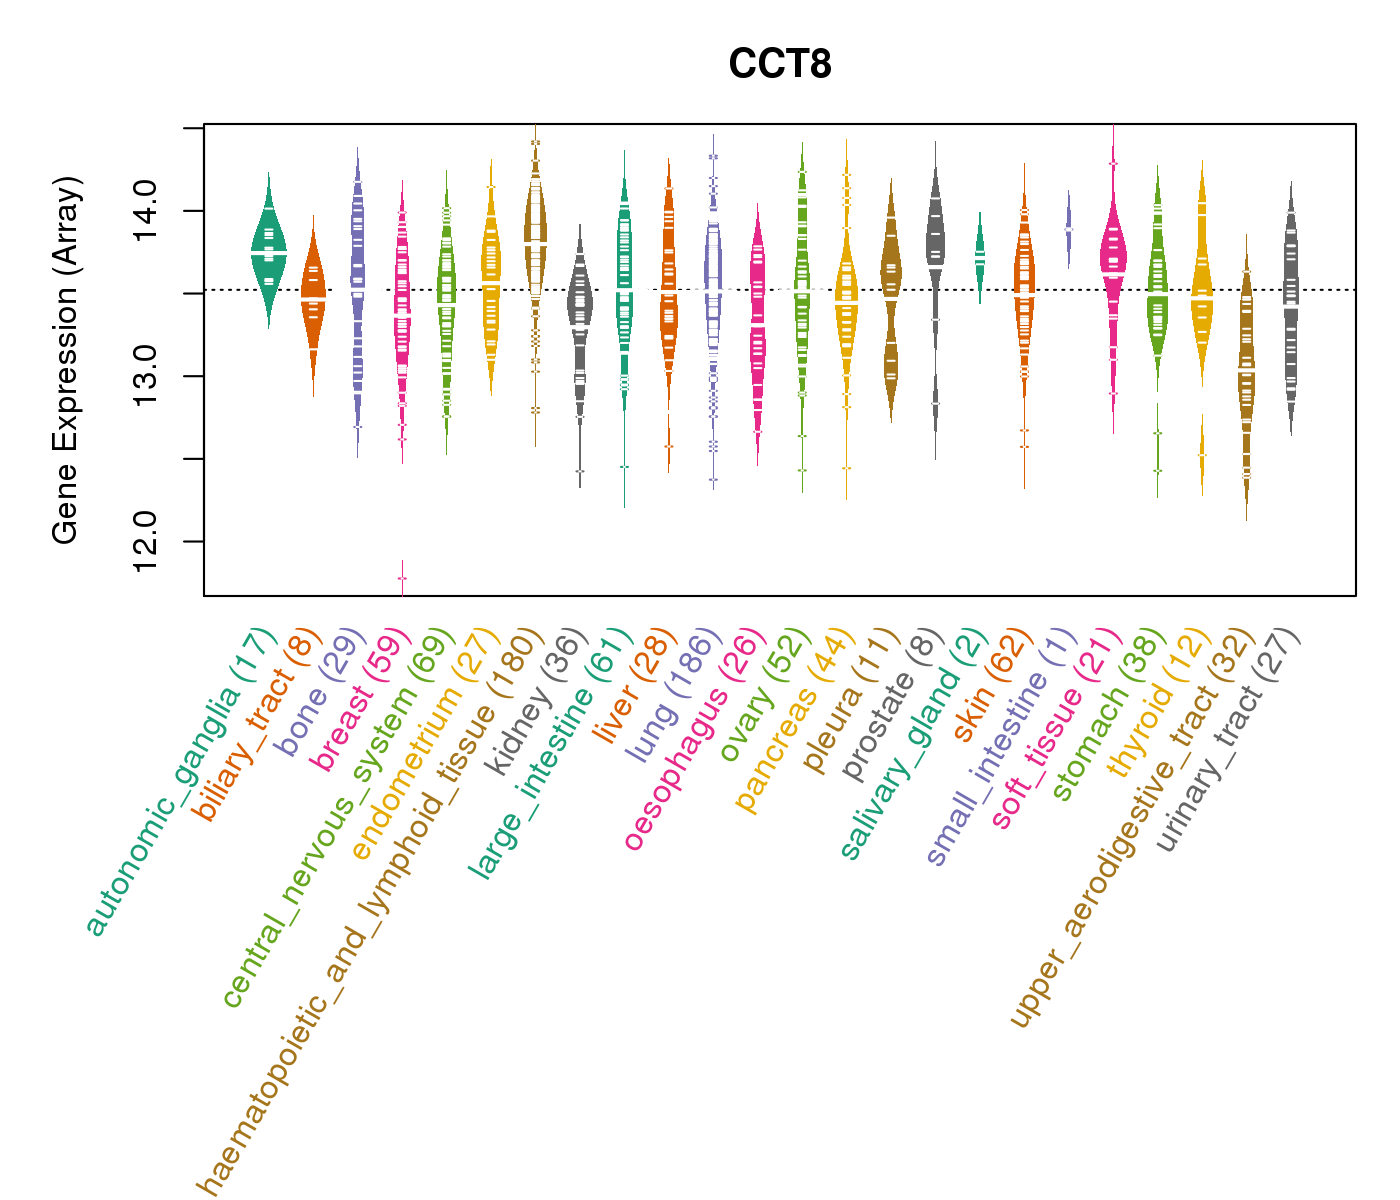
| Gene Expression for CCT8 |
| * CCLE gene expression data were extracted from CCLE_Expression_Entrez_2012-10-18.res: Gene-centric RMA-normalized mRNA expression data. |
 |
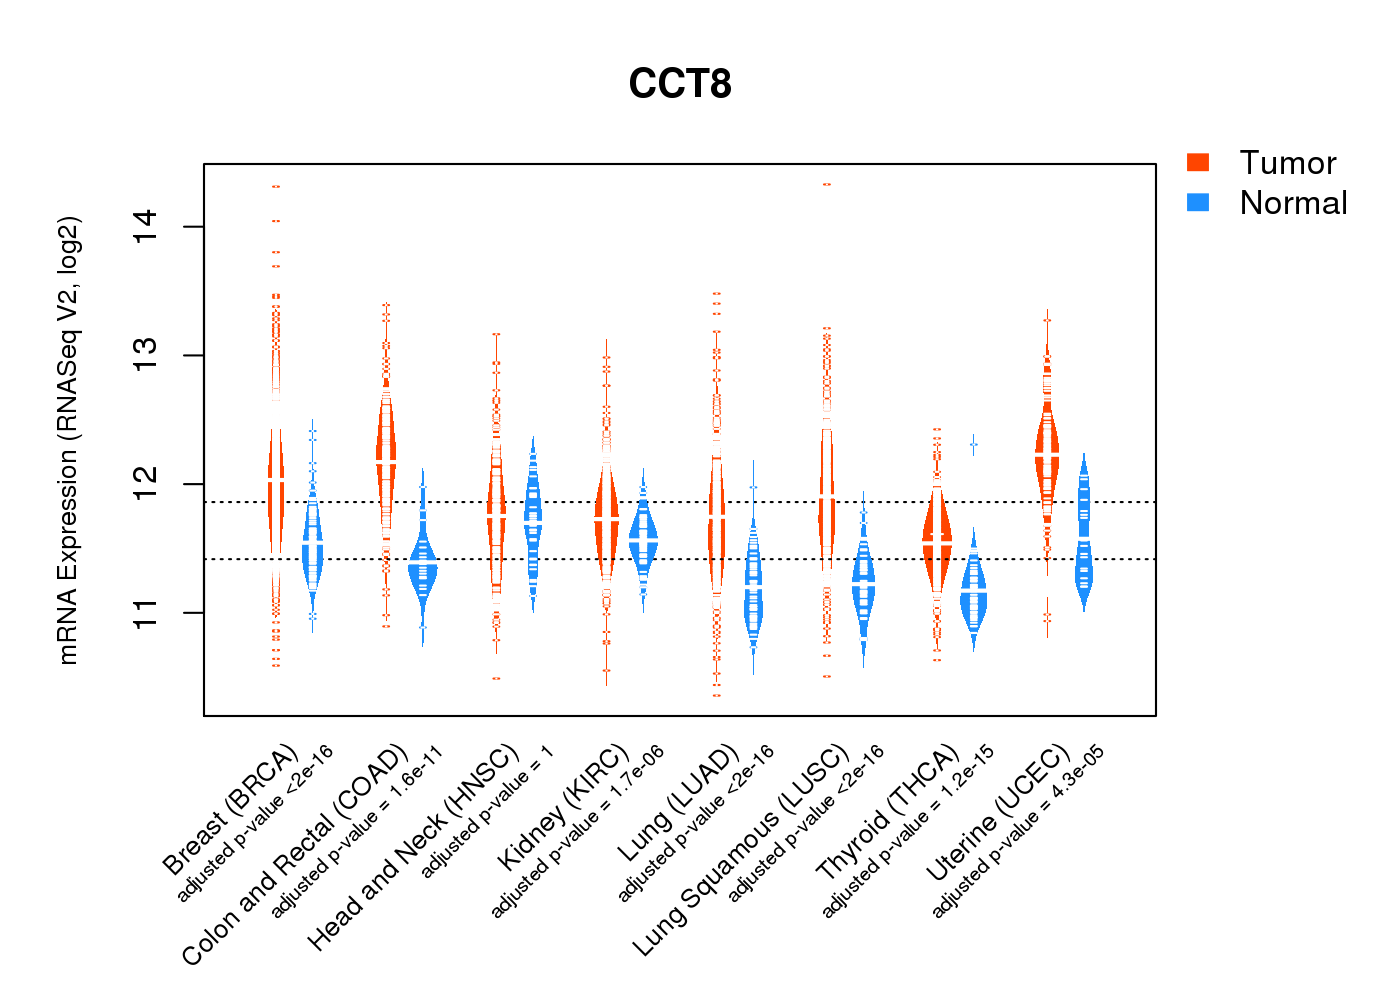
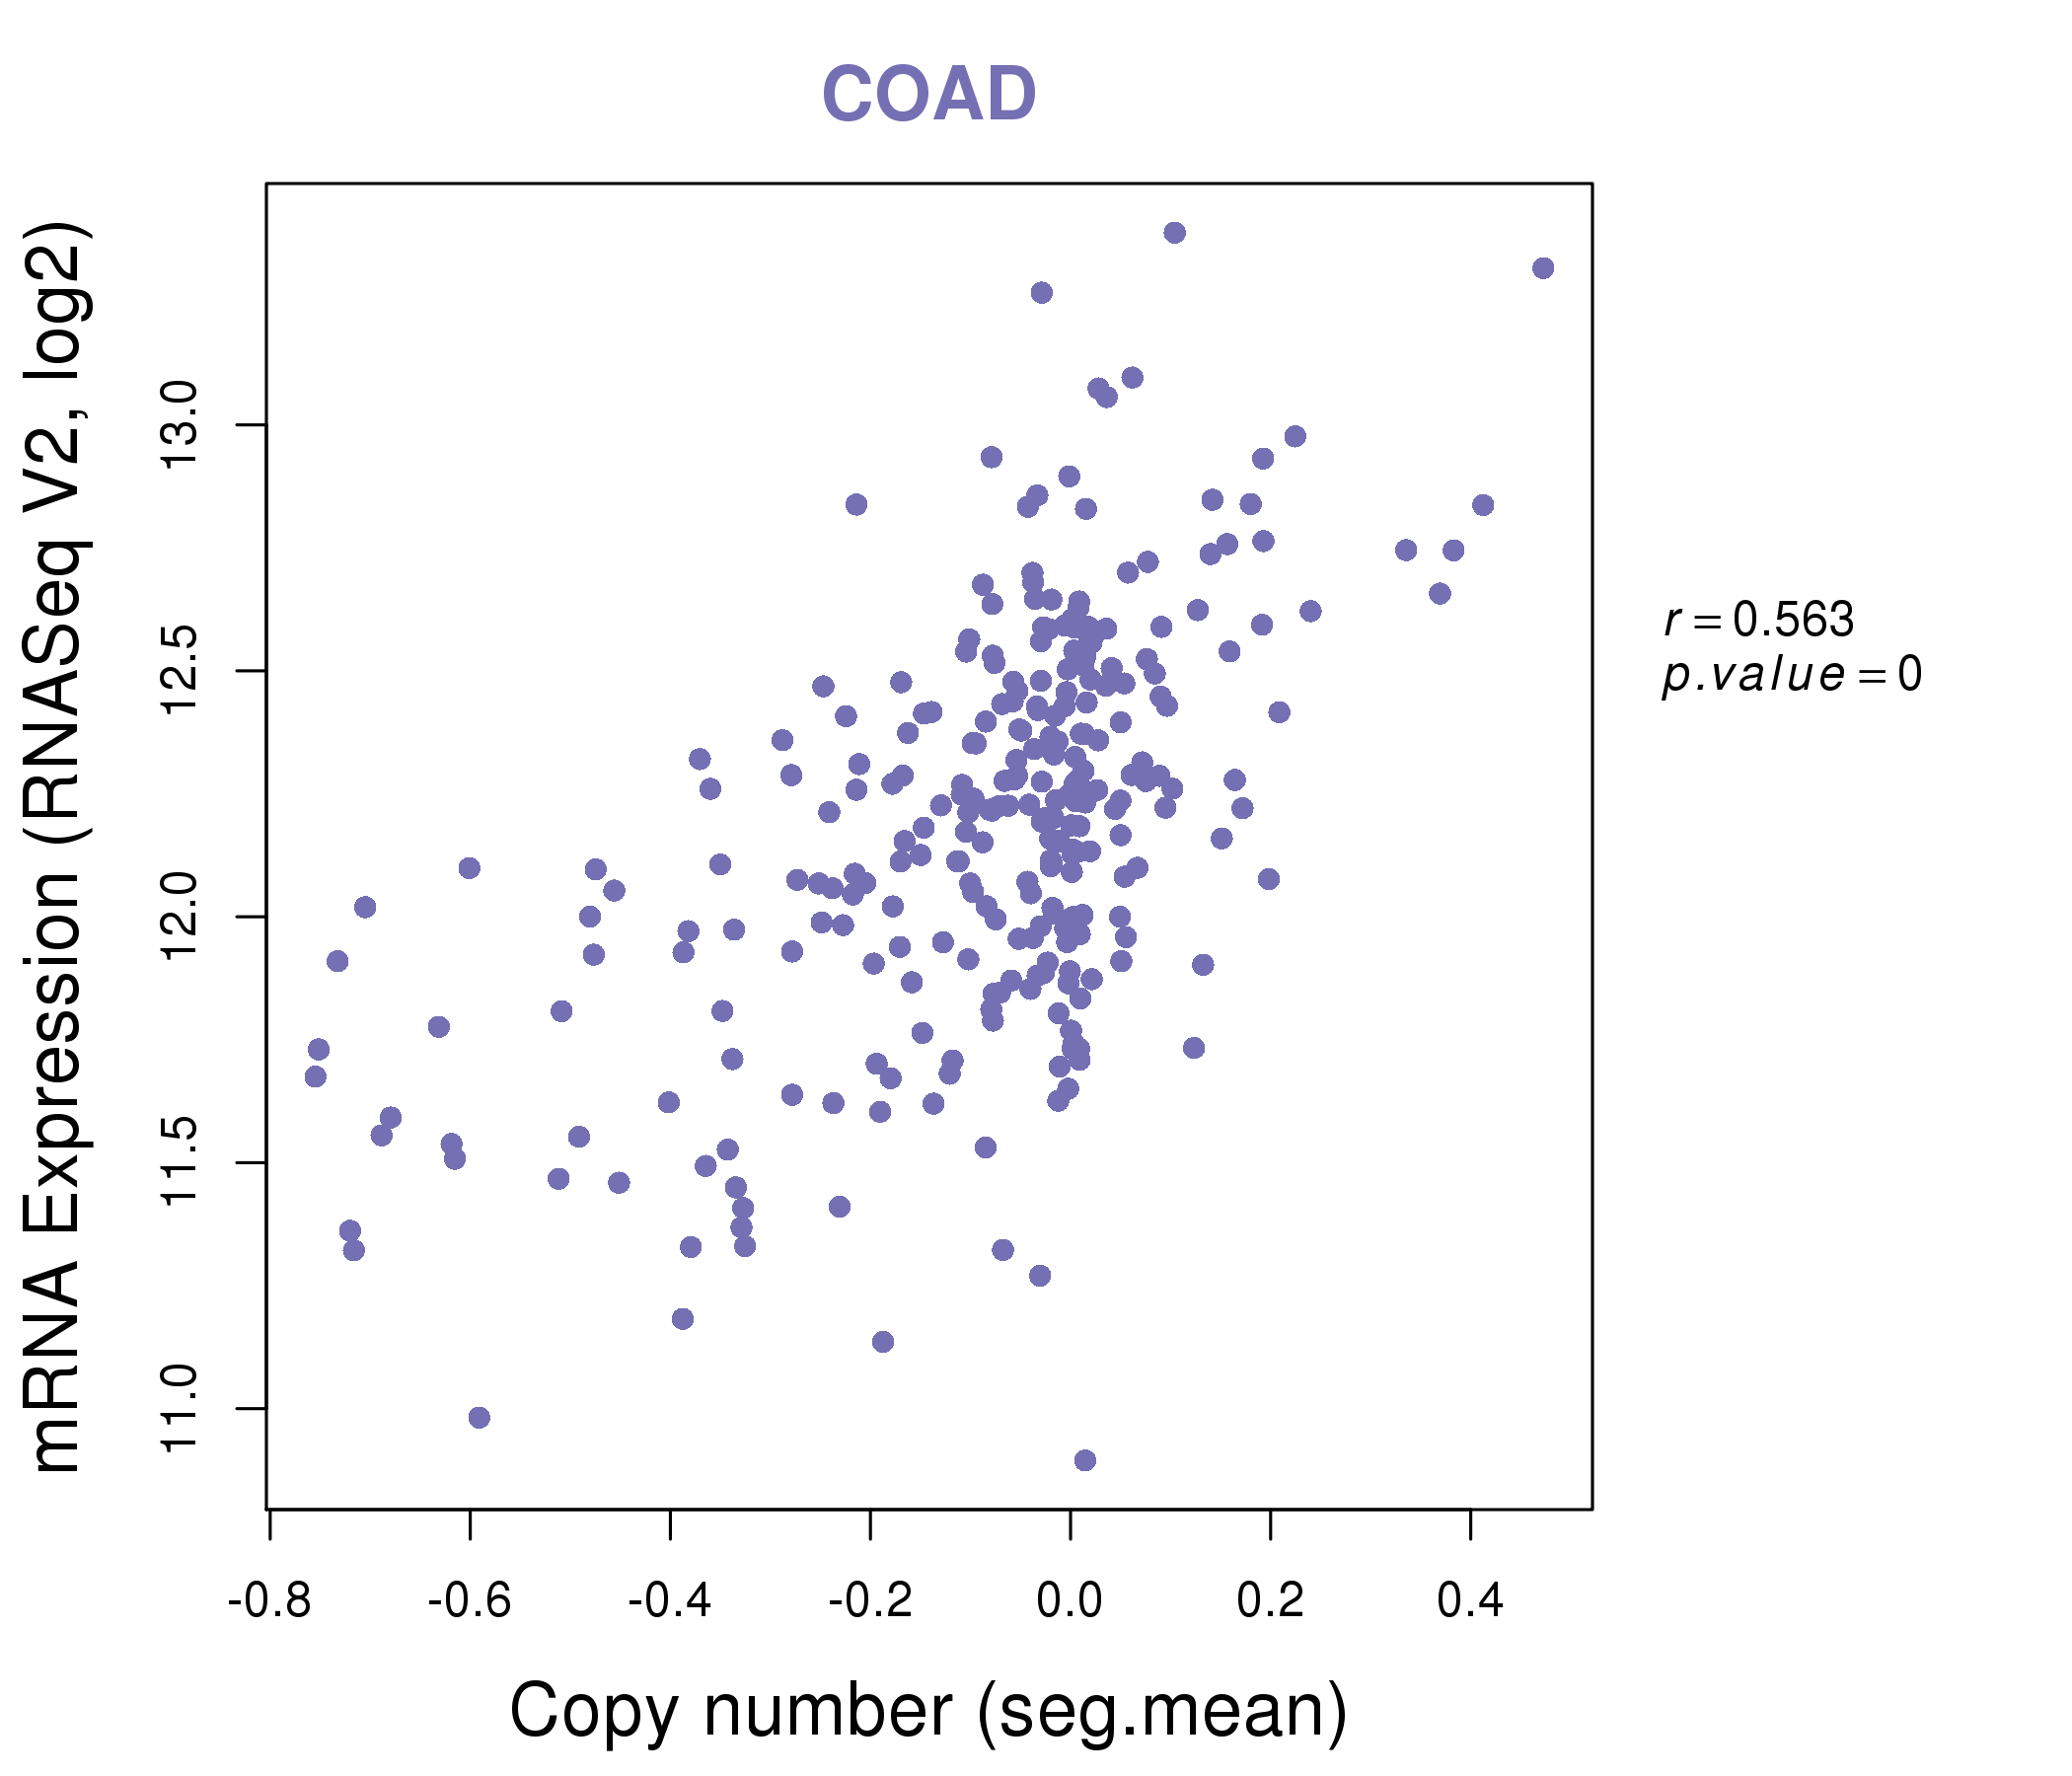
| * Normalized gene expression data of RNASeqV2 was extracted from TCGA using R package TCGA-Assembler. The URLs of all public data files on TCGA DCC data server were gathered at Jan-05-2015. Only eight cancer types have enough normal control samples for differential expression analysis. (t test, adjusted p<0.05 (using Benjamini-Hochberg FDR)) |
 |
| Top |
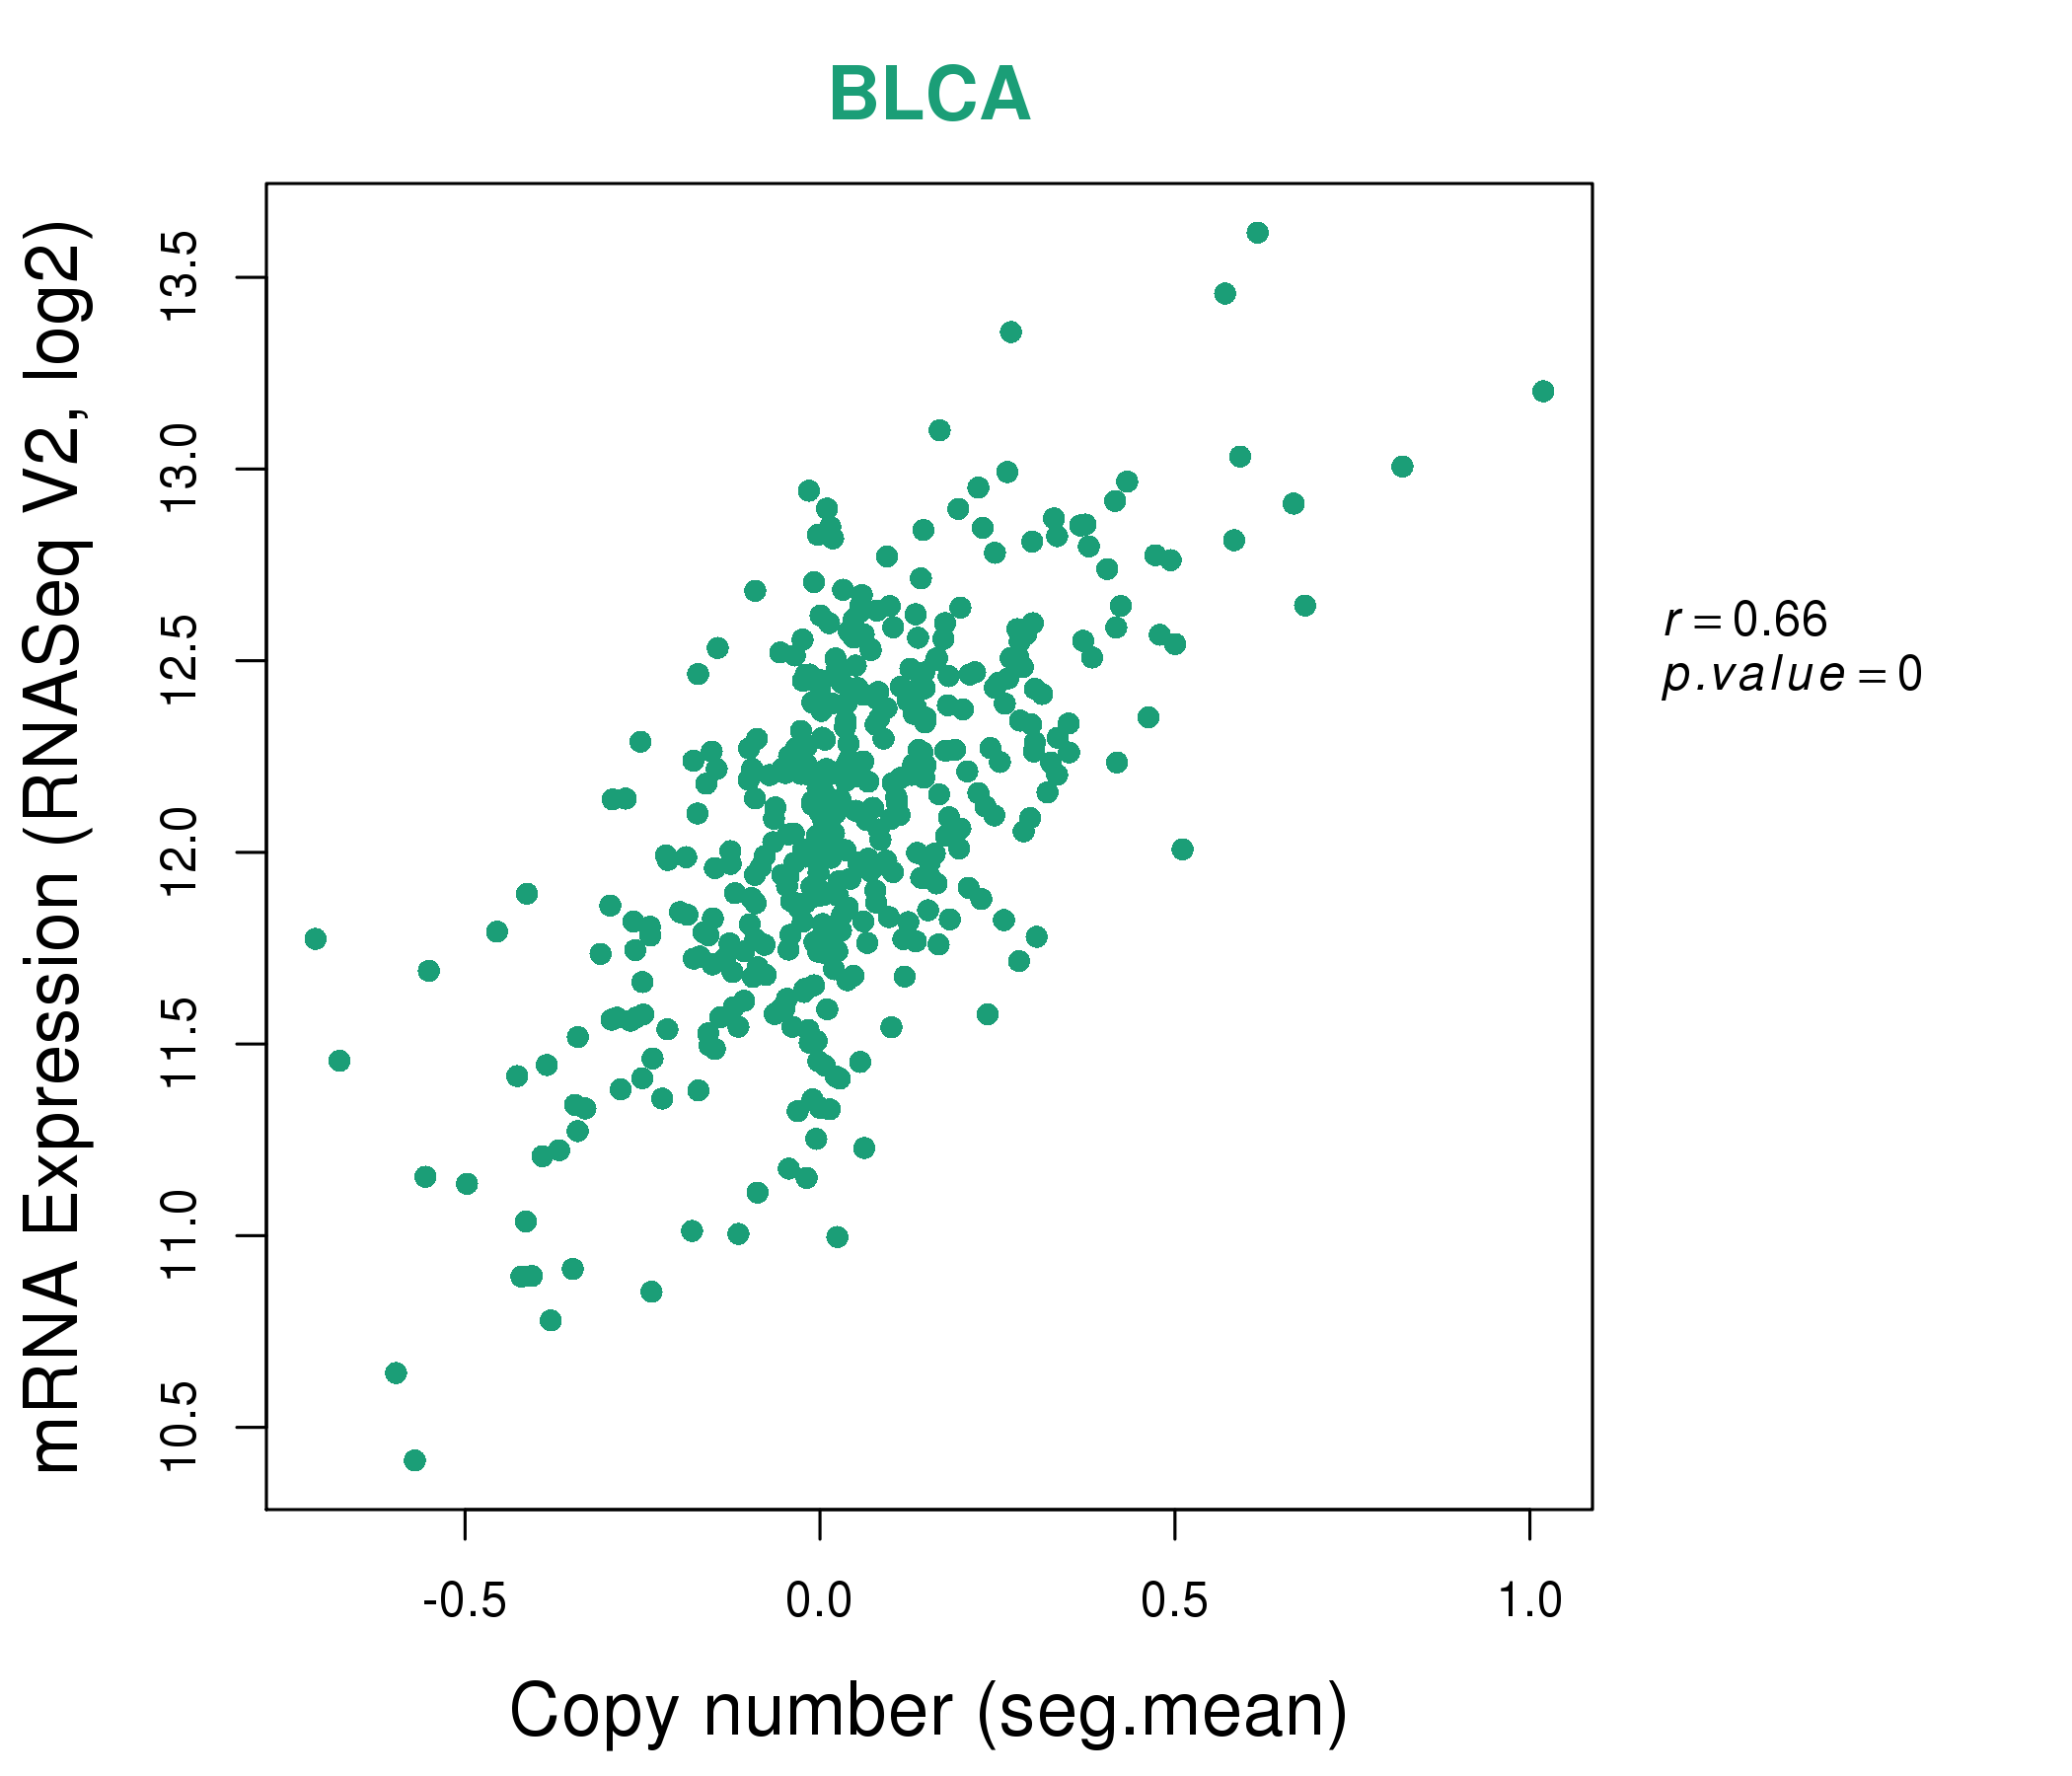
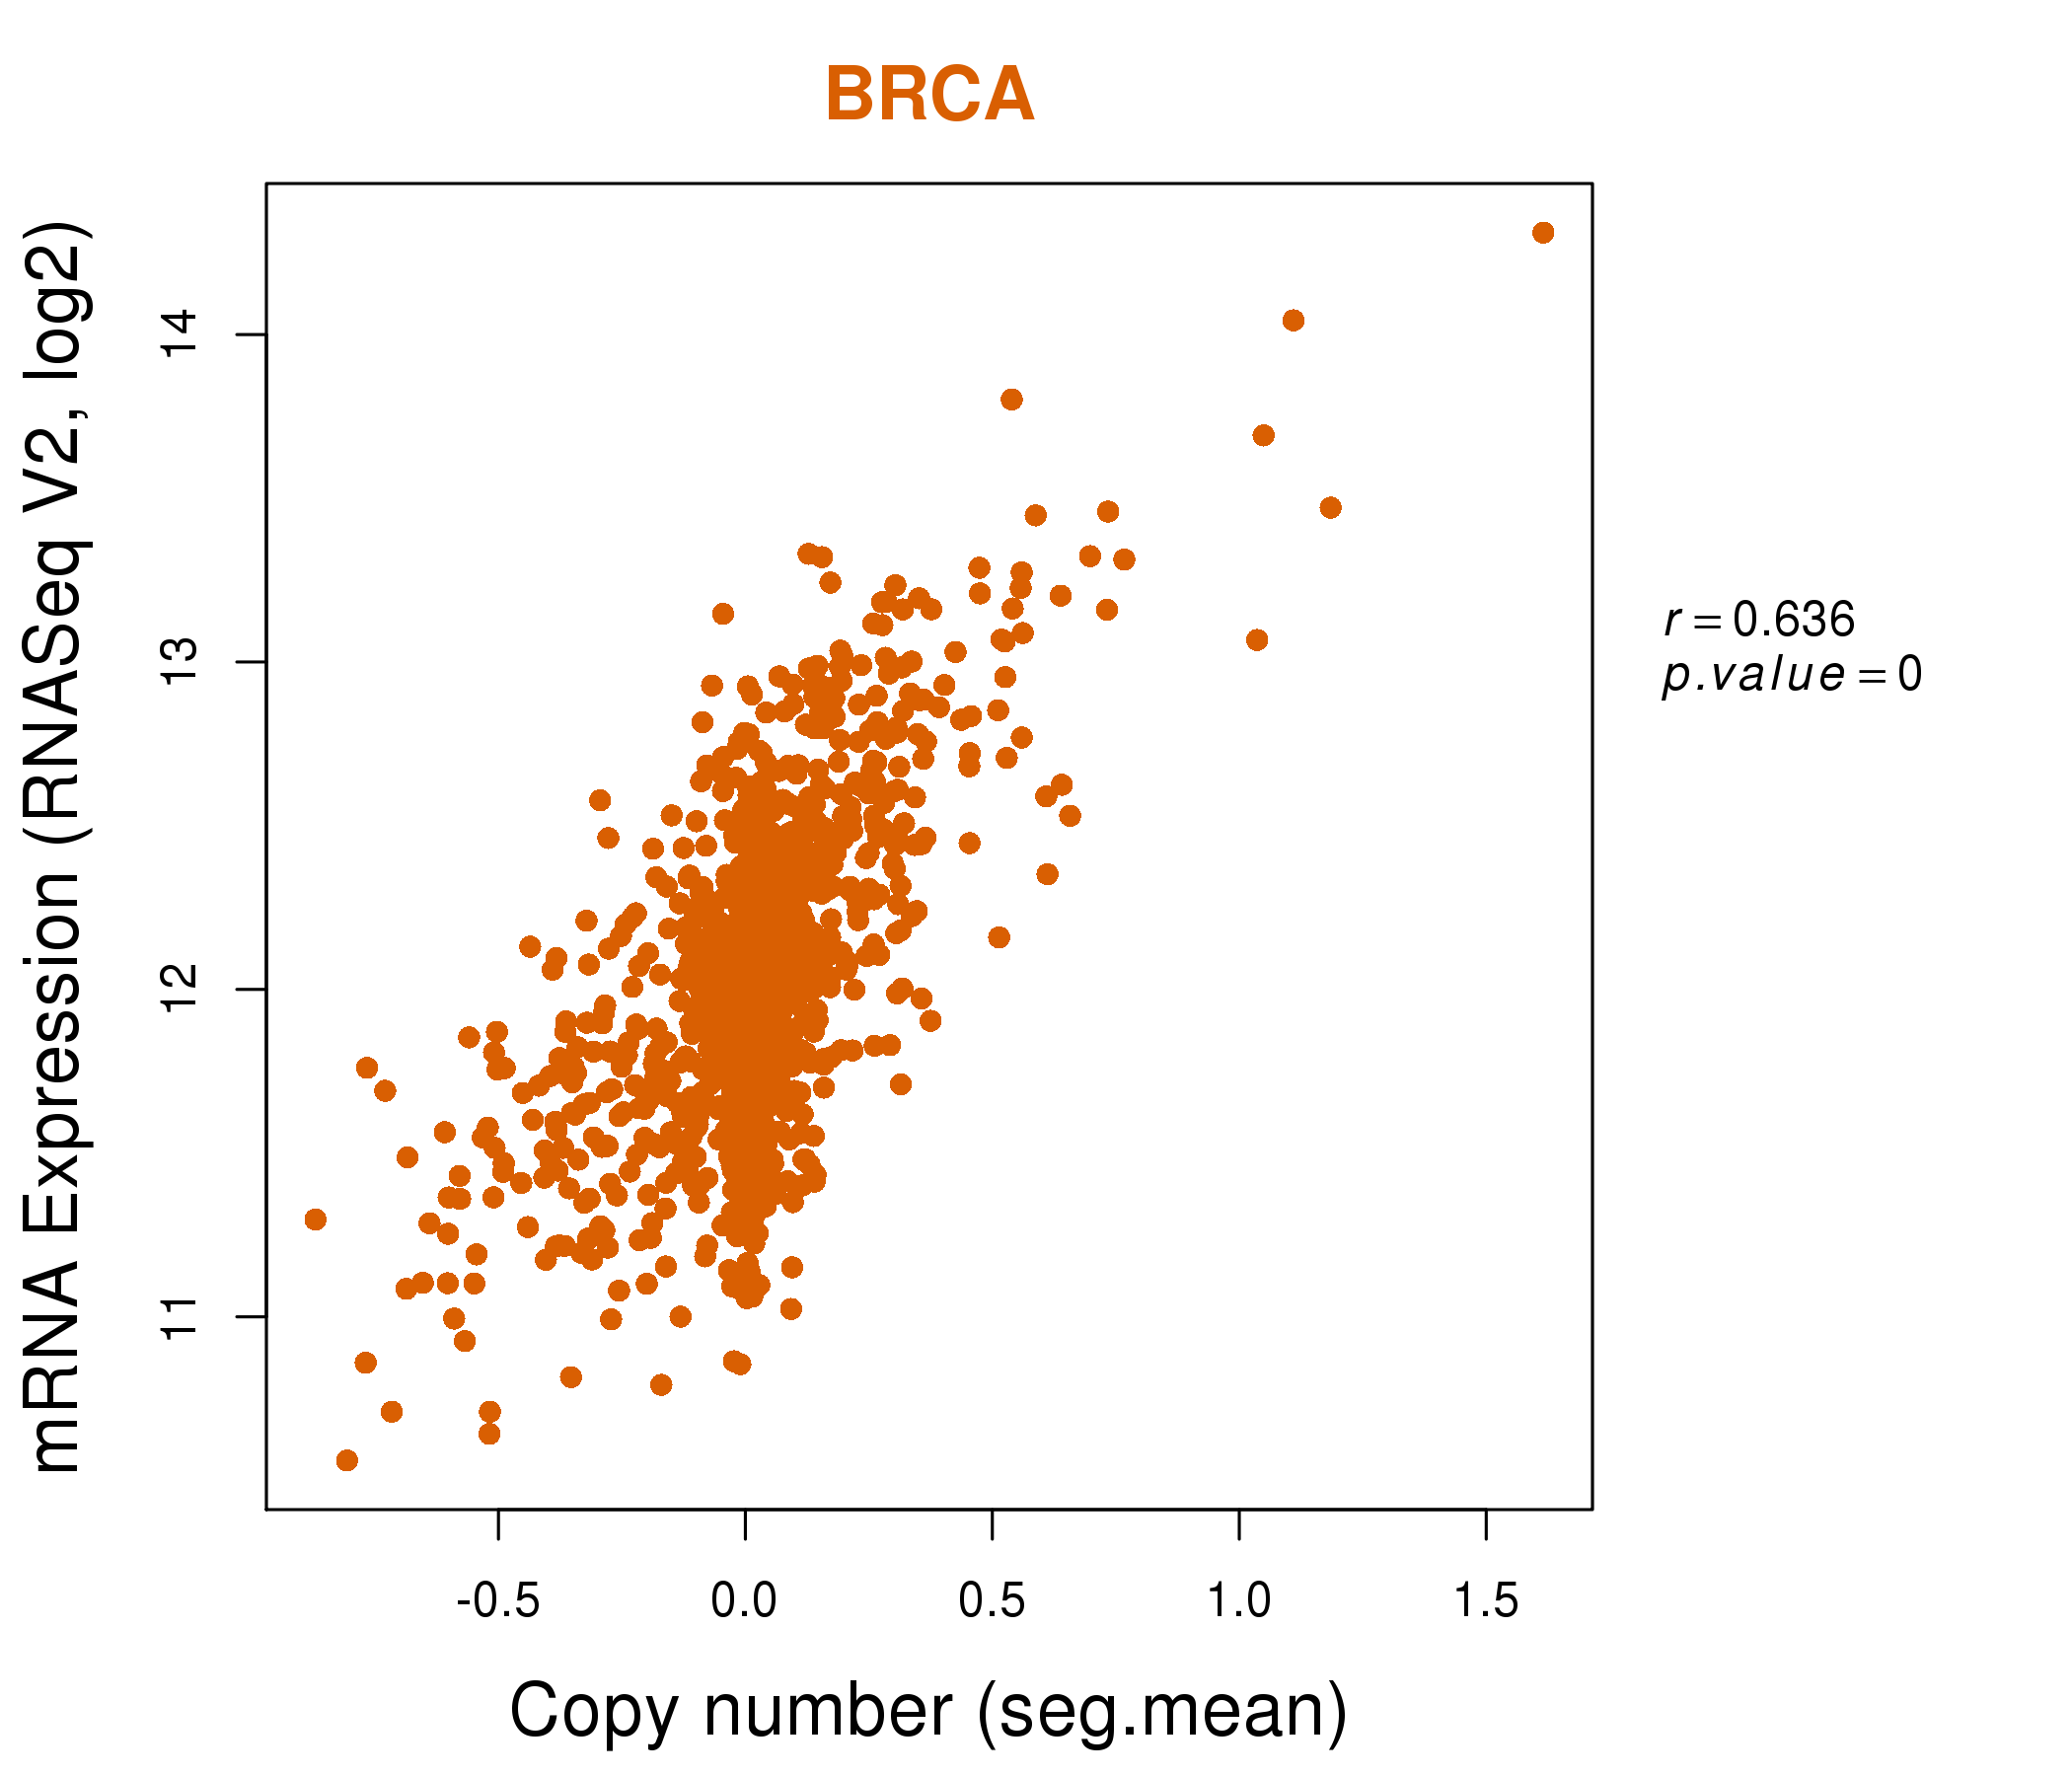
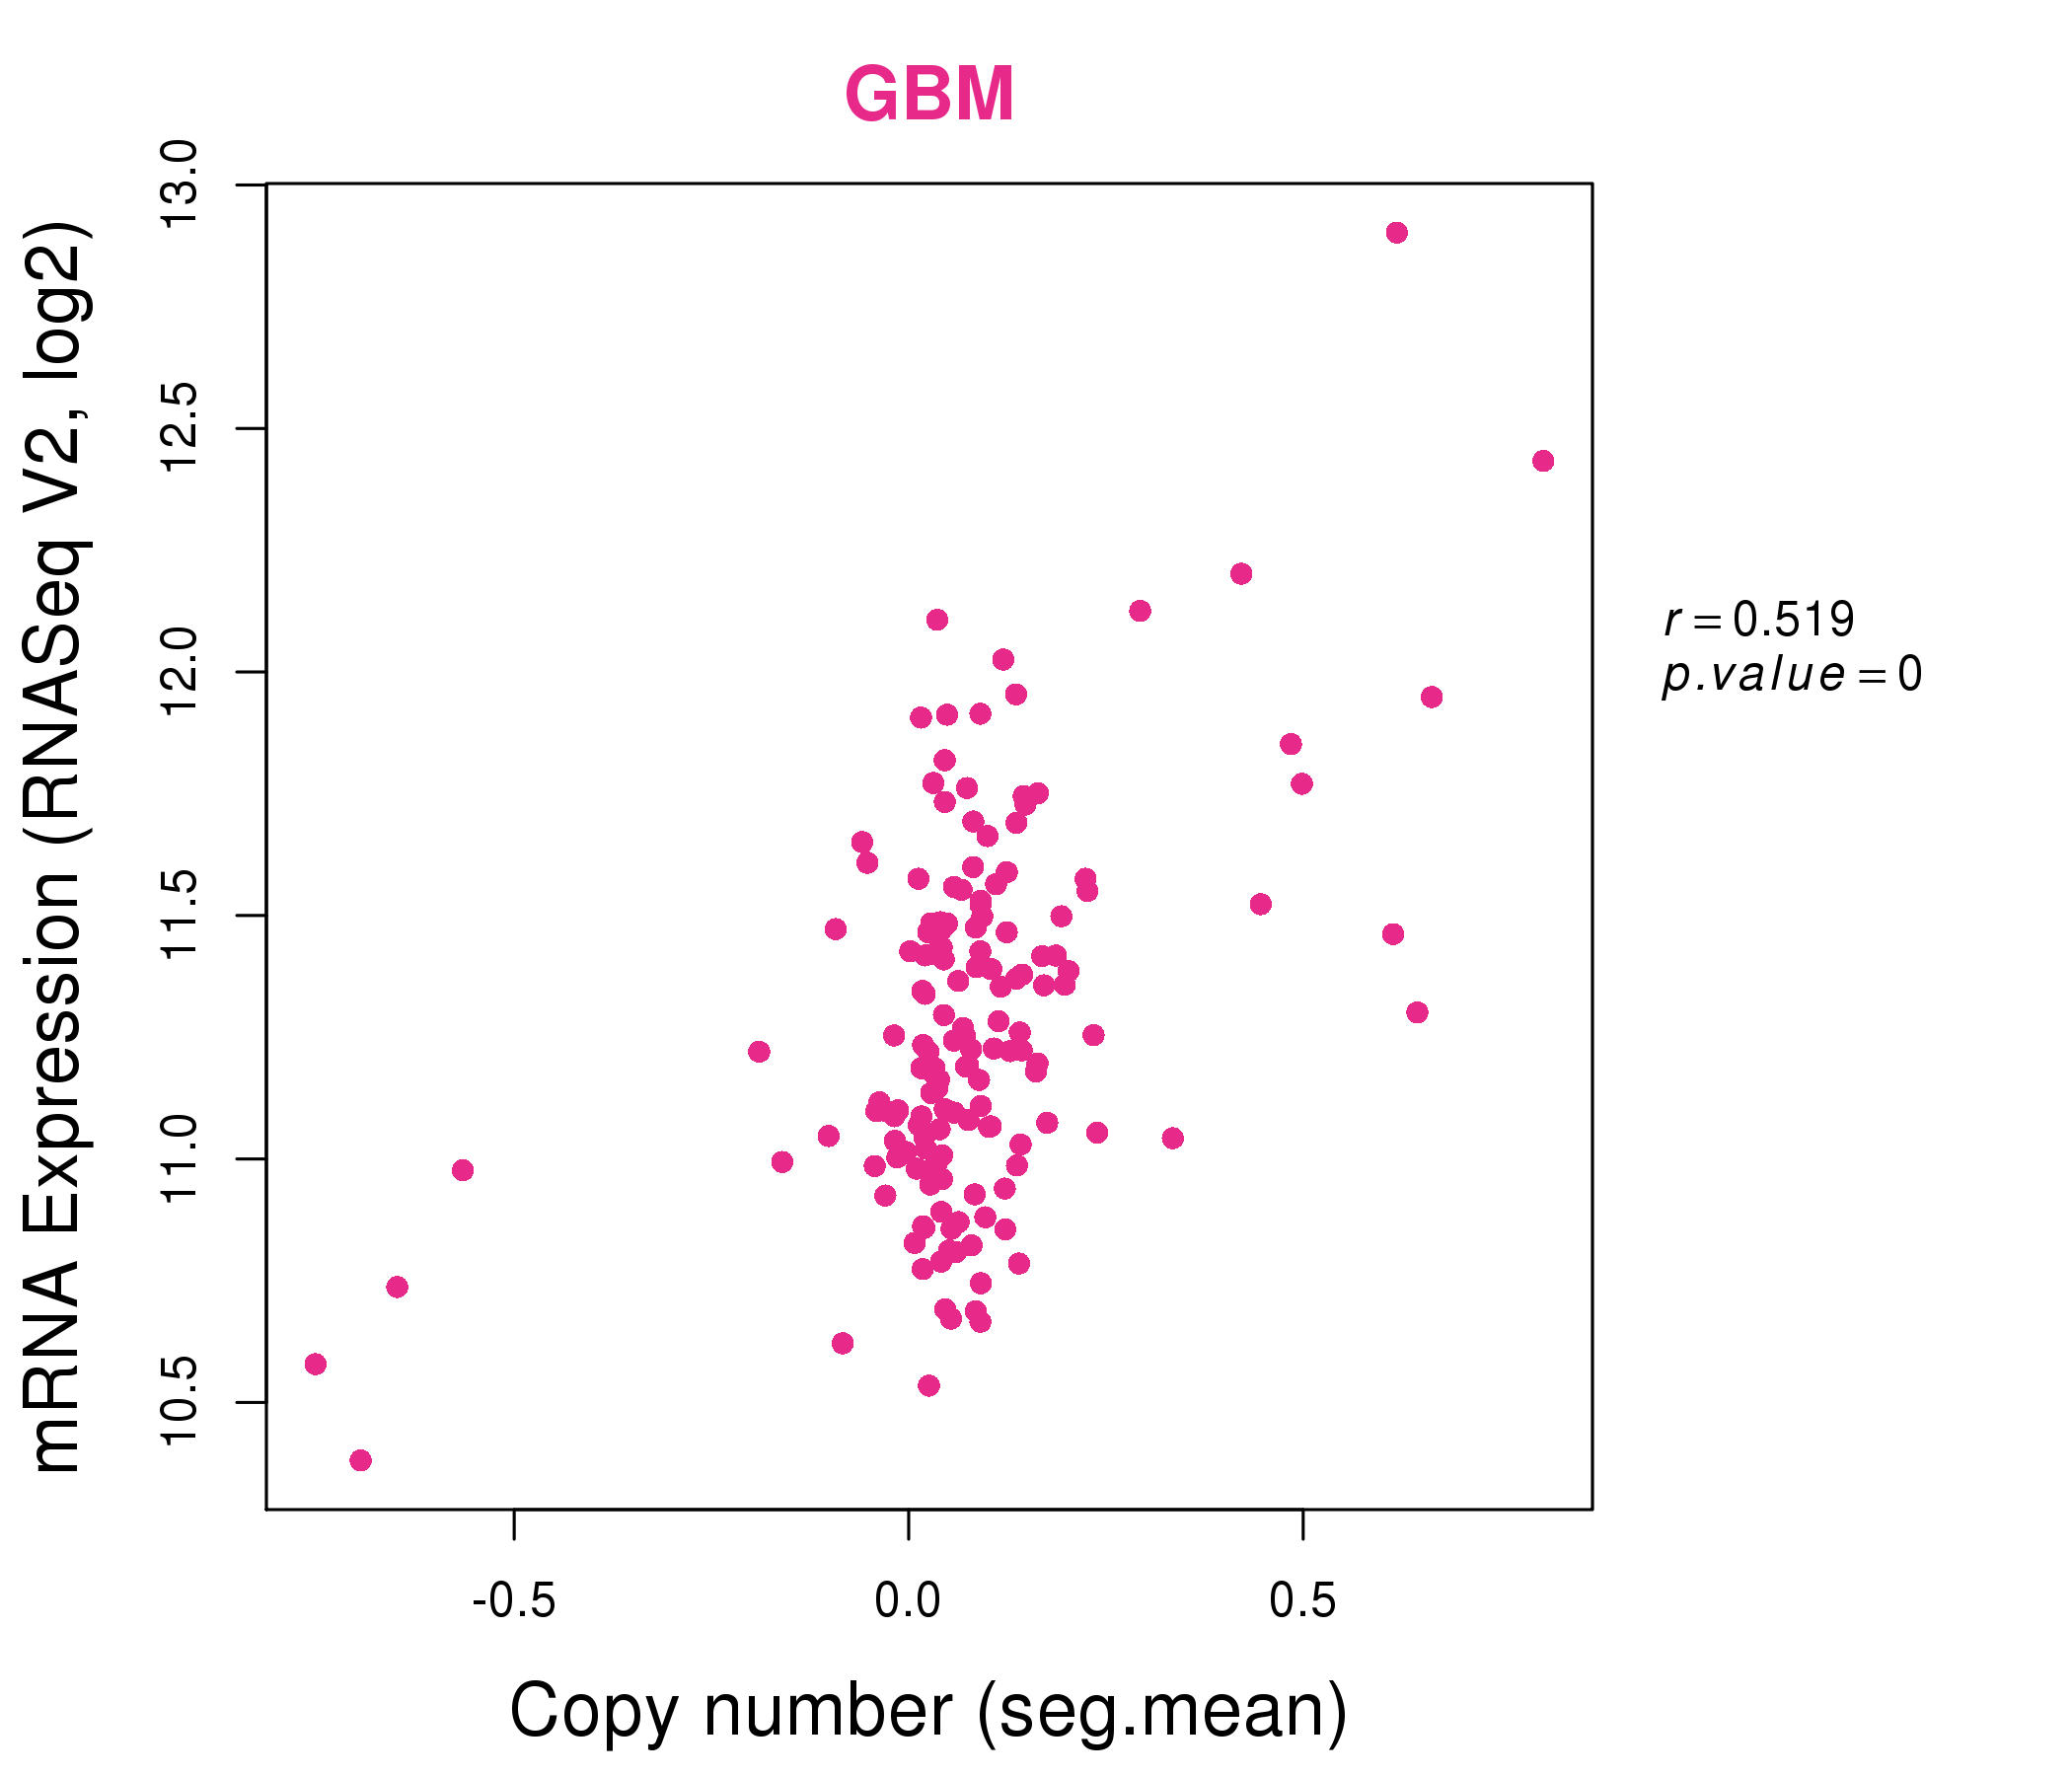
| * This plots show the correlation between CNV and gene expression. |
: Open all plots for all cancer types
 |
|
 |
|
| Top |
| Gene-Gene Network Information |
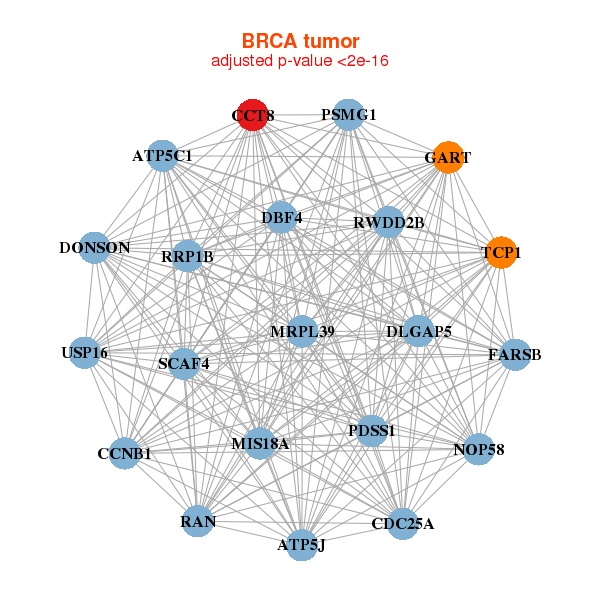
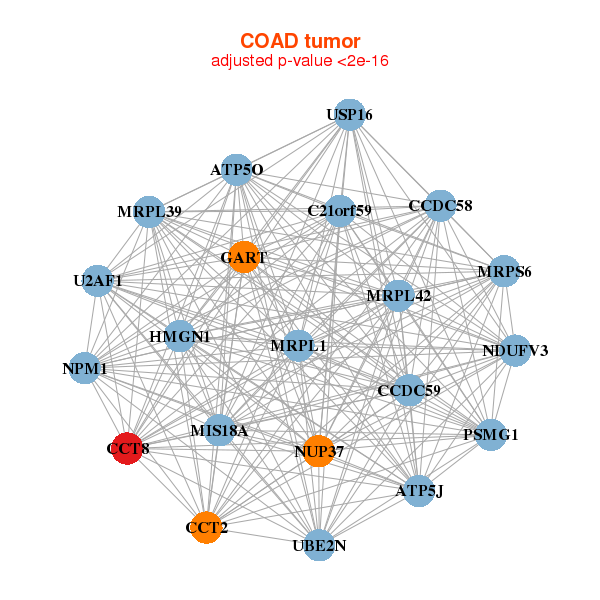
| * Co-Expression network figures were drawn using R package igraph. Only the top 20 genes with the highest correlations were shown. Red circle: input gene, orange circle: cell metabolism gene, sky circle: other gene |
: Open all plots for all cancer types
 |
|
| ATP5C1,ATP5J,MIS18A,CCNB1,CCT8,CDC25A,DBF4, DLGAP5,DONSON,FARSB,GART,MRPL39,NOP58,PDSS1, PSMG1,RAN,RRP1B,RWDD2B,SCAF4,TCP1,USP16 | ACP1,BTF3,CCT4,CCT6A,CCT8,CLNS1A,COMMD3, COPZ1,DAP3,DENR,DPH5,FARSB,GTF2F2,HSP90AB1, MRPL3,NACA,NPM1,OLA1,PA2G4,RNF114,TMEM5 |
 |
|
| ATP5J,ATP5O,MIS18A,C21orf59,CCDC58,CCDC59,CCT2, CCT8,GART,HMGN1,MRPL1,MRPL39,MRPL42,MRPS6, NDUFV3,NPM1,NUP37,PSMG1,U2AF1,UBE2N,USP16 | ALG8,C1QBP,CCT2,CCT5,CCT6A,CCT8,EIF4A1, EIF4A3,FAM136A,FARSB,HSPD1,IMMP1L,KIAA0391,MRPL3, NOL11,PAICS,PHB,PPIA,TMX2,UMPS,VRK1 |
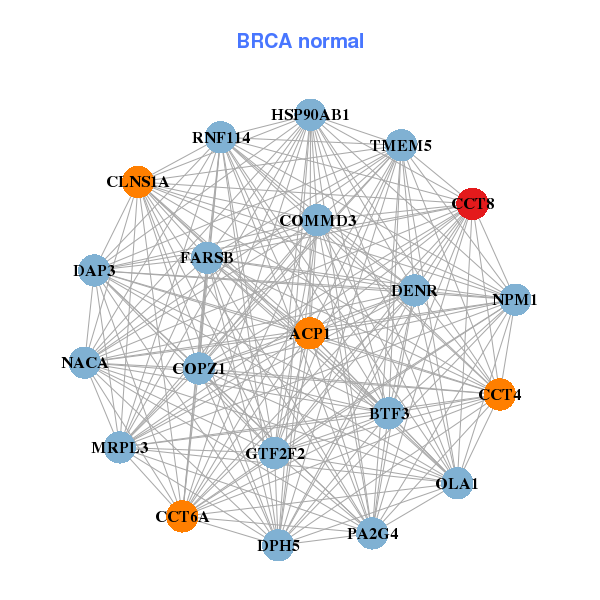
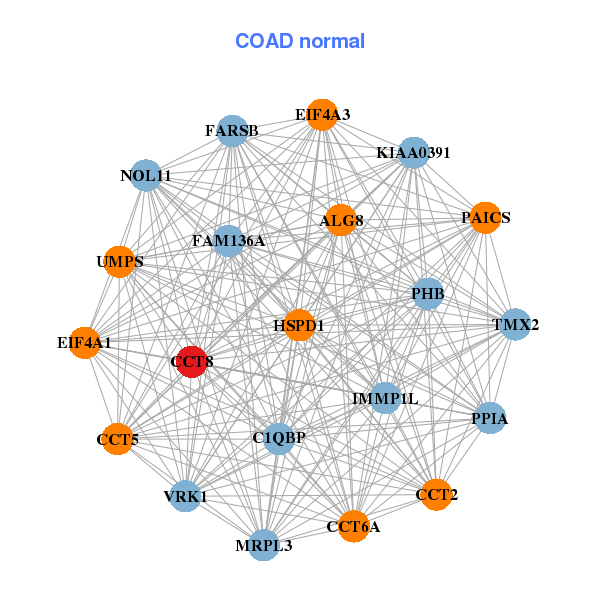
| * Co-Expression network figures were drawn using R package igraph. Only the top 20 genes with the highest correlations were shown. Red circle: input gene, orange circle: cell metabolism gene, sky circle: other gene |
: Open all plots for all cancer types
| Top |
: Open all interacting genes' information including KEGG pathway for all interacting genes from DAVID
| Top |
| Pharmacological Information for CCT8 |
| There's no related Drug. |
| Top |
| Cross referenced IDs for CCT8 |
| * We obtained these cross-references from Uniprot database. It covers 150 different DBs, 18 categories. http://www.uniprot.org/help/cross_references_section |
: Open all cross reference information
|
Copyright © 2016-Present - The Univsersity of Texas Health Science Center at Houston @ |