|
|||||||||||||||||||||||||||||||||||||||||||||||||||||||||||||||||||||||||||||||||||||||||||||||||||||||||||||||||||||||||||||||||||||||||||||||||||||||||||||||||||||||||||||||||||||||||||||||||||||||||||||||||||||||||||||||||||||||||||||||||||||||||||||||||||||||||||||||||||||||||||||||||||||||||||||||||||||||||||||||||||||||||||||||||||||||||||||||
| |
| Phenotypic Information (metabolism pathway, cancer, disease, phenome) |
| |
| |
| Gene-Gene Network Information: Co-Expression Network, Interacting Genes & KEGG |
| |
|


| Gene Summary for MTHFD2 |
| Basic gene info. | Gene symbol | MTHFD2 |
| Gene name | methylenetetrahydrofolate dehydrogenase (NADP+ dependent) 2, methenyltetrahydrofolate cyclohydrolase | |
| Synonyms | NMDMC | |
| Cytomap | UCSC genome browser: 2p13.1 | |
| Genomic location | chr2 :74425689-74442424 | |
| Type of gene | protein-coding | |
| RefGenes | NM_006636.3, NR_027405.1,NM_001040409.1, | |
| Ensembl id | ENSG00000065911 | |
| Description | NAD-dependent methylene tetrahydrofolate dehydrogenase cyclohydrolasebifunctional methylenetetrahydrofolate dehydrogenase/cyclohydrolase, mitochondrial | |
| Modification date | 20141207 | |
| dbXrefs | MIM : 604887 | |
| HGNC : HGNC | ||
| HPRD : 05351 | ||
| Protein | UniProt: go to UniProt's Cross Reference DB Table | |
| Expression | CleanEX: HS_MTHFD2 | |
| BioGPS: 10797 | ||
| Gene Expression Atlas: ENSG00000065911 | ||
| The Human Protein Atlas: ENSG00000065911 | ||
| Pathway | NCI Pathway Interaction Database: MTHFD2 | |
| KEGG: MTHFD2 | ||
| REACTOME: MTHFD2 | ||
| ConsensusPathDB | ||
| Pathway Commons: MTHFD2 | ||
| Metabolism | MetaCyc: MTHFD2 | |
| HUMANCyc: MTHFD2 | ||
| Regulation | Ensembl's Regulation: ENSG00000065911 | |
| miRBase: chr2 :74,425,689-74,442,424 | ||
| TargetScan: NM_006636 | ||
| cisRED: ENSG00000065911 | ||
| Context | iHOP: MTHFD2 | |
| cancer metabolism search in PubMed: MTHFD2 | ||
| UCL Cancer Institute: MTHFD2 | ||
| Assigned class in ccmGDB | A - This gene has a literature evidence and it belongs to cancer gene. | |
| References showing role of MTHFD2 in cancer cell metabolism | 1. Llanos AA, Dumitrescu RG, Brasky TM, Liu Z, Mason JB, et al. (2014) Relationships among Folate, Alcohol Consumption, Gene Variants in One-Carbon Metabolism, and p16INK4a Methylation and Expression in Healthy Breast Tissues. Carcinogenesis: bgu219. go to article | |
| Top |
| Phenotypic Information for MTHFD2(metabolism pathway, cancer, disease, phenome) |
| Cancer | CGAP: MTHFD2 |
| Familial Cancer Database: MTHFD2 | |
| * This gene is included in those cancer gene databases. |
|
|
|
|
|
|
| |||||||||||||||||||||||||||||||||||||||||||||||||||||||||||||||||||||||||||||||||||||||||||||||||||||||||||||||||||||||||||||||||||||||||||||||||||||||||||||||||||||||||||||||||||||||||||||||||||||||||||||||||||||||||||||||||||||||||||||||||||||||||||||||||||||||||||||||||||||||||||||||||||||||||||||||||||||||||||||||||||||||||||||||||||||||||
Oncogene 1 | Significant driver gene in | ||||||||||||||||||||||||||||||||||||||||||||||||||||||||||||||||||||||||||||||||||||||||||||||||||||||||||||||||||||||||||||||||||||||||||||||||||||||||||||||||||||||||||||||||||||||||||||||||||||||||||||||||||||||||||||||||||||||||||||||||||||||||||||||||||||||||||||||||||||||||||||||||||||||||||||||||||||||||||||||||||||||||||||||||||||||||||||||
| cf) number; DB name 1 Oncogene; http://nar.oxfordjournals.org/content/35/suppl_1/D721.long, 2 Tumor Suppressor gene; https://bioinfo.uth.edu/TSGene/, 3 Cancer Gene Census; http://www.nature.com/nrc/journal/v4/n3/abs/nrc1299.html, 4 CancerGenes; http://nar.oxfordjournals.org/content/35/suppl_1/D721.long, 5 Network of Cancer Gene; http://ncg.kcl.ac.uk/index.php, 1Therapeutic Vulnerabilities in Cancer; http://cbio.mskcc.org/cancergenomics/statius/ |
| KEGG_GLYOXYLATE_AND_DICARBOXYLATE_METABOLISM | |
| OMIM | |
| Orphanet | |
| Disease | KEGG Disease: MTHFD2 |
| MedGen: MTHFD2 (Human Medical Genetics with Condition) | |
| ClinVar: MTHFD2 | |
| Phenotype | MGI: MTHFD2 (International Mouse Phenotyping Consortium) |
| PhenomicDB: MTHFD2 | |
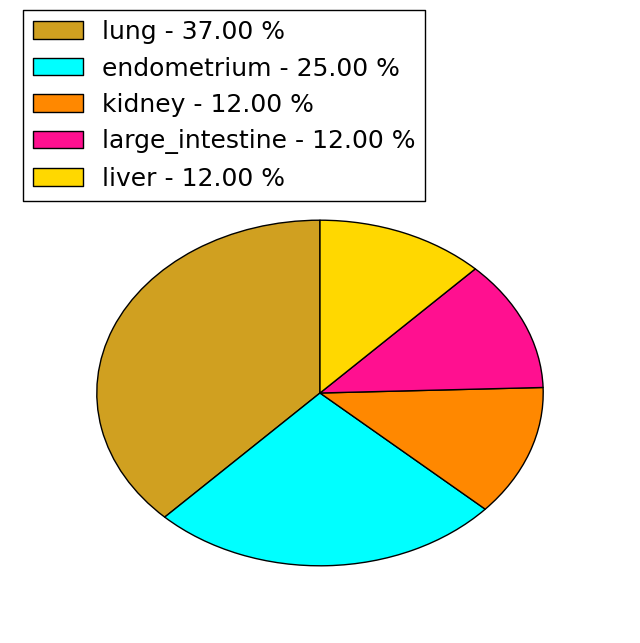
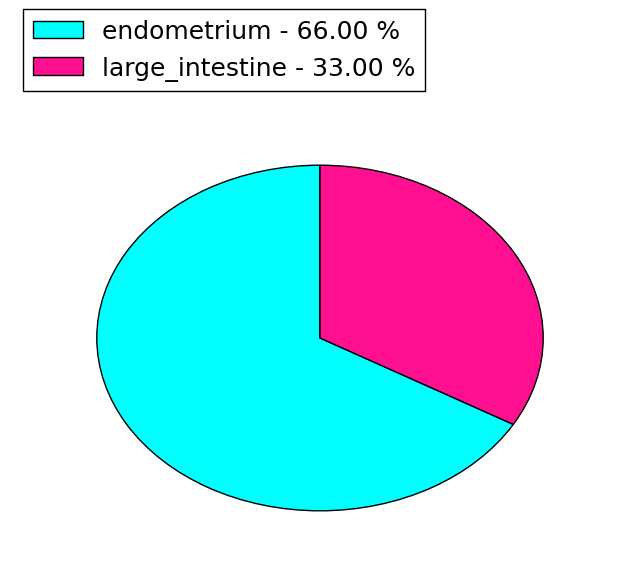
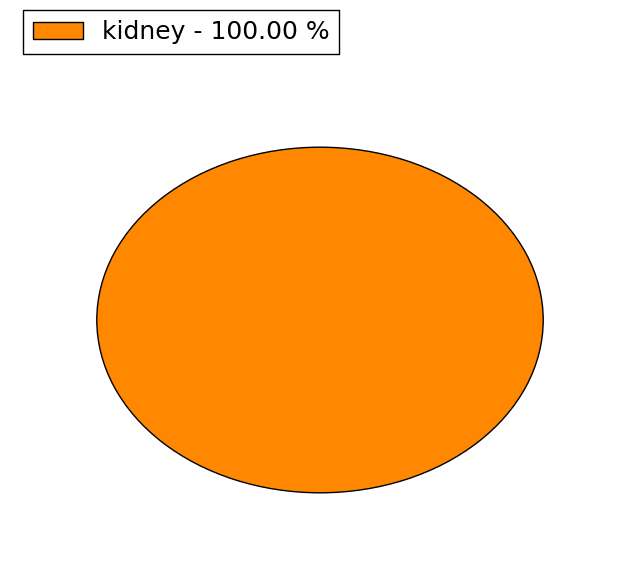
| Mutations for MTHFD2 |
| * Under tables are showing count per each tissue to give us broad intuition about tissue specific mutation patterns.You can go to the detailed page for each mutation database's web site. |
| There's no structural variation information in COSMIC data for this gene. |
| * From mRNA Sanger sequences, Chitars2.0 arranged chimeric transcripts. This table shows MTHFD2 related fusion information. |
| ID | Head Gene | Tail Gene | Accession | Gene_a | qStart_a | qEnd_a | Chromosome_a | tStart_a | tEnd_a | Gene_a | qStart_a | qEnd_a | Chromosome_a | tStart_a | tEnd_a |
| AW837123 | FNDC3A | 20 | 171 | 13 | 49766251 | 49766403 | MTHFD2 | 164 | 184 | 2 | 74427581 | 74427601 | |
| Top |
| Mutation type/ Tissue ID | brca | cns | cerv | endome | haematopo | kidn | Lintest | liver | lung | ns | ovary | pancre | prost | skin | stoma | thyro | urina | |||
| Total # sample | 1 | |||||||||||||||||||
| GAIN (# sample) | 1 | |||||||||||||||||||
| LOSS (# sample) |
| cf) Tissue ID; Tissue type (1; Breast, 2; Central_nervous_system, 3; Cervix, 4; Endometrium, 5; Haematopoietic_and_lymphoid_tissue, 6; Kidney, 7; Large_intestine, 8; Liver, 9; Lung, 10; NS, 11; Ovary, 12; Pancreas, 13; Prostate, 14; Skin, 15; Stomach, 16; Thyroid, 17; Urinary_tract) |
| Top |
|
 |
| Top |
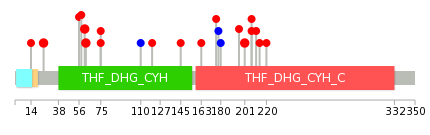
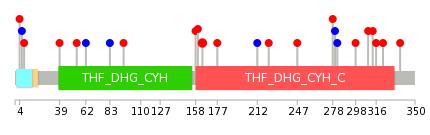
| Stat. for Non-Synonymous SNVs (# total SNVs=16) | (# total SNVs=3) |
 |  |
(# total SNVs=1) | (# total SNVs=0) |
 |
| Top |
| * When you move the cursor on each content, you can see more deailed mutation information on the Tooltip. Those are primary_site,primary_histology,mutation(aa),pubmedID. |
| GRCh37 position | Mutation(aa) | Unique sampleID count |
| chr2:74441223-74441223 | p.G201R | 3 |
| chr2:74435774-74435774 | p.G61E | 2 |
| chr2:74435777-74435777 | p.R62Q | 2 |
| chr2:74441241-74441241 | p.P207A | 2 |
| chr2:74434923-74434923 | p.D25H | 2 |
| chr2:74438867-74438867 | p.? | 2 |
| chr2:74435758-74435758 | p.H56D | 1 |
| chr2:74438899-74438899 | p.I163M | 1 |
| chr2:74435765-74435765 | p.I58S | 1 |
| chr2:74438937-74438937 | p.R176T | 1 |
| Top |
|
 |
| Point Mutation/ Tissue ID | 1 | 2 | 3 | 4 | 5 | 6 | 7 | 8 | 9 | 10 | 11 | 12 | 13 | 14 | 15 | 16 | 17 | 18 | 19 | 20 |
| # sample | 2 | 1 | 3 | 1 | 1 | 1 | 2 | 4 | 1 | 1 | 1 | 5 | ||||||||
| # mutation | 2 | 1 | 3 | 1 | 1 | 1 | 2 | 4 | 1 | 1 | 1 | 5 | ||||||||
| nonsynonymous SNV | 1 | 2 | 1 | 1 | 1 | 2 | 4 | 1 | 1 | 1 | 3 | |||||||||
| synonymous SNV | 1 | 1 | 1 | 2 |
| cf) Tissue ID; Tissue type (1; BLCA[Bladder Urothelial Carcinoma], 2; BRCA[Breast invasive carcinoma], 3; CESC[Cervical squamous cell carcinoma and endocervical adenocarcinoma], 4; COAD[Colon adenocarcinoma], 5; GBM[Glioblastoma multiforme], 6; Glioma Low Grade, 7; HNSC[Head and Neck squamous cell carcinoma], 8; KICH[Kidney Chromophobe], 9; KIRC[Kidney renal clear cell carcinoma], 10; KIRP[Kidney renal papillary cell carcinoma], 11; LAML[Acute Myeloid Leukemia], 12; LUAD[Lung adenocarcinoma], 13; LUSC[Lung squamous cell carcinoma], 14; OV[Ovarian serous cystadenocarcinoma ], 15; PAAD[Pancreatic adenocarcinoma], 16; PRAD[Prostate adenocarcinoma], 17; SKCM[Skin Cutaneous Melanoma], 18:STAD[Stomach adenocarcinoma], 19:THCA[Thyroid carcinoma], 20:UCEC[Uterine Corpus Endometrial Carcinoma]) |
| Top |
| * We represented just top 10 SNVs. When you move the cursor on each content, you can see more deailed mutation information on the Tooltip. Those are primary_site, primary_histology, mutation(aa), pubmedID. |
| Genomic Position | Mutation(aa) | Unique sampleID count |
| chr2:74435777 | p.R164Q | 2 |
| chr2:74425790 | p.R54W | 1 |
| chr2:74437170 | p.G313D | 1 |
| chr2:74432845 | p.A62A | 1 |
| chr2:74438395 | p.T316I | 1 |
| chr2:74432890 | p.S83S | 1 |
| chr2:74438937 | p.K322N | 1 |
| chr2:74432916 | p.V95M | 1 |
| chr2:74438944 | p.R337Q | 1 |
| chr2:74432979 | p.H158D | 1 |
| * Copy number data were extracted from TCGA using R package TCGA-Assembler. The URLs of all public data files on TCGA DCC data server were gathered on Jan-05-2015. Function ProcessCNAData in TCGA-Assembler package was used to obtain gene-level copy number value which is calculated as the average copy number of the genomic region of a gene. |
 |
| cf) Tissue ID[Tissue type]: BLCA[Bladder Urothelial Carcinoma], BRCA[Breast invasive carcinoma], CESC[Cervical squamous cell carcinoma and endocervical adenocarcinoma], COAD[Colon adenocarcinoma], GBM[Glioblastoma multiforme], Glioma Low Grade, HNSC[Head and Neck squamous cell carcinoma], KICH[Kidney Chromophobe], KIRC[Kidney renal clear cell carcinoma], KIRP[Kidney renal papillary cell carcinoma], LAML[Acute Myeloid Leukemia], LUAD[Lung adenocarcinoma], LUSC[Lung squamous cell carcinoma], OV[Ovarian serous cystadenocarcinoma ], PAAD[Pancreatic adenocarcinoma], PRAD[Prostate adenocarcinoma], SKCM[Skin Cutaneous Melanoma], STAD[Stomach adenocarcinoma], THCA[Thyroid carcinoma], UCEC[Uterine Corpus Endometrial Carcinoma] |
| Top |
| Gene Expression for MTHFD2 |
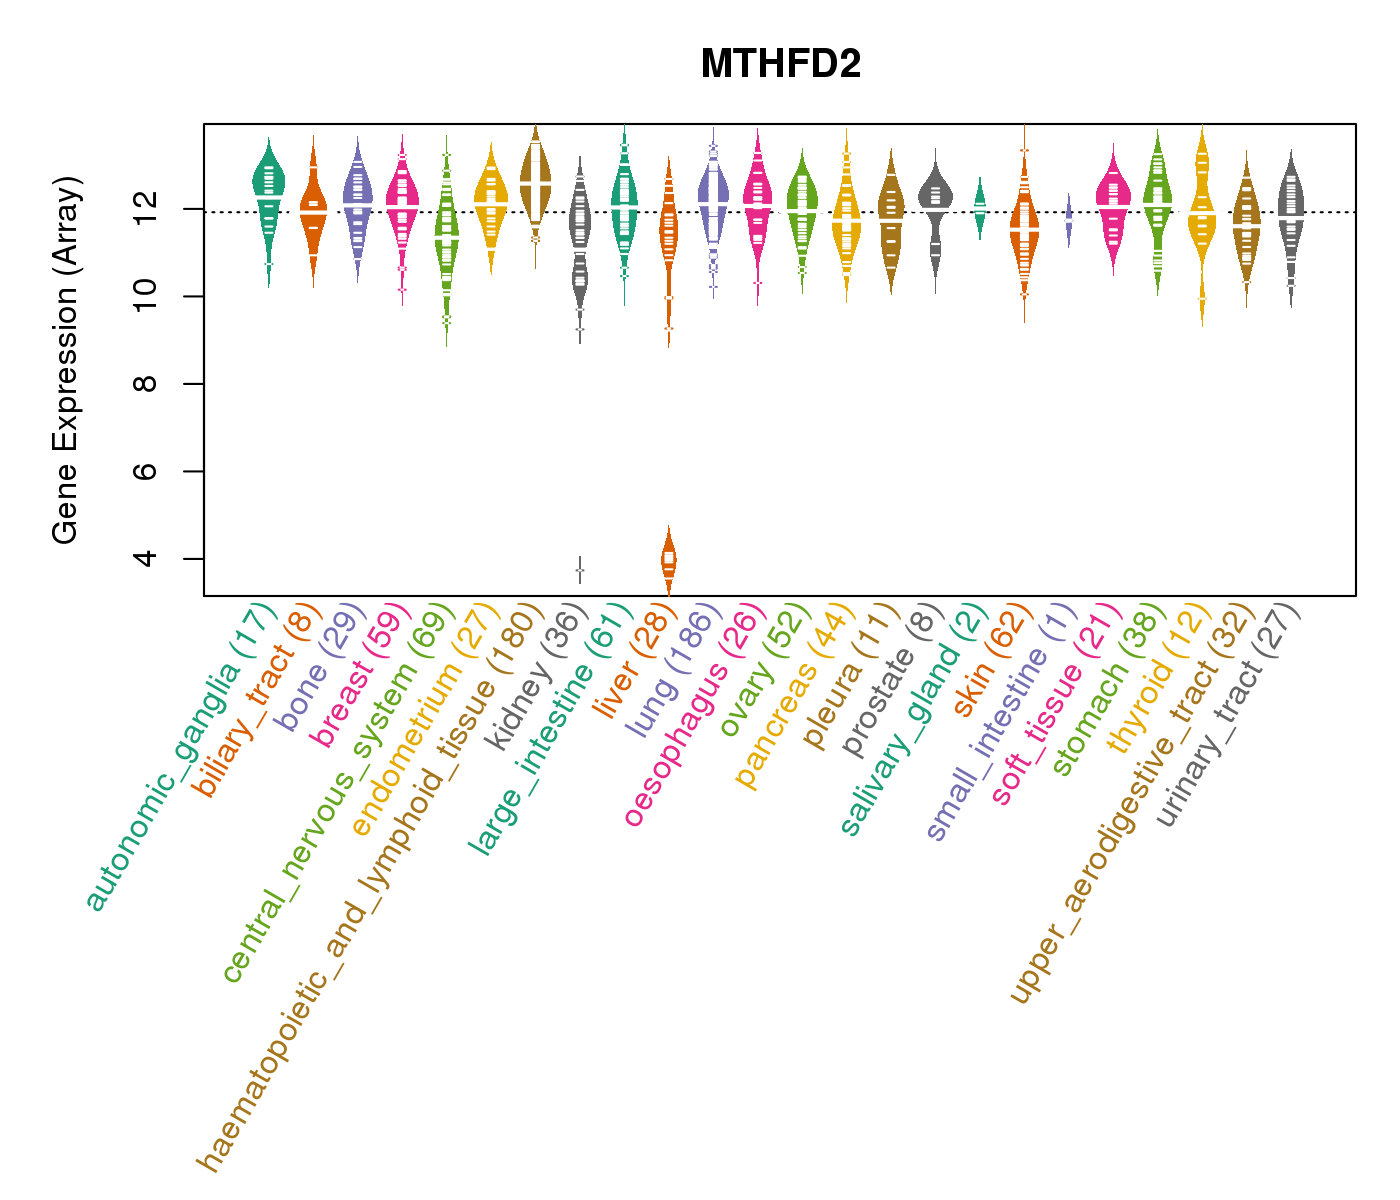
| * CCLE gene expression data were extracted from CCLE_Expression_Entrez_2012-10-18.res: Gene-centric RMA-normalized mRNA expression data. |
 |
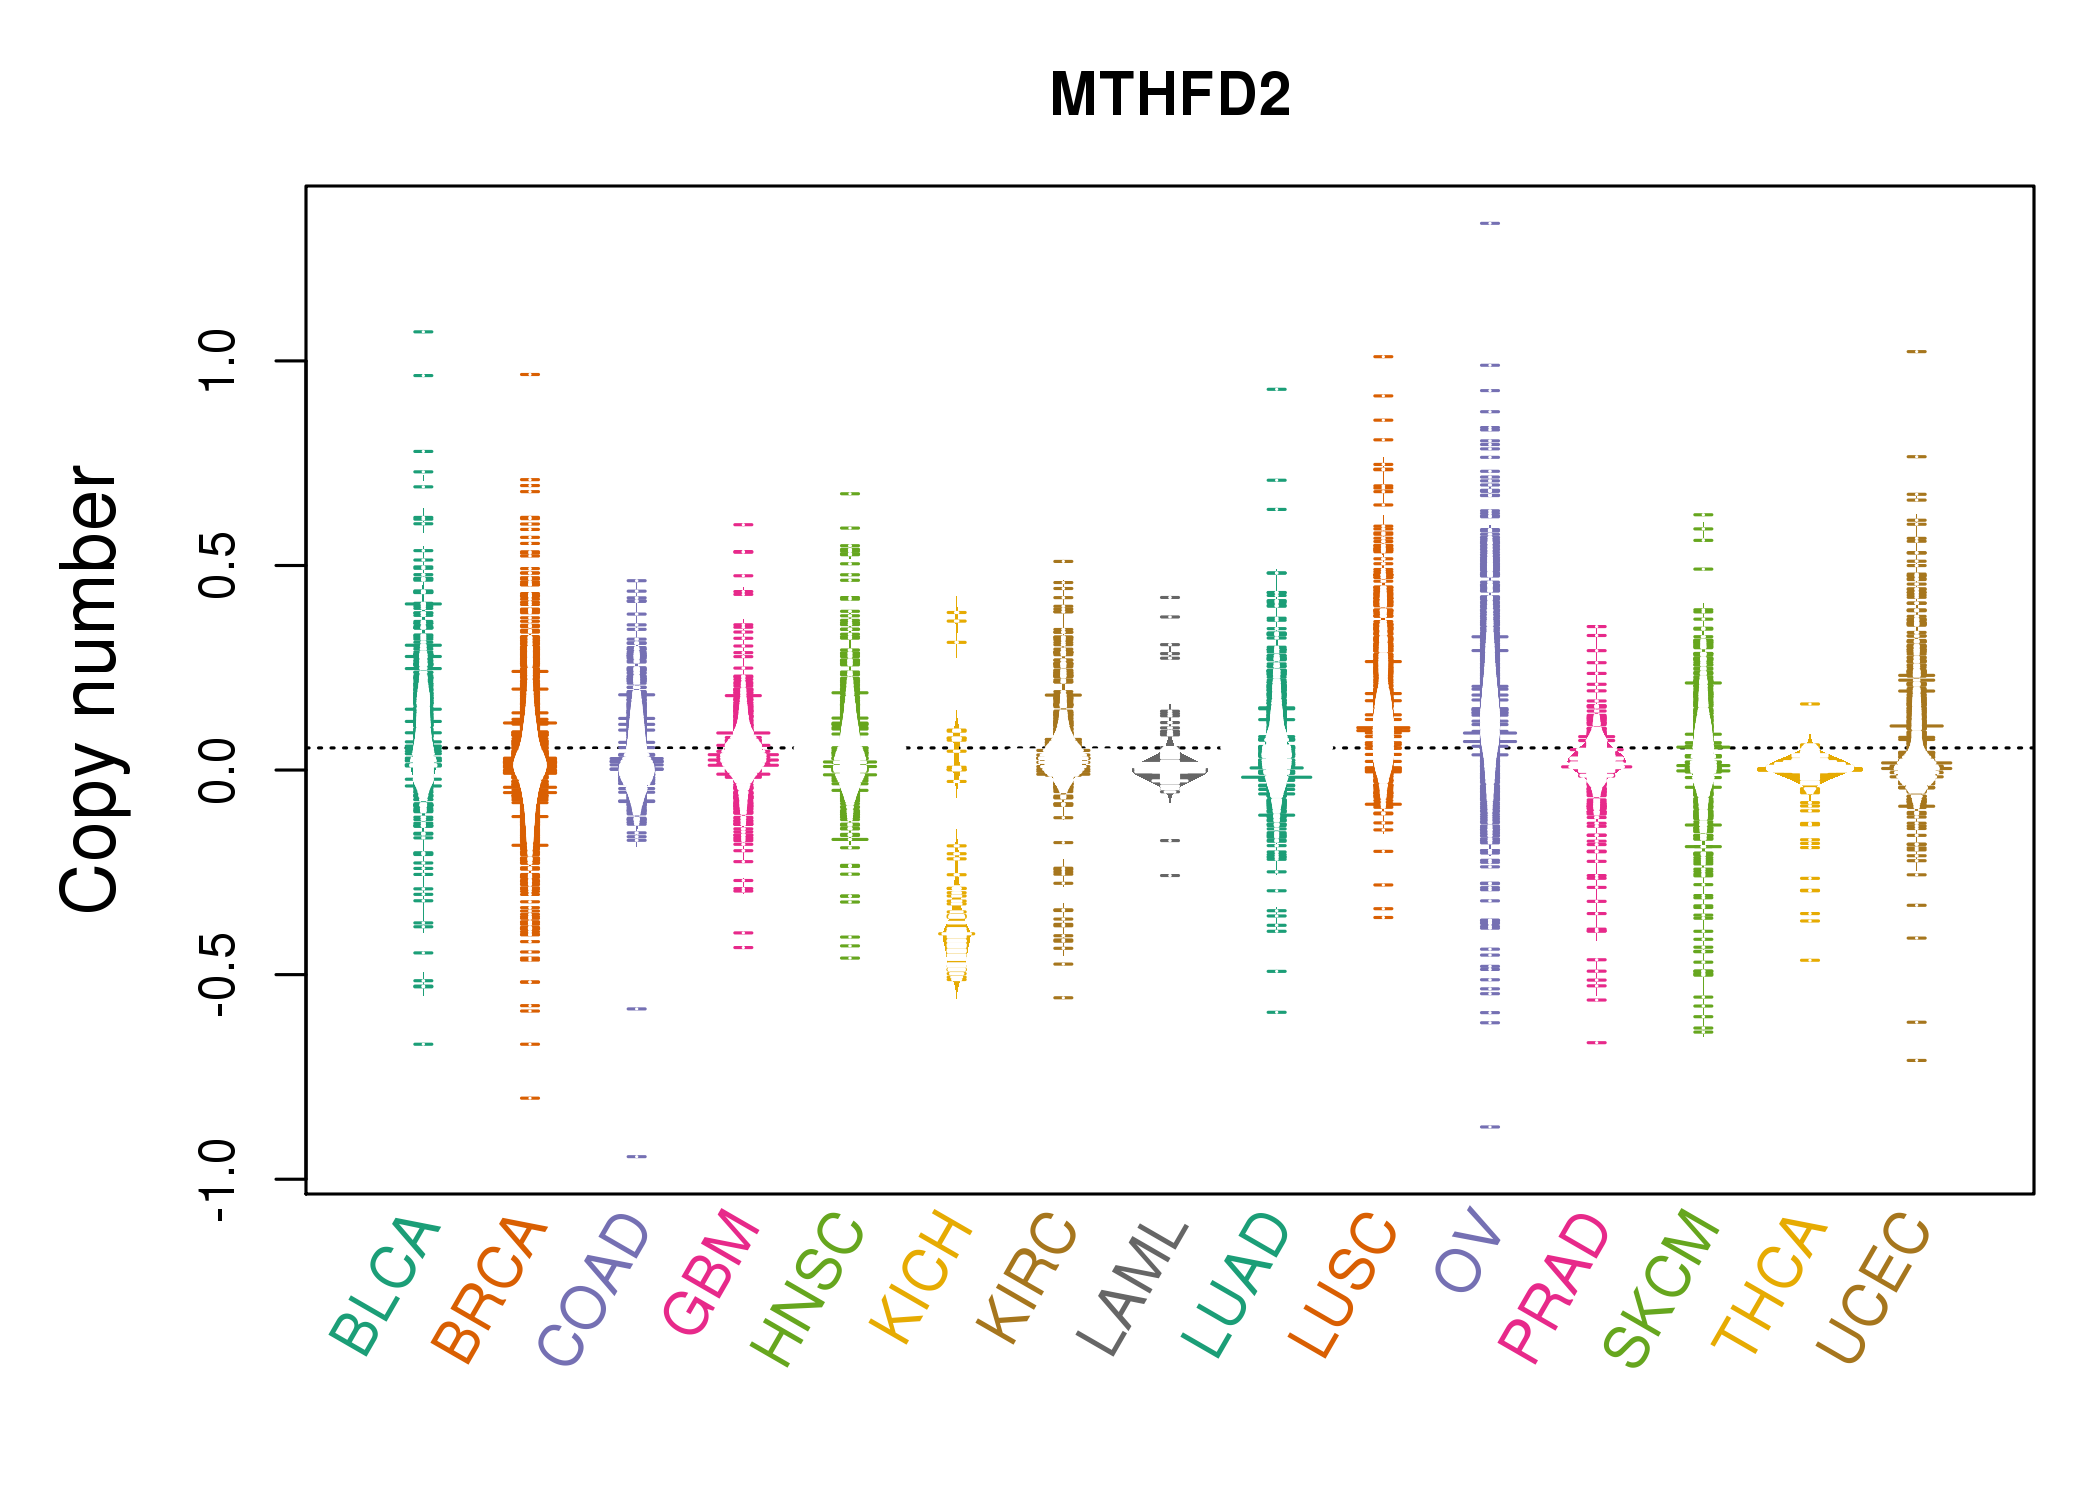
| * Normalized gene expression data of RNASeqV2 was extracted from TCGA using R package TCGA-Assembler. The URLs of all public data files on TCGA DCC data server were gathered at Jan-05-2015. Only eight cancer types have enough normal control samples for differential expression analysis. (t test, adjusted p<0.05 (using Benjamini-Hochberg FDR)) |
 |
| Top |
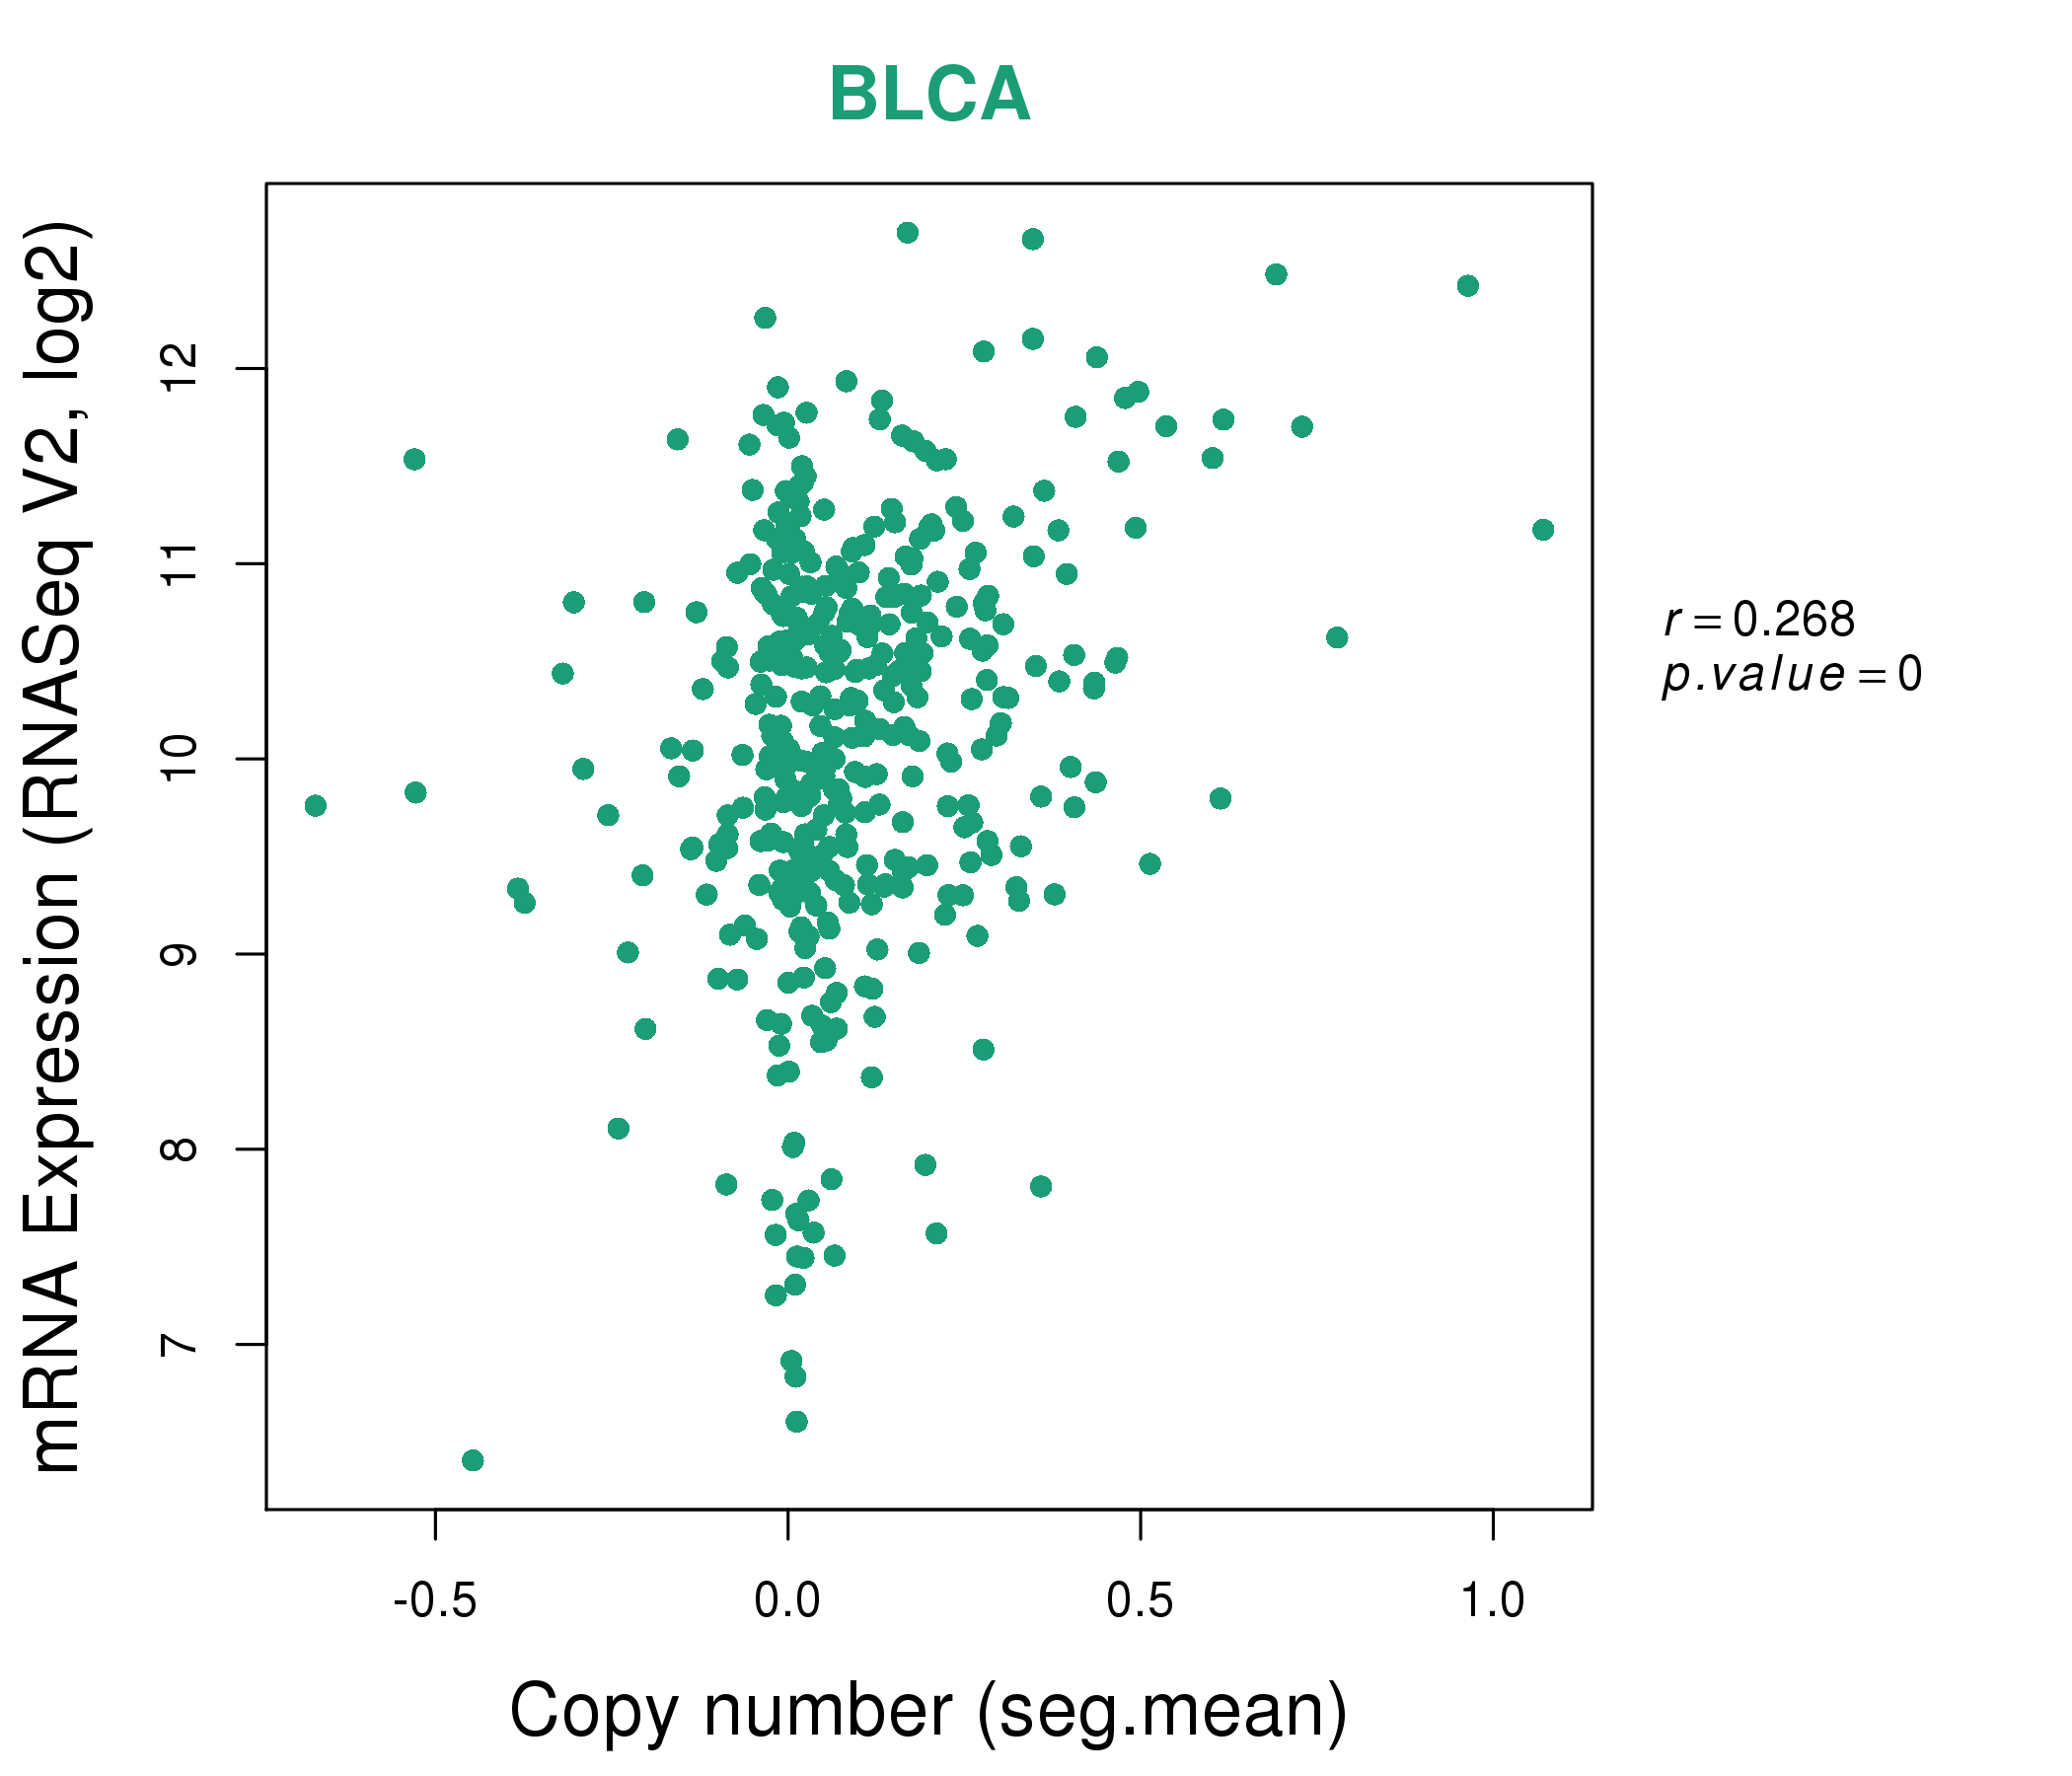
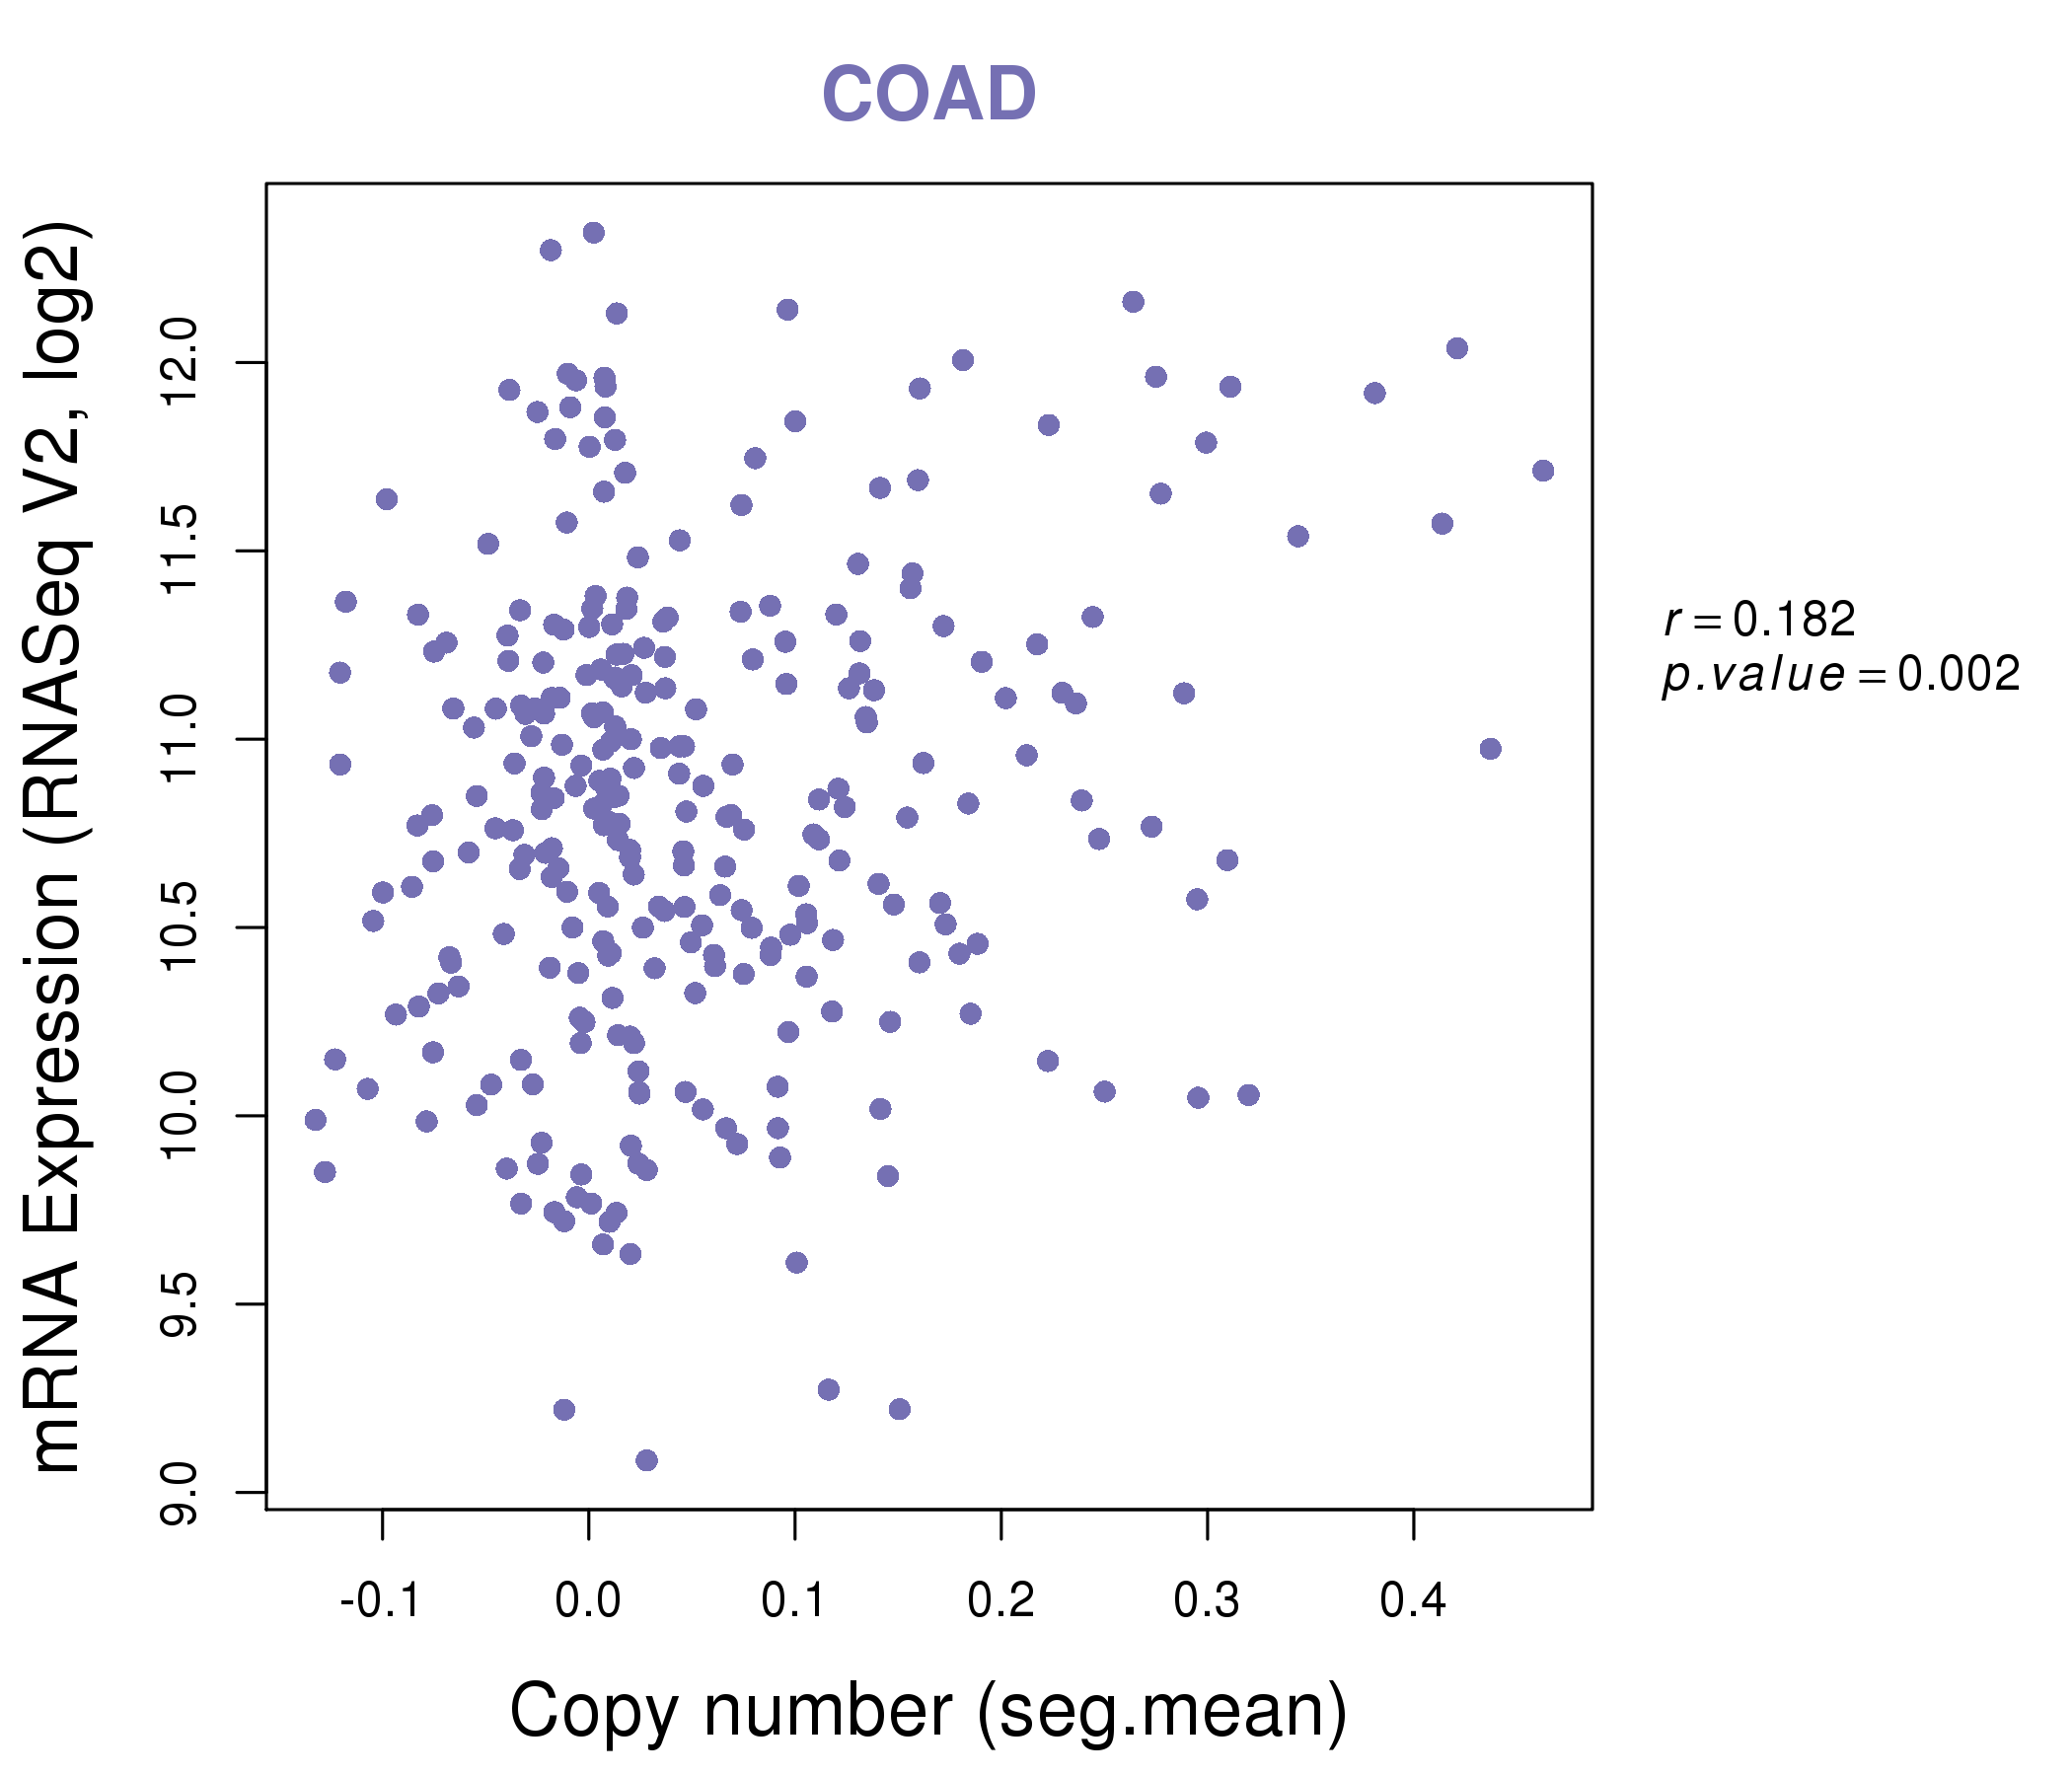
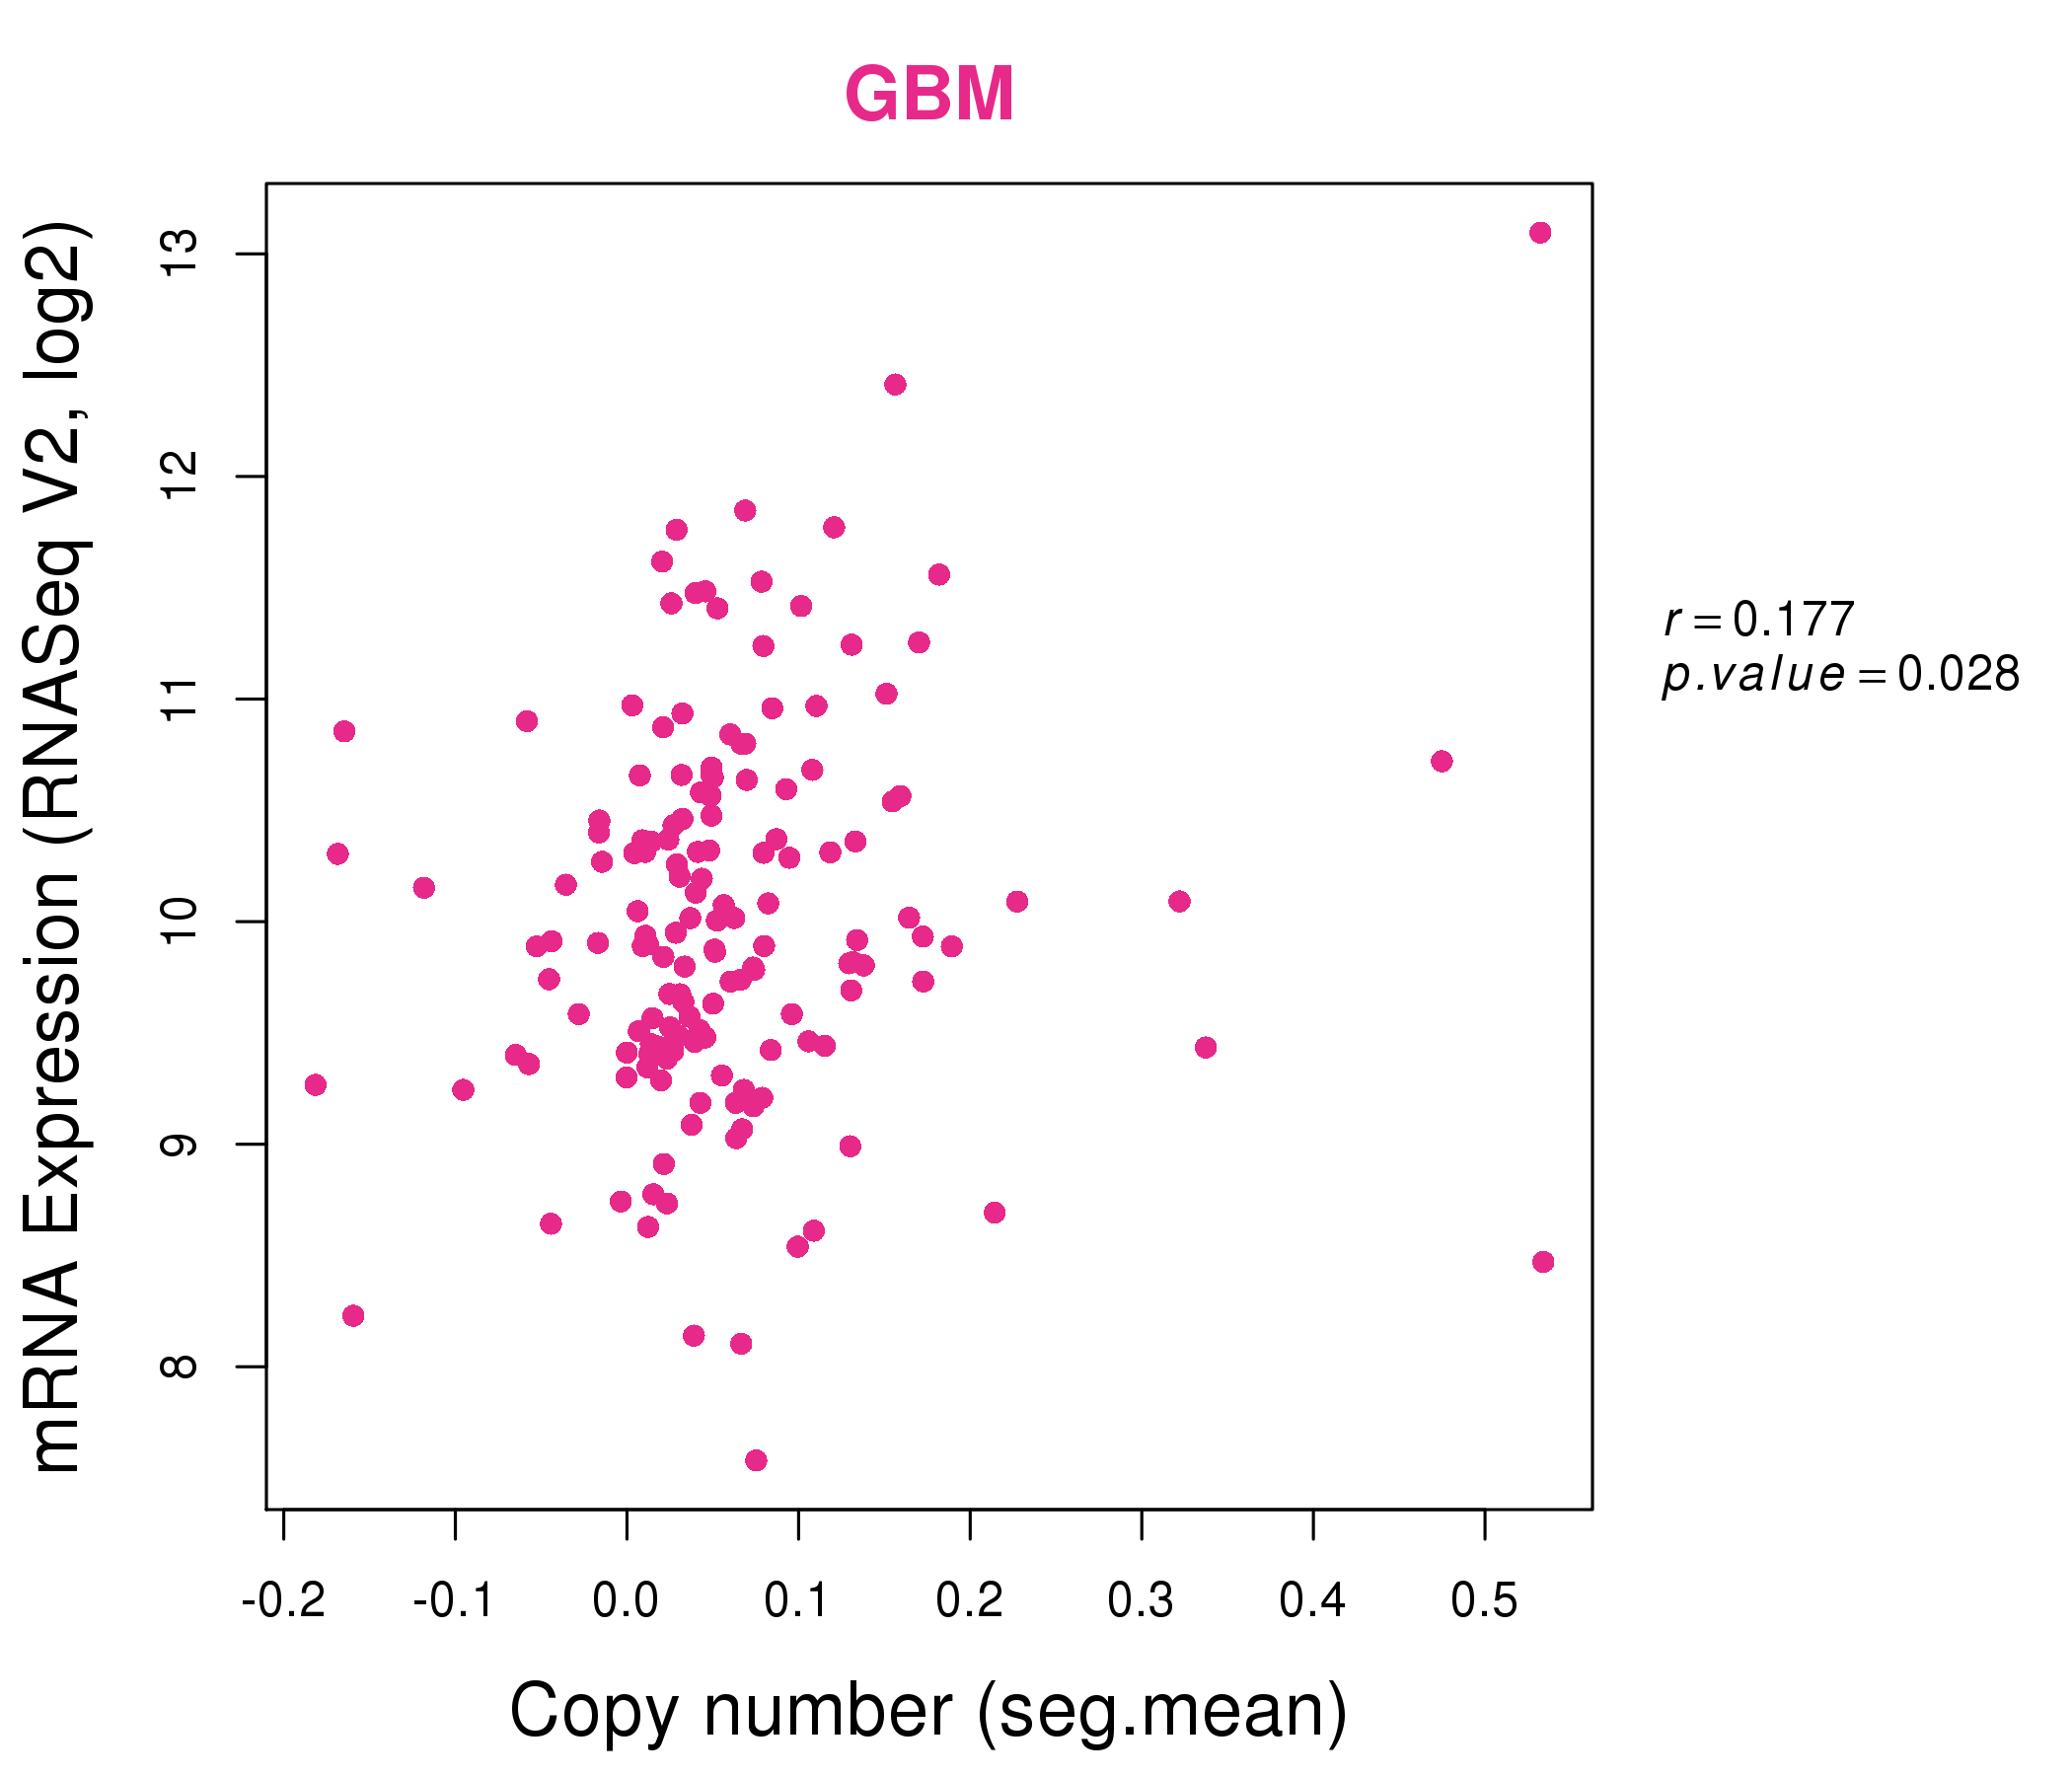
| * This plots show the correlation between CNV and gene expression. |
: Open all plots for all cancer types
 |
|
 |
|

| Top |
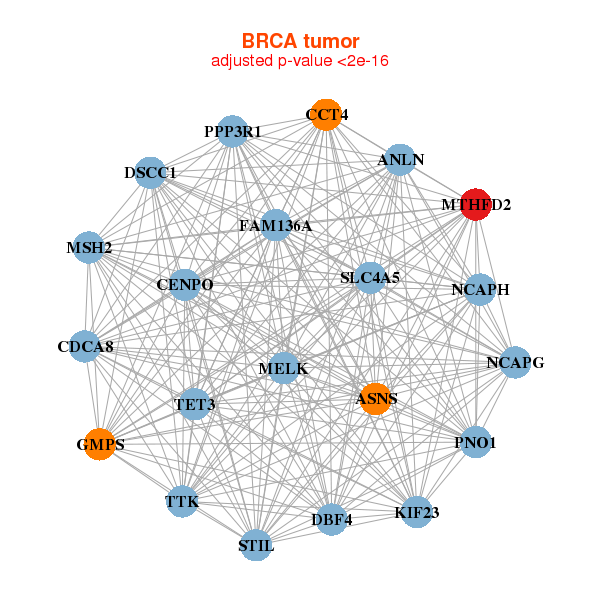
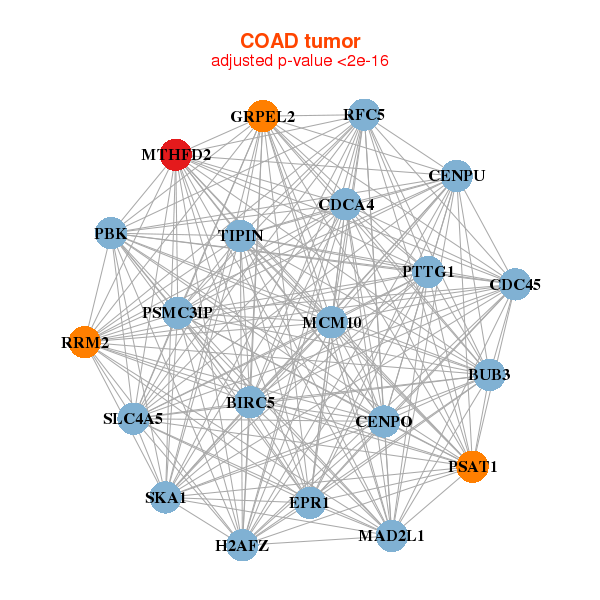
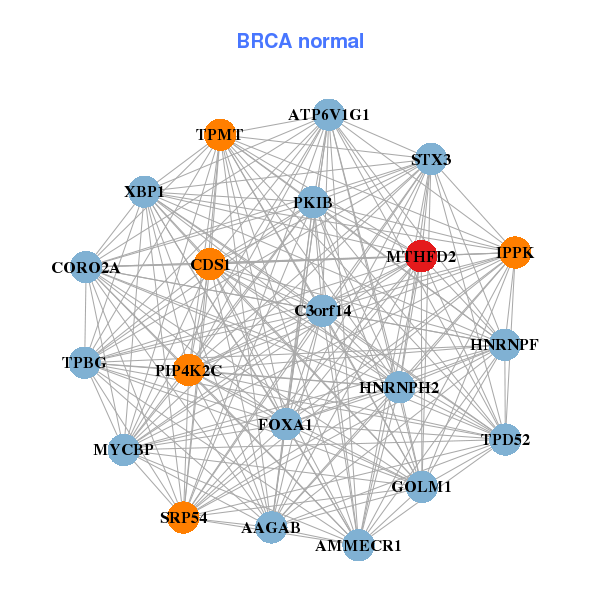
| Gene-Gene Network Information |
| * Co-Expression network figures were drawn using R package igraph. Only the top 20 genes with the highest correlations were shown. Red circle: input gene, orange circle: cell metabolism gene, sky circle: other gene |
: Open all plots for all cancer types
 |
| ||||
| C11orf71,COA5,FAM200B,GRSF1,DANCR,LOC100303728,LOC147727, LOC202781,LOC400027,LOC400752,LOC401588,MRPL1,MTHFD2L,RCHY1, RUFY3,SDAD1,SNHG10,TCTE3,THAP6,THAP9,UTP3 | ACTR6,AP1AR,VCPKMT,C5orf28,CAAP1,CLDN12,CSNK1A1, EEF1E1,KIAA0895,LZTFL1,LAMTOR3,MTHFD2L,NUP35,NUPL2, ORC4,POT1,PRSS16,SRSF6,SVIP,TMEM161B,ZBED5 | ||||
 |
| ||||
| ATP5L,C14orf142,COMMD8,COX18,DCK,DANCR,MTHFD2L, MYEOV2,NDUFB1,NUDCD2,NUP54,ORC4,PACRGL,PHF5A, RCHY1,SDHD,SNRPG,TIMM8B,TMEM126B,TOMM22,UQCR10 | BRIX1,DTD2,KATNBL1,C5orf28,TRAPPC13,CCDC58,TRMT13, MRPL1,MRPL32,MRPL50,MTERF3,MTHFD2L,NUPL2,OTUD6B, PAK1IP1,PRMT3,PTRH2,RCN2,TRMT10C,TAF9,TRUB1 |
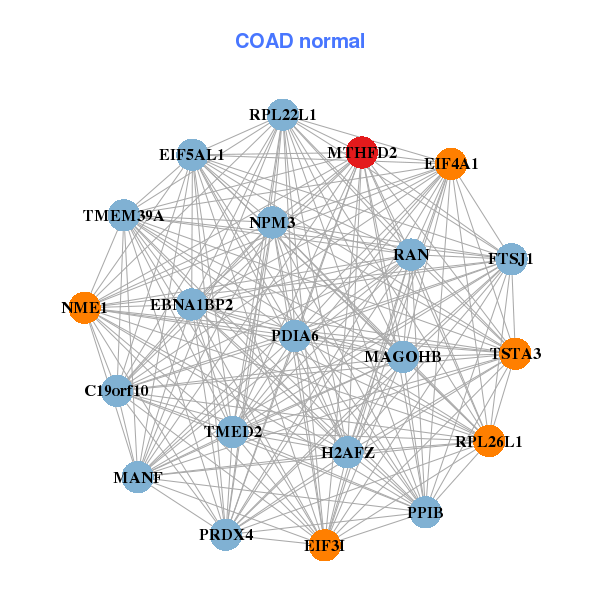
| * Co-Expression network figures were drawn using R package igraph. Only the top 20 genes with the highest correlations were shown. Red circle: input gene, orange circle: cell metabolism gene, sky circle: other gene |
: Open all plots for all cancer types
| Top |
: Open all interacting genes' information including KEGG pathway for all interacting genes from DAVID
| Top |
| Pharmacological Information for MTHFD2 |
| DB Category | DB Name | DB's ID and Url link |
| * Gene Centered Interaction Network. |
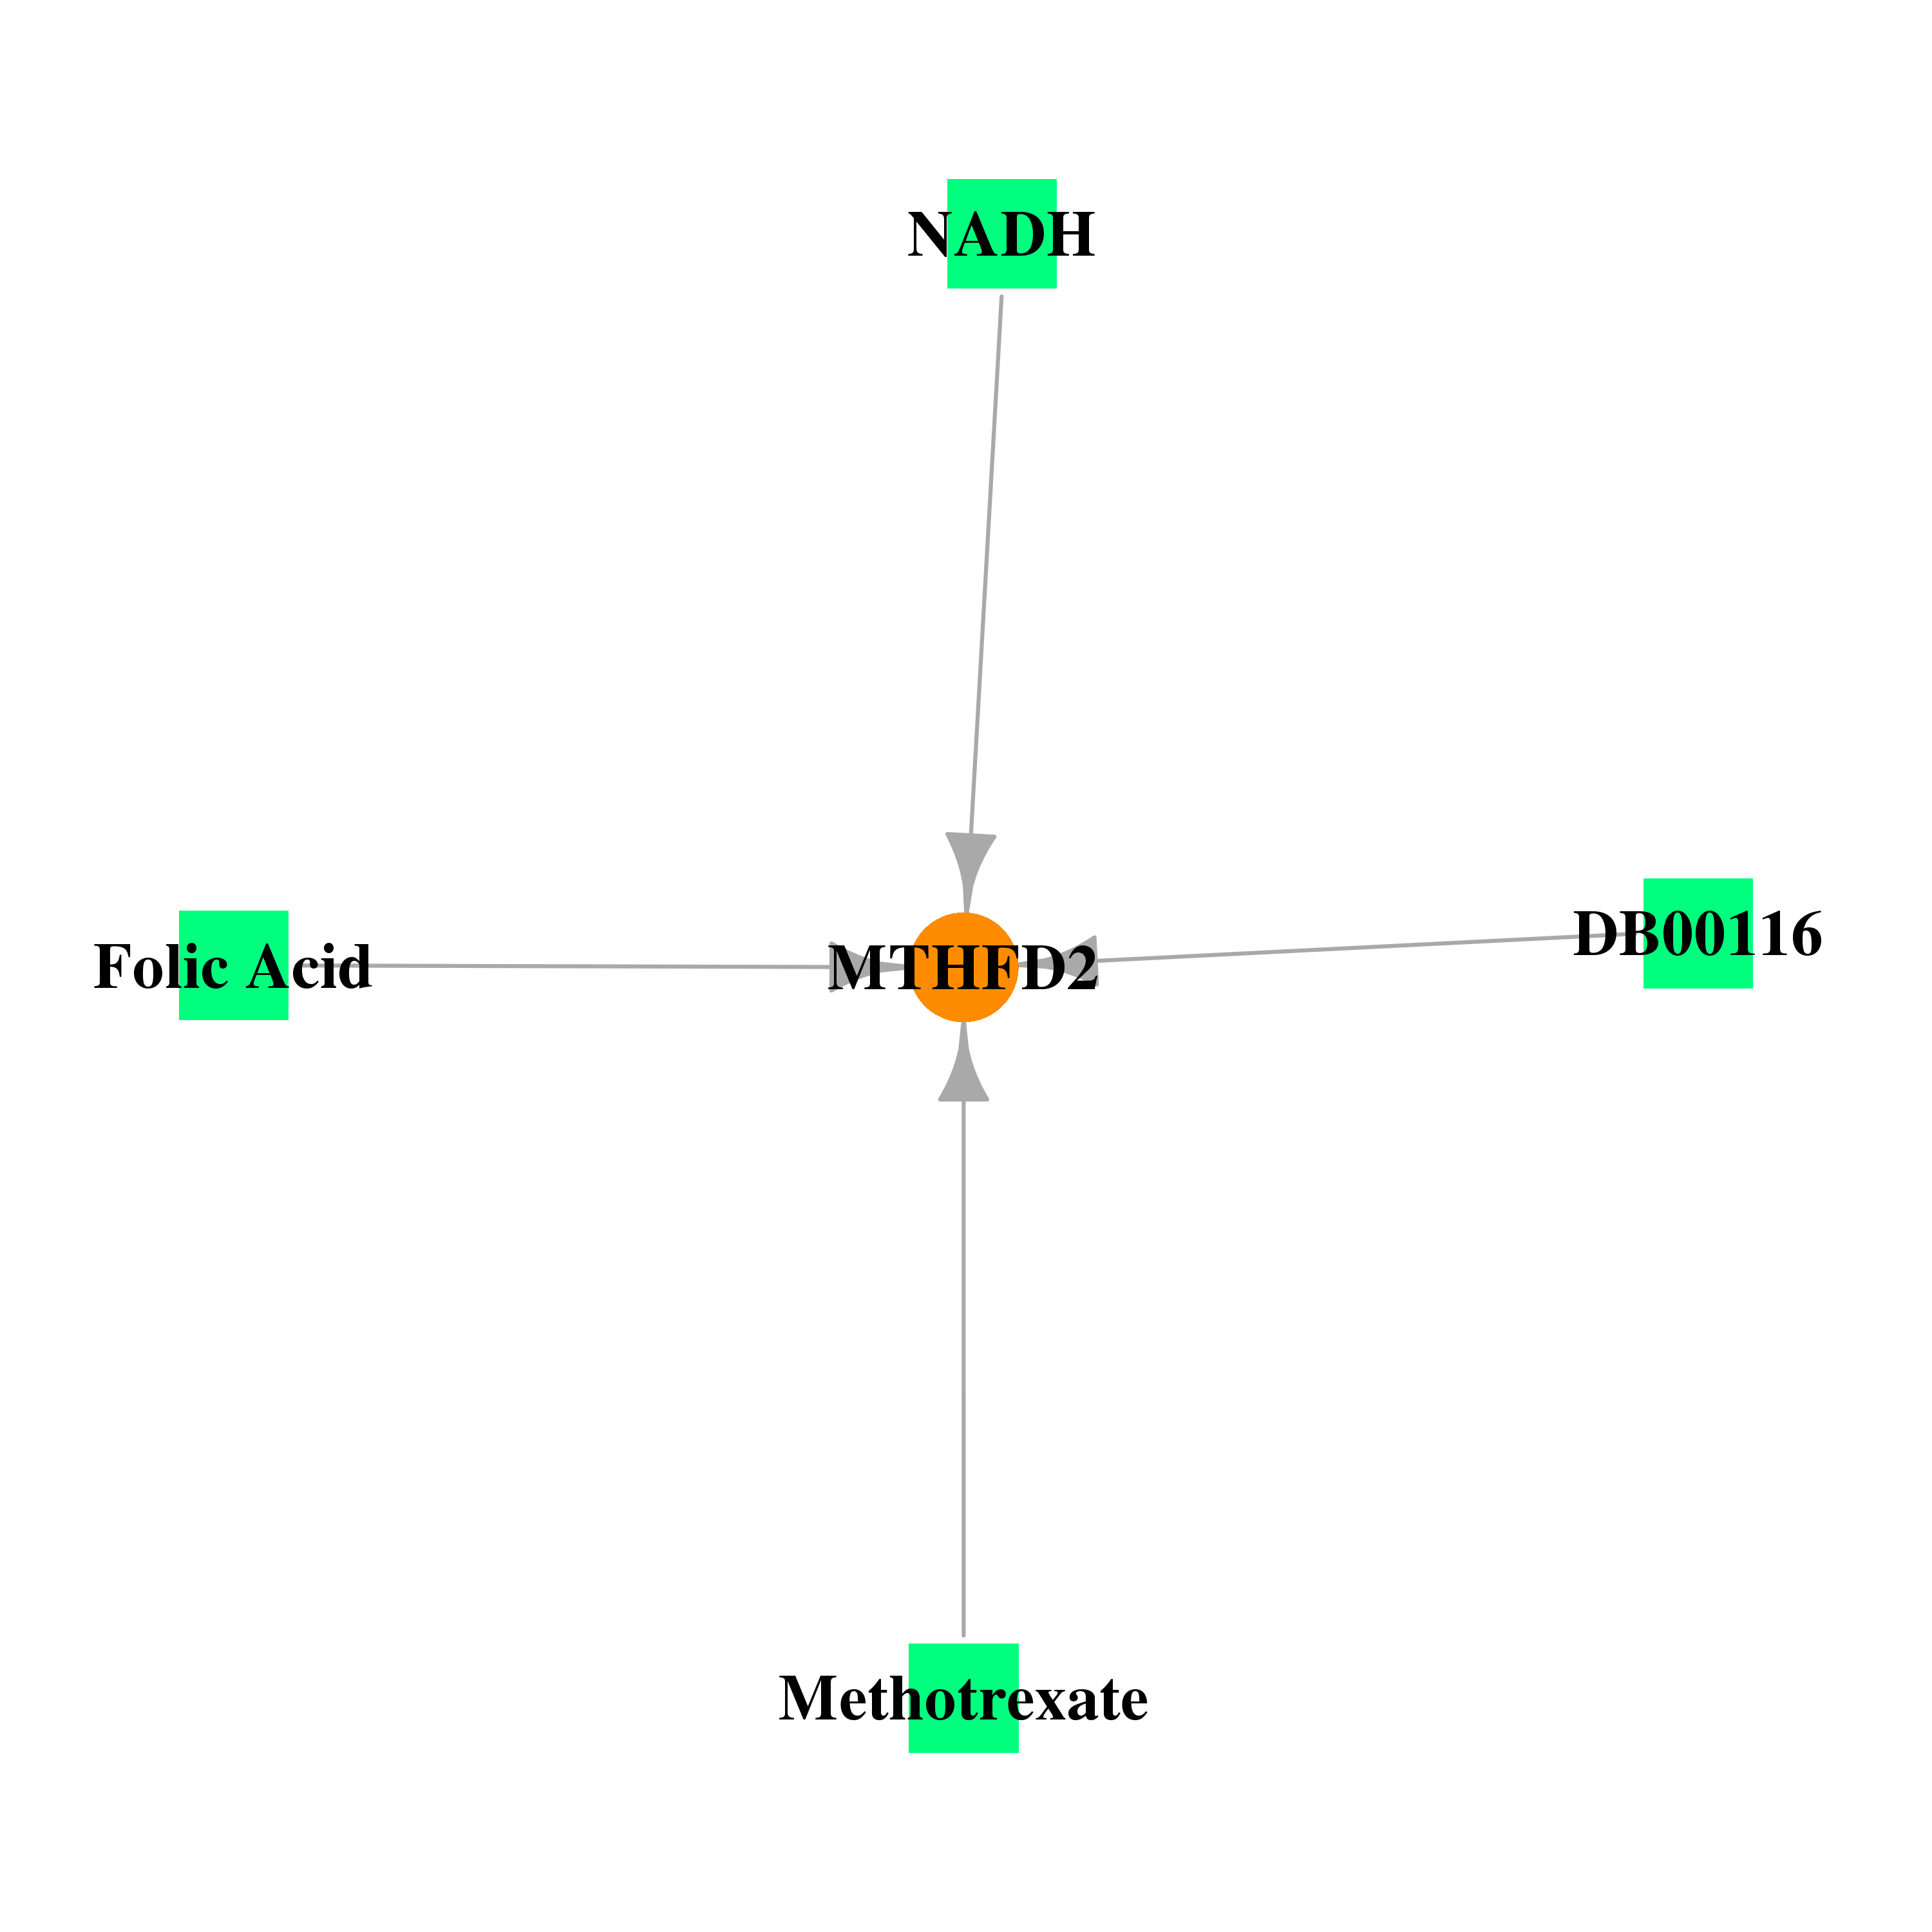 |
| * Drug Centered Interaction Network. |
| DrugBank ID | Target Name | Drug Groups | Generic Name | Drug Centered Network | Drug Structure |
| DB00116 | methylenetetrahydrofolate dehydrogenase (NADP+ dependent) 2, methenyltetrahydrofolate cyclohydrolase | approved; nutraceutical | Tetrahydrofolic acid | 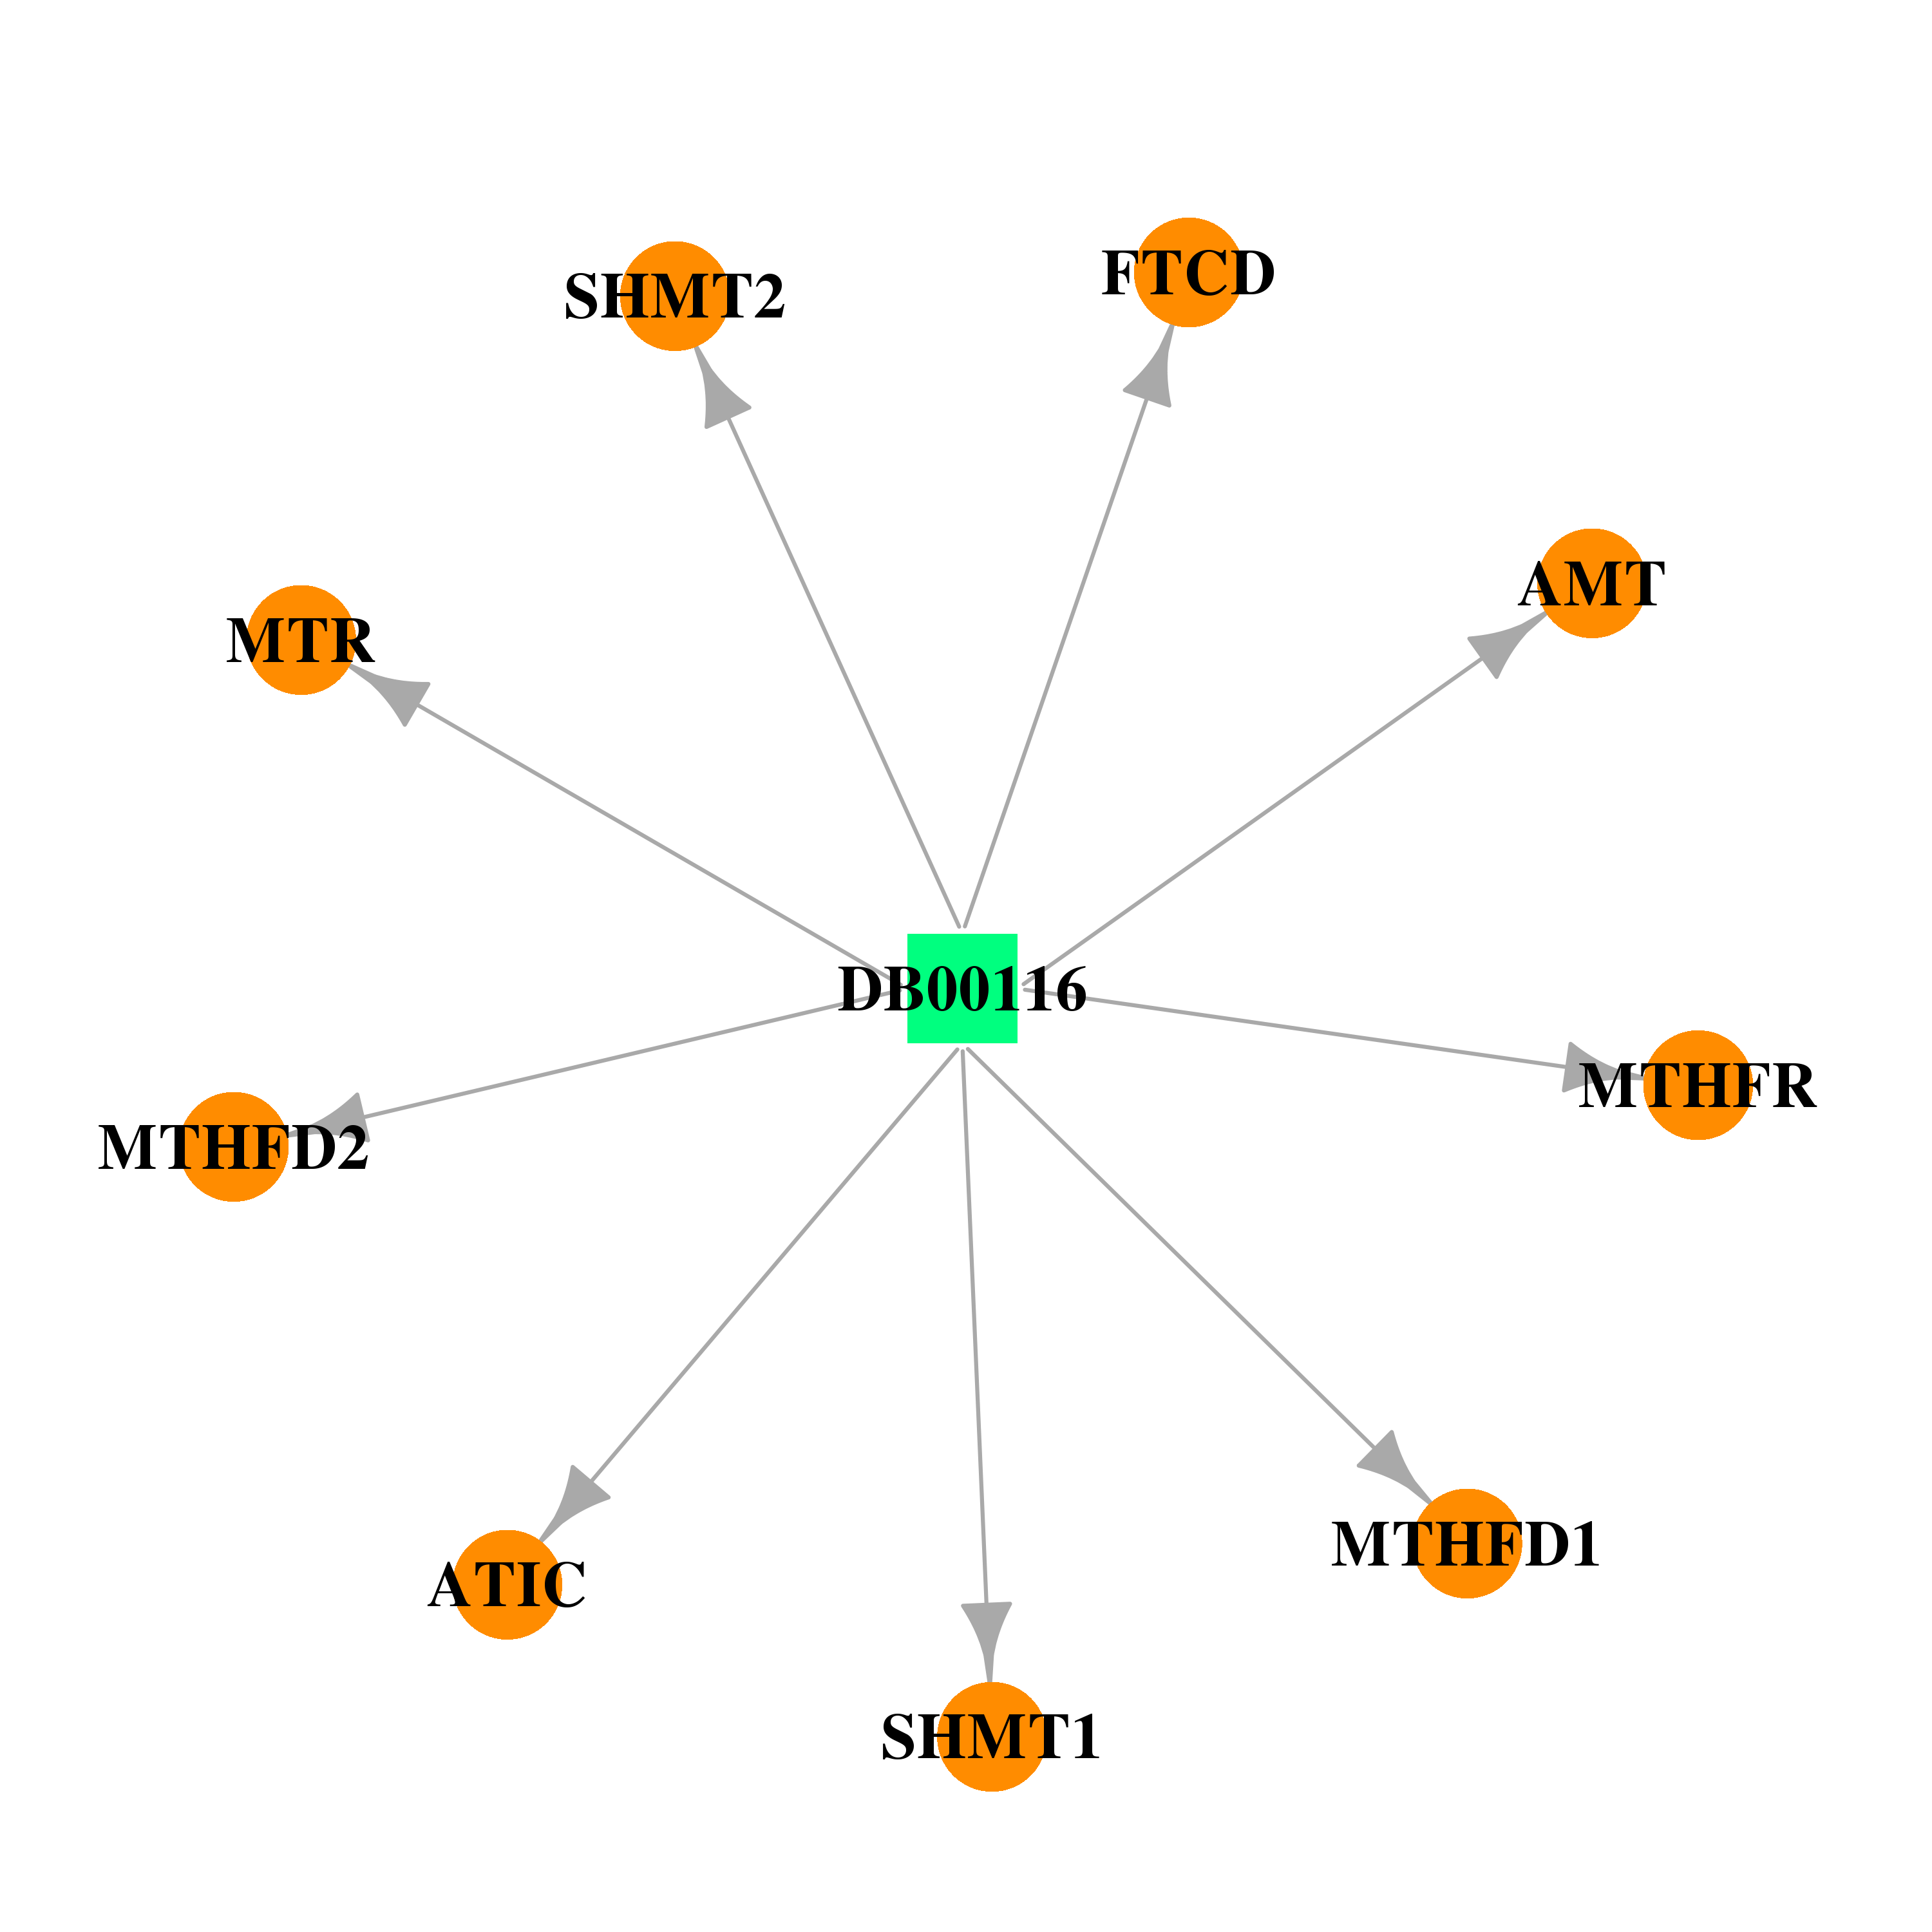 |  |
| DB00157 | methylenetetrahydrofolate dehydrogenase (NADP+ dependent) 2, methenyltetrahydrofolate cyclohydrolase | approved; nutraceutical | NADH |  |  |
| DB00563 | methylenetetrahydrofolate dehydrogenase (NADP+ dependent) 2, methenyltetrahydrofolate cyclohydrolase | approved | Methotrexate |  |  |
| DB00158 | methylenetetrahydrofolate dehydrogenase (NADP+ dependent) 2, methenyltetrahydrofolate cyclohydrolase | approved; nutraceutical | Folic Acid | 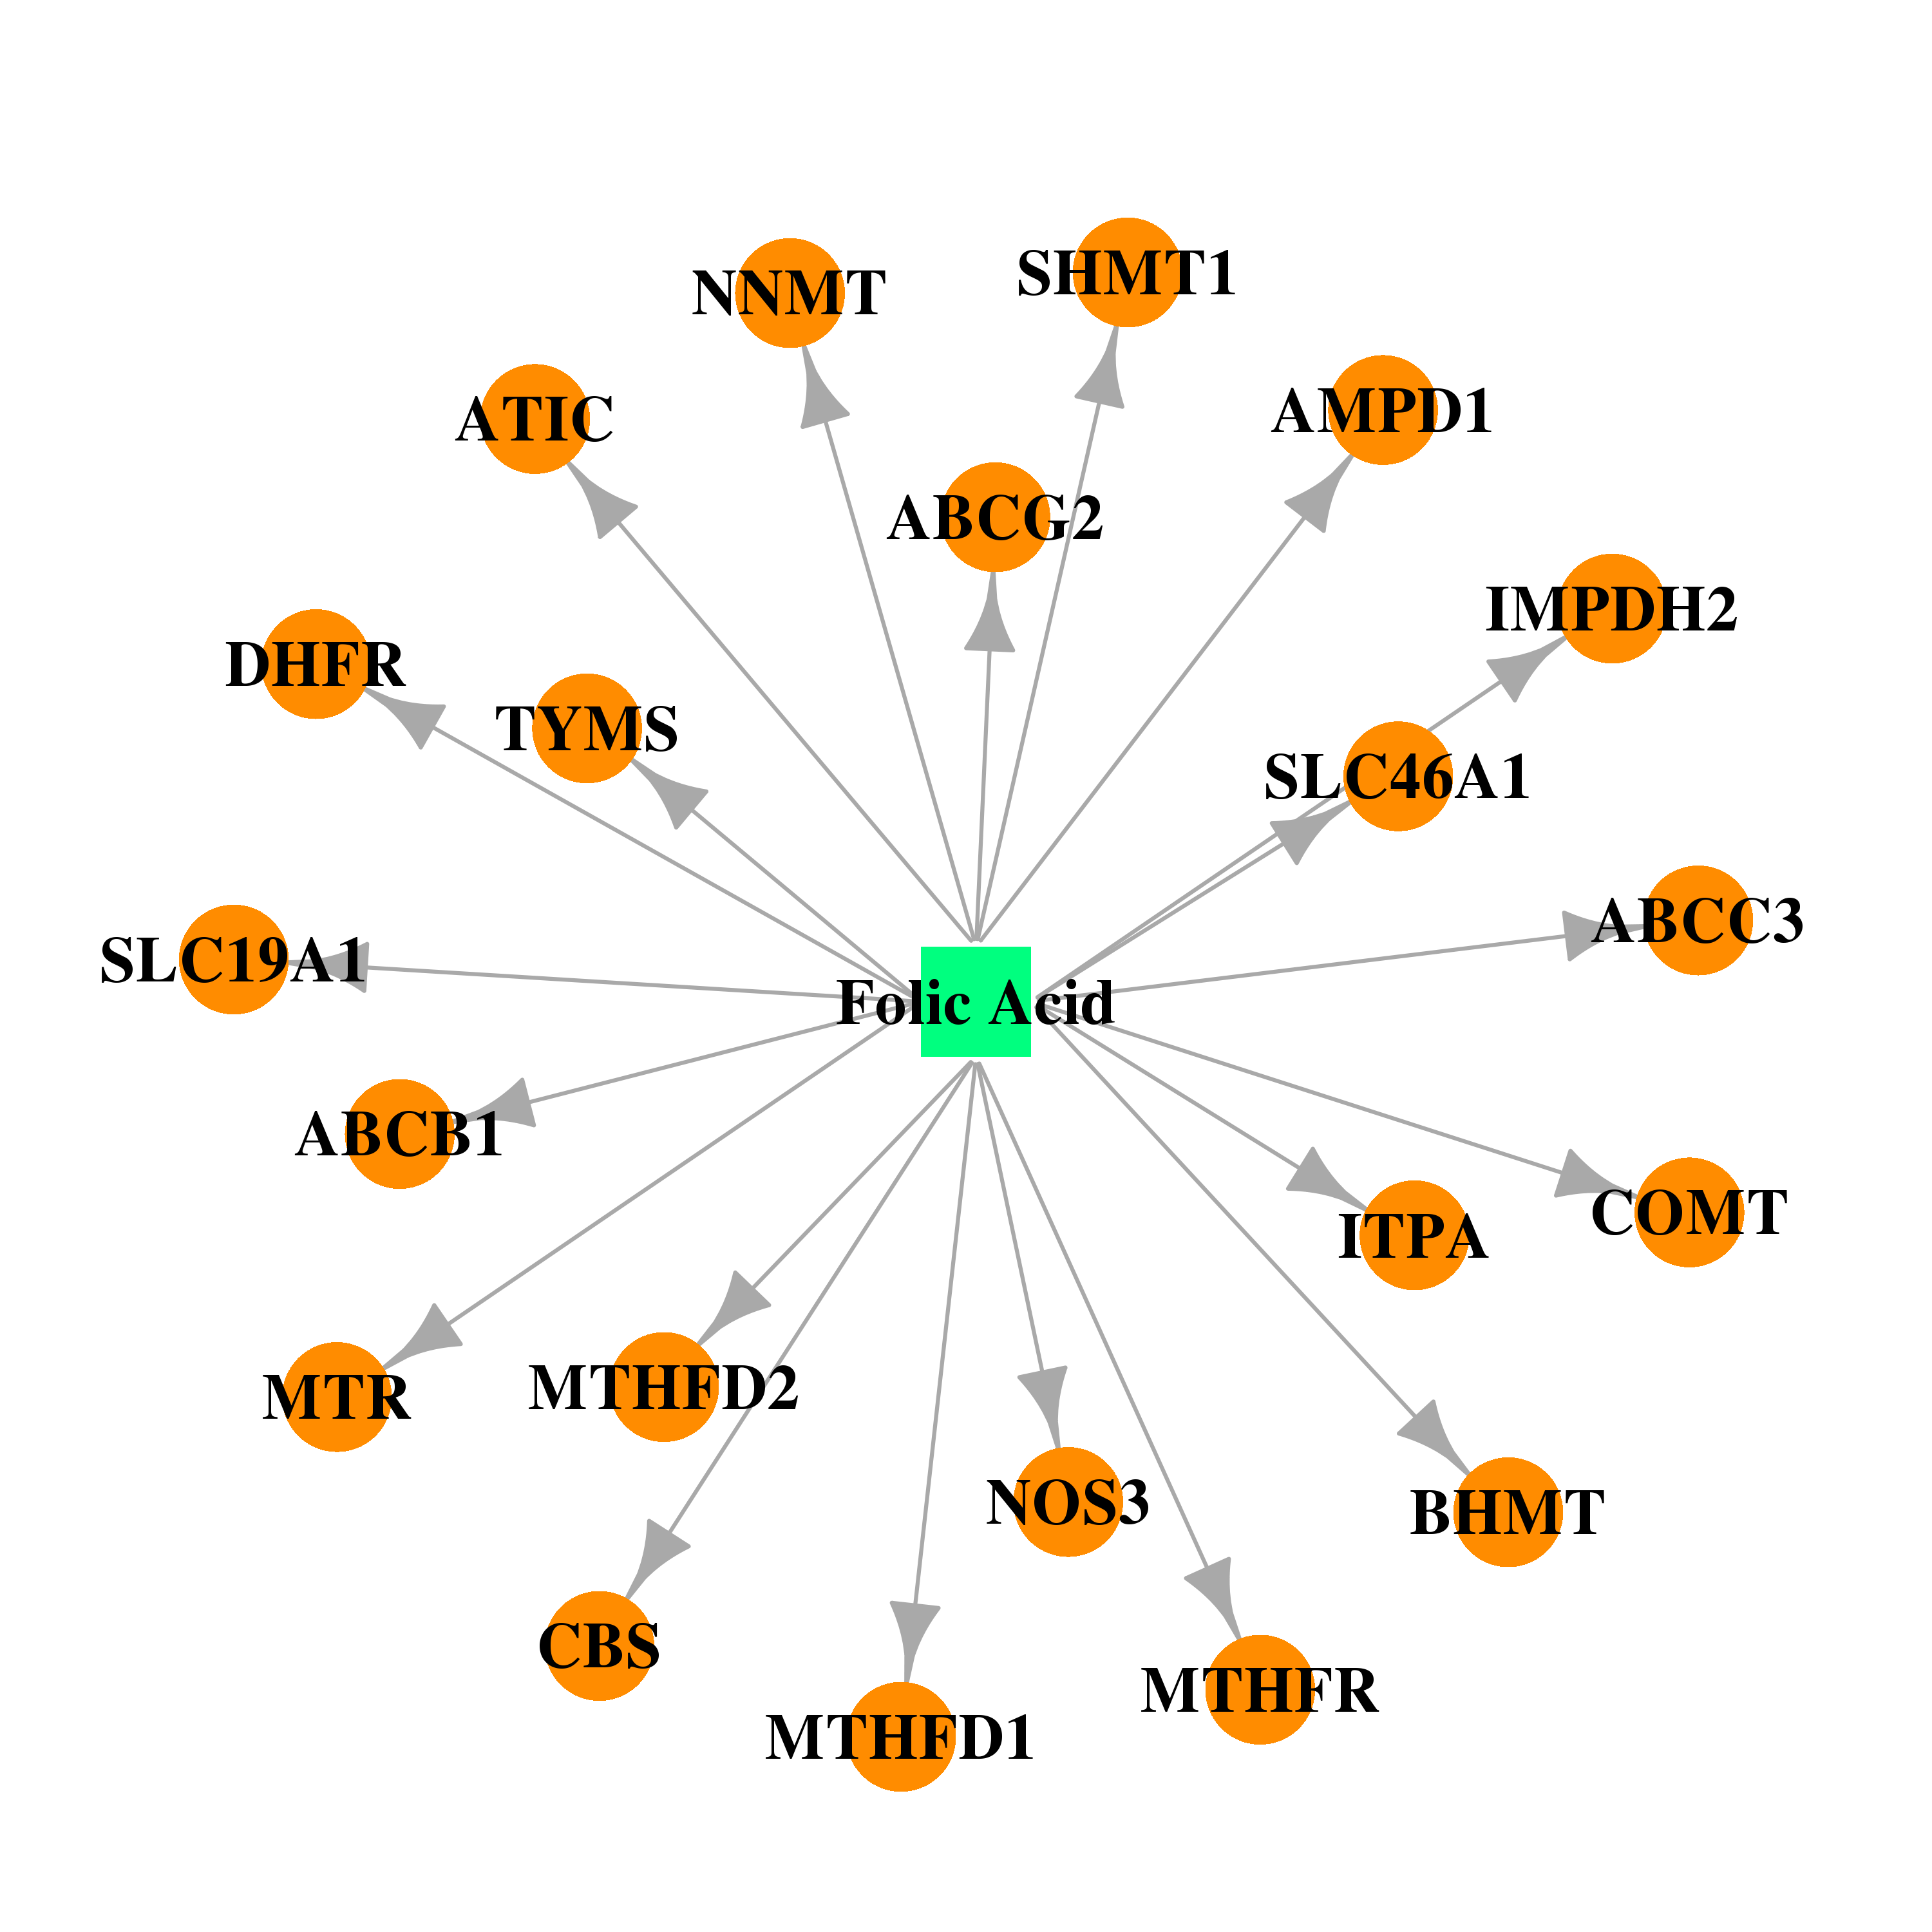 | 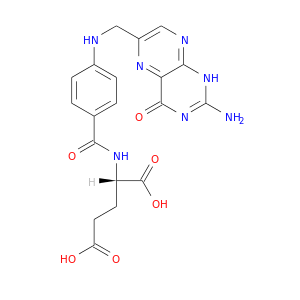 |
| Top |
| Cross referenced IDs for MTHFD2 |
| * We obtained these cross-references from Uniprot database. It covers 150 different DBs, 18 categories. http://www.uniprot.org/help/cross_references_section |
: Open all cross reference information
|
Copyright © 2016-Present - The Univsersity of Texas Health Science Center at Houston @ |