|
||||||||||||||||||||||||||||||||||||||||||||||||||||||||||||||||||||||||||||||||||||||||||||||||||||||||||||||||||||||||||||||||||||||||||||||||||||||||||||||||||||||||||||||||||||||||||||||||||||||||||||||||||||||||||||||||||||||||||||||||||||||||||||||||||||||||||||||||||||||||||||||||||||||||||||||||||||||||||||||||||||||||||||||||||||||||||||||||||
| |
| Phenotypic Information (metabolism pathway, cancer, disease, phenome) |
| |
| |
| Gene-Gene Network Information: Co-Expression Network, Interacting Genes & KEGG |
| |
|


| Gene Summary for ADCY2 |
| Basic gene info. | Gene symbol | ADCY2 |
| Gene name | adenylate cyclase 2 (brain) | |
| Synonyms | AC2|HBAC2 | |
| Cytomap | UCSC genome browser: 5p15.3 | |
| Genomic location | chr5 :7396342-7830194 | |
| Type of gene | protein-coding | |
| RefGenes | NM_020546.2, | |
| Ensembl id | ENSG00000078295 | |
| Description | 3',5'-cyclic AMP synthetaseATP pyrophosphate-lyase 2adenylate cyclase IIadenylate cyclase type 2adenylate cyclase type IIadenylyl cyclase 2type II adenylate cyclase | |
| Modification date | 20141207 | |
| dbXrefs | MIM : 103071 | |
| HGNC : HGNC | ||
| Ensembl : ENSG00000078295 | ||
| HPRD : 00052 | ||
| Vega : OTTHUMG00000090476 | ||
| Protein | UniProt: Q08462 go to UniProt's Cross Reference DB Table | |
| Expression | CleanEX: HS_ADCY2 | |
| BioGPS: 108 | ||
| Gene Expression Atlas: ENSG00000078295 | ||
| The Human Protein Atlas: ENSG00000078295 | ||
| Pathway | NCI Pathway Interaction Database: ADCY2 | |
| KEGG: ADCY2 | ||
| REACTOME: ADCY2 | ||
| ConsensusPathDB | ||
| Pathway Commons: ADCY2 | ||
| Metabolism | MetaCyc: ADCY2 | |
| HUMANCyc: ADCY2 | ||
| Regulation | Ensembl's Regulation: ENSG00000078295 | |
| miRBase: chr5 :7,396,342-7,830,194 | ||
| TargetScan: NM_020546 | ||
| cisRED: ENSG00000078295 | ||
| Context | iHOP: ADCY2 | |
| cancer metabolism search in PubMed: ADCY2 | ||
| UCL Cancer Institute: ADCY2 | ||
| Assigned class in ccmGDB | A - This gene has a literature evidence and it belongs to cancer gene. | |
| References showing role of ADCY2 in cancer cell metabolism | 1. Duerr EM, Mizukami Y, Ng A, Xavier RJ, Kikuchi H, et al. (2008) Defining molecular classifications and targets in gastroenteropancreatic neuroendocrine tumors through DNA microarray analysis. Endocr Relat Cancer 15: 243-256. doi: 10.1677/ERC-07-0194. go to article 2. O'Donnell PH, Stark AL, Gamazon ER, Wheeler HE, McIlwee BE, et al. (2012) Identification of novel germline polymorphisms governing capecitabine sensitivity. Cancer 118: 4063-4073. doi: 10.1002/cncr.26737. pmid: 3413892. go to article | |
| Top |
| Phenotypic Information for ADCY2(metabolism pathway, cancer, disease, phenome) |
| Cancer | CGAP: ADCY2 |
| Familial Cancer Database: ADCY2 | |
| * This gene is included in those cancer gene databases. |
|
|
|
|
|
| . | ||||||||||||||||||||||||||||||||||||||||||||||||||||||||||||||||||||||||||||||||||||||||||||||||||||||||||||||||||||||||||||||||||||||||||||||||||||||||||||||||||||||||||||||||||||||||||||||||||||||||||||||||||||||||||||||||||||||||||||||||||||||||||||||||||||||||||||||||||||||||||||||||||||||||||||||||||||||||||||||||||||||||||||||||||||||||||||
Oncogene 1 | Significant driver gene in | |||||||||||||||||||||||||||||||||||||||||||||||||||||||||||||||||||||||||||||||||||||||||||||||||||||||||||||||||||||||||||||||||||||||||||||||||||||||||||||||||||||||||||||||||||||||||||||||||||||||||||||||||||||||||||||||||||||||||||||||||||||||||||||||||||||||||||||||||||||||||||||||||||||||||||||||||||||||||||||||||||||||||||||||||||||||||||||||||
| cf) number; DB name 1 Oncogene; http://nar.oxfordjournals.org/content/35/suppl_1/D721.long, 2 Tumor Suppressor gene; https://bioinfo.uth.edu/TSGene/, 3 Cancer Gene Census; http://www.nature.com/nrc/journal/v4/n3/abs/nrc1299.html, 4 CancerGenes; http://nar.oxfordjournals.org/content/35/suppl_1/D721.long, 5 Network of Cancer Gene; http://ncg.kcl.ac.uk/index.php, 1Therapeutic Vulnerabilities in Cancer; http://cbio.mskcc.org/cancergenomics/statius/ |
| KEGG_PURINE_METABOLISM REACTOME_INTEGRATION_OF_ENERGY_METABOLISM | |
| OMIM | 103071; gene. |
| Orphanet | |
| Disease | KEGG Disease: ADCY2 |
| MedGen: ADCY2 (Human Medical Genetics with Condition) | |
| ClinVar: ADCY2 | |
| Phenotype | MGI: ADCY2 (International Mouse Phenotyping Consortium) |
| PhenomicDB: ADCY2 | |
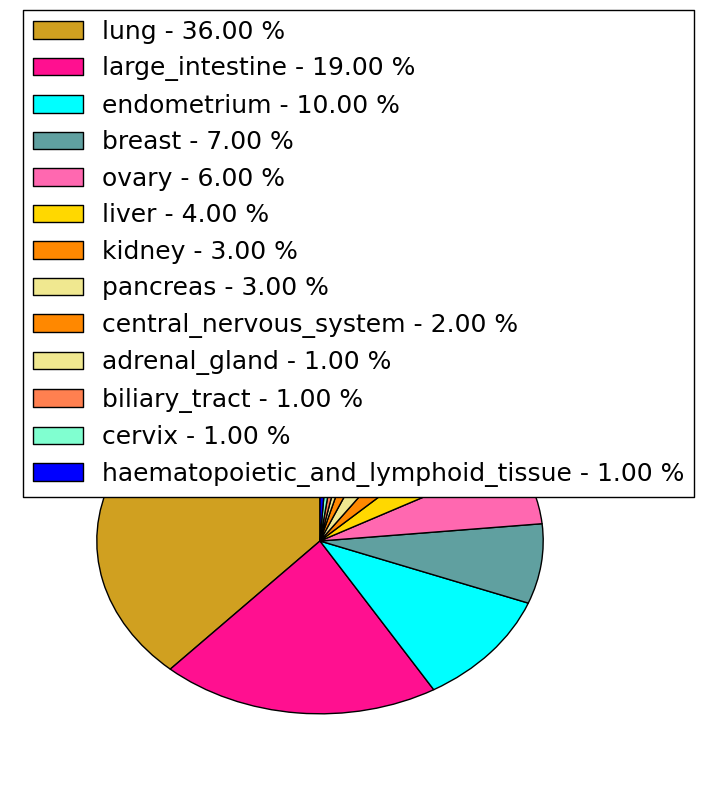
| Mutations for ADCY2 |
| * Under tables are showing count per each tissue to give us broad intuition about tissue specific mutation patterns.You can go to the detailed page for each mutation database's web site. |
| - Statistics for Tissue and Mutation type | Top |
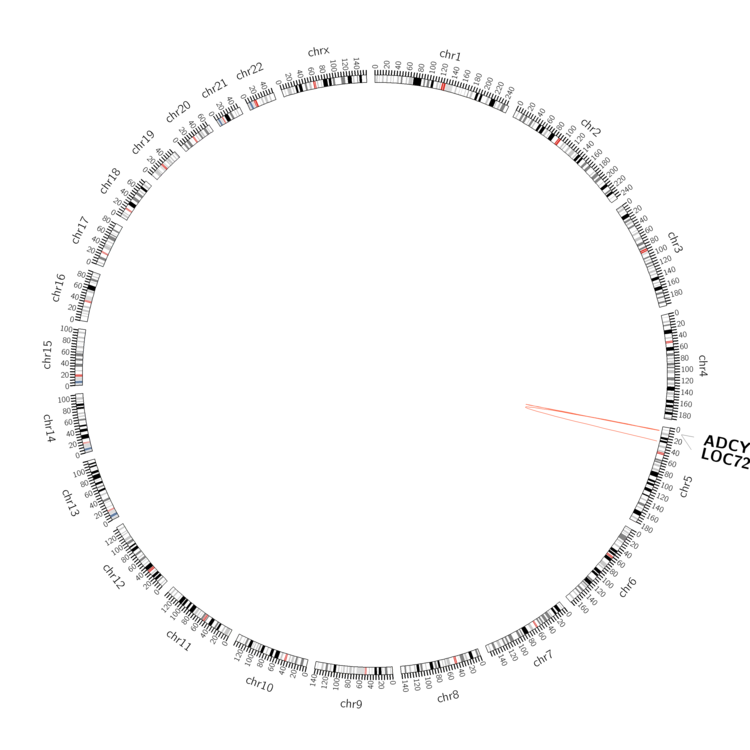 |
| - For Inter-chromosomal Variations |
| There's no inter-chromosomal structural variation. |
| - For Intra-chromosomal Variations |
| * Intra-chromosomal variantions includes 'intrachromosomal amplicon to amplicon', 'intrachromosomal amplicon to non-amplified dna', 'intrachromosomal deletion', 'intrachromosomal fold-back inversion', 'intrachromosomal inversion', 'intrachromosomal tandem duplication', 'Intrachromosomal unknown type', 'intrachromosomal with inverted orientation', 'intrachromosomal with non-inverted orientation'. |
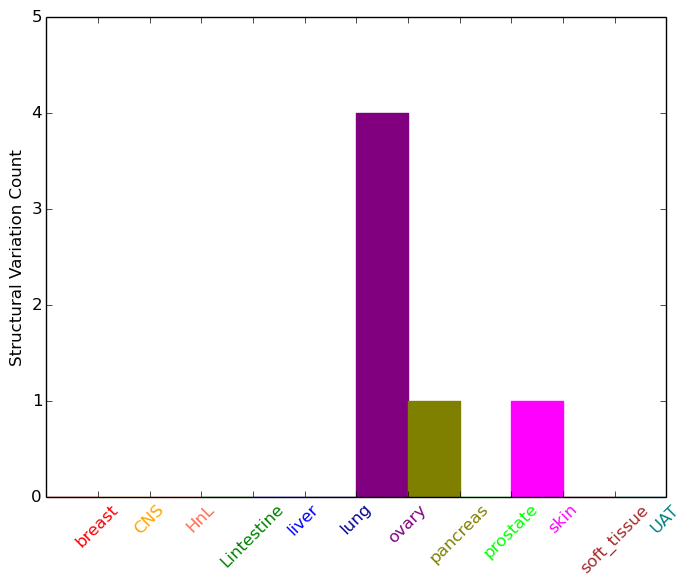 |
| Sample | Symbol_a | Chr_a | Start_a | End_a | Symbol_b | Chr_b | Start_b | End_b |
| ovary | ADCY2 | chr5 | 7504570 | 7504590 | ADCY2 | chr5 | 7497877 | 7497897 |
| ovary | ADCY2 | chr5 | 7507300 | 7507320 | ADCY2 | chr5 | 7508618 | 7508638 |
| ovary | ADCY2 | chr5 | 7578739 | 7578759 | ADCY2 | chr5 | 7575768 | 7575788 |
| ovary | ADCY2 | chr5 | 7619876 | 7619896 | ADCY2 | chr5 | 7619976 | 7619996 |
| pancreas | ADCY2 | chr5 | 7744635 | 7744655 | LOC729506 | chr5 | 8339972 | 8339992 |
| skin | ADCY2 | chr5 | 7742853 | 7742853 | chr5 | 27925460 | 27925460 |
| cf) Tissue number; Tissue name (1;Breast, 2;Central_nervous_system, 3;Haematopoietic_and_lymphoid_tissue, 4;Large_intestine, 5;Liver, 6;Lung, 7;Ovary, 8;Pancreas, 9;Prostate, 10;Skin, 11;Soft_tissue, 12;Upper_aerodigestive_tract) |
| * From mRNA Sanger sequences, Chitars2.0 arranged chimeric transcripts. This table shows ADCY2 related fusion information. |
| ID | Head Gene | Tail Gene | Accession | Gene_a | qStart_a | qEnd_a | Chromosome_a | tStart_a | tEnd_a | Gene_a | qStart_a | qEnd_a | Chromosome_a | tStart_a | tEnd_a |
| CD365127 | ADCY2 | 13 | 162 | 1 | 152004986 | 152005135 | WBSCR16 | 153 | 678 | 7 | 74457085 | 74474444 | |
| AA303012 | ADCY2 | 4 | 194 | 1 | 152004982 | 152005172 | LARP1B | 194 | 355 | 4 | 129029633 | 129029795 | |
| AW962618 | ADCY2 | 1 | 188 | 1 | 152004985 | 152005172 | LARP1B | 188 | 659 | 4 | 129029326 | 129029795 | |
| AI079657 | DDB1 | 30 | 138 | 11 | 61066923 | 61067031 | ADCY2 | 130 | 517 | 1 | 152005067 | 152006279 | |
| BM995008 | ADCY2 | 17 | 192 | 1 | 152004982 | 152005157 | ZFP36L2 | 188 | 668 | 2 | 43450007 | 43450487 | |
| AA398583 | ADCY2 | 5 | 65 | 5 | 7827585 | 7827645 | SPACA3 | 62 | 549 | 17 | 31322640 | 31324883 | |
| CN301511 | ADCY2 | 1 | 257 | 1 | 152005194 | 152006274 | KCTD15 | 252 | 801 | 19 | 34291354 | 34298067 | |
| BM015985 | FAM65A | 1 | 488 | 16 | 67576204 | 67576690 | ADCY2 | 482 | 560 | 1 | 152004983 | 152005064 | |
| CA441871 | ADCY2 | 17 | 161 | 1 | 152004982 | 152005126 | CNP | 154 | 623 | 17 | 40123919 | 40125831 | |
| DR421898 | H1F0 | 1 | 592 | 22 | 38201568 | 38202551 | ADCY2 | 592 | 659 | 1 | 152004992 | 152005059 | |
| CA309448 | ADCY2 | 17 | 487 | 1 | 152004982 | 152006276 | RNF19B | 485 | 740 | 1 | 33413832 | 33415290 | |
| AA159721 | JUP | 16 | 311 | 17 | 39847603 | 39847898 | ADCY2 | 308 | 406 | 1 | 152006137 | 152006235 | |
| BG338501 | ADCY2 | 2 | 681 | 1 | 152004981 | 152009468 | DZIP1L | 677 | 699 | 3 | 137813181 | 137813203 | |
| BM968972 | SPOCK3 | 16 | 470 | 4 | 167654535 | 167654988 | ADCY2 | 464 | 571 | 1 | 152004992 | 152005098 | |
| BQ430032 | ADCY2 | 1 | 470 | 1 | 152004982 | 152006275 | NOL6 | 471 | 856 | 9 | 33462041 | 33462421 | |
| BF825732 | ADCY2 | 1 | 390 | 1 | 152005108 | 152009434 | MYL12A | 385 | 467 | 18 | 3247826 | 3247908 | |
| AI807187 | ADCY2 | 1 | 83 | 1 | 152004984 | 152005066 | RBM39 | 77 | 498 | 20 | 34327092 | 34327512 | |
| BQ896787 | ADCY2 | 1 | 400 | 1 | 152005087 | 152009422 | SH3BGRL3 | 401 | 879 | 1 | 26606586 | 26607788 | |
| BU679228 | ADCY2 | 124 | 212 | 1 | 152004986 | 152005074 | TPRG1 | 193 | 221 | 3 | 188876707 | 188876816 | |
| CA450159 | COX6C | 14 | 336 | 8 | 100890377 | 100904212 | ADCY2 | 336 | 397 | 1 | 152004982 | 152005043 | |
| BQ014524 | MRPS16 | 272 | 302 | 10 | 75010662 | 75010692 | ADCY2 | 301 | 646 | 1 | 152005128 | 152009409 | |
| DB313344 | ADCY2 | 1 | 141 | 1 | 152004984 | 152005124 | TNKS2 | 135 | 535 | 10 | 93623131 | 93623530 | |
| AI809993 | ADCY2 | 1 | 84 | 1 | 152004983 | 152005066 | RBM39 | 78 | 525 | 20 | 34327092 | 34327539 | |
| BE875453 | LTA4H | 10 | 179 | 12 | 96400145 | 96407038 | ADCY2 | 173 | 334 | 1 | 152004982 | 152005144 | |
| Top |
| Mutation type/ Tissue ID | brca | cns | cerv | endome | haematopo | kidn | Lintest | liver | lung | ns | ovary | pancre | prost | skin | stoma | thyro | urina | |||
| Total # sample | 3 | 1 | 1 | 1 | 4 | 12 | 4 | 10 | 1 | |||||||||||
| GAIN (# sample) | 3 | 1 | 1 | 1 | 11 | 4 | 9 | 1 | ||||||||||||
| LOSS (# sample) | 4 | 1 | 3 |
| cf) Tissue ID; Tissue type (1; Breast, 2; Central_nervous_system, 3; Cervix, 4; Endometrium, 5; Haematopoietic_and_lymphoid_tissue, 6; Kidney, 7; Large_intestine, 8; Liver, 9; Lung, 10; NS, 11; Ovary, 12; Pancreas, 13; Prostate, 14; Skin, 15; Stomach, 16; Thyroid, 17; Urinary_tract) |
| Top |
|
 |
| Top |
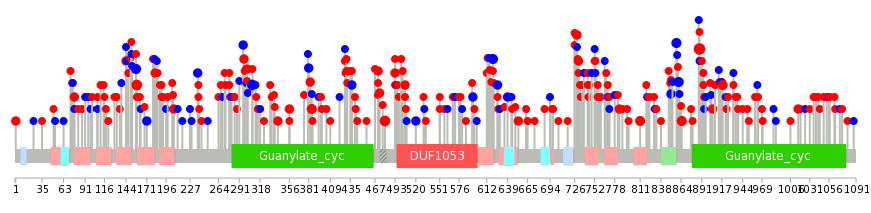
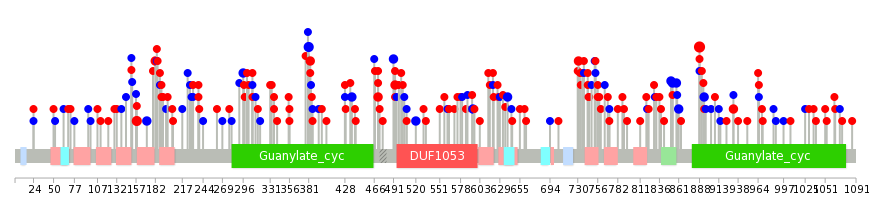
| Stat. for Non-Synonymous SNVs (# total SNVs=217) | (# total SNVs=82) |
 |  |
(# total SNVs=0) | (# total SNVs=0) |
| Top |
| * When you move the cursor on each content, you can see more deailed mutation information on the Tooltip. Those are primary_site,primary_histology,mutation(aa),pubmedID. |
| GRCh37 position | Mutation(aa) | Unique sampleID count |
| chr5:7802364-7802364 | p.V888I | 6 |
| chr5:7709361-7709361 | p.R480H | 4 |
| chr5:7757684-7757715 | p.? | 4 |
| chr5:7695919-7695919 | p.P308P | 4 |
| chr5:7520914-7520914 | p.A158T | 4 |
| chr5:7789868-7789868 | p.P861P | 3 |
| chr5:7802454-7802454 | p.E918K | 3 |
| chr5:7789879-7789879 | p.A865G | 3 |
| chr5:7766890-7766890 | p.L729V | 3 |
| chr5:7784525-7784525 | p.S811Y | 3 |
| Top |
|
 |
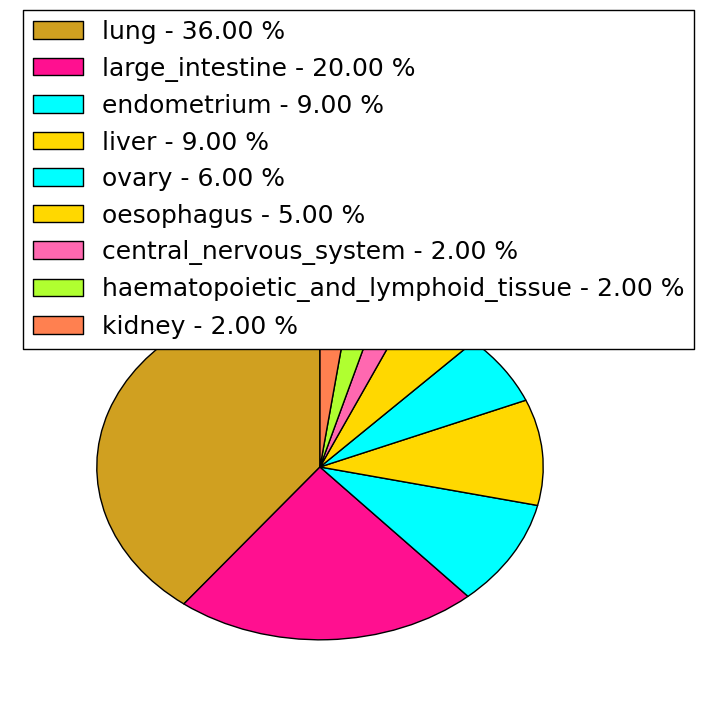
| Point Mutation/ Tissue ID | 1 | 2 | 3 | 4 | 5 | 6 | 7 | 8 | 9 | 10 | 11 | 12 | 13 | 14 | 15 | 16 | 17 | 18 | 19 | 20 |
| # sample | 15 | 4 | 1 | 39 | 3 | 17 | 3 | 2 | 42 | 16 | 15 | 9 | 27 | 1 | 20 | |||||
| # mutation | 15 | 4 | 1 | 40 | 3 | 19 | 2 | 2 | 49 | 22 | 14 | 9 | 28 | 1 | 28 | |||||
| nonsynonymous SNV | 9 | 26 | 3 | 17 | 1 | 2 | 27 | 17 | 11 | 6 | 13 | 19 | ||||||||
| synonymous SNV | 6 | 4 | 1 | 14 | 2 | 1 | 22 | 5 | 3 | 3 | 15 | 1 | 9 |
| cf) Tissue ID; Tissue type (1; BLCA[Bladder Urothelial Carcinoma], 2; BRCA[Breast invasive carcinoma], 3; CESC[Cervical squamous cell carcinoma and endocervical adenocarcinoma], 4; COAD[Colon adenocarcinoma], 5; GBM[Glioblastoma multiforme], 6; Glioma Low Grade, 7; HNSC[Head and Neck squamous cell carcinoma], 8; KICH[Kidney Chromophobe], 9; KIRC[Kidney renal clear cell carcinoma], 10; KIRP[Kidney renal papillary cell carcinoma], 11; LAML[Acute Myeloid Leukemia], 12; LUAD[Lung adenocarcinoma], 13; LUSC[Lung squamous cell carcinoma], 14; OV[Ovarian serous cystadenocarcinoma ], 15; PAAD[Pancreatic adenocarcinoma], 16; PRAD[Prostate adenocarcinoma], 17; SKCM[Skin Cutaneous Melanoma], 18:STAD[Stomach adenocarcinoma], 19:THCA[Thyroid carcinoma], 20:UCEC[Uterine Corpus Endometrial Carcinoma]) |
| Top |
| * We represented just top 10 SNVs. When you move the cursor on each content, you can see more deailed mutation information on the Tooltip. Those are primary_site, primary_histology, mutation(aa), pubmedID. |
| Genomic Position | Mutation(aa) | Unique sampleID count |
| chr5:7802364 | p.V888I | 5 |
| chr5:7709334 | p.A158T | 3 |
| chr5:7706890 | p.N381N | 3 |
| chr5:7520914 | p.R471L | 3 |
| chr5:7727285 | p.L851L | 2 |
| chr5:7698384 | p.I336L | 2 |
| chr5:7520955 | p.R853R | 2 |
| chr5:7766897 | p.S743N | 2 |
| chr5:7520986 | p.N858N | 2 |
| chr5:7698445 | p.K356R | 2 |
| * Copy number data were extracted from TCGA using R package TCGA-Assembler. The URLs of all public data files on TCGA DCC data server were gathered on Jan-05-2015. Function ProcessCNAData in TCGA-Assembler package was used to obtain gene-level copy number value which is calculated as the average copy number of the genomic region of a gene. |
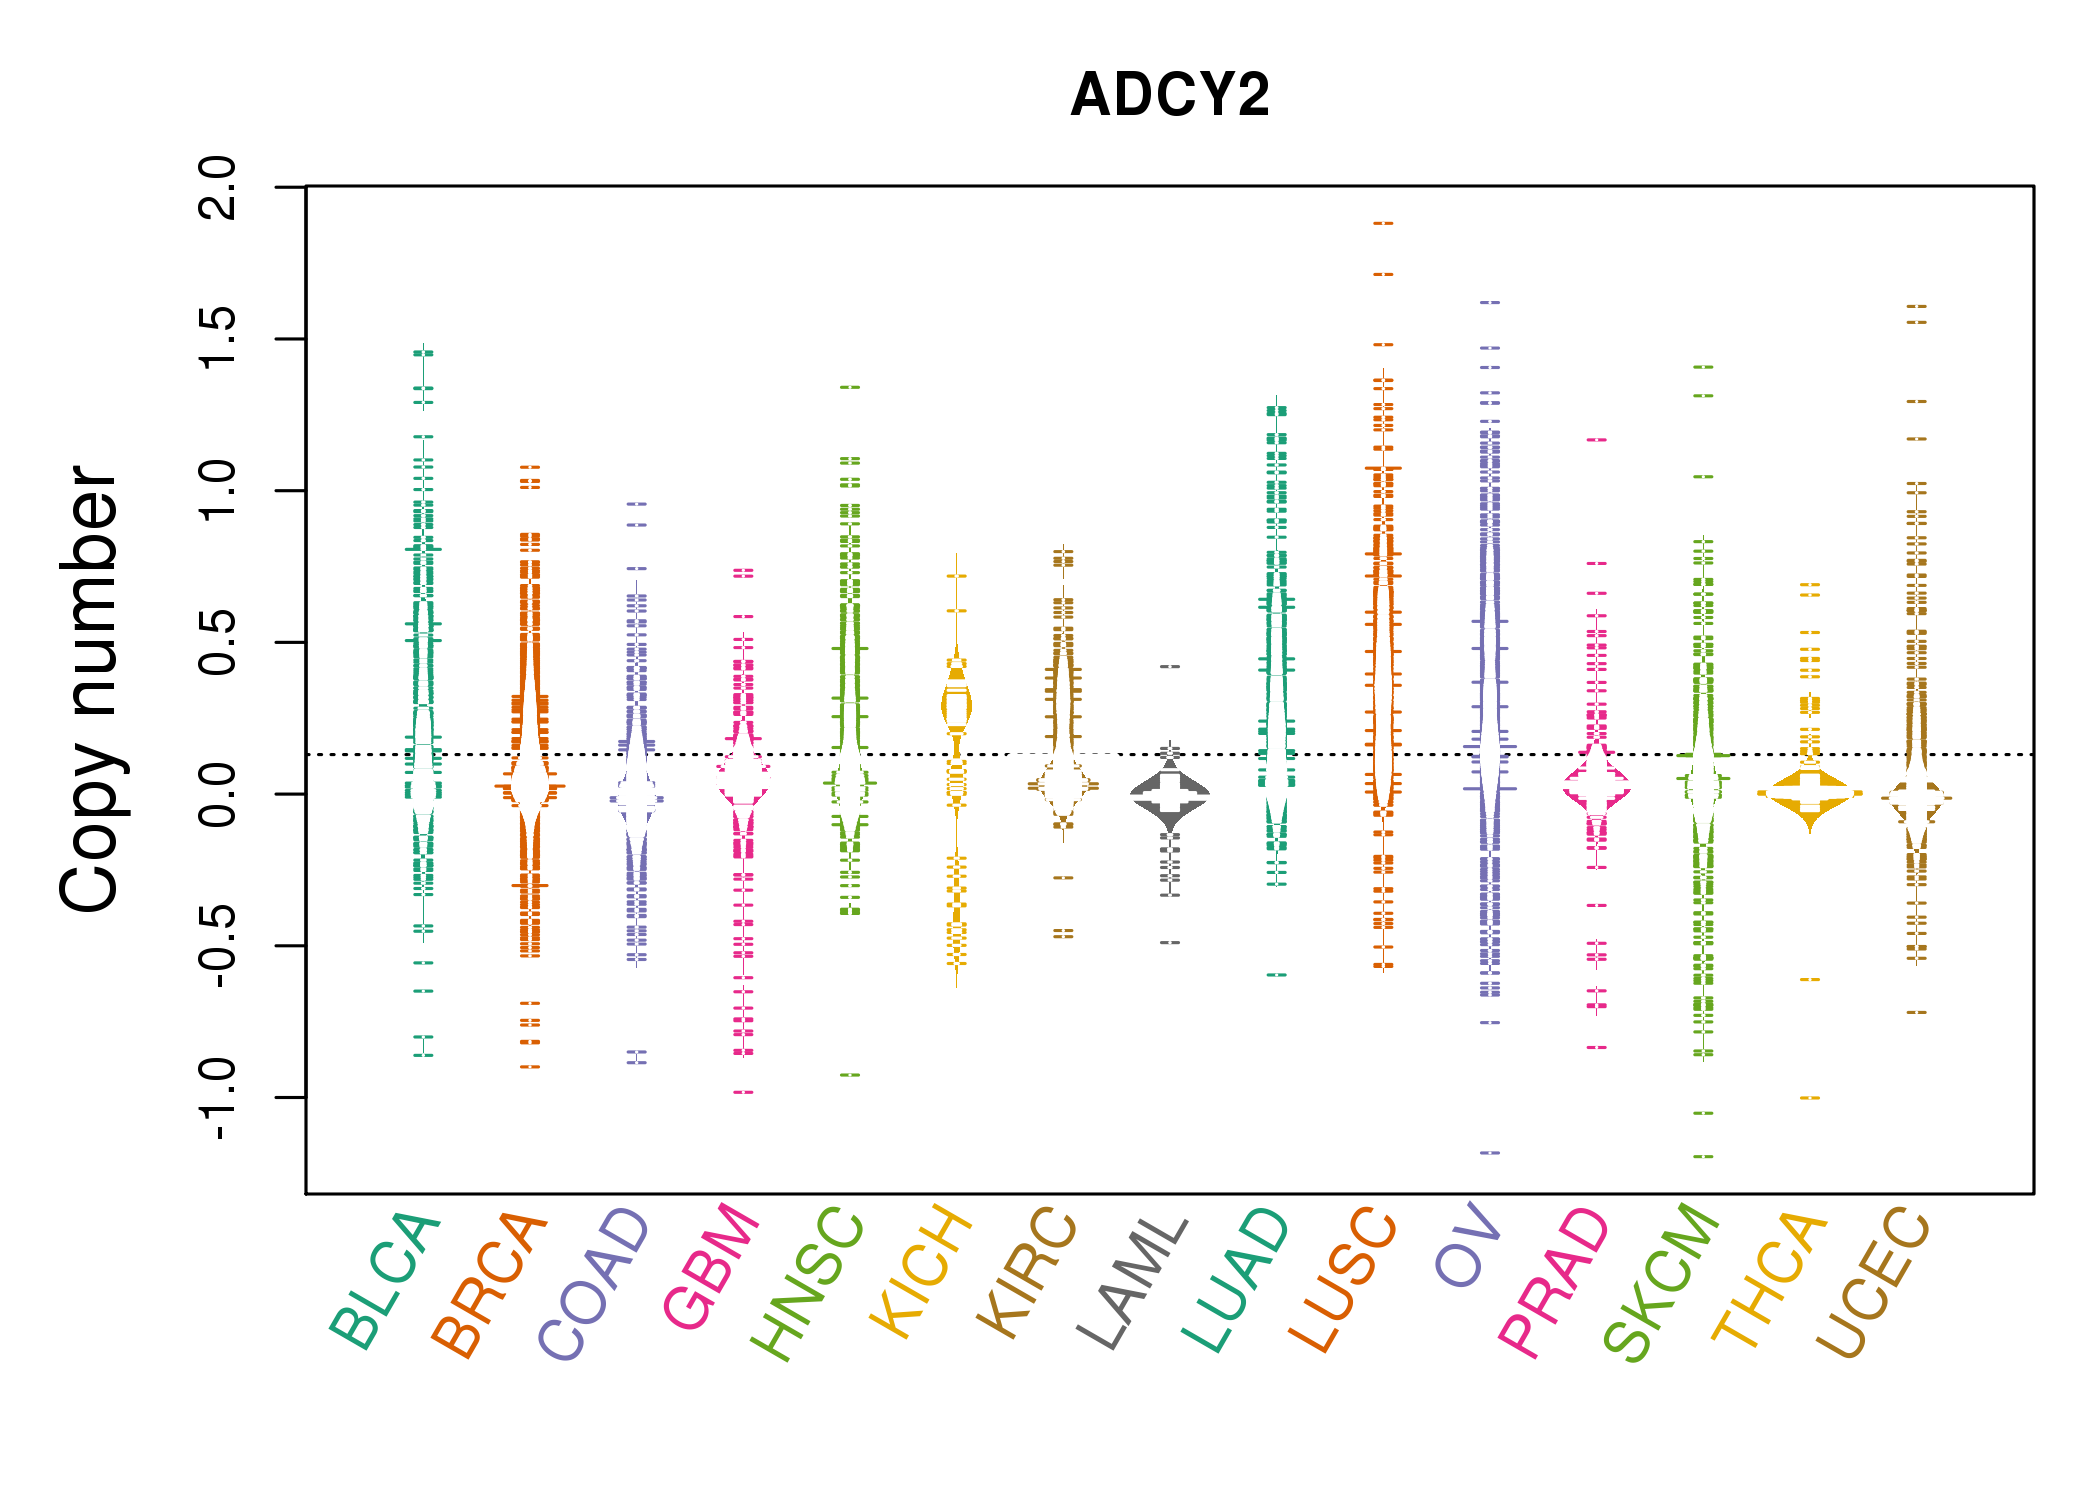 |
| cf) Tissue ID[Tissue type]: BLCA[Bladder Urothelial Carcinoma], BRCA[Breast invasive carcinoma], CESC[Cervical squamous cell carcinoma and endocervical adenocarcinoma], COAD[Colon adenocarcinoma], GBM[Glioblastoma multiforme], Glioma Low Grade, HNSC[Head and Neck squamous cell carcinoma], KICH[Kidney Chromophobe], KIRC[Kidney renal clear cell carcinoma], KIRP[Kidney renal papillary cell carcinoma], LAML[Acute Myeloid Leukemia], LUAD[Lung adenocarcinoma], LUSC[Lung squamous cell carcinoma], OV[Ovarian serous cystadenocarcinoma ], PAAD[Pancreatic adenocarcinoma], PRAD[Prostate adenocarcinoma], SKCM[Skin Cutaneous Melanoma], STAD[Stomach adenocarcinoma], THCA[Thyroid carcinoma], UCEC[Uterine Corpus Endometrial Carcinoma] |
| Top |
| Gene Expression for ADCY2 |
| * CCLE gene expression data were extracted from CCLE_Expression_Entrez_2012-10-18.res: Gene-centric RMA-normalized mRNA expression data. |
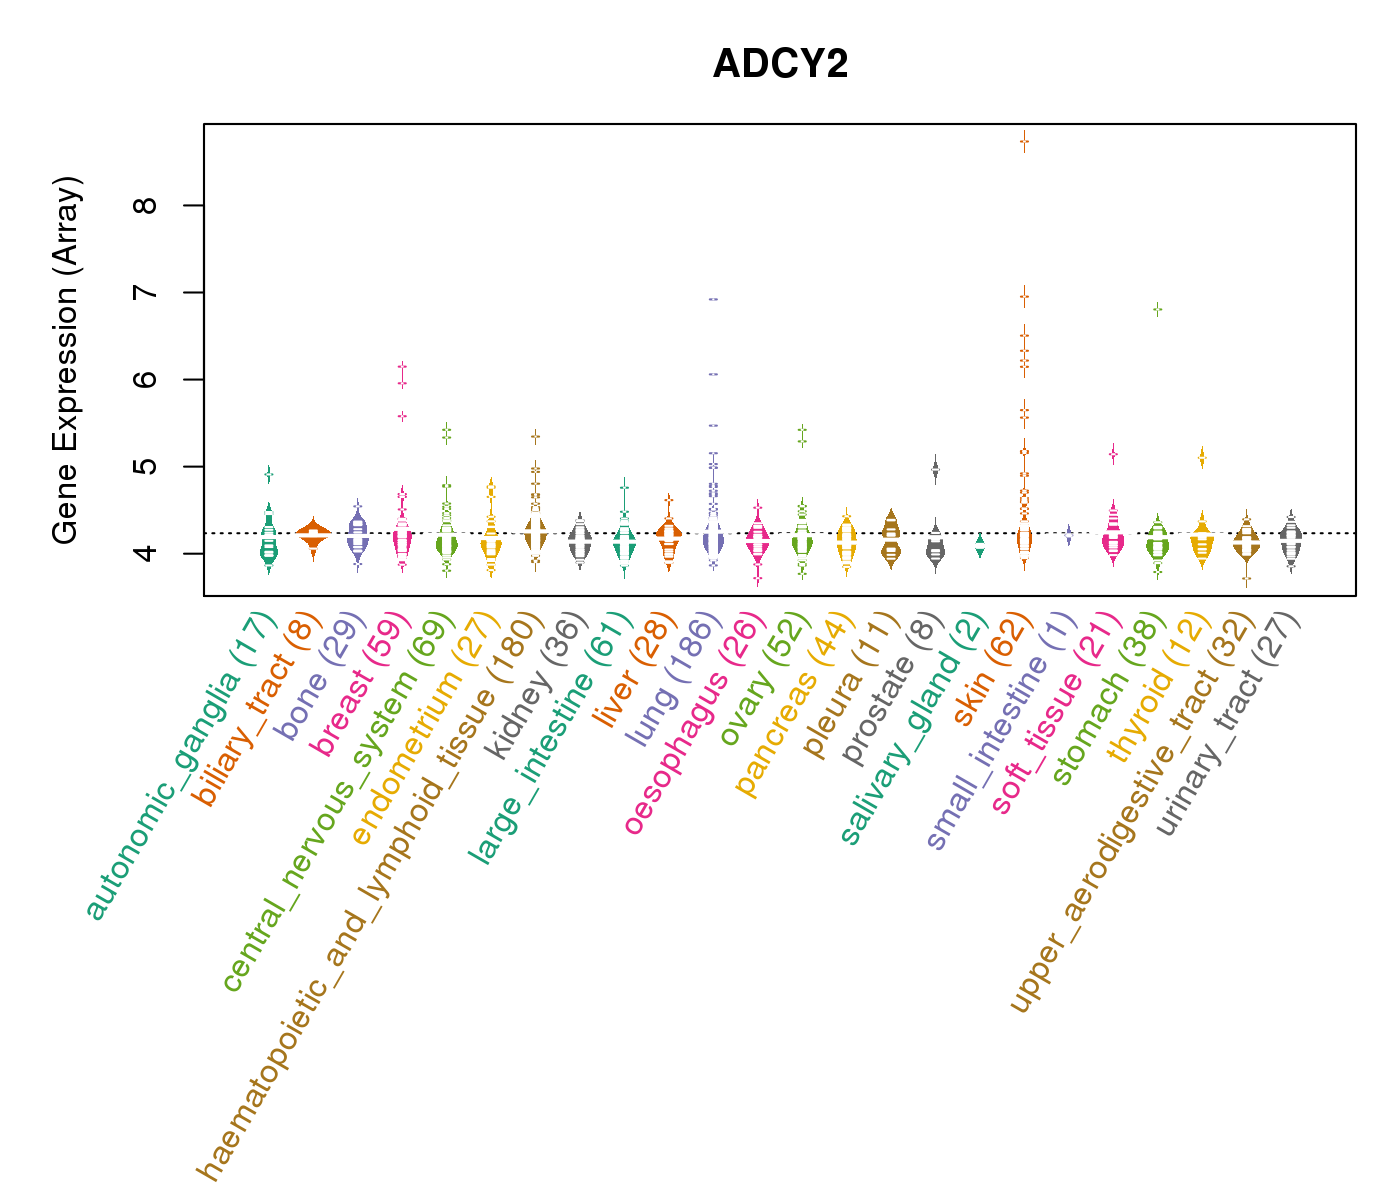 |
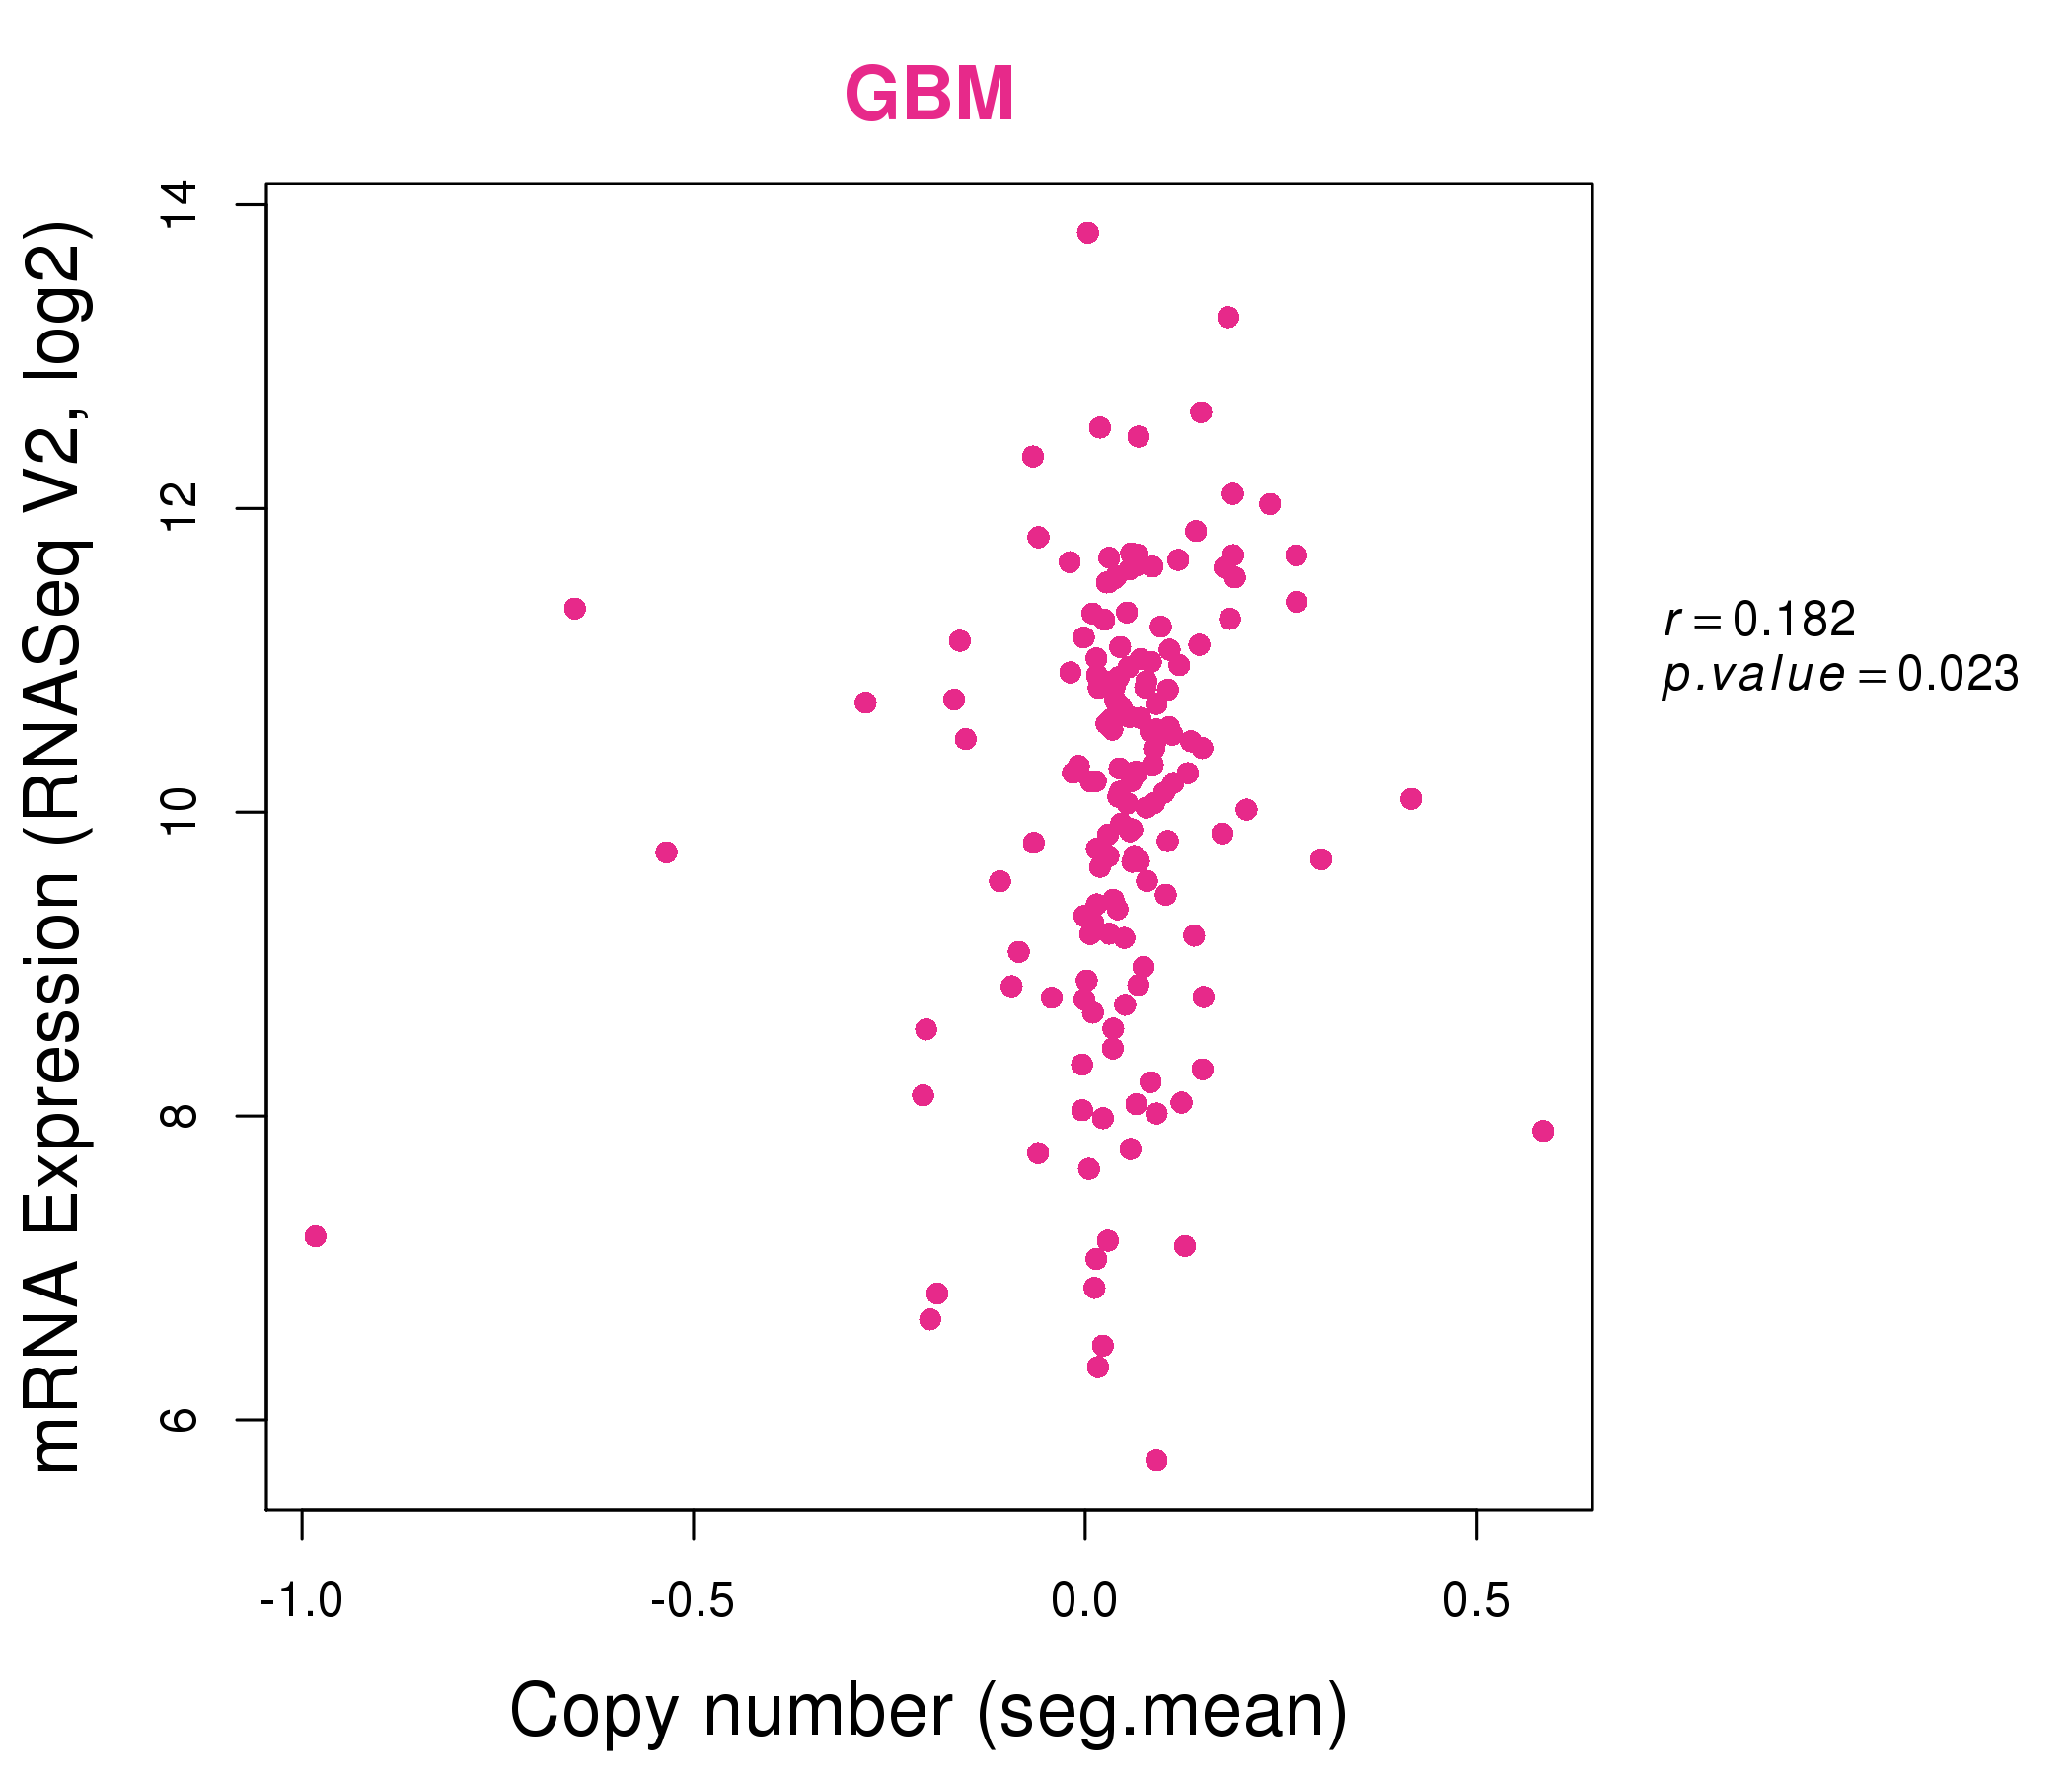
| * Normalized gene expression data of RNASeqV2 was extracted from TCGA using R package TCGA-Assembler. The URLs of all public data files on TCGA DCC data server were gathered at Jan-05-2015. Only eight cancer types have enough normal control samples for differential expression analysis. (t test, adjusted p<0.05 (using Benjamini-Hochberg FDR)) |
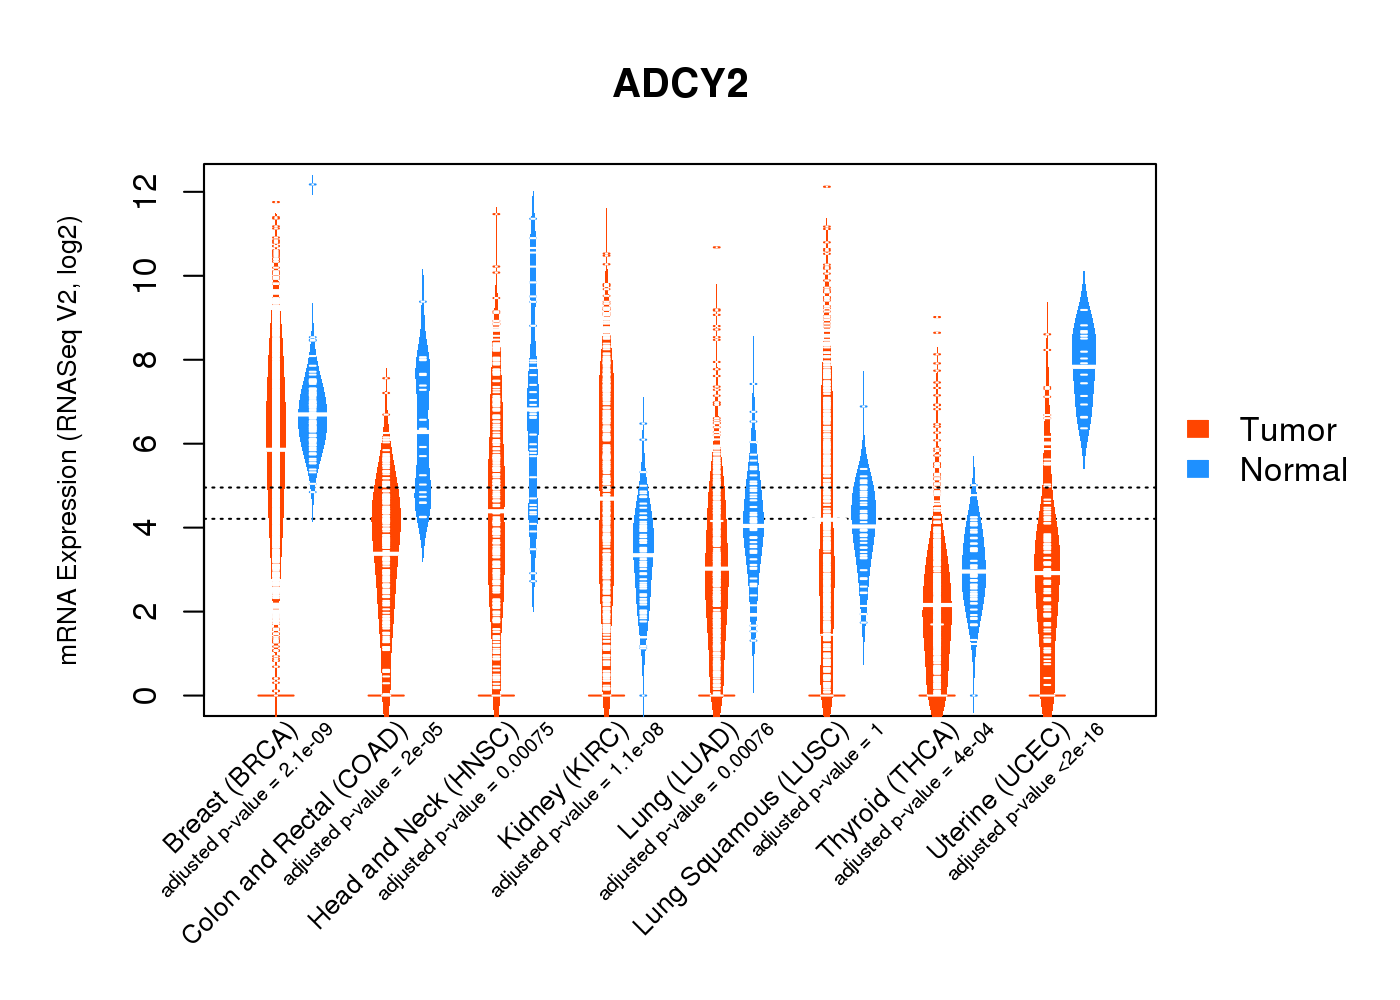 |
| Top |
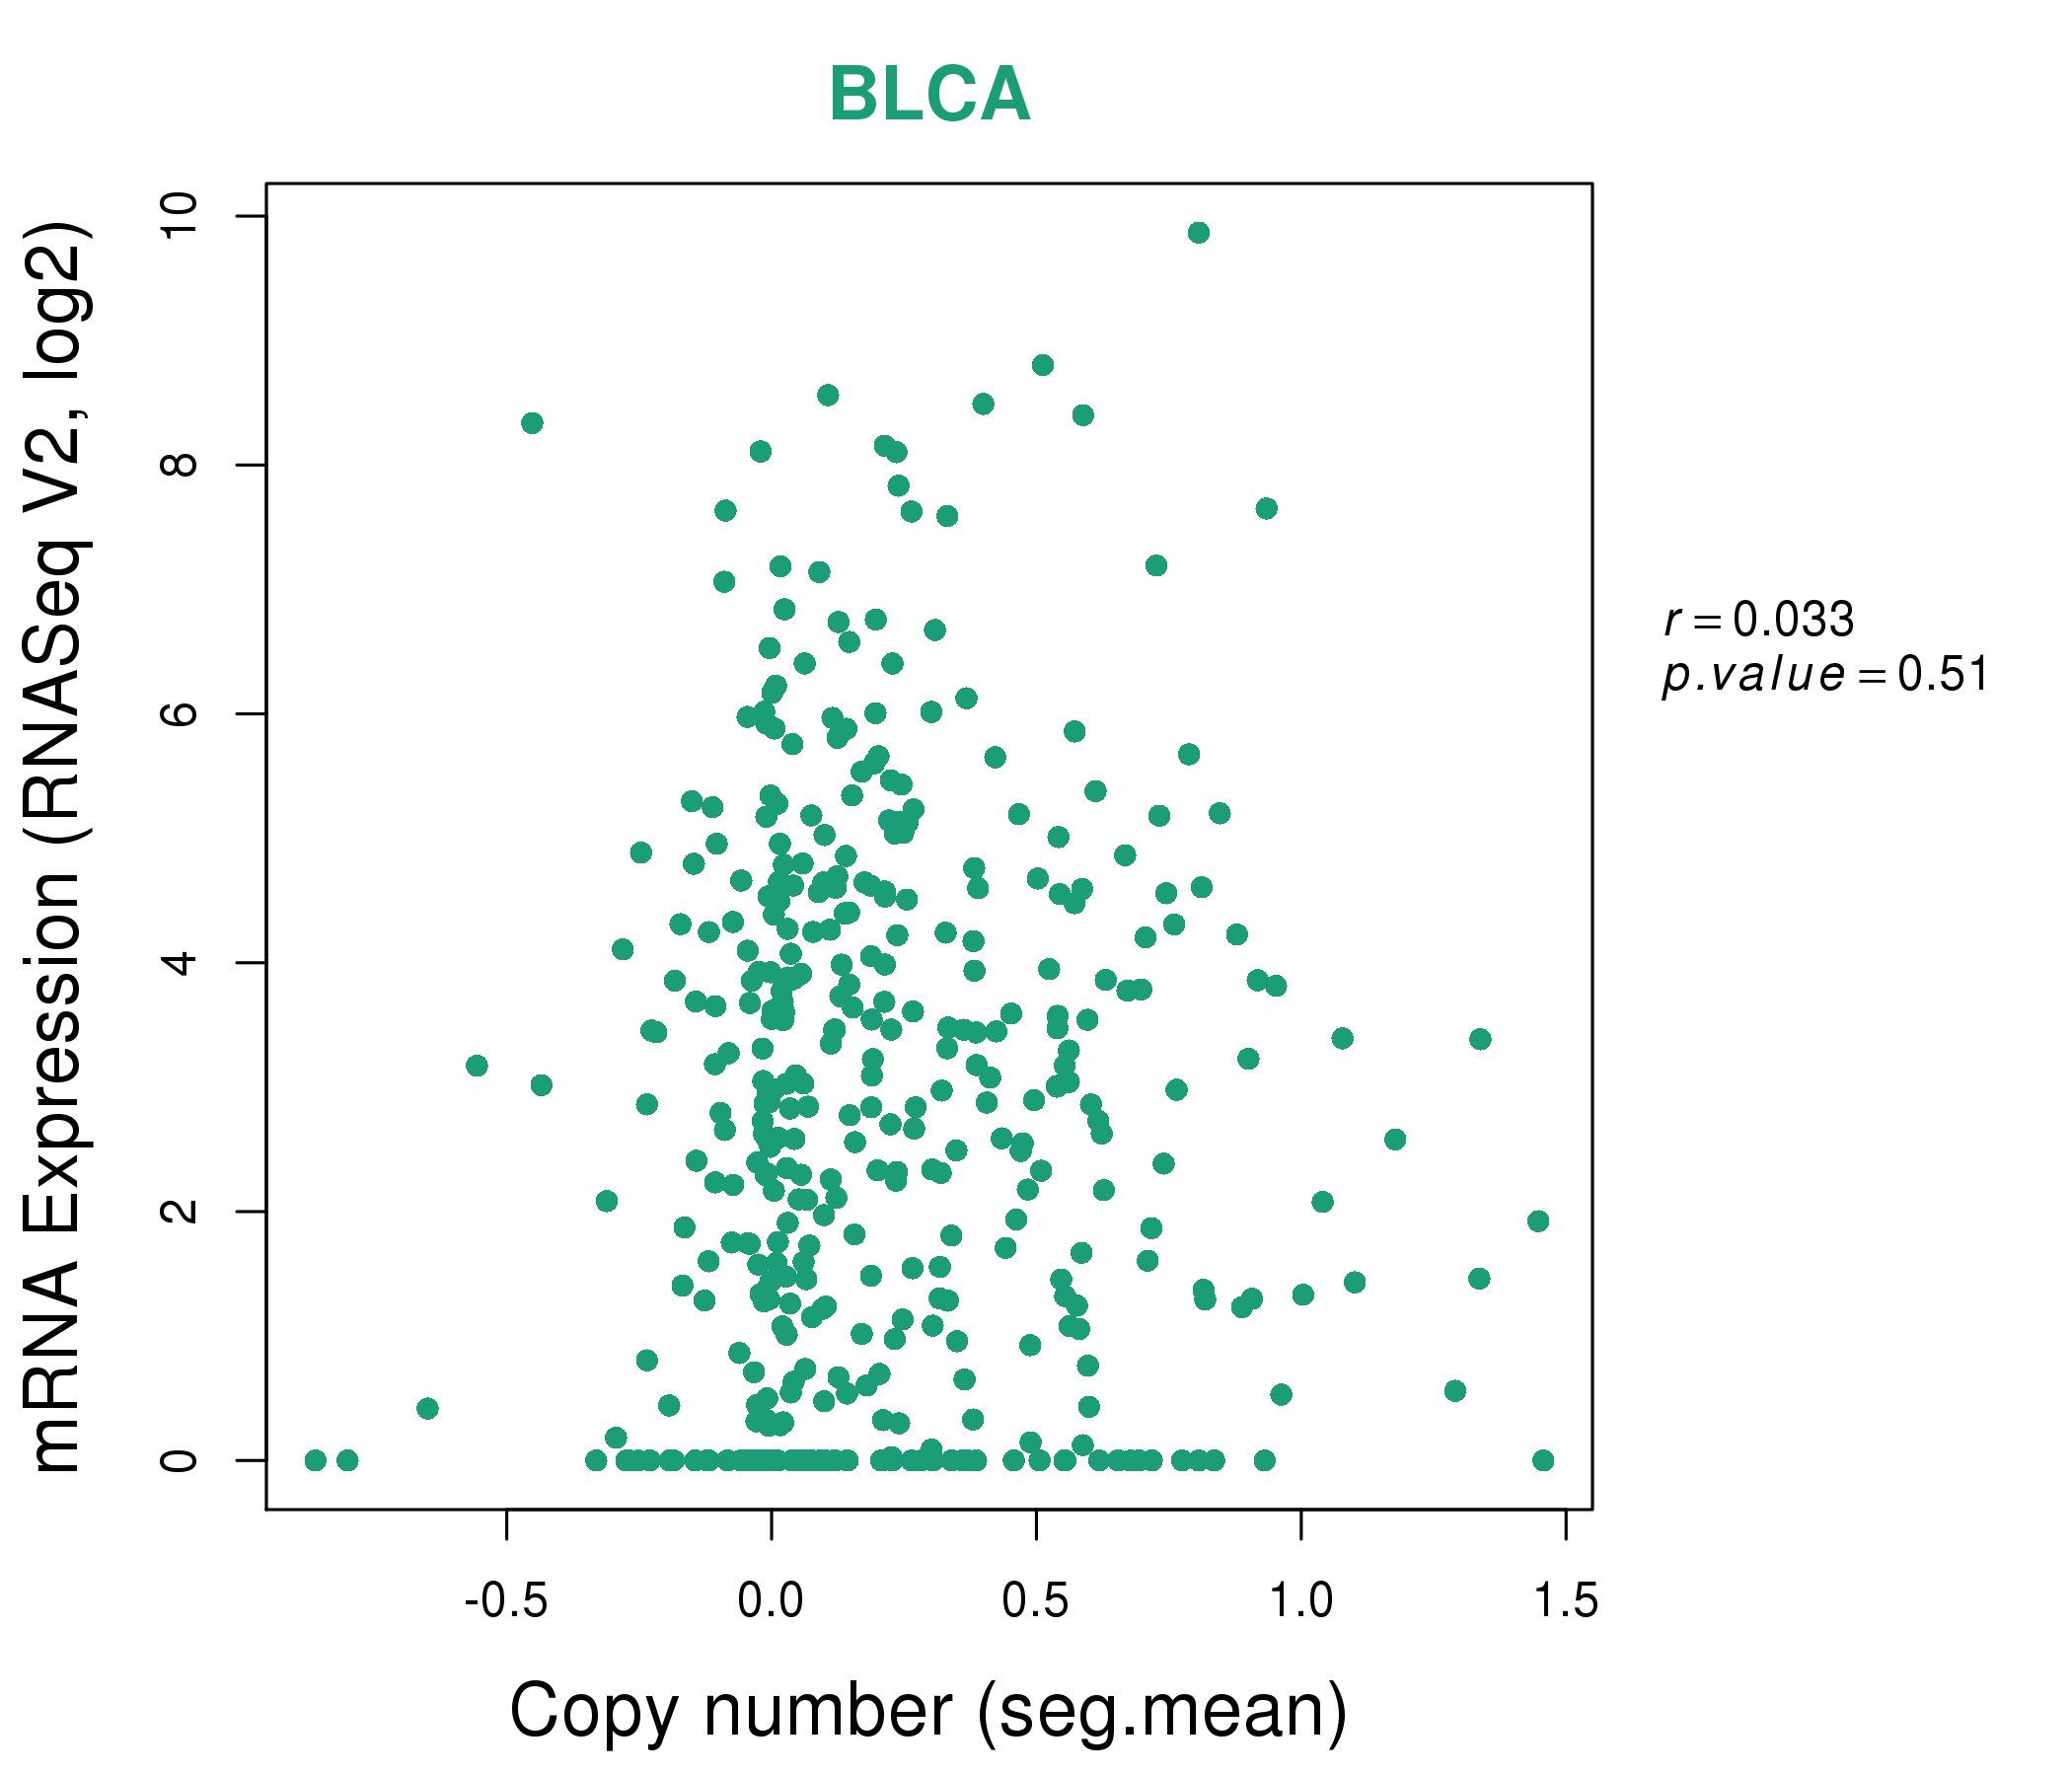
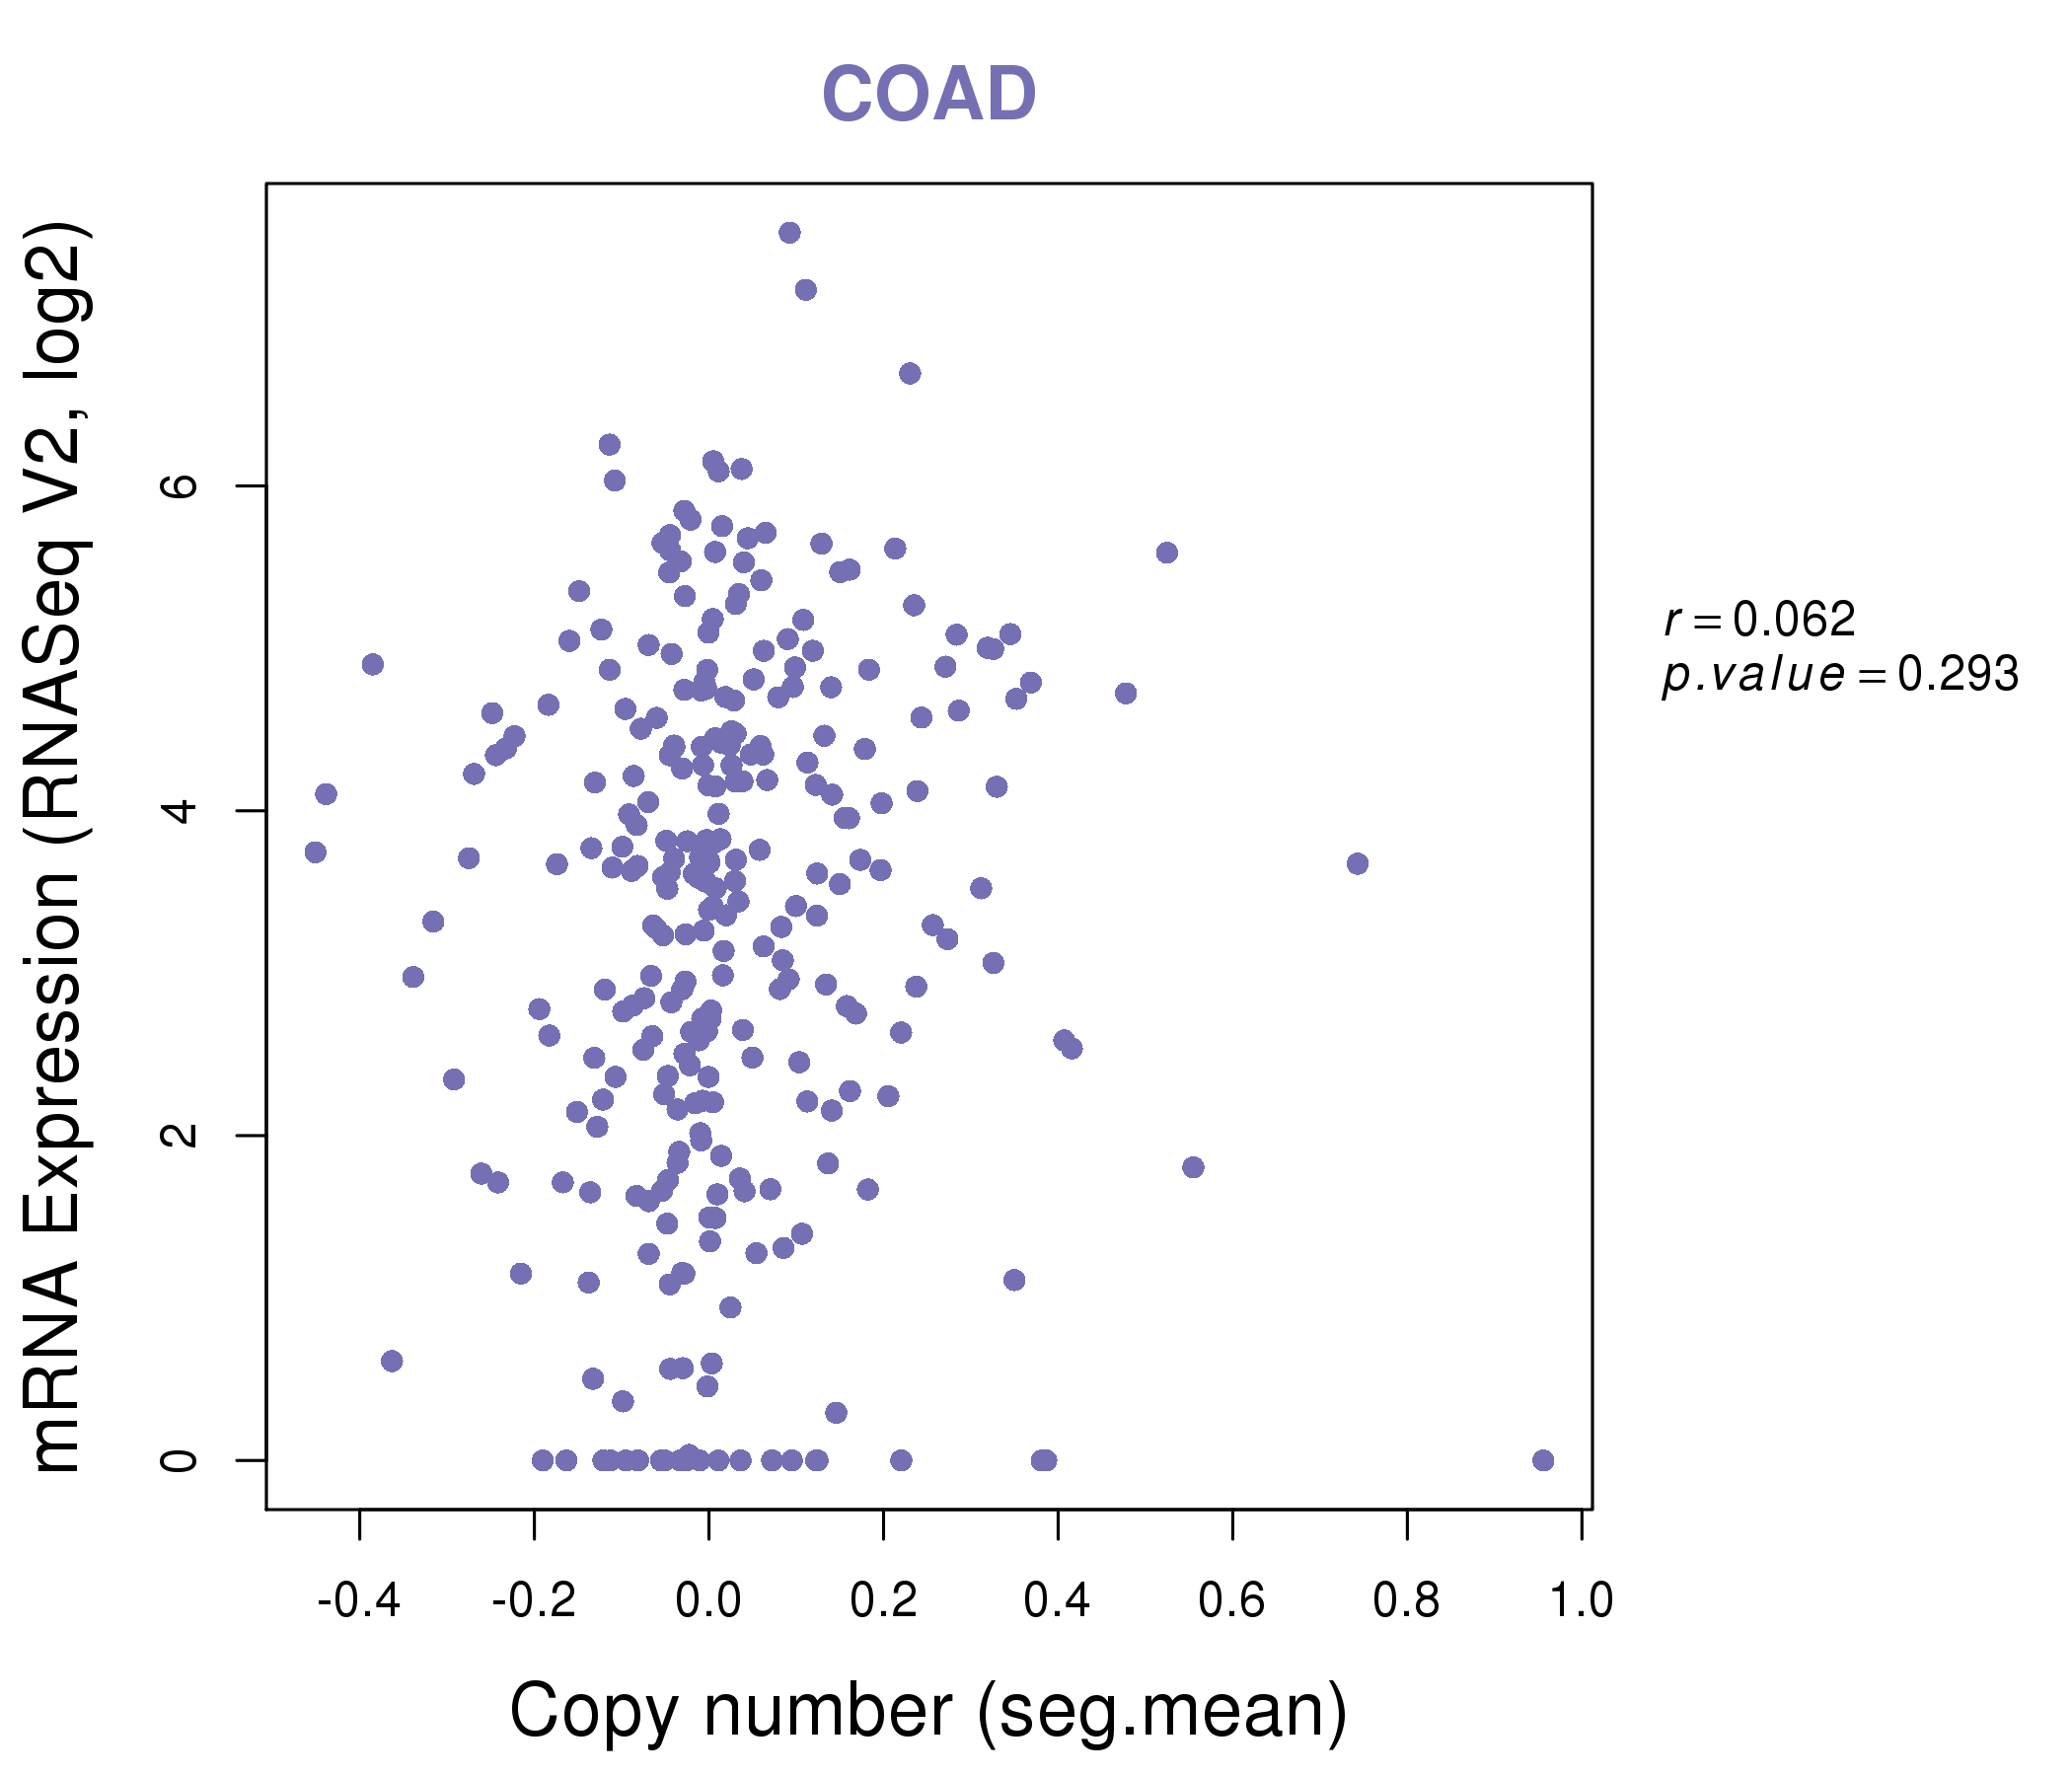
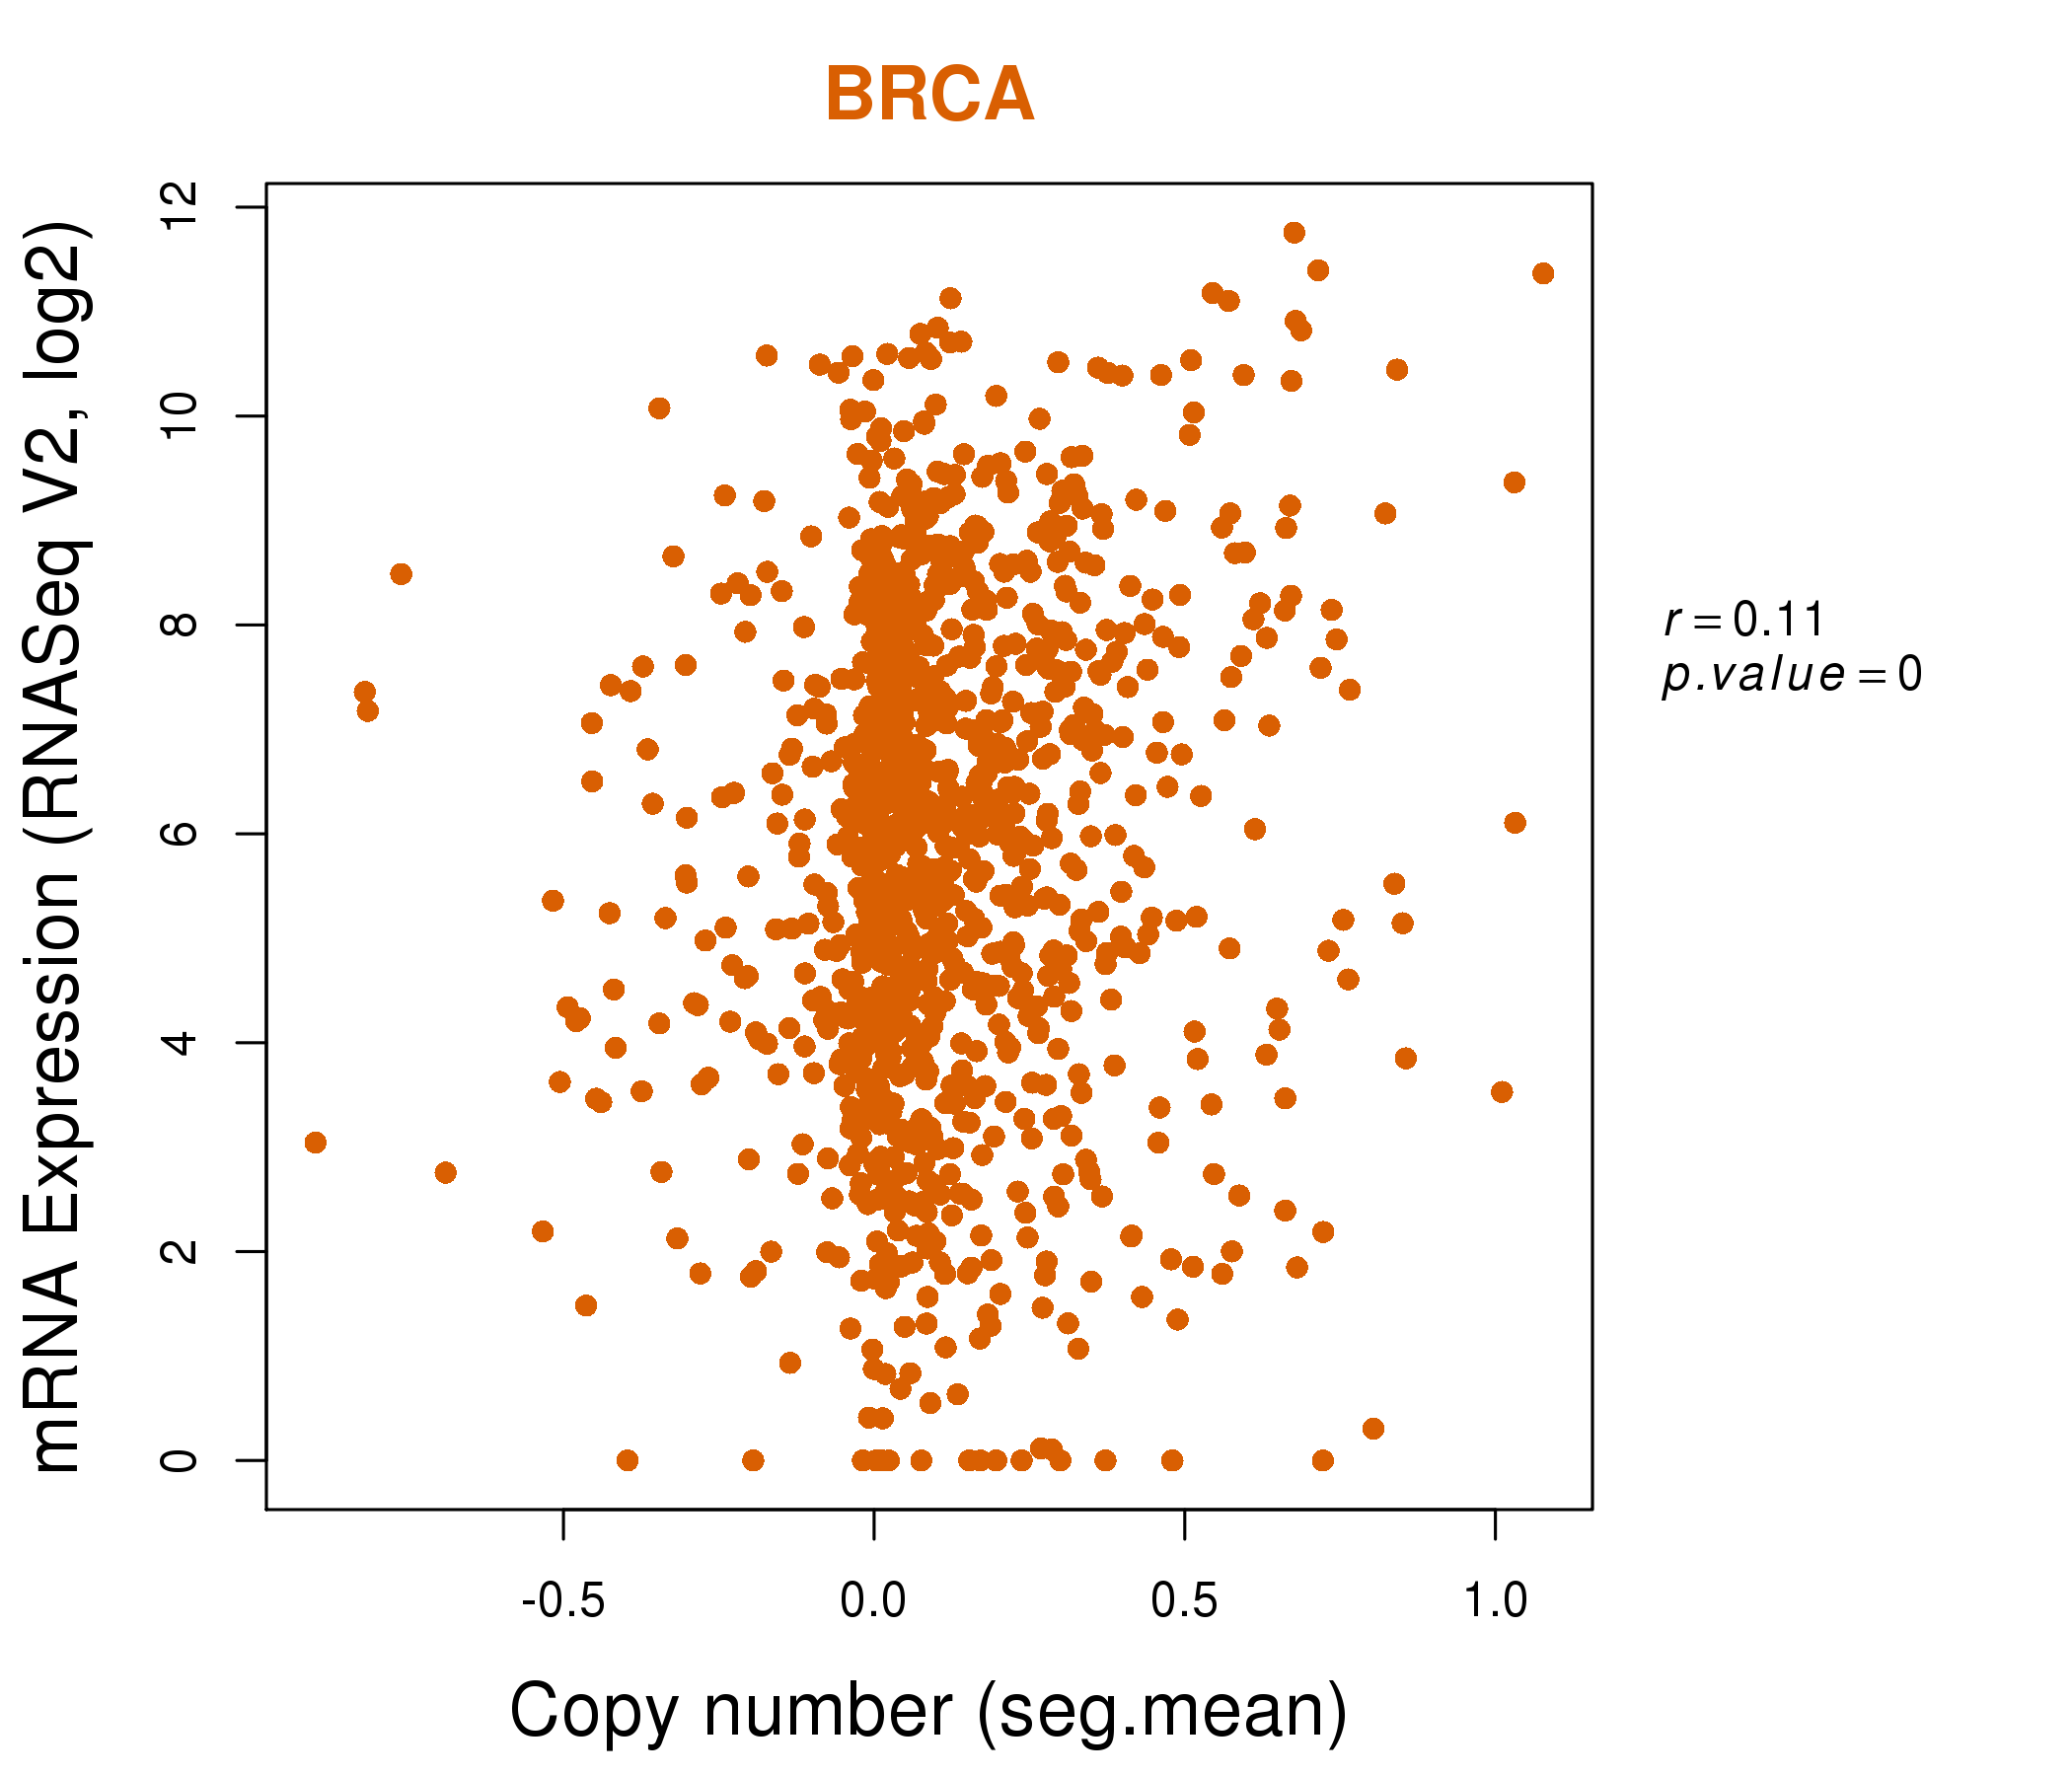
| * This plots show the correlation between CNV and gene expression. |
: Open all plots for all cancer types
 |
|
 |
|
| Top |
| Gene-Gene Network Information |
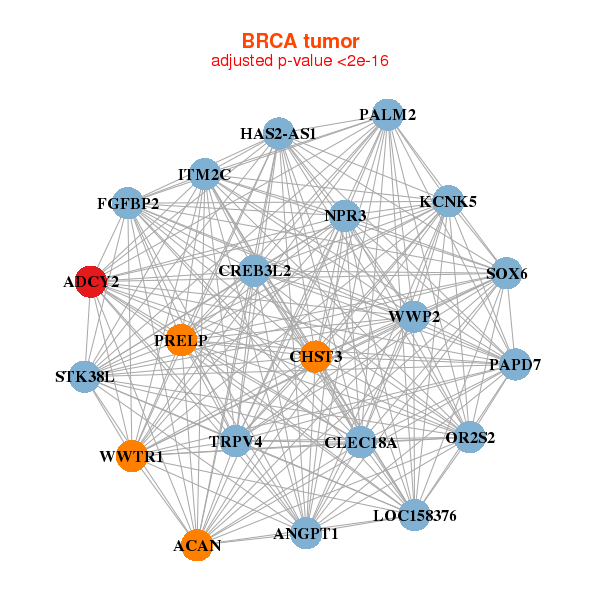
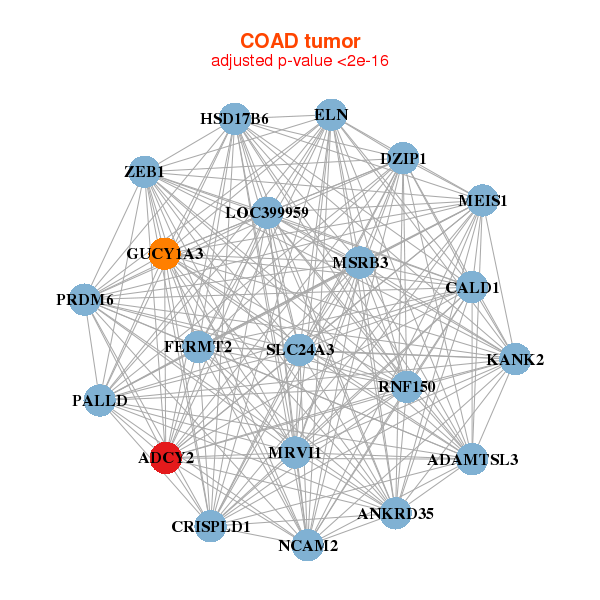
| * Co-Expression network figures were drawn using R package igraph. Only the top 20 genes with the highest correlations were shown. Red circle: input gene, orange circle: cell metabolism gene, sky circle: other gene |
: Open all plots for all cancer types
 |
| ||||
| ACAN,ADCY2,ANGPT1,NPR3,CHST3,CLEC18A,CREB3L2, FGFBP2,HAS2-AS1,ITM2C,KCNK5,LOC158376,OR2S2,PALM2, PAPD7,PRELP,SOX6,STK38L,TRPV4,WWP2,WWTR1 | ACHE,ADCY2,AMPD1,BEST3,CALML6,CMYA5,DUSP26, FLJ41941,HHATL,KLHL38,MB,MYADML2,MYLK3,MYOZ2, PKIA,RYR1,SMTNL2,SRPK3,SYNPO2L,TXLNB,UGT3A1 | ||||
 |
| ||||
| ADAMTSL3,ADCY2,ANKRD35,CALD1,CRISPLD1,DZIP1,ELN, FERMT2,GUCY1A3,HSD17B6,KANK2,LOC399959,MEIS1,MRVI1, MSRB3,NCAM2,PALLD,PRDM6,RNF150,SLC24A3,ZEB1 | ADAMTSL3,ADCY2,APBB1,ARHGEF4,DTX3,EPM2A,ARHGEF25, HAND2,JAM3,LIMS2,MAB21L2,MEIS1,MEIS2,NEXN, NXN,PACSIN3,PDZRN3,PDZRN4,PGM5,RBPMS,RBPMS2 |
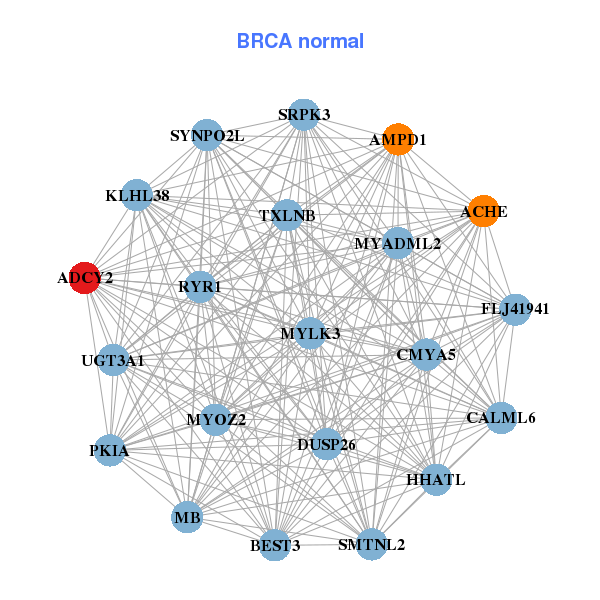
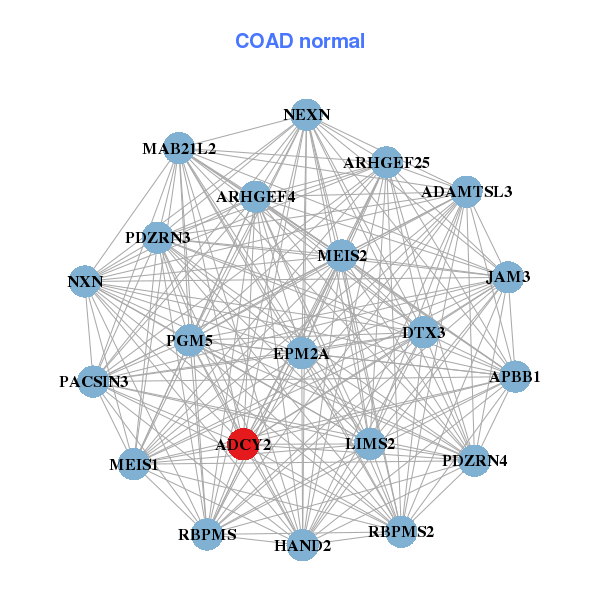
| * Co-Expression network figures were drawn using R package igraph. Only the top 20 genes with the highest correlations were shown. Red circle: input gene, orange circle: cell metabolism gene, sky circle: other gene |
: Open all plots for all cancer types
| Top |
: Open all interacting genes' information including KEGG pathway for all interacting genes from DAVID
| Top |
| Pharmacological Information for ADCY2 |
| DB Category | DB Name | DB's ID and Url link |
| Chemistry | ChEMBL | CHEMBL2097167; -. |
| Organism-specific databases | PharmGKB | PA24561; -. |
| Organism-specific databases | CTD | 108; -. |
| * Gene Centered Interaction Network. |
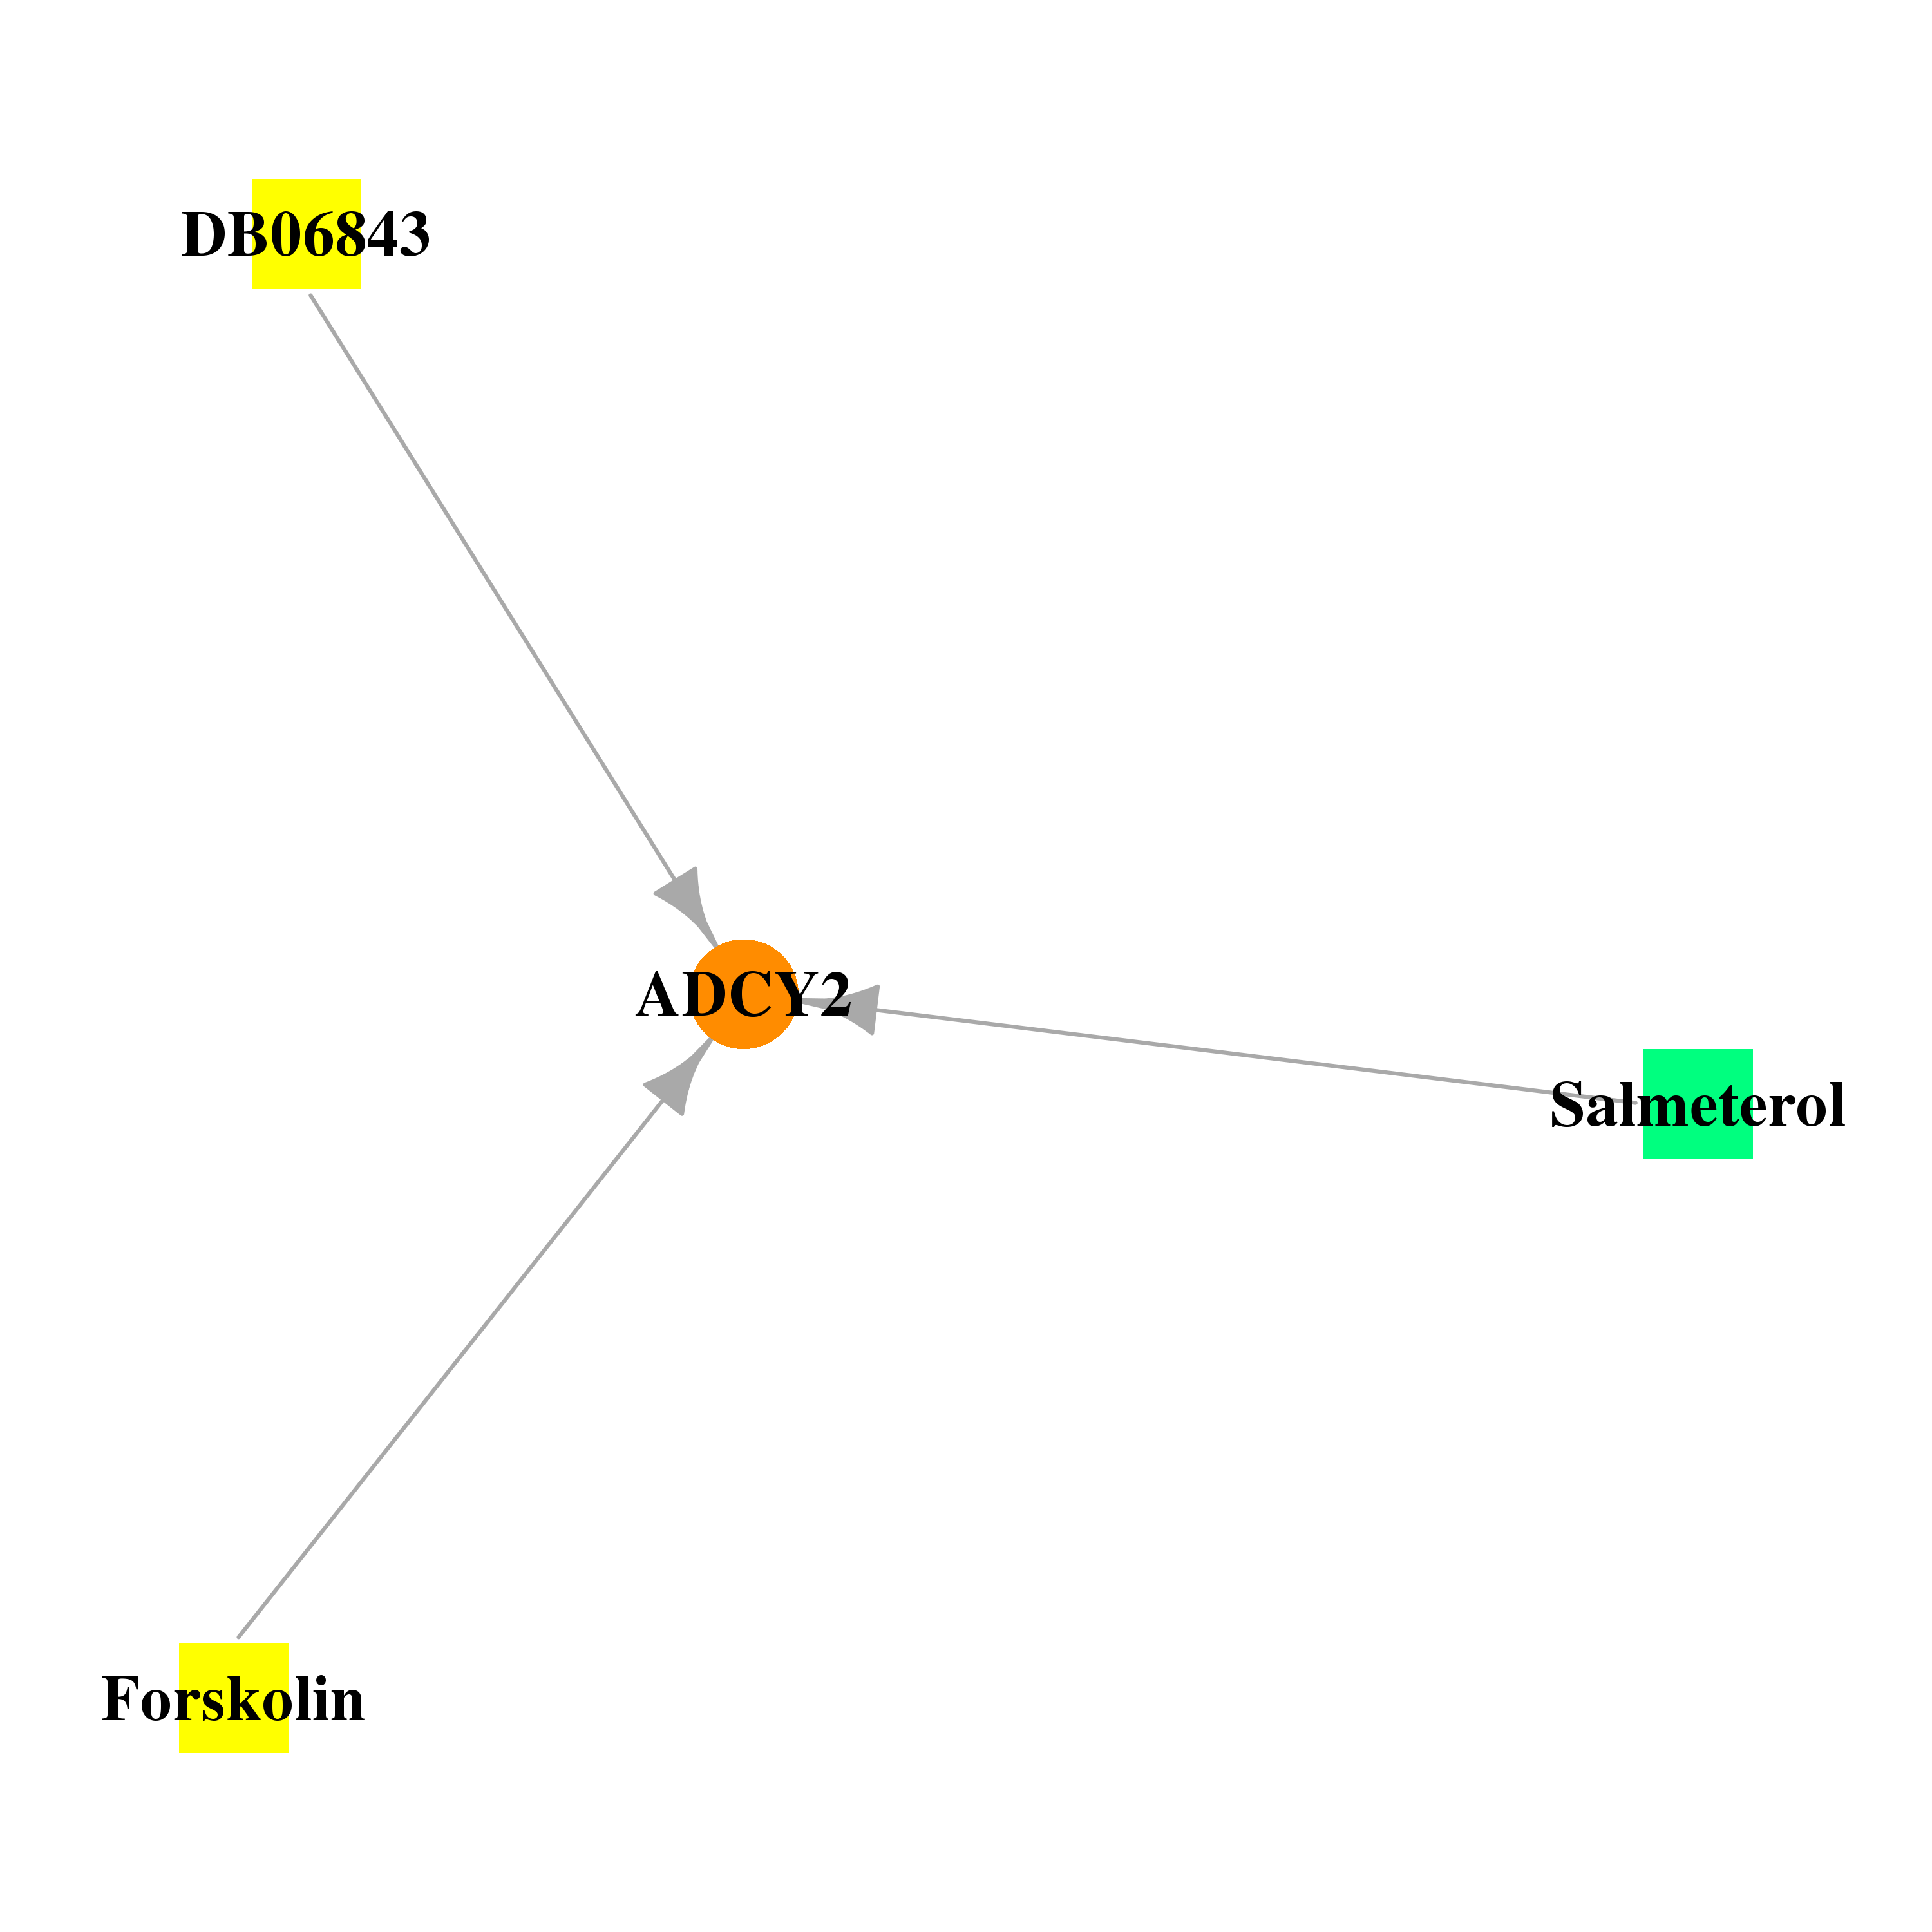 |
| * Drug Centered Interaction Network. |
| DrugBank ID | Target Name | Drug Groups | Generic Name | Drug Centered Network | Drug Structure |
| DB02587 | adenylate cyclase 2 (brain) | experimental | Forskolin | 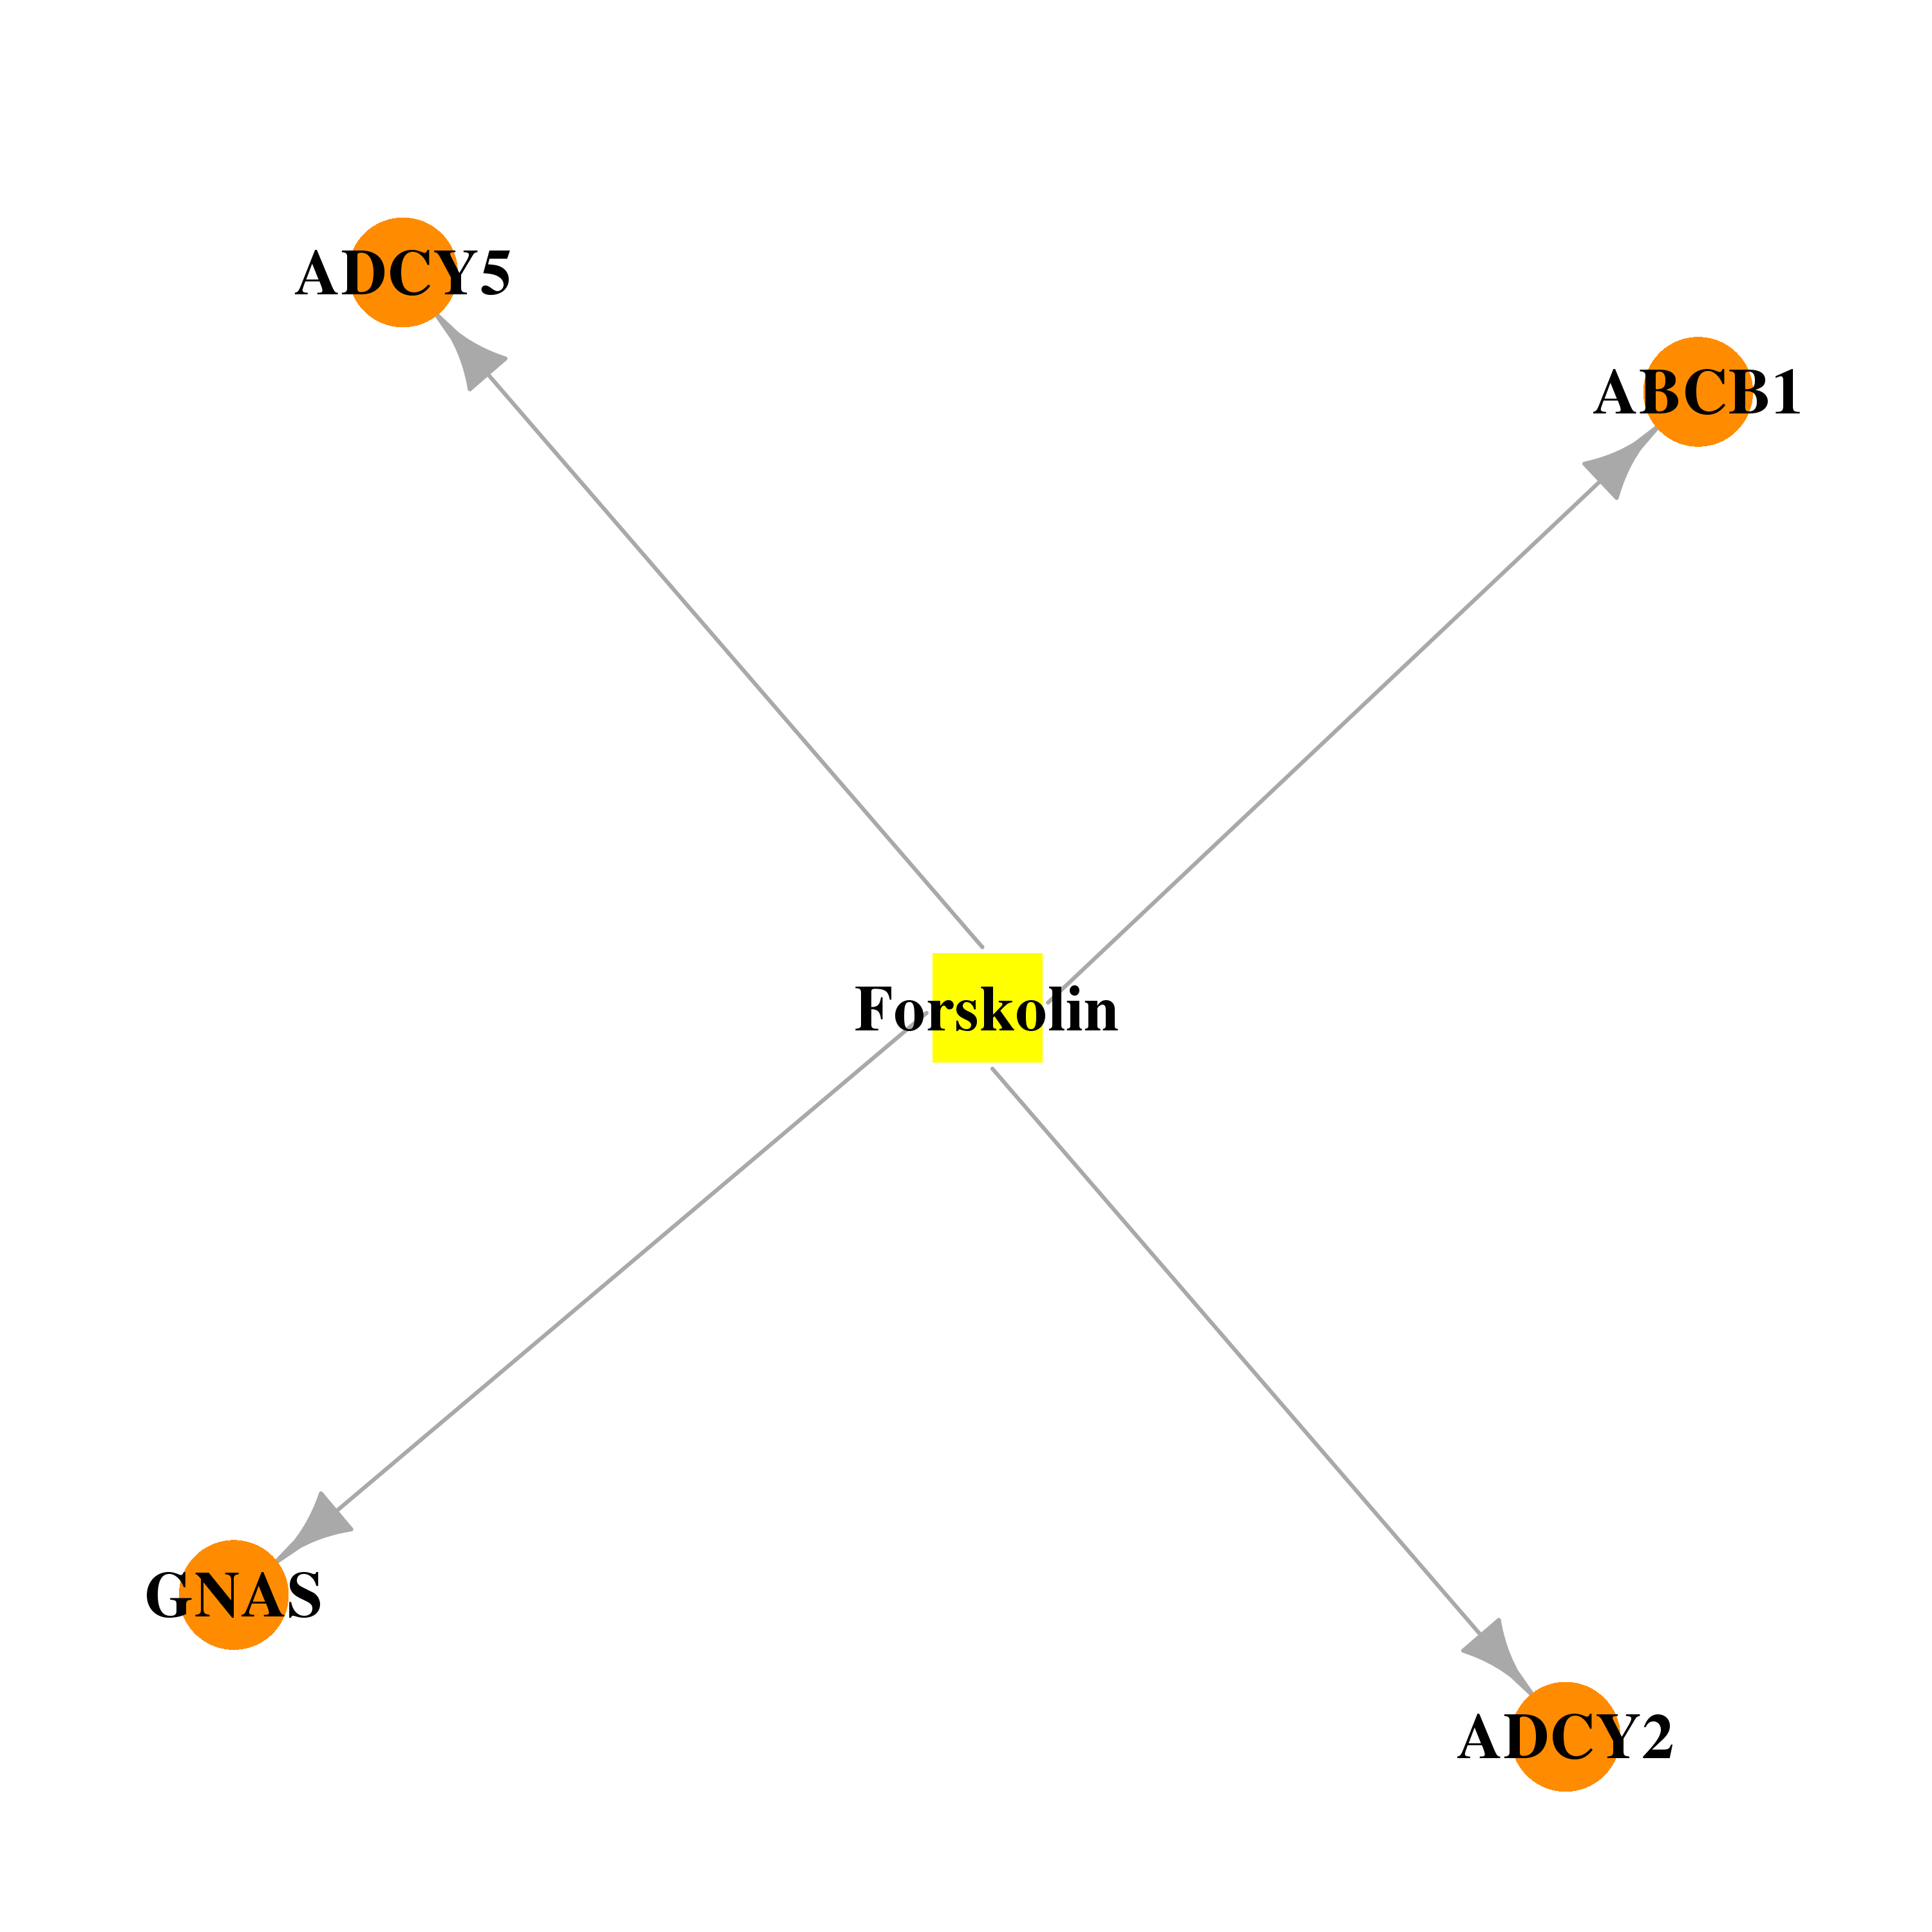 |  |
| DB06843 | adenylate cyclase 2 (brain) | experimental | 2',5'-DIDEOXY-ADENOSINE 3'-MONOPHOSPHATE | 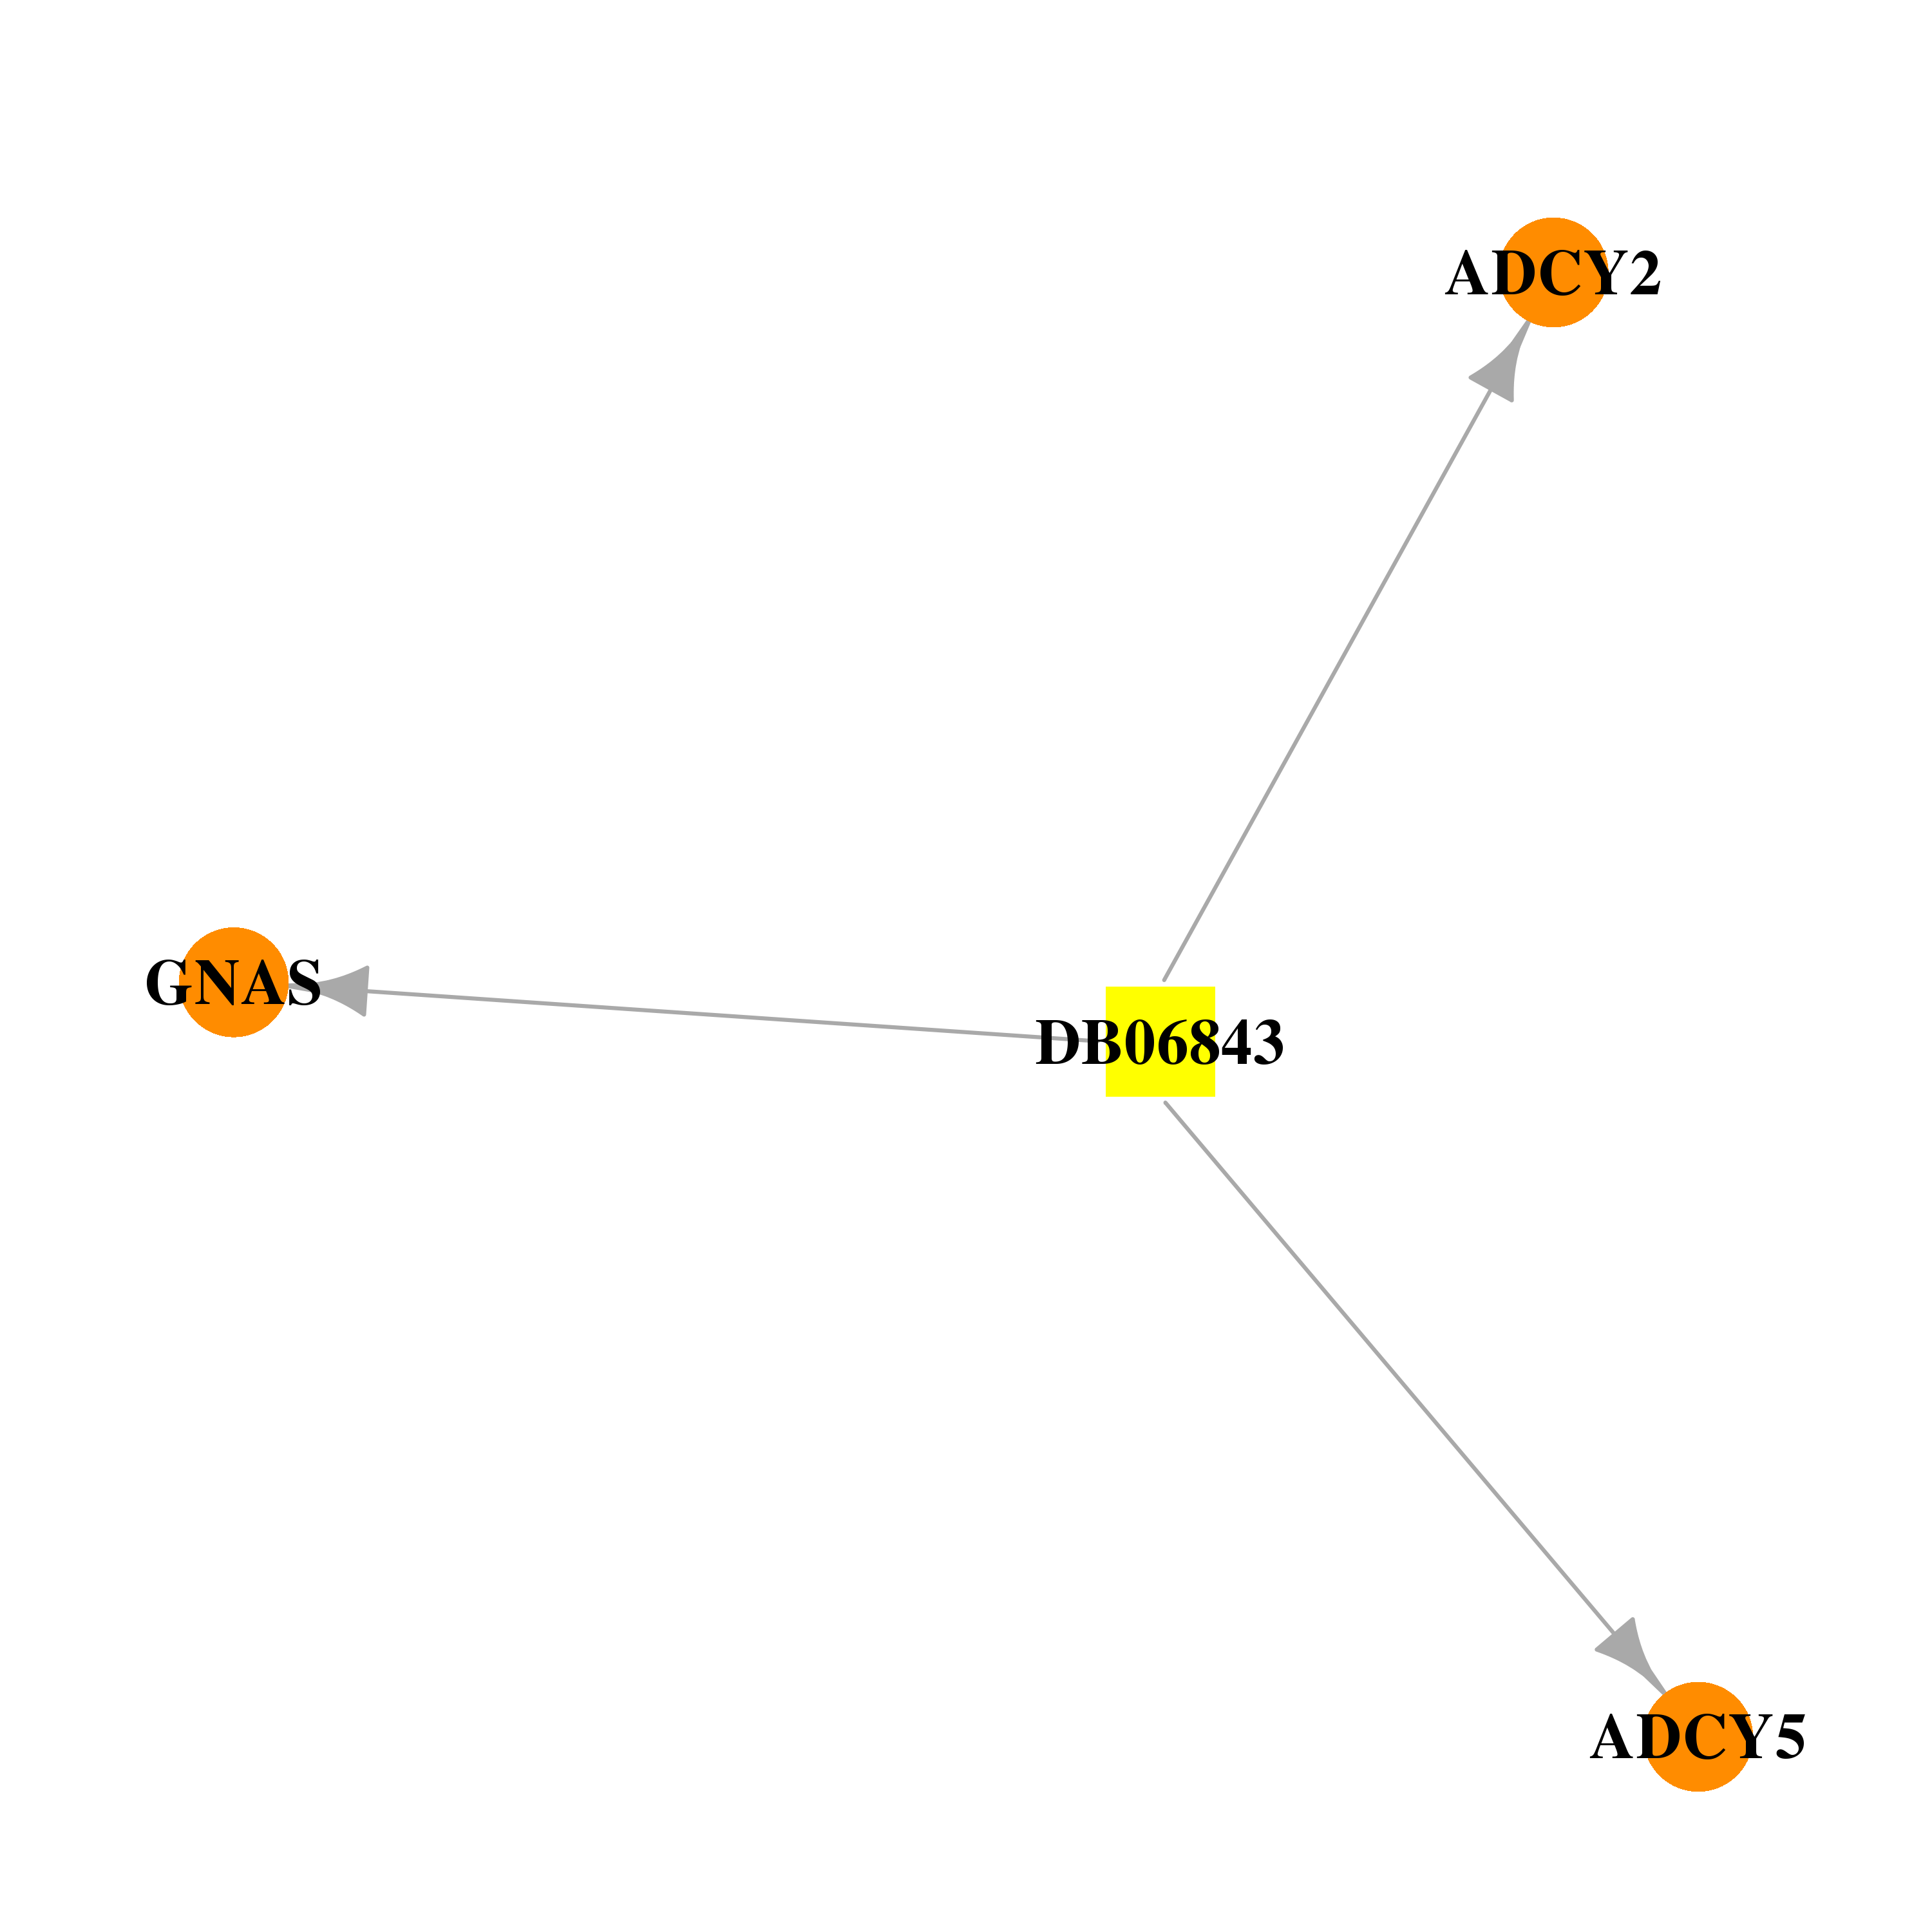 |  |
| DB00938 | adenylate cyclase 2 (brain) | approved | Salmeterol | 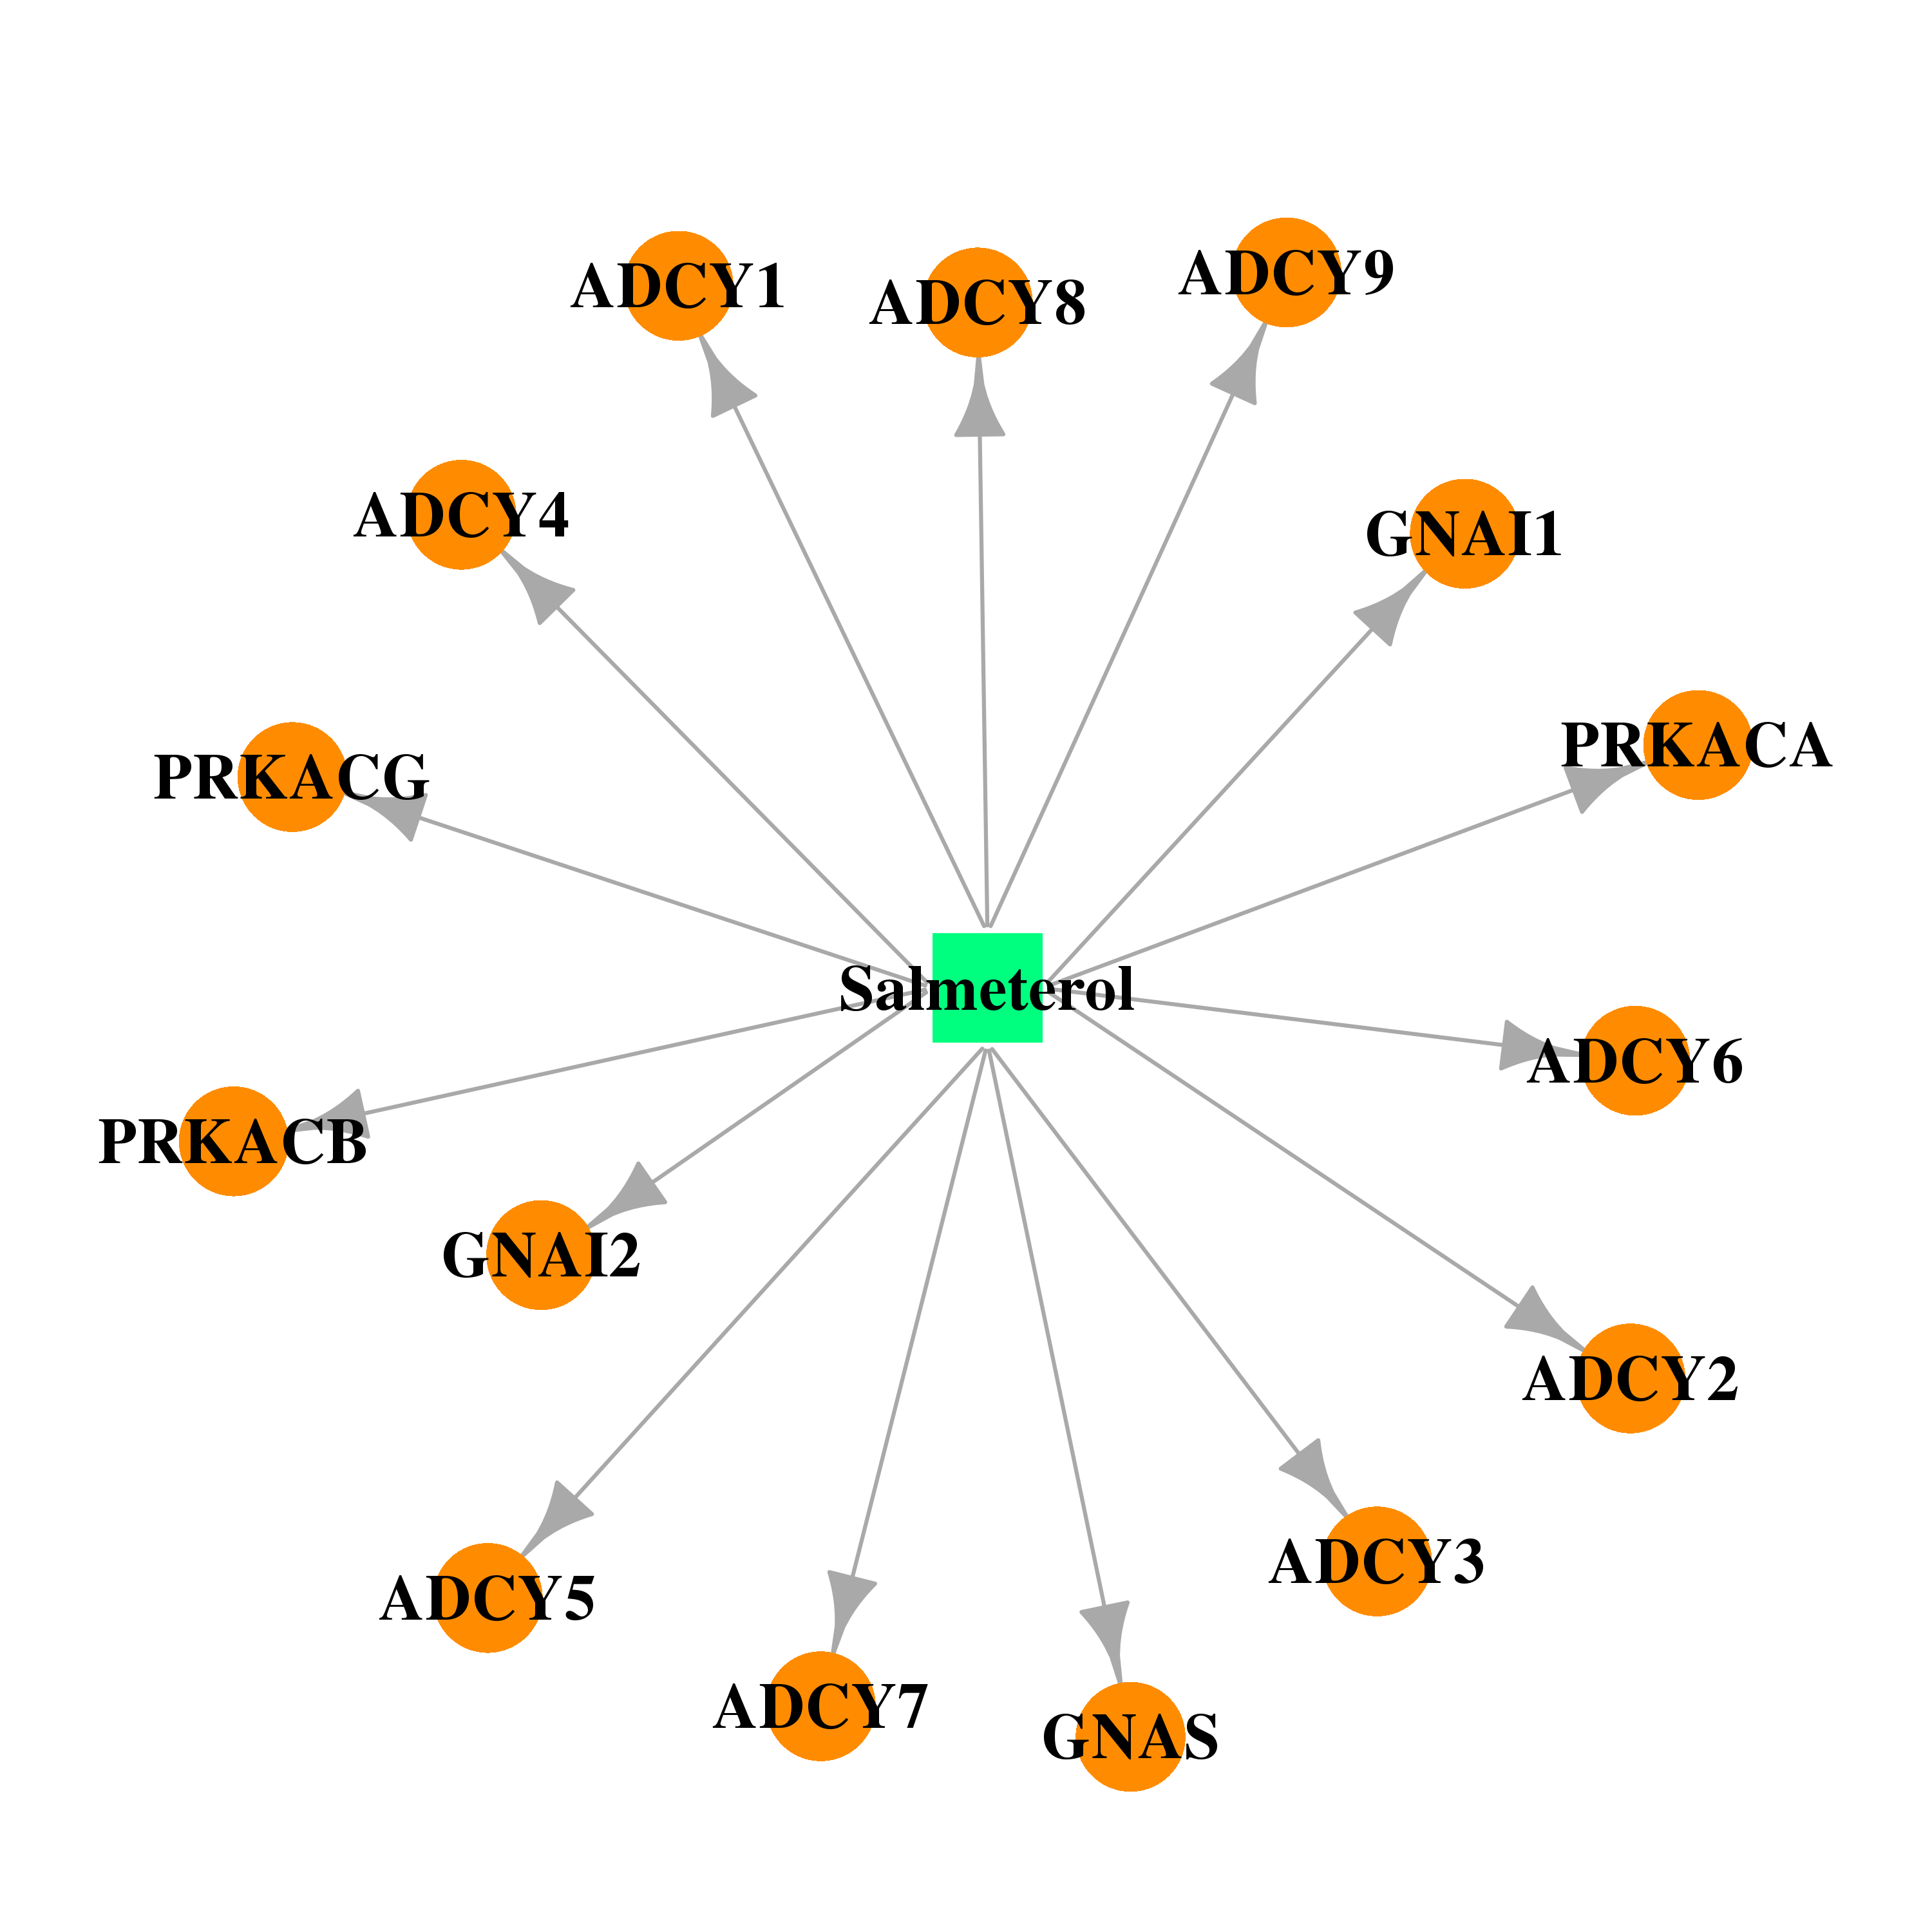 |  |
| Top |
| Cross referenced IDs for ADCY2 |
| * We obtained these cross-references from Uniprot database. It covers 150 different DBs, 18 categories. http://www.uniprot.org/help/cross_references_section |
: Open all cross reference information
|
Copyright © 2016-Present - The Univsersity of Texas Health Science Center at Houston @ |