|
||||||||||||||||||||
| |
| Phenotypic Information (metabolism pathway, cancer, disease, phenome) |
| |
| |
| Gene-Gene Network Information: Co-Expression Network, Interacting Genes & KEGG |
| |
|


| Gene Summary for CGA |
| Basic gene info. | Gene symbol | CGA |
| Gene name | glycoprotein hormones, alpha polypeptide | |
| Synonyms | CG-ALPHA|FSHA|GPHA1|GPHa|HCG|LHA|TSHA | |
| Cytomap | UCSC genome browser: 6q12-q21 | |
| Genomic location | chr6 :87795215-87804865 | |
| Type of gene | protein-coding | |
| RefGenes | NM_000735.3, NM_001252383.1, | |
| Ensembl id | ENSG00000135346 | |
| Description | FSH-alphaLSH-alphaTSH-alphaanterior pituitary glycoprotein hormones common subunit alphachoriogonadotropin alpha chainchorionic gonadotrophin subunit alphachorionic gonadotropin, alpha polypeptidefollicle-stimulating hormone alpha chainfollicle-st | |
| Modification date | 20141207 | |
| dbXrefs | MIM : 118850 | |
| HGNC : HGNC | ||
| Ensembl : ENSG00000135346 | ||
| HPRD : 00342 | ||
| Vega : OTTHUMG00000015161 | ||
| Protein | UniProt: go to UniProt's Cross Reference DB Table | |
| Expression | CleanEX: HS_CGA | |
| BioGPS: 1081 | ||
| Gene Expression Atlas: ENSG00000135346 | ||
| The Human Protein Atlas: ENSG00000135346 | ||
| Pathway | NCI Pathway Interaction Database: CGA | |
| KEGG: CGA | ||
| REACTOME: CGA | ||
| ConsensusPathDB | ||
| Pathway Commons: CGA | ||
| Metabolism | MetaCyc: CGA | |
| HUMANCyc: CGA | ||
| Regulation | Ensembl's Regulation: ENSG00000135346 | |
| miRBase: chr6 :87,795,215-87,804,865 | ||
| TargetScan: NM_000735 | ||
| cisRED: ENSG00000135346 | ||
| Context | iHOP: CGA | |
| cancer metabolism search in PubMed: CGA | ||
| UCL Cancer Institute: CGA | ||
| Assigned class in ccmGDB | C | |
| Top |
| Phenotypic Information for CGA(metabolism pathway, cancer, disease, phenome) |
| Cancer | CGAP: CGA |
| Familial Cancer Database: CGA | |
| * This gene is included in those cancer gene databases. |
|
|
|
|
|
|
| ||||||||||||||
Oncogene 1 | Significant driver gene in | |||||||||||||||||||
| cf) number; DB name 1 Oncogene; http://nar.oxfordjournals.org/content/35/suppl_1/D721.long, 2 Tumor Suppressor gene; https://bioinfo.uth.edu/TSGene/, 3 Cancer Gene Census; http://www.nature.com/nrc/journal/v4/n3/abs/nrc1299.html, 4 CancerGenes; http://nar.oxfordjournals.org/content/35/suppl_1/D721.long, 5 Network of Cancer Gene; http://ncg.kcl.ac.uk/index.php, 1Therapeutic Vulnerabilities in Cancer; http://cbio.mskcc.org/cancergenomics/statius/ |
| REACTOME_METABOLISM_OF_STEROID_HORMONES_AND_VITAMINS_A_AND_D REACTOME_METABOLISM_OF_AMINO_ACIDS_AND_DERIVATIVES REACTOME_METABOLISM_OF_LIPIDS_AND_LIPOPROTEINS | |
| OMIM | |
| Orphanet | |
| Disease | KEGG Disease: CGA |
| MedGen: CGA (Human Medical Genetics with Condition) | |
| ClinVar: CGA | |
| Phenotype | MGI: CGA (International Mouse Phenotyping Consortium) |
| PhenomicDB: CGA | |
| Mutations for CGA |
| * Under tables are showing count per each tissue to give us broad intuition about tissue specific mutation patterns.You can go to the detailed page for each mutation database's web site. |
| There's no structural variation information in COSMIC data for this gene. |
| * From mRNA Sanger sequences, Chitars2.0 arranged chimeric transcripts. This table shows CGA related fusion information. |
| ID | Head Gene | Tail Gene | Accession | Gene_a | qStart_a | qEnd_a | Chromosome_a | tStart_a | tEnd_a | Gene_a | qStart_a | qEnd_a | Chromosome_a | tStart_a | tEnd_a |
| R81128 | CGA | 4 | 60 | 6 | 87795409 | 87795465 | KDM5A | 60 | 200 | 12 | 390470 | 390610 | |
| AV747863 | SF1 | 1 | 281 | 11 | 64536509 | 64536969 | CGA | 278 | 530 | 6 | 87795966 | 87797907 | |
| CF528409 | CGA | 20 | 75 | 6 | 87795218 | 87795273 | ZNF397 | 71 | 304 | 18 | 32823125 | 32825326 | |
| R02040 | CGA | 8 | 110 | 6 | 87795224 | 87795326 | CDC42BPB | 104 | 269 | 14 | 103488300 | 103488463 | |
| BQ367091 | SMAD6 | 20 | 92 | 15 | 67040351 | 67040422 | CGA | 87 | 184 | 6 | 87795378 | 87795475 | |
| BF985831 | CGA | 17 | 290 | 6 | 87795224 | 87795497 | PSMC2 | 283 | 415 | 7 | 103008430 | 103008562 | |
| R14891 | CGA | 1 | 111 | 6 | 87795216 | 87795326 | CDC42BPB | 105 | 362 | 14 | 103488300 | 103488549 | |
| AA368821 | CGA | 1 | 97 | 6 | 87795224 | 87795320 | PRG2 | 87 | 155 | 11 | 57156671 | 57156739 | |
| BE842422 | CASP10 | 11 | 149 | 2 | 202061083 | 202061223 | CGA | 142 | 363 | 6 | 87796110 | 87804814 | |
| AA441787 | CGA | 1 | 82 | 6 | 87795227 | 87795308 | CGA | 78 | 513 | 6 | 87795481 | 87804819 | |
| BQ012719 | GUK1 | 18 | 120 | 1 | 228336550 | 228336652 | CGA | 115 | 444 | 6 | 87795223 | 87795552 | |
| AF370393 | CGA | 74 | 128 | 6 | 87795460 | 87795514 | MFSD2A | 129 | 1770 | 1 | 40432474 | 40435628 | |
| CF529503 | GUK1 | 18 | 120 | 1 | 228336550 | 228336652 | CGA | 115 | 444 | 6 | 87795223 | 87795552 | |
| C19023 | CGA | 45 | 116 | 6 | 87795221 | 87795292 | RAB1A | 116 | 230 | 2 | 65357061 | 65357175 | |
| Top |
| There's no copy number variation information in COSMIC data for this gene. |
| Top |
|
 |
| Top |
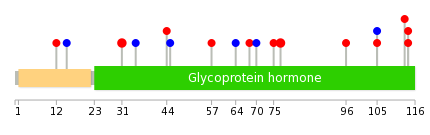
| Stat. for Non-Synonymous SNVs (# total SNVs=17) | (# total SNVs=7) |
 |  |
(# total SNVs=0) | (# total SNVs=0) |
| Top |
| * When you move the cursor on each content, you can see more deailed mutation information on the Tooltip. Those are primary_site,primary_histology,mutation(aa),pubmedID. |
| GRCh37 position | Mutation(aa) | Unique sampleID count |
| chr6:87796012-87796012 | p.V77I | 3 |
| chr6:87796149-87796149 | p.C31Y | 2 |
| chr6:87797846-87797846 | p.A25S | 2 |
| chr6:87796129-87796129 | p.E38K | 1 |
| chr6:87795978-87795978 | p.S88* | 1 |
| chr6:87796136-87796136 | p.T35T | 1 |
| chr6:87795992-87795992 | p.C83C | 1 |
| chr6:87796154-87796154 | p.? | 1 |
| chr6:87795485-87795485 | p.H114N | 1 |
| chr6:87796017-87796017 | p.K75T | 1 |
| Top |
|
 |
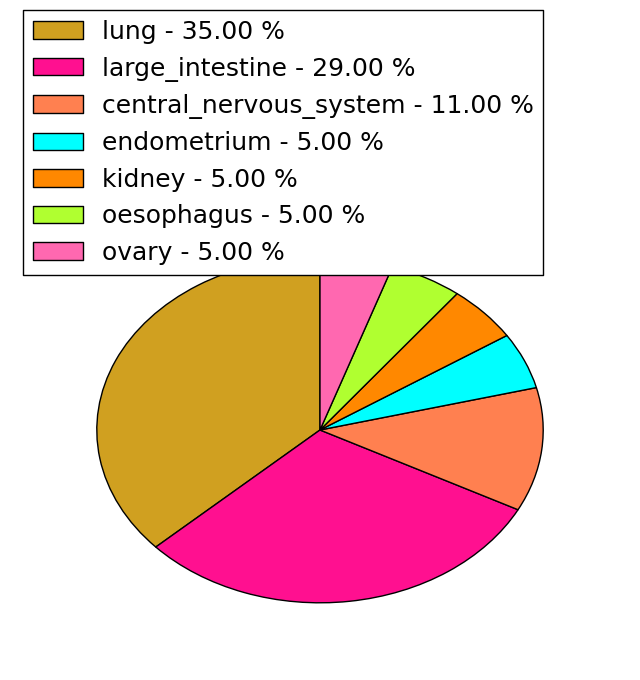
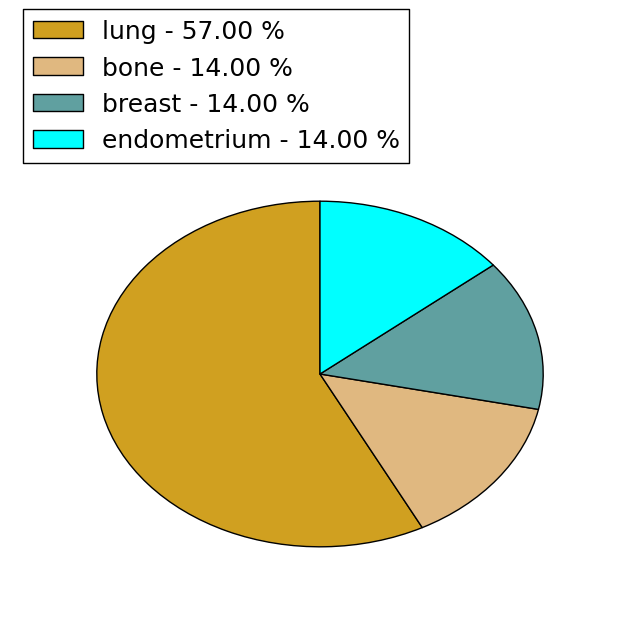
| Point Mutation/ Tissue ID | 1 | 2 | 3 | 4 | 5 | 6 | 7 | 8 | 9 | 10 | 11 | 12 | 13 | 14 | 15 | 16 | 17 | 18 | 19 | 20 |
| # sample | 1 | 1 | 3 | 1 | 1 | 6 | 2 | 1 | 2 | 2 | ||||||||||
| # mutation | 1 | 1 | 3 | 1 | 1 | 6 | 2 | 1 | 2 | 2 | ||||||||||
| nonsynonymous SNV | 1 | 3 | 1 | 1 | 2 | 2 | 1 | 2 | 1 | |||||||||||
| synonymous SNV | 1 | 4 | 1 |
| cf) Tissue ID; Tissue type (1; BLCA[Bladder Urothelial Carcinoma], 2; BRCA[Breast invasive carcinoma], 3; CESC[Cervical squamous cell carcinoma and endocervical adenocarcinoma], 4; COAD[Colon adenocarcinoma], 5; GBM[Glioblastoma multiforme], 6; Glioma Low Grade, 7; HNSC[Head and Neck squamous cell carcinoma], 8; KICH[Kidney Chromophobe], 9; KIRC[Kidney renal clear cell carcinoma], 10; KIRP[Kidney renal papillary cell carcinoma], 11; LAML[Acute Myeloid Leukemia], 12; LUAD[Lung adenocarcinoma], 13; LUSC[Lung squamous cell carcinoma], 14; OV[Ovarian serous cystadenocarcinoma ], 15; PAAD[Pancreatic adenocarcinoma], 16; PRAD[Prostate adenocarcinoma], 17; SKCM[Skin Cutaneous Melanoma], 18:STAD[Stomach adenocarcinoma], 19:THCA[Thyroid carcinoma], 20:UCEC[Uterine Corpus Endometrial Carcinoma]) |
| Top |
| * We represented just top 10 SNVs. When you move the cursor on each content, you can see more deailed mutation information on the Tooltip. Those are primary_site, primary_histology, mutation(aa), pubmedID. |
| Genomic Position | Mutation(aa) | Unique sampleID count |
| chr6:87795485 | p.C31Y,CGA | 2 |
| chr6:87796149 | p.H114D,CGA | 2 |
| chr6:87796012 | p.V77I,CGA | 2 |
| chr6:87796037 | p.Q44K,CGA | 1 |
| chr6:87796049 | p.T35T,CGA | 1 |
| chr6:87796070 | p.L15L,CGA | 1 |
| chr6:87796106 | p.L12P,CGA | 1 |
| chr6:87795487 | p.Y113F,CGA | 1 |
| chr6:87796111 | p.A105A,CGA | 1 |
| chr6:87795510 | p.A105V,CGA | 1 |
| * Copy number data were extracted from TCGA using R package TCGA-Assembler. The URLs of all public data files on TCGA DCC data server were gathered on Jan-05-2015. Function ProcessCNAData in TCGA-Assembler package was used to obtain gene-level copy number value which is calculated as the average copy number of the genomic region of a gene. |
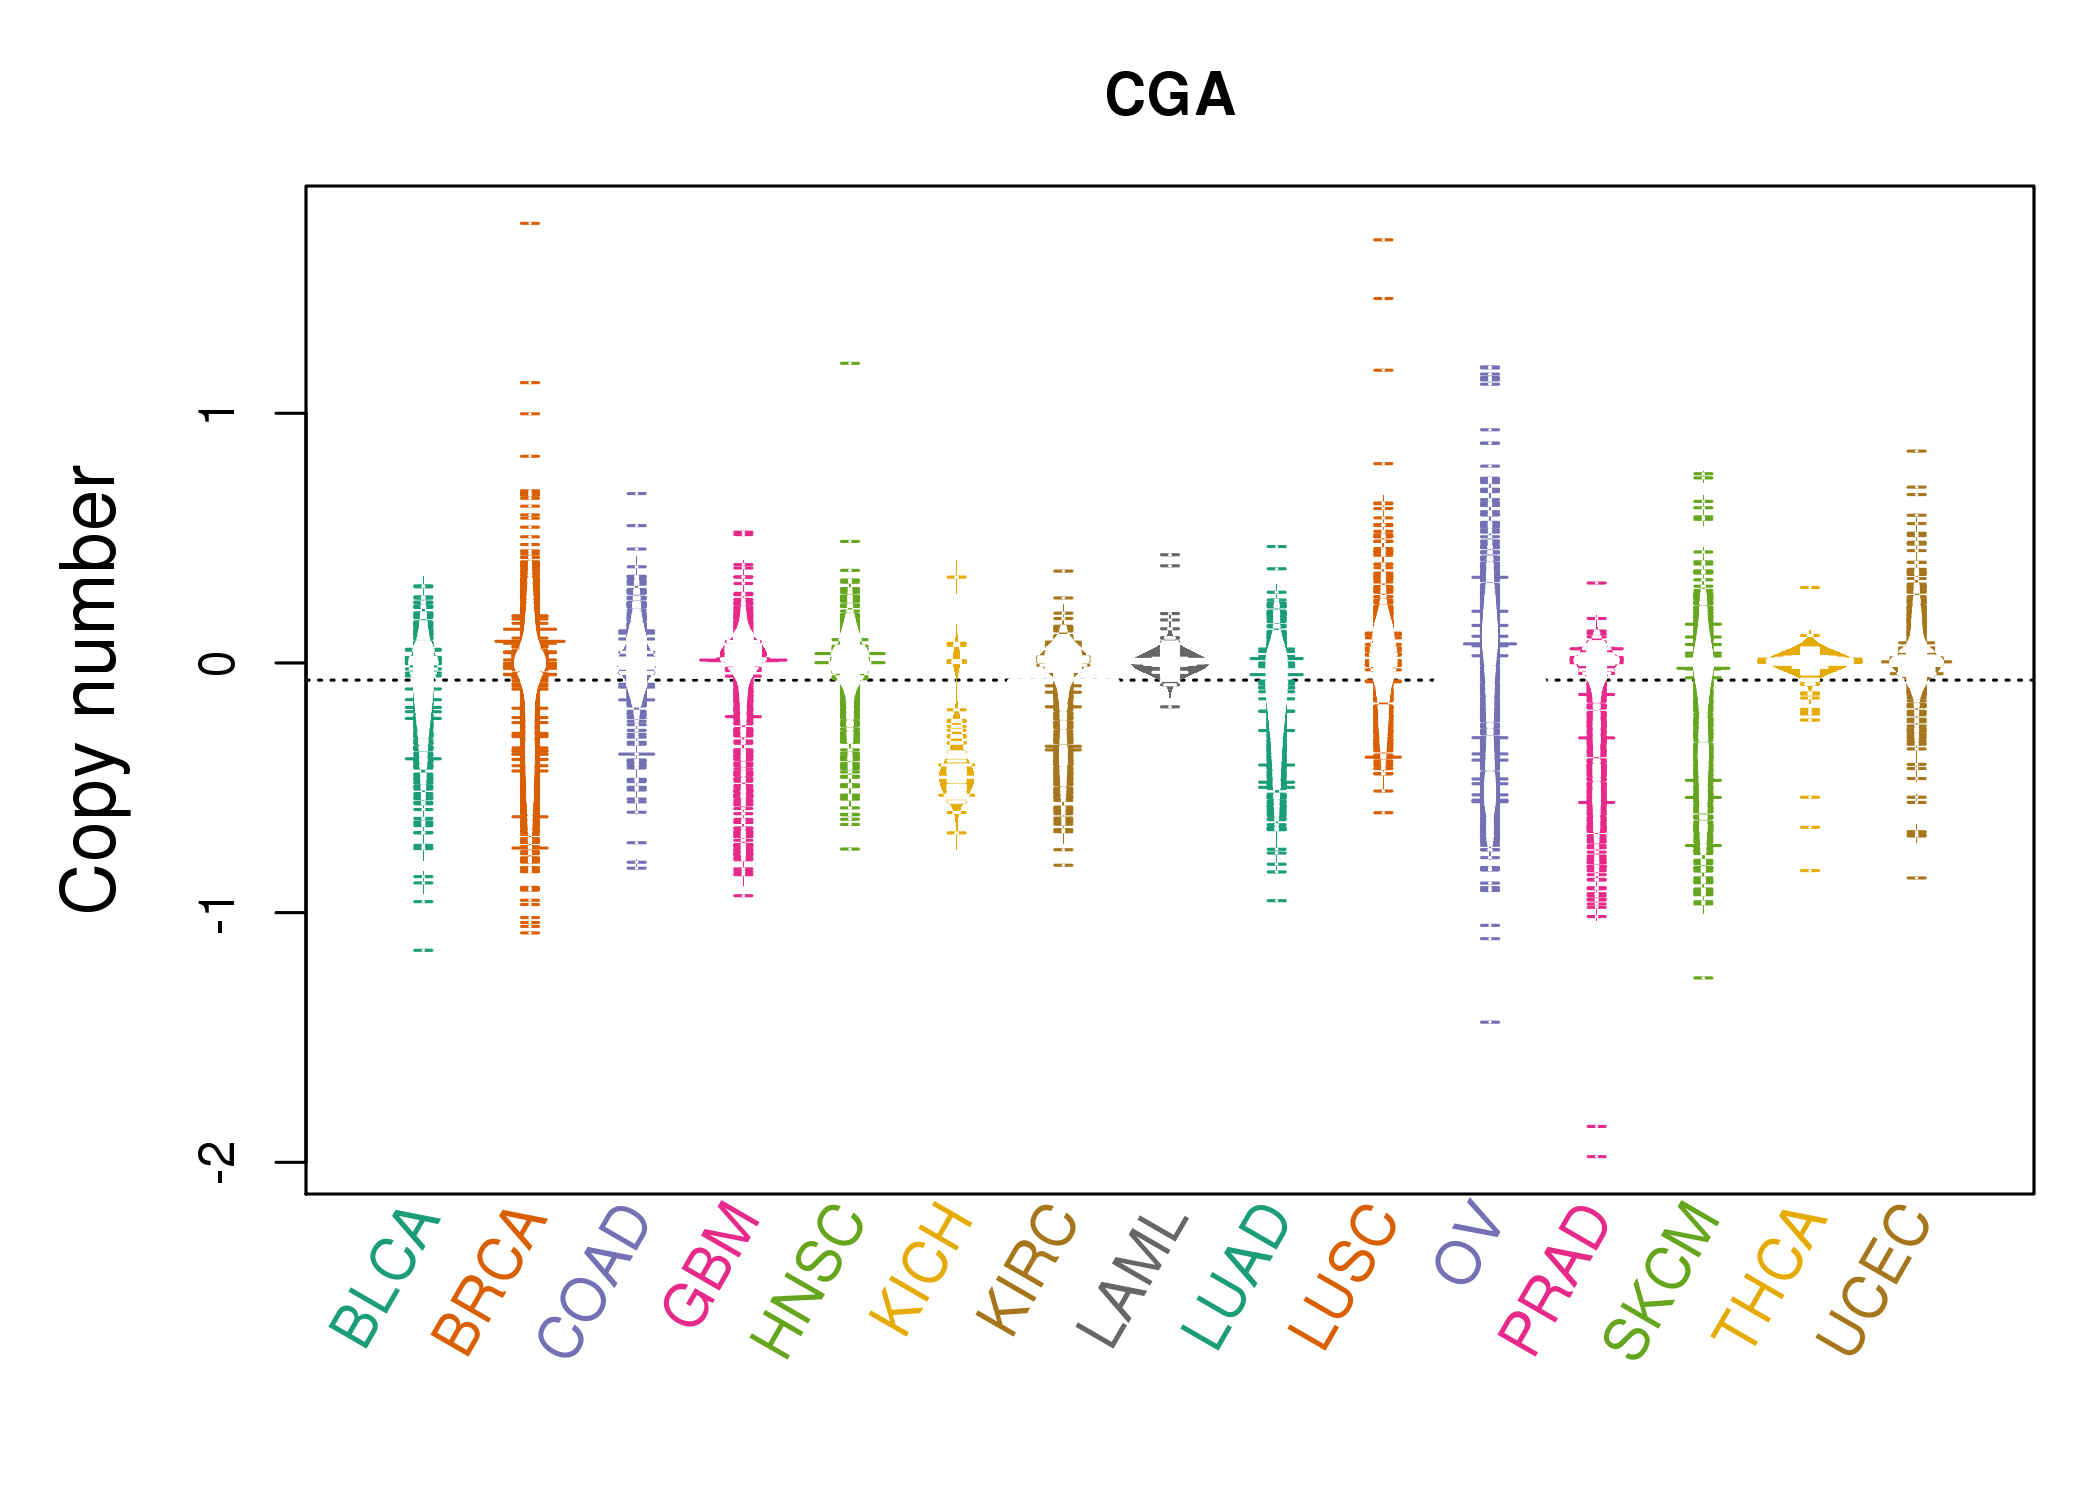 |
| cf) Tissue ID[Tissue type]: BLCA[Bladder Urothelial Carcinoma], BRCA[Breast invasive carcinoma], CESC[Cervical squamous cell carcinoma and endocervical adenocarcinoma], COAD[Colon adenocarcinoma], GBM[Glioblastoma multiforme], Glioma Low Grade, HNSC[Head and Neck squamous cell carcinoma], KICH[Kidney Chromophobe], KIRC[Kidney renal clear cell carcinoma], KIRP[Kidney renal papillary cell carcinoma], LAML[Acute Myeloid Leukemia], LUAD[Lung adenocarcinoma], LUSC[Lung squamous cell carcinoma], OV[Ovarian serous cystadenocarcinoma ], PAAD[Pancreatic adenocarcinoma], PRAD[Prostate adenocarcinoma], SKCM[Skin Cutaneous Melanoma], STAD[Stomach adenocarcinoma], THCA[Thyroid carcinoma], UCEC[Uterine Corpus Endometrial Carcinoma] |
| Top |
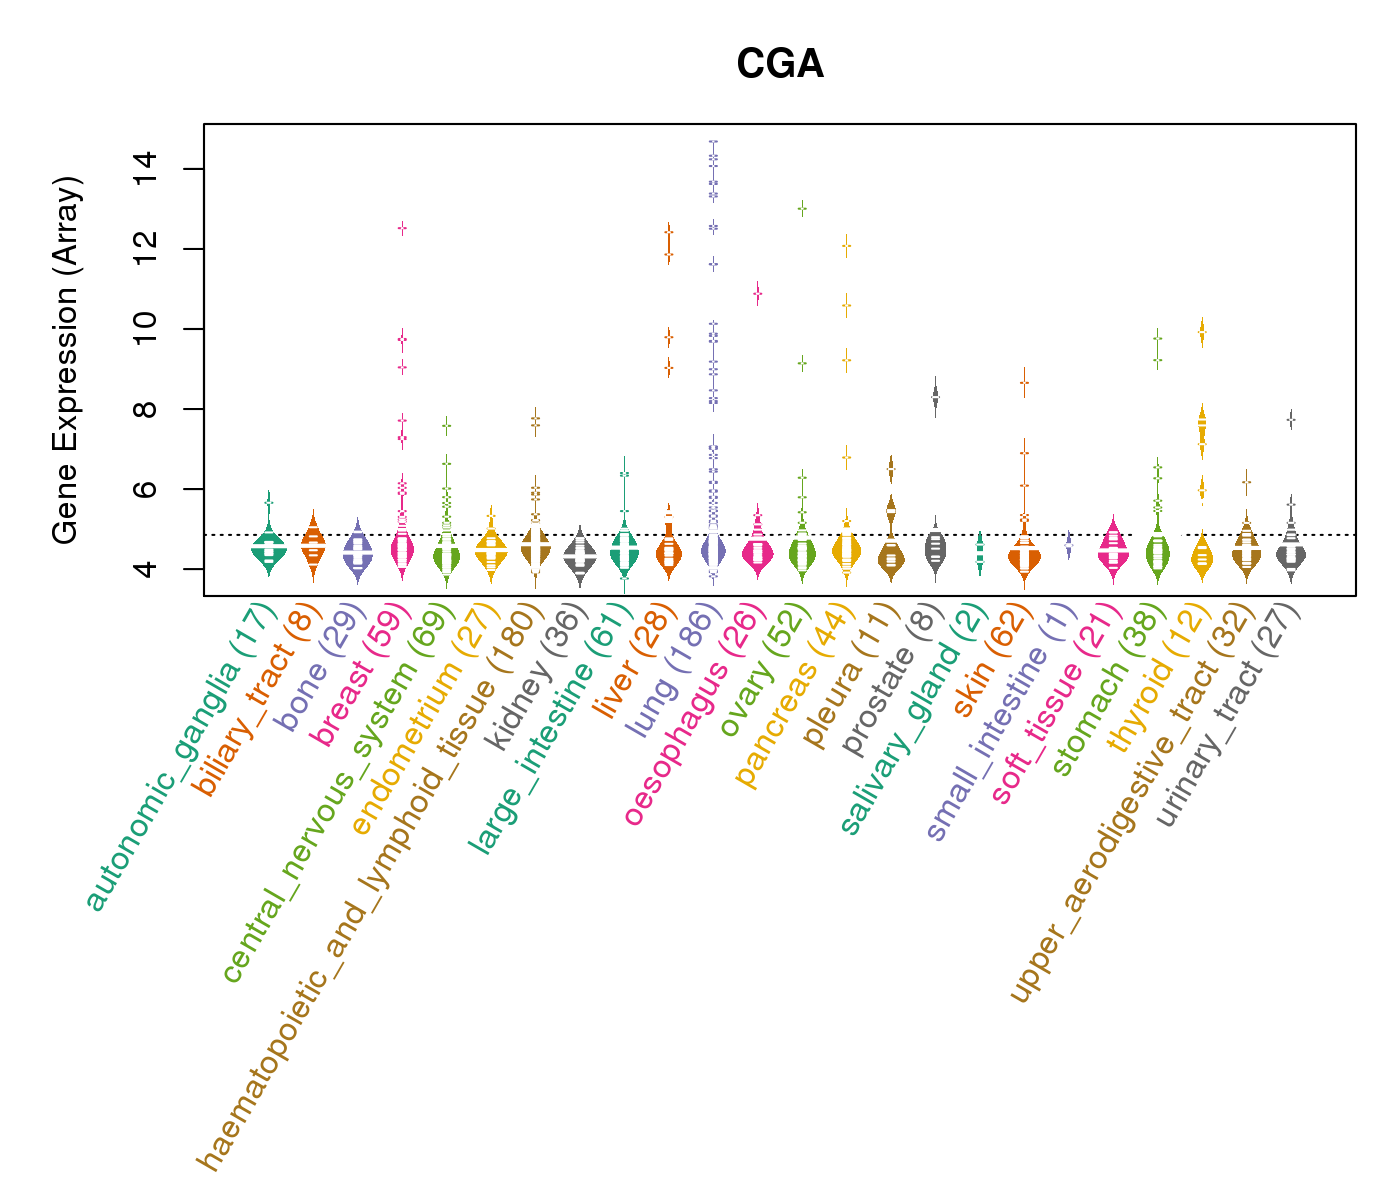
| Gene Expression for CGA |
| * CCLE gene expression data were extracted from CCLE_Expression_Entrez_2012-10-18.res: Gene-centric RMA-normalized mRNA expression data. |
 |
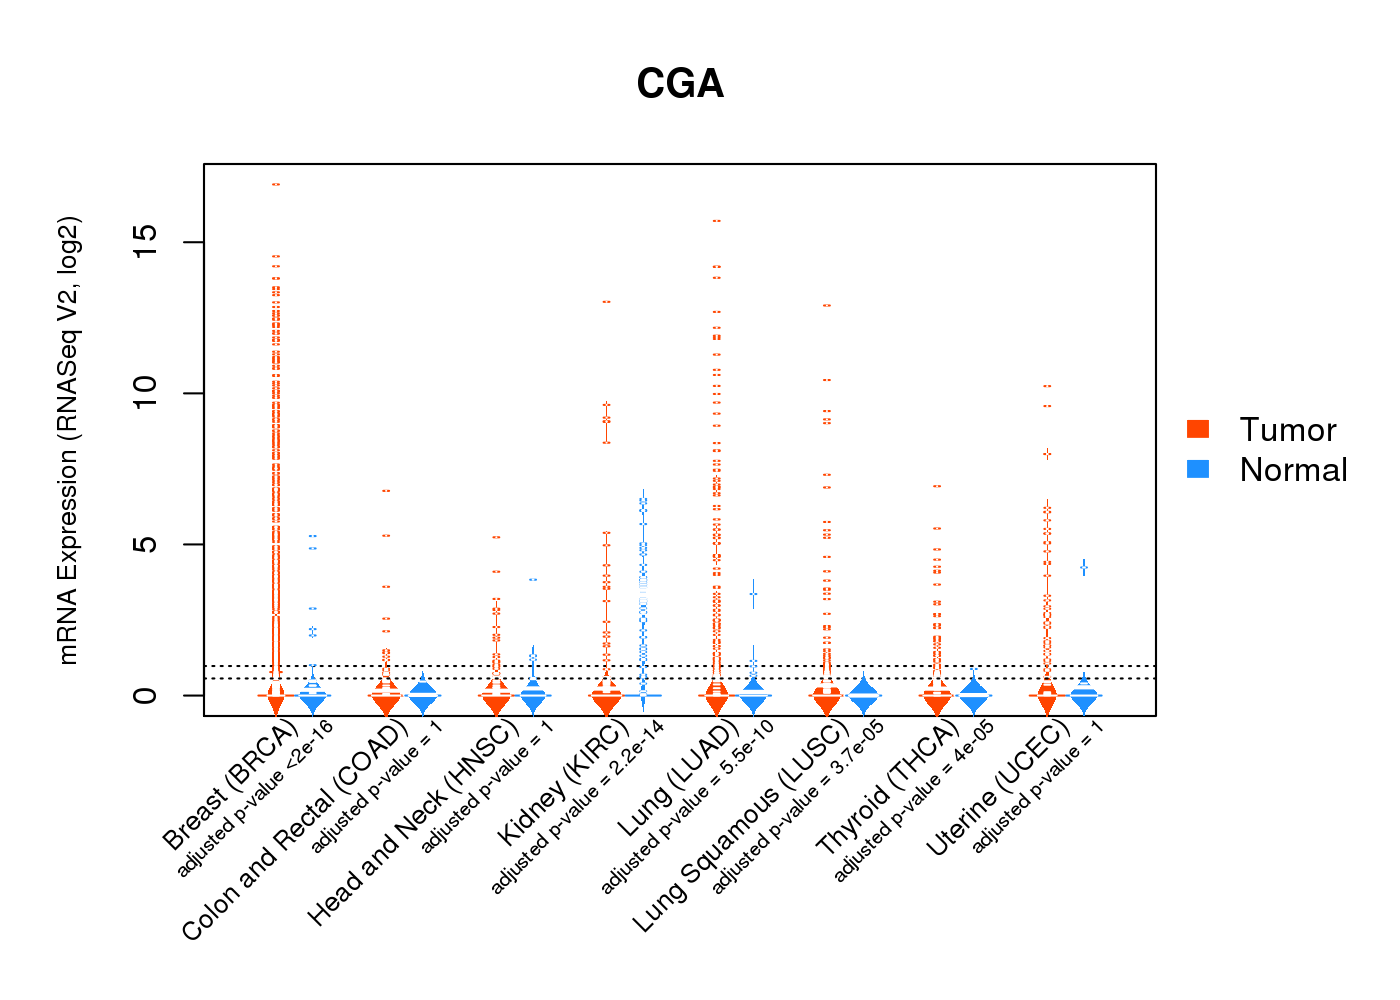
| * Normalized gene expression data of RNASeqV2 was extracted from TCGA using R package TCGA-Assembler. The URLs of all public data files on TCGA DCC data server were gathered at Jan-05-2015. Only eight cancer types have enough normal control samples for differential expression analysis. (t test, adjusted p<0.05 (using Benjamini-Hochberg FDR)) |
 |
| Top |
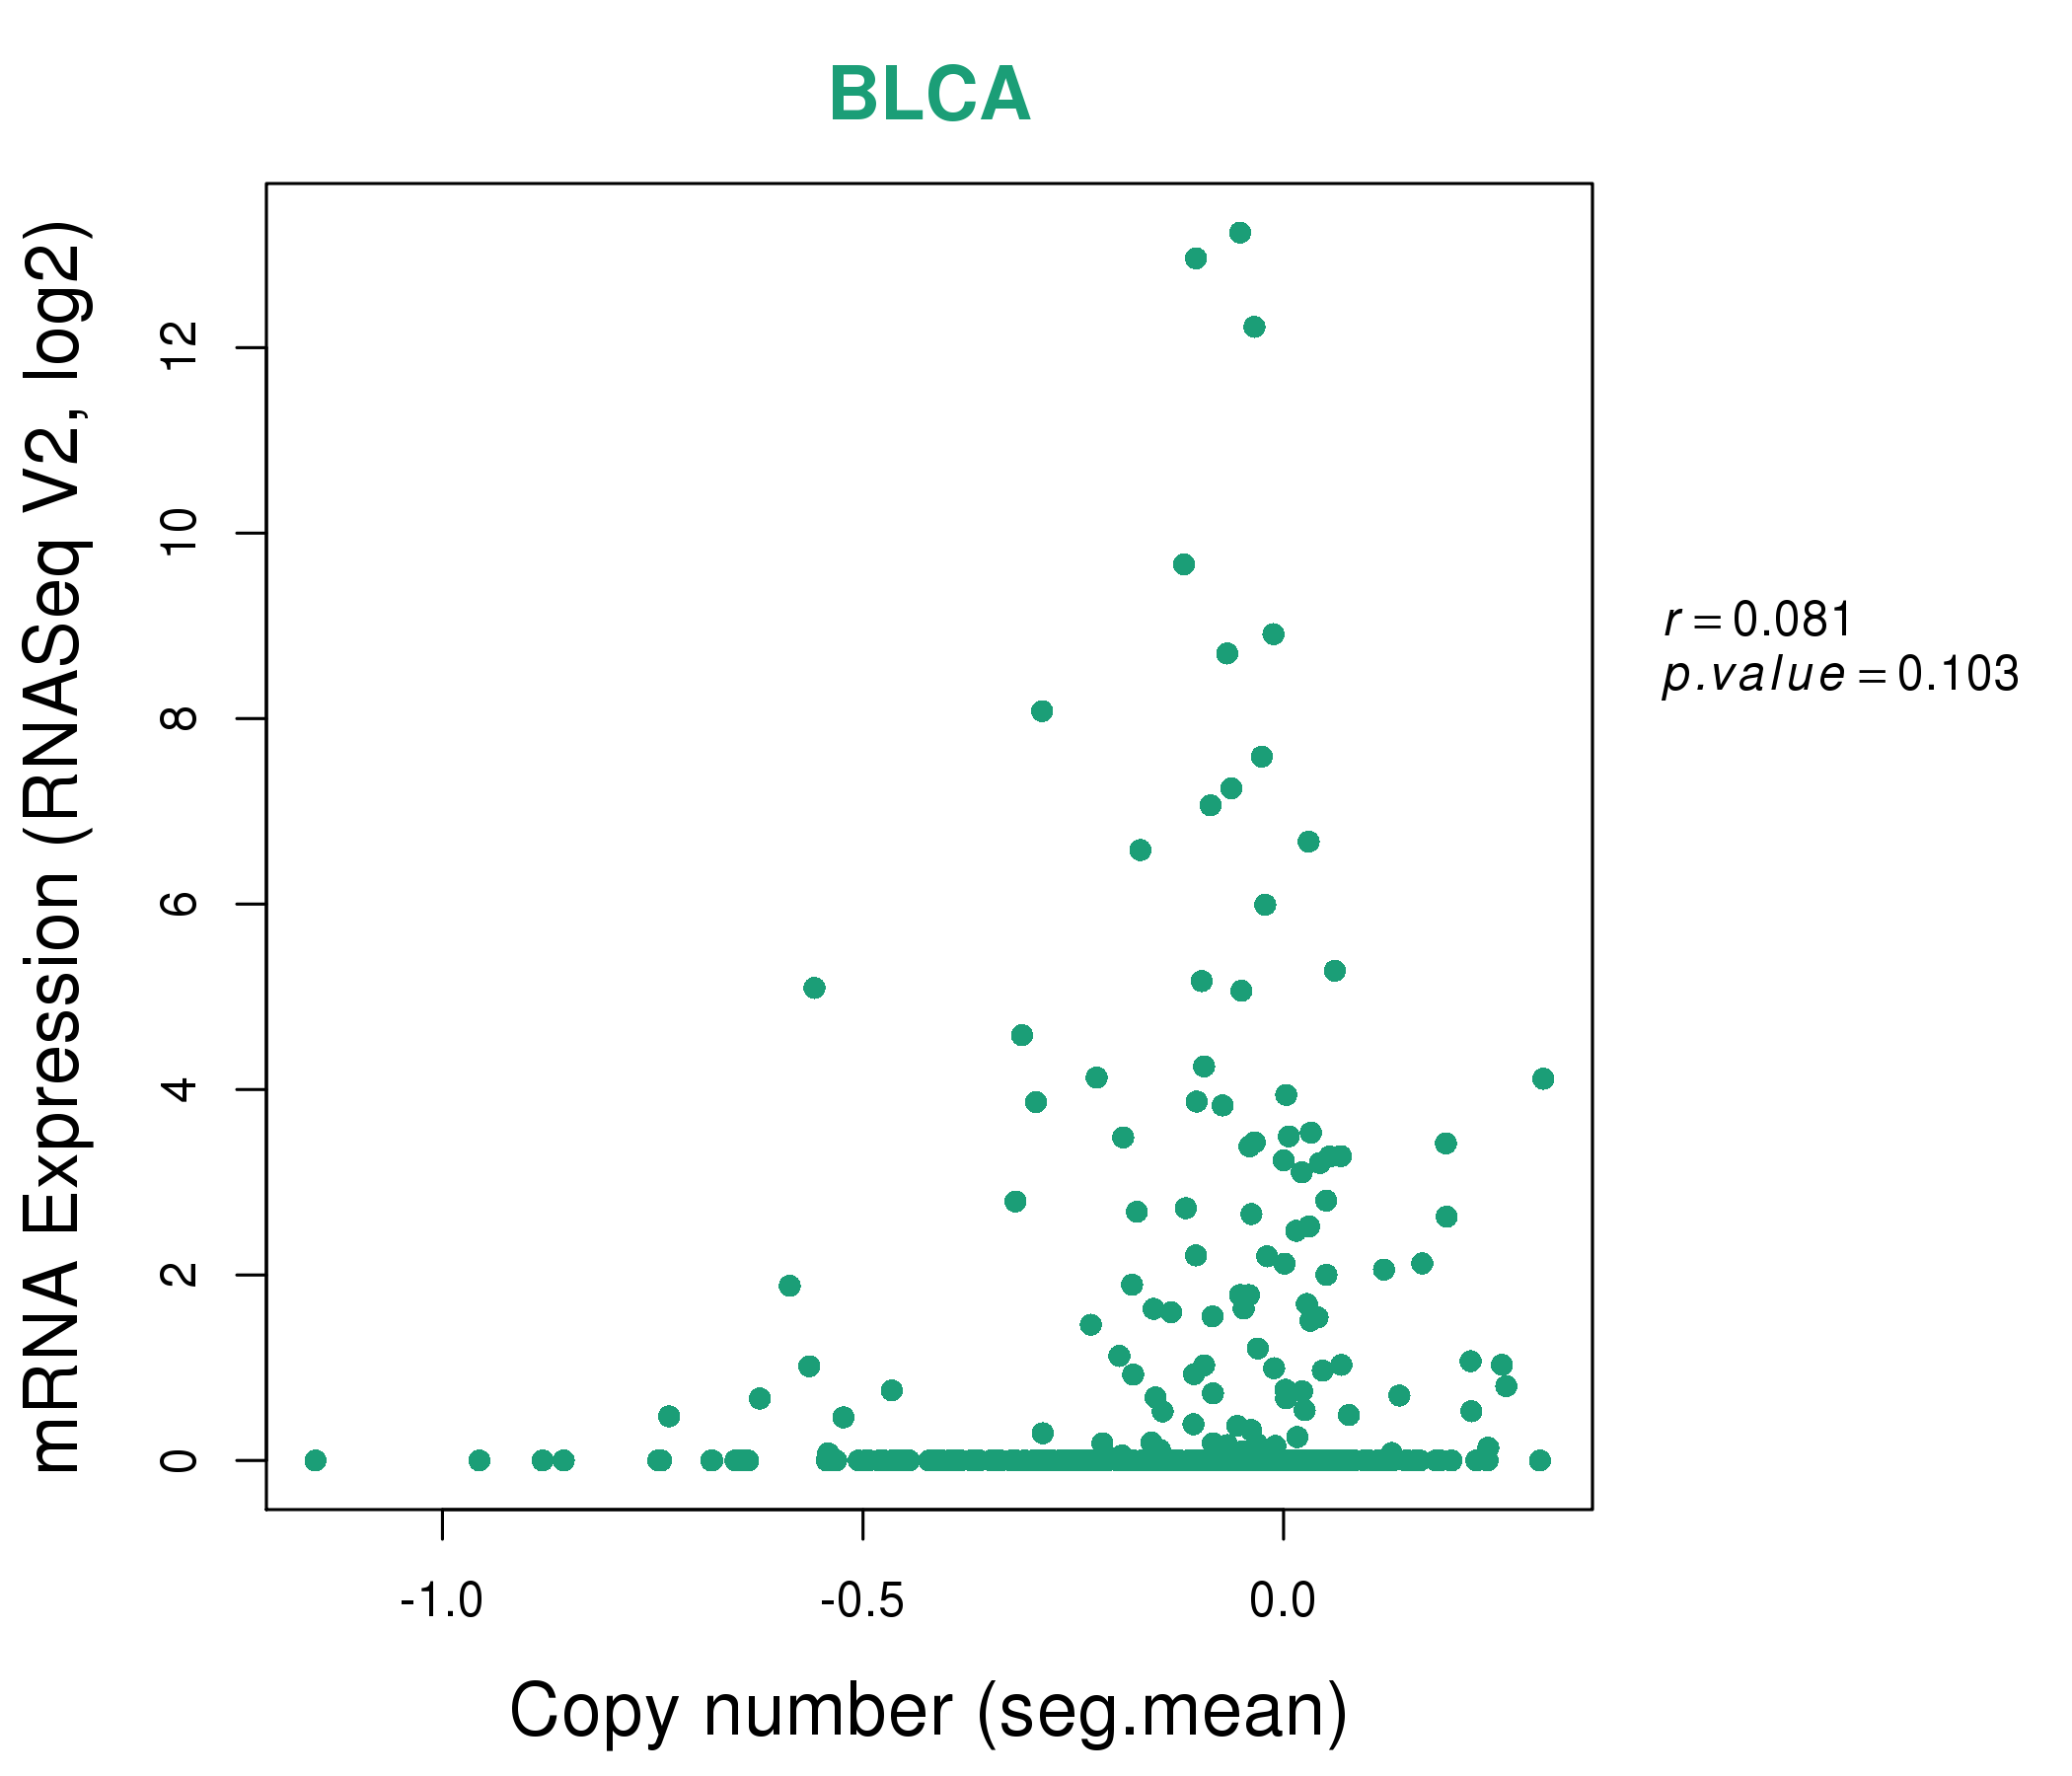
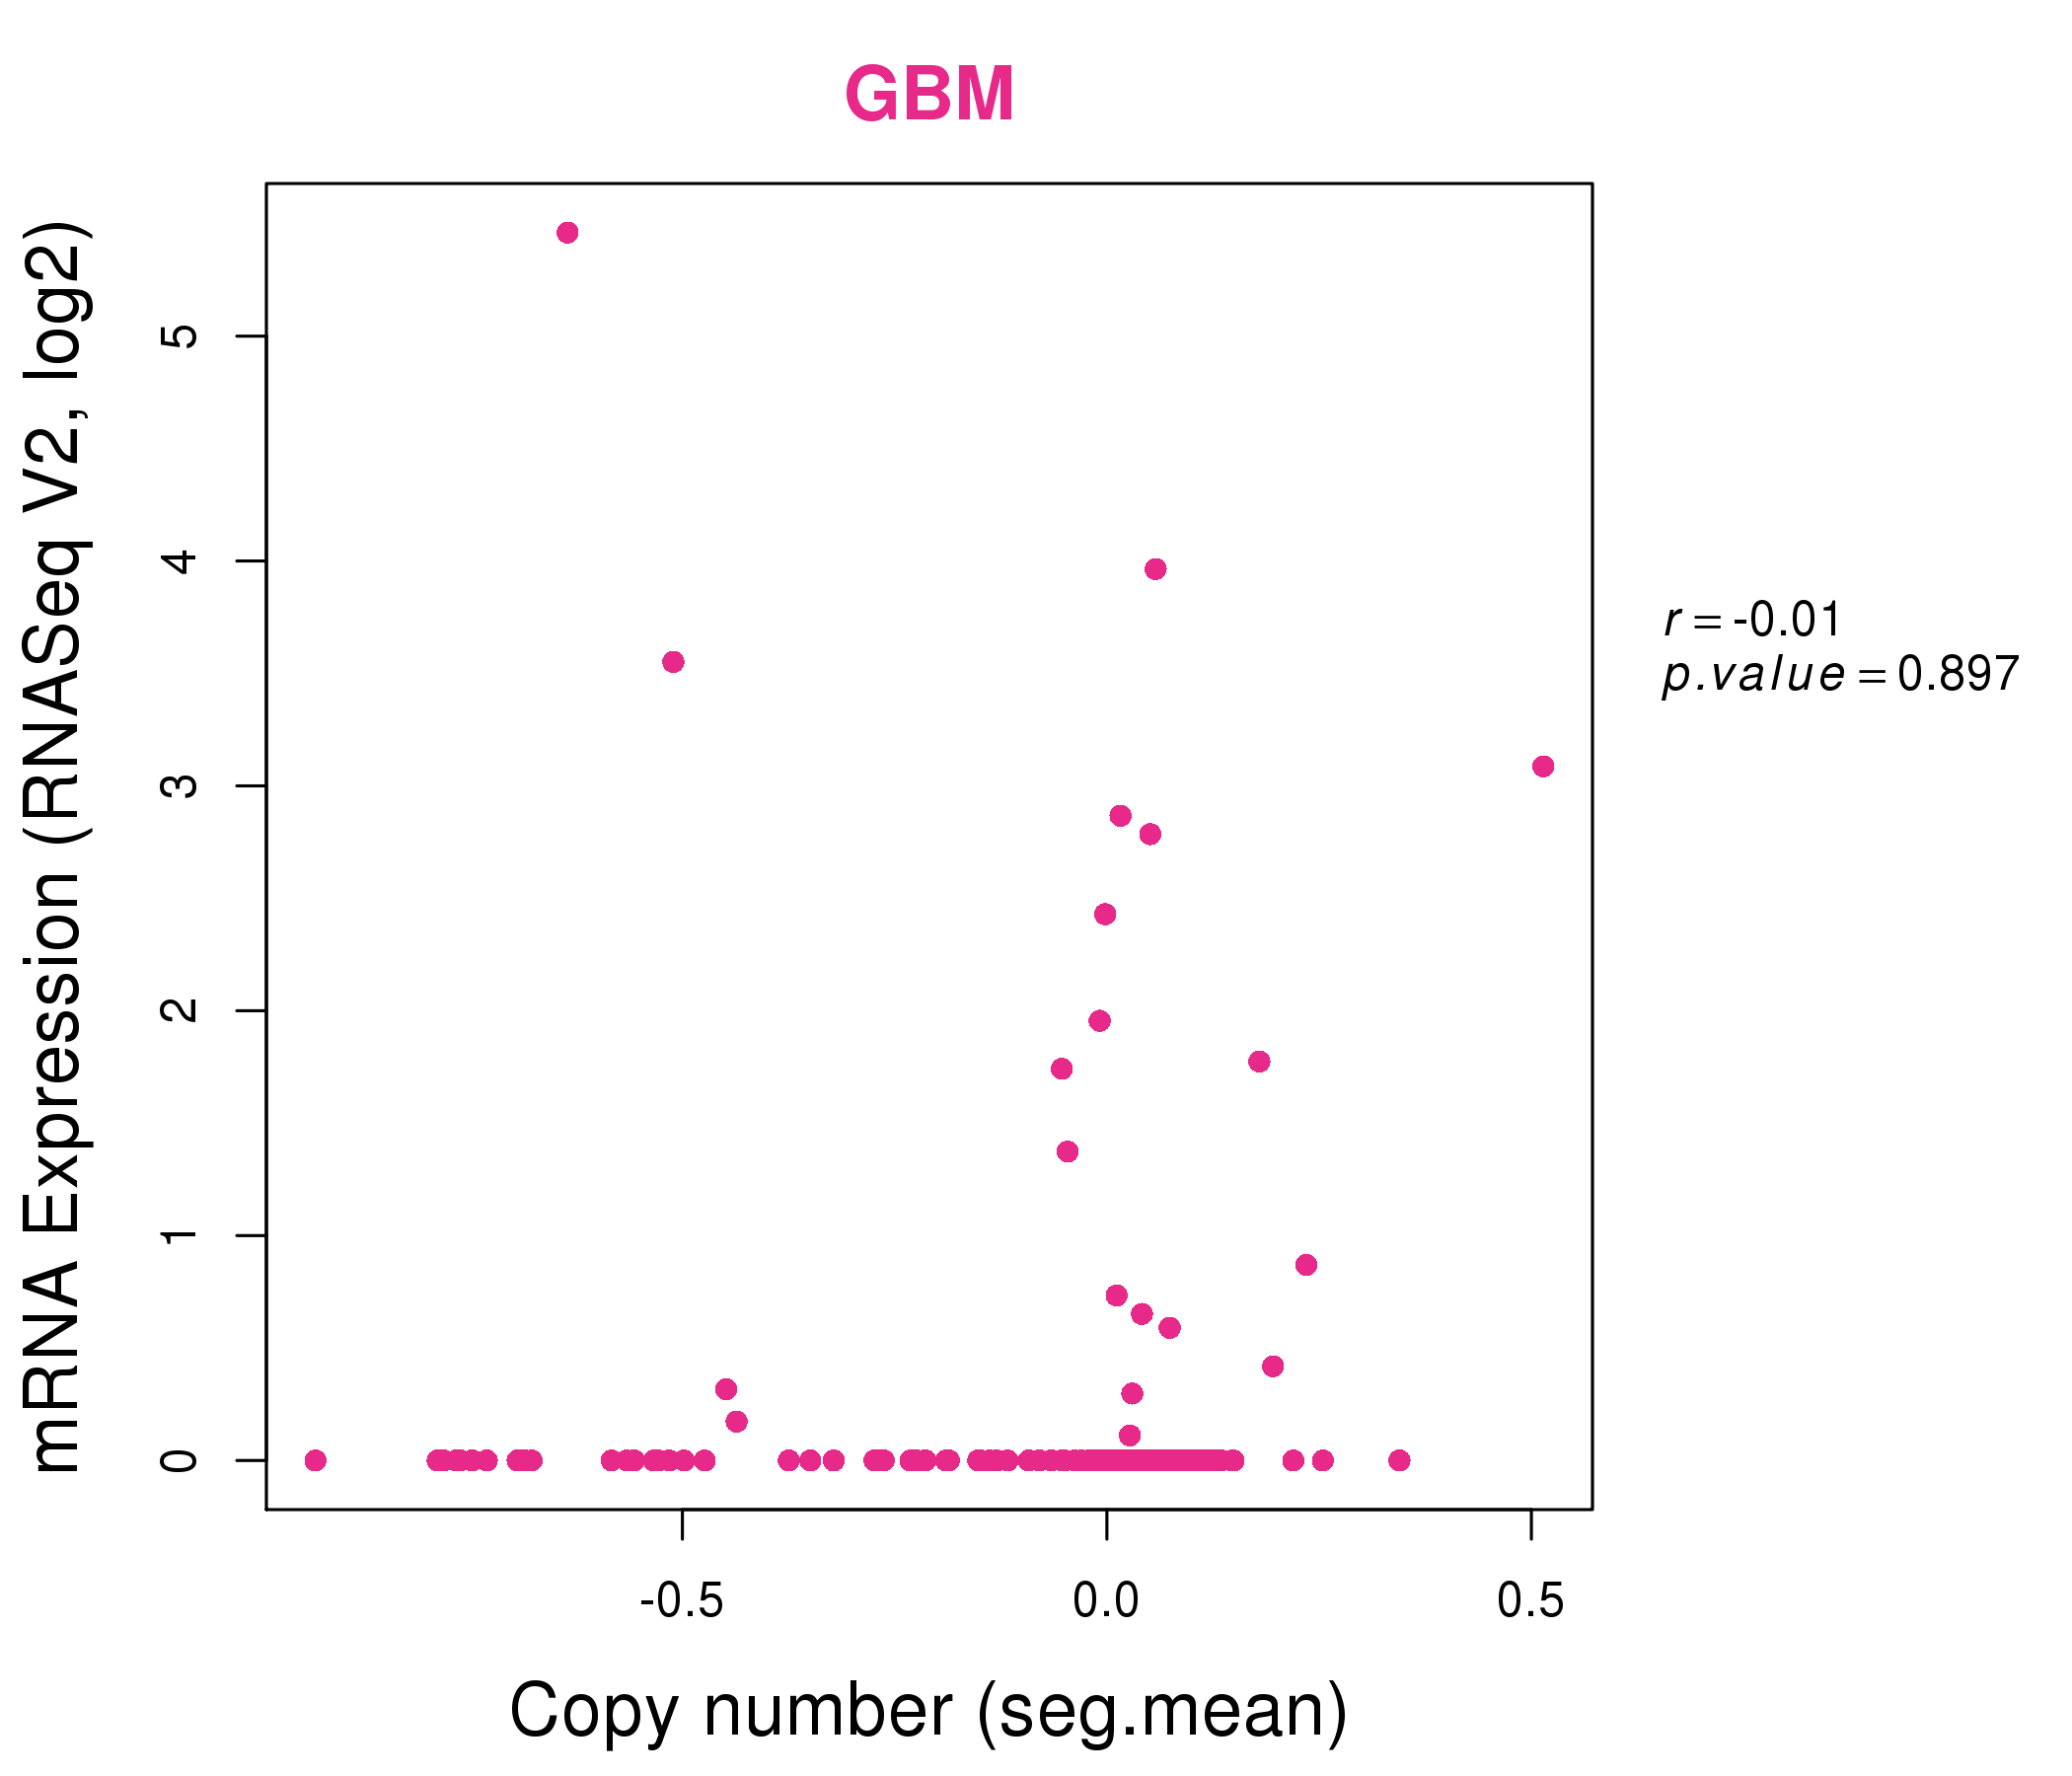
| * This plots show the correlation between CNV and gene expression. |
: Open all plots for all cancer types
 |
|
 |
|

| Top |
| Gene-Gene Network Information |
| * Co-Expression network figures were drawn using R package igraph. Only the top 20 genes with the highest correlations were shown. Red circle: input gene, orange circle: cell metabolism gene, sky circle: other gene |
: Open all plots for all cancer types
 |
| ||||
| ADAM23,AVPI1,LINC00473,CCND2,CGA,CHRND,CYP2C18, ECEL1,ERMN,FAAH2,FAM13A,GDF10,LOC441177,MCF2, PCDHGB3,PTP4A1,RASL10B,RNF182,TAPBPL,UPK3BL,ZNF488 | C14orf177,CALCA,CGA,CLEC3A,COL10A1,CST1,EGR4, GATA4,IL20,INSL4,KIR3DP1,LCE1D,LOC146336,MMP11, LINC00052,SCARNA20,SLC24A2,SLC30A8,SNORA80E,TPO,TYR | ||||
 |
| ||||
| BTBD17,CGA,CSH1,DEFB107A,FAM197Y2,FAM27L,FEV, FLJ36000,KRTAP20-4,LCE1A,LOC642929,NCAN,NEUROD2,OR2L8, OR5H2,RBMY1A3P,SCGB1D4,SELV,SLC6A5,TFAP2B,TFAP2D, TSPY1,TSPY4,ZN | CGA,CSAG1,HYPM,FAM177B,STRIP2,GABRG3,IGF2BP3, KLK6,LOC100133893,OR2T5,PABPN1L,POU3F1,PPY,SEMG1, SFTA2,SLC39A7,SYTL5,T,TCL1B,TRH,WDR66 |
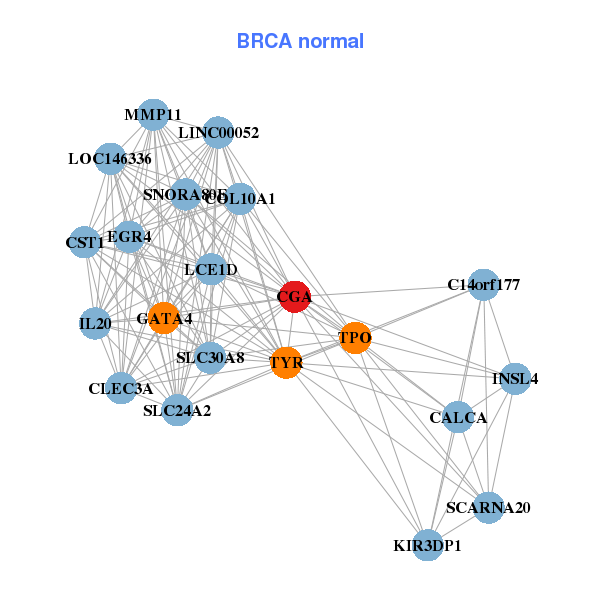
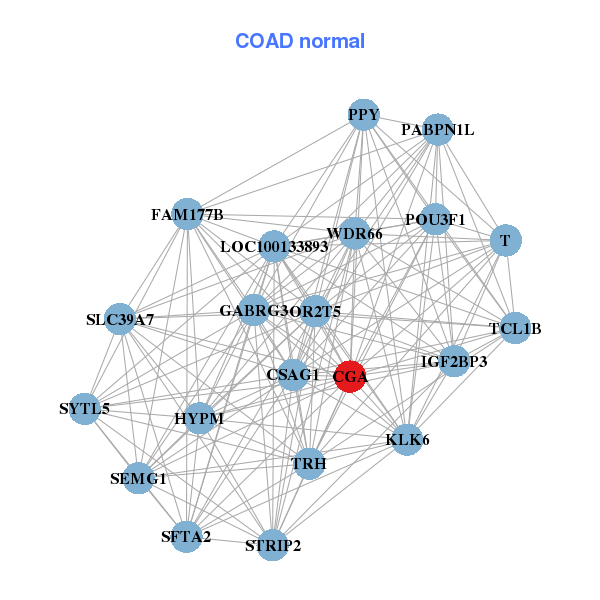
| * Co-Expression network figures were drawn using R package igraph. Only the top 20 genes with the highest correlations were shown. Red circle: input gene, orange circle: cell metabolism gene, sky circle: other gene |
: Open all plots for all cancer types
| Top |
: Open all interacting genes' information including KEGG pathway for all interacting genes from DAVID
| Top |
| Pharmacological Information for CGA |
| DB Category | DB Name | DB's ID and Url link |
| * Gene Centered Interaction Network. |
 |
| * Drug Centered Interaction Network. |
| DrugBank ID | Target Name | Drug Groups | Generic Name | Drug Centered Network | Drug Structure |
| DB02944 | glycoprotein hormones, alpha polypeptide | experimental | Alpha-D-Mannose |  |  |
| DB00451 | glycoprotein hormones, alpha polypeptide | approved | Levothyroxine | 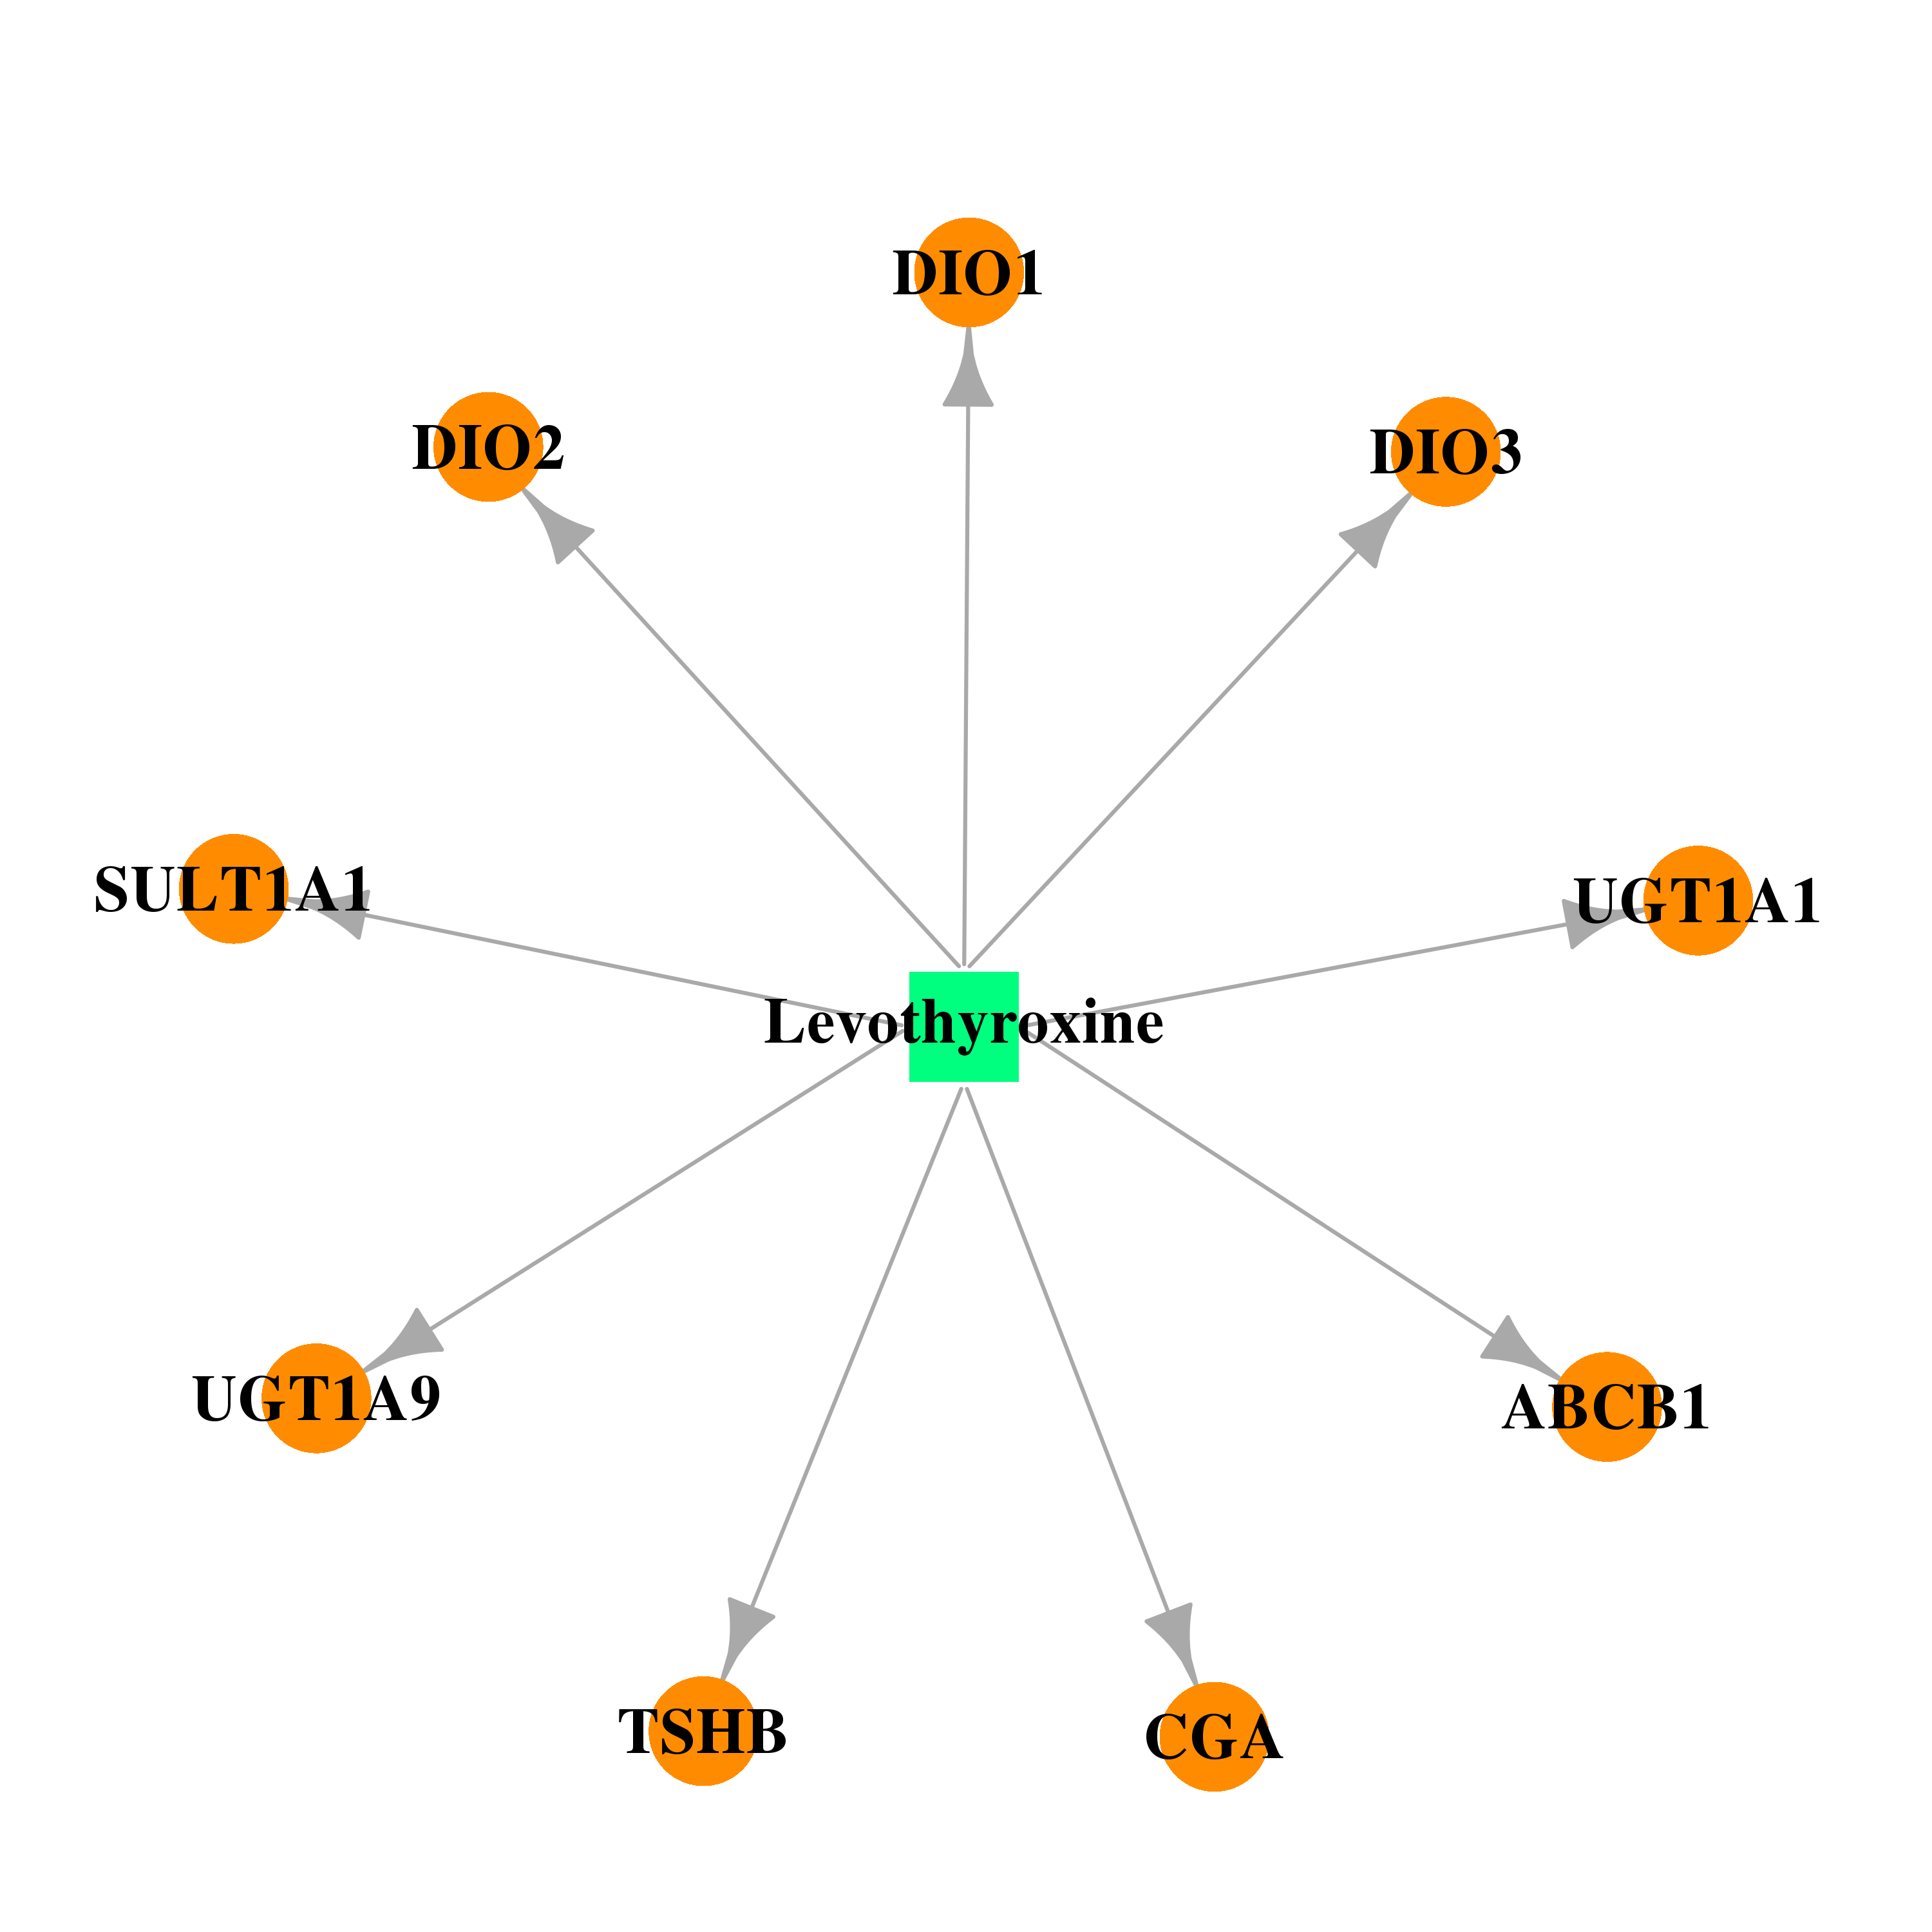 | 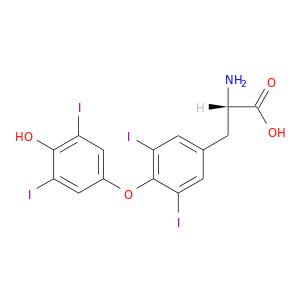 |
| Top |
| Cross referenced IDs for CGA |
| * We obtained these cross-references from Uniprot database. It covers 150 different DBs, 18 categories. http://www.uniprot.org/help/cross_references_section |
: Open all cross reference information
|
Copyright © 2016-Present - The Univsersity of Texas Health Science Center at Houston @ |