|
||||||||||||||||||||
| |
| Phenotypic Information (metabolism pathway, cancer, disease, phenome) |
| |
| |
| Gene-Gene Network Information: Co-Expression Network, Interacting Genes & KEGG |
| |
|


| Gene Summary for LYVE1 |
| Basic gene info. | Gene symbol | LYVE1 |
| Gene name | lymphatic vessel endothelial hyaluronan receptor 1 | |
| Synonyms | CRSBP-1|HAR|LYVE-1|XLKD1 | |
| Cytomap | UCSC genome browser: 11p15 | |
| Genomic location | chr11 :10579412-10590365 | |
| Type of gene | protein-coding | |
| RefGenes | NM_006691.3, | |
| Ensembl id | ENSG00000133800 | |
| Description | cell surface retention sequence binding protein-1cell surface retention sequence-binding protein 1extracellular link domain containing 1extracellular link domain-containing 1extracellular link domain-containing protein 1hyaluronic acid receptorlymph | |
| Modification date | 20141207 | |
| dbXrefs | MIM : 605702 | |
| HGNC : HGNC | ||
| HPRD : 05753 | ||
| Protein | UniProt: go to UniProt's Cross Reference DB Table | |
| Expression | CleanEX: HS_LYVE1 | |
| BioGPS: 10894 | ||
| Gene Expression Atlas: ENSG00000133800 | ||
| The Human Protein Atlas: ENSG00000133800 | ||
| Pathway | NCI Pathway Interaction Database: LYVE1 | |
| KEGG: LYVE1 | ||
| REACTOME: LYVE1 | ||
| ConsensusPathDB | ||
| Pathway Commons: LYVE1 | ||
| Metabolism | MetaCyc: LYVE1 | |
| HUMANCyc: LYVE1 | ||
| Regulation | Ensembl's Regulation: ENSG00000133800 | |
| miRBase: chr11 :10,579,412-10,590,365 | ||
| TargetScan: NM_006691 | ||
| cisRED: ENSG00000133800 | ||
| Context | iHOP: LYVE1 | |
| cancer metabolism search in PubMed: LYVE1 | ||
| UCL Cancer Institute: LYVE1 | ||
| Assigned class in ccmGDB | C | |
| Top |
| Phenotypic Information for LYVE1(metabolism pathway, cancer, disease, phenome) |
| Cancer | CGAP: LYVE1 |
| Familial Cancer Database: LYVE1 | |
| * This gene is included in those cancer gene databases. |
|
|
|
|
|
| . | ||||||||||||||
Oncogene 1 | Significant driver gene in | |||||||||||||||||||
| cf) number; DB name 1 Oncogene; http://nar.oxfordjournals.org/content/35/suppl_1/D721.long, 2 Tumor Suppressor gene; https://bioinfo.uth.edu/TSGene/, 3 Cancer Gene Census; http://www.nature.com/nrc/journal/v4/n3/abs/nrc1299.html, 4 CancerGenes; http://nar.oxfordjournals.org/content/35/suppl_1/D721.long, 5 Network of Cancer Gene; http://ncg.kcl.ac.uk/index.php, 1Therapeutic Vulnerabilities in Cancer; http://cbio.mskcc.org/cancergenomics/statius/ |
| REACTOME_HYALURONAN_METABOLISM REACTOME_METABOLISM_OF_CARBOHYDRATES | |
| OMIM | |
| Orphanet | |
| Disease | KEGG Disease: LYVE1 |
| MedGen: LYVE1 (Human Medical Genetics with Condition) | |
| ClinVar: LYVE1 | |
| Phenotype | MGI: LYVE1 (International Mouse Phenotyping Consortium) |
| PhenomicDB: LYVE1 | |
| Mutations for LYVE1 |
| * Under tables are showing count per each tissue to give us broad intuition about tissue specific mutation patterns.You can go to the detailed page for each mutation database's web site. |
| There's no structural variation information in COSMIC data for this gene. |
| * From mRNA Sanger sequences, Chitars2.0 arranged chimeric transcripts. This table shows LYVE1 related fusion information. |
| ID | Head Gene | Tail Gene | Accession | Gene_a | qStart_a | qEnd_a | Chromosome_a | tStart_a | tEnd_a | Gene_a | qStart_a | qEnd_a | Chromosome_a | tStart_a | tEnd_a |
| Top |
| There's no copy number variation information in COSMIC data for this gene. |
| Top |
|
 |
| Top |
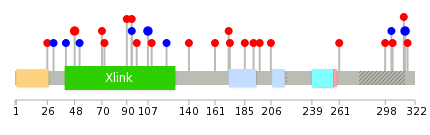
| Stat. for Non-Synonymous SNVs (# total SNVs=16) | (# total SNVs=4) |
 |  |
(# total SNVs=0) | (# total SNVs=0) |
| Top |
| * When you move the cursor on each content, you can see more deailed mutation information on the Tooltip. Those are primary_site,primary_histology,mutation(aa),pubmedID. |
| GRCh37 position | Mutation(aa) | Unique sampleID count |
| chr11:10585563-10585563 | p.G107G | 2 |
| chr11:10585602-10585602 | p.F94L | 2 |
| chr11:10580685-10580685 | p.T314T | 2 |
| chr11:10585864-10585864 | p.A48V | 2 |
| chr11:10585520-10585520 | p.R122R | 1 |
| chr11:10585914-10585914 | p.S31S | 1 |
| chr11:10580733-10580733 | p.K298N | 1 |
| chr11:10585555-10585555 | p.G110V | 1 |
| chr11:10590003-10590003 | p.R26H | 1 |
| chr11:10581364-10581364 | p.R261G | 1 |
| Top |
|
 |
| Point Mutation/ Tissue ID | 1 | 2 | 3 | 4 | 5 | 6 | 7 | 8 | 9 | 10 | 11 | 12 | 13 | 14 | 15 | 16 | 17 | 18 | 19 | 20 |
| # sample | 1 | 3 | 1 | 1 | 1 | 3 | 2 | 6 | 3 | 1 | ||||||||||
| # mutation | 1 | 3 | 1 | 1 | 1 | 3 | 2 | 6 | 3 | 1 | ||||||||||
| nonsynonymous SNV | 1 | 3 | 1 | 1 | 3 | 2 | 3 | 2 | 1 | |||||||||||
| synonymous SNV | 1 | 3 | 1 |
| cf) Tissue ID; Tissue type (1; BLCA[Bladder Urothelial Carcinoma], 2; BRCA[Breast invasive carcinoma], 3; CESC[Cervical squamous cell carcinoma and endocervical adenocarcinoma], 4; COAD[Colon adenocarcinoma], 5; GBM[Glioblastoma multiforme], 6; Glioma Low Grade, 7; HNSC[Head and Neck squamous cell carcinoma], 8; KICH[Kidney Chromophobe], 9; KIRC[Kidney renal clear cell carcinoma], 10; KIRP[Kidney renal papillary cell carcinoma], 11; LAML[Acute Myeloid Leukemia], 12; LUAD[Lung adenocarcinoma], 13; LUSC[Lung squamous cell carcinoma], 14; OV[Ovarian serous cystadenocarcinoma ], 15; PAAD[Pancreatic adenocarcinoma], 16; PRAD[Prostate adenocarcinoma], 17; SKCM[Skin Cutaneous Melanoma], 18:STAD[Stomach adenocarcinoma], 19:THCA[Thyroid carcinoma], 20:UCEC[Uterine Corpus Endometrial Carcinoma]) |
| Top |
| * We represented just top 10 SNVs. When you move the cursor on each content, you can see more deailed mutation information on the Tooltip. Those are primary_site, primary_histology, mutation(aa), pubmedID. |
| Genomic Position | Mutation(aa) | Unique sampleID count |
| chr11:10585563 | p.G107G | 2 |
| chr11:10585793 | p.N292S | 1 |
| chr11:10580733 | p.D290N | 1 |
| chr11:10585798 | p.K197I | 1 |
| chr11:10580752 | p.P185T | 1 |
| chr11:10585851 | p.S173F | 1 |
| chr11:10580759 | p.E161K | 1 |
| chr11:10585864 | p.I140V | 1 |
| chr11:10582155 | p.S131L | 1 |
| chr11:10590003 | p.D72N | 1 |
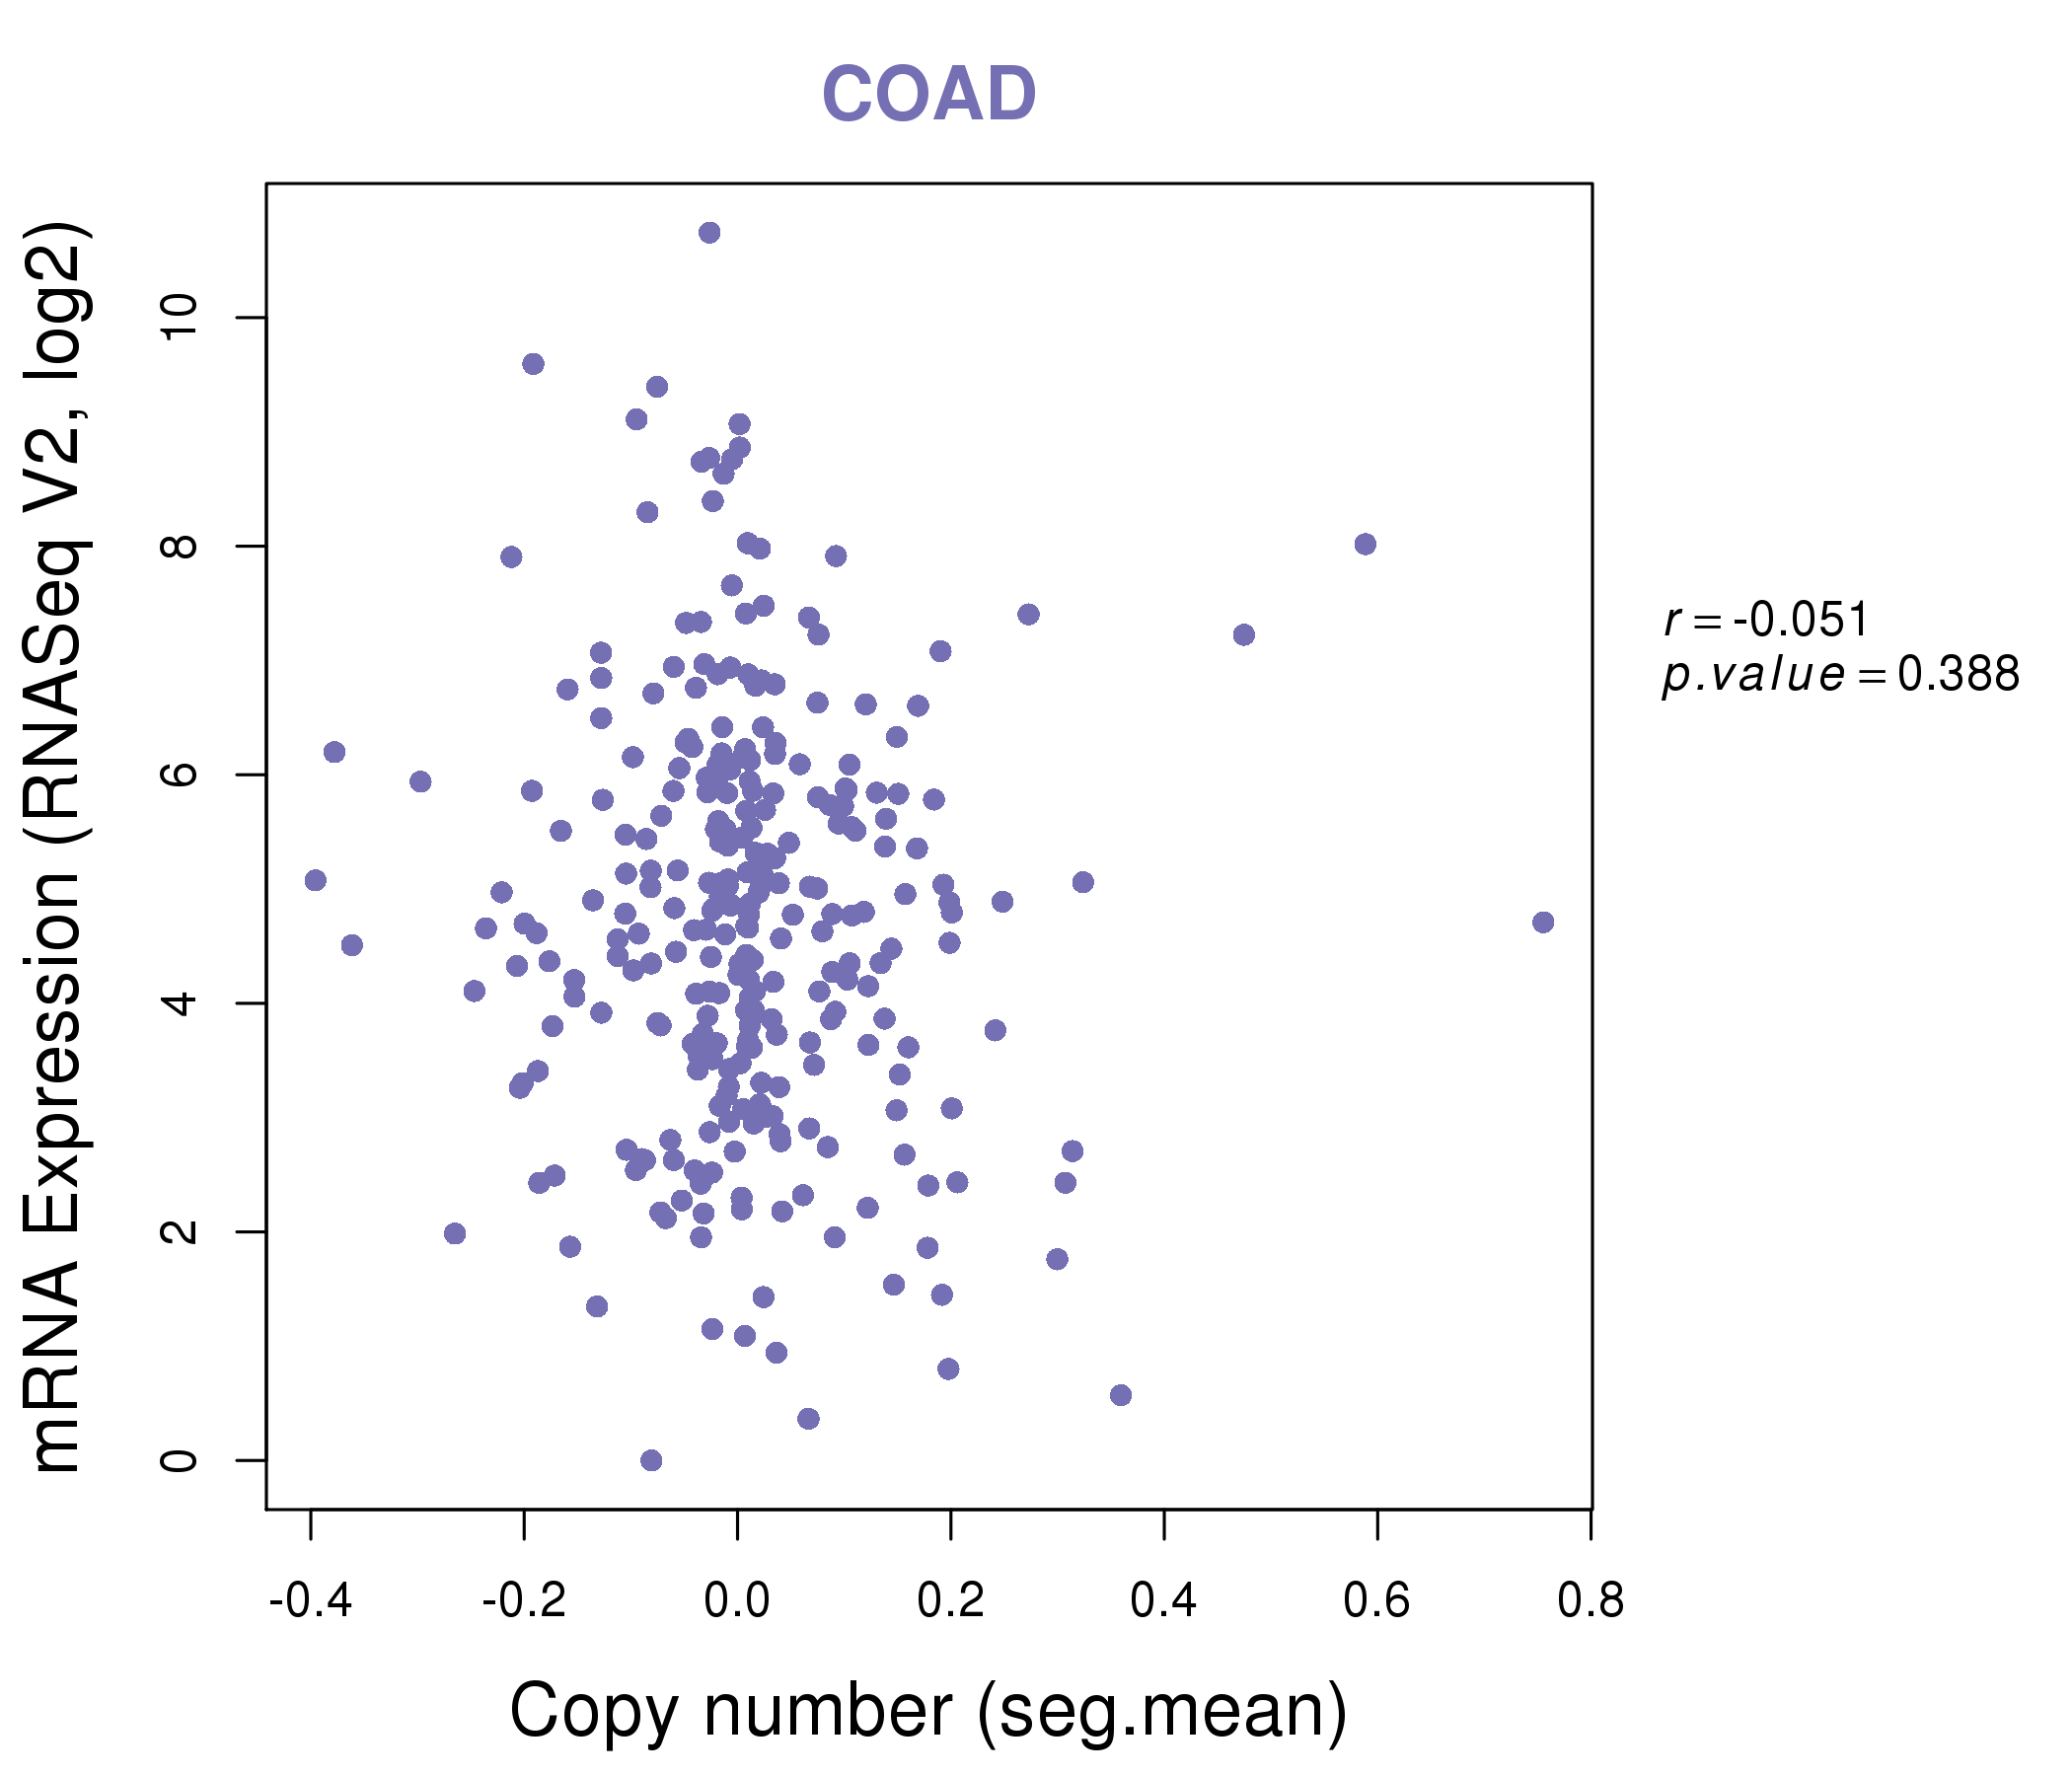
| * Copy number data were extracted from TCGA using R package TCGA-Assembler. The URLs of all public data files on TCGA DCC data server were gathered on Jan-05-2015. Function ProcessCNAData in TCGA-Assembler package was used to obtain gene-level copy number value which is calculated as the average copy number of the genomic region of a gene. |
 |
| cf) Tissue ID[Tissue type]: BLCA[Bladder Urothelial Carcinoma], BRCA[Breast invasive carcinoma], CESC[Cervical squamous cell carcinoma and endocervical adenocarcinoma], COAD[Colon adenocarcinoma], GBM[Glioblastoma multiforme], Glioma Low Grade, HNSC[Head and Neck squamous cell carcinoma], KICH[Kidney Chromophobe], KIRC[Kidney renal clear cell carcinoma], KIRP[Kidney renal papillary cell carcinoma], LAML[Acute Myeloid Leukemia], LUAD[Lung adenocarcinoma], LUSC[Lung squamous cell carcinoma], OV[Ovarian serous cystadenocarcinoma ], PAAD[Pancreatic adenocarcinoma], PRAD[Prostate adenocarcinoma], SKCM[Skin Cutaneous Melanoma], STAD[Stomach adenocarcinoma], THCA[Thyroid carcinoma], UCEC[Uterine Corpus Endometrial Carcinoma] |
| Top |
| Gene Expression for LYVE1 |
| * CCLE gene expression data were extracted from CCLE_Expression_Entrez_2012-10-18.res: Gene-centric RMA-normalized mRNA expression data. |
 |
| * Normalized gene expression data of RNASeqV2 was extracted from TCGA using R package TCGA-Assembler. The URLs of all public data files on TCGA DCC data server were gathered at Jan-05-2015. Only eight cancer types have enough normal control samples for differential expression analysis. (t test, adjusted p<0.05 (using Benjamini-Hochberg FDR)) |
 |
| Top |
| * This plots show the correlation between CNV and gene expression. |
: Open all plots for all cancer types
 |
|
 |
|


| Top |
| Gene-Gene Network Information |
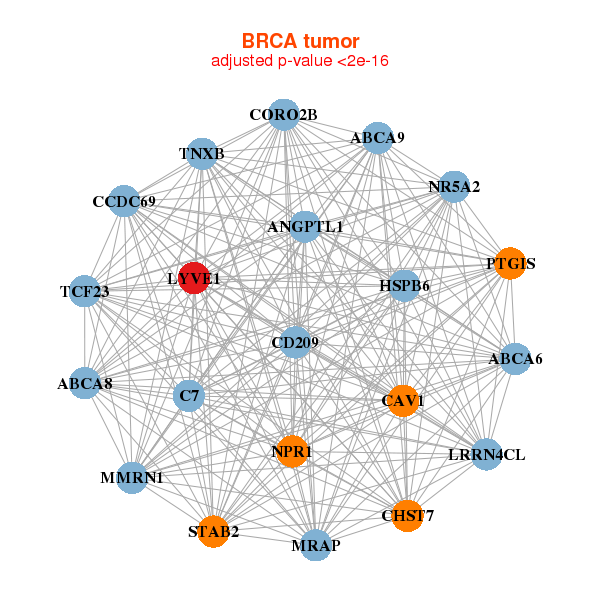
| * Co-Expression network figures were drawn using R package igraph. Only the top 20 genes with the highest correlations were shown. Red circle: input gene, orange circle: cell metabolism gene, sky circle: other gene |
: Open all plots for all cancer types
 |
|
| ABCA6,ABCA8,ABCA9,ANGPTL1,C7,CAV1,CCDC69, CD209,CHST7,CORO2B,HSPB6,LRRN4CL,LYVE1,MMRN1, MRAP,NPR1,NR5A2,PTGIS,STAB2,TCF23,TNXB | BCAT1,CD200R1,CD209,CMKLR1,COLEC12,DAB2,F13A1, FOLR2,FSTL1,GFPT2,GPR1,HPGDS,HRH1,LILRB5, LYVE1,MFAP5,MPEG1,MRC1,RGL1,SCN9A,SLC24A4 |
 |
|
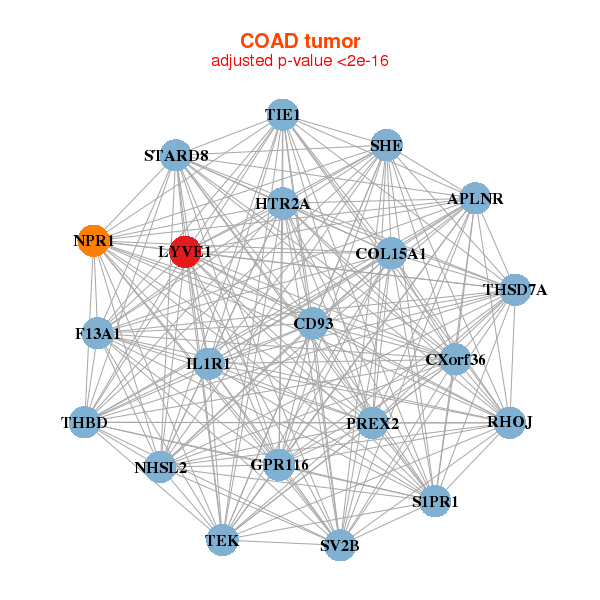
| APLNR,CD93,COL15A1,CXorf36,F13A1,GPR116,HTR2A, IL1R1,LYVE1,NHSL2,NPR1,PREX2,RHOJ,S1PR1, SHE,STARD8,SV2B,TEK,THBD,THSD7A,TIE1 | ABCA6,ABCA9,ADH1B,ALDH1A3,ANXA1,C11orf70,C1S, C7,CDO1,CYP7B1,FMO2,LOC572558,LOH12CR2,LYVE1, NRN1,RBP7,RGL1,SETD7,SNCA,SNCG,TPST1 |

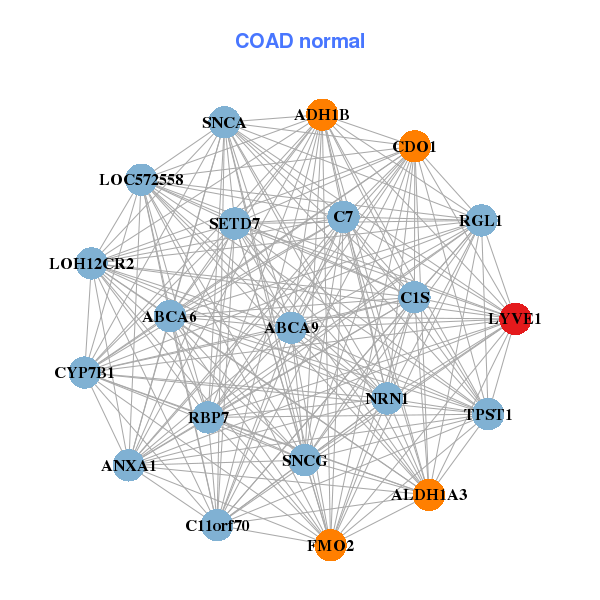
| * Co-Expression network figures were drawn using R package igraph. Only the top 20 genes with the highest correlations were shown. Red circle: input gene, orange circle: cell metabolism gene, sky circle: other gene |
: Open all plots for all cancer types
| Top |
: Open all interacting genes' information including KEGG pathway for all interacting genes from DAVID
| Top |
| Pharmacological Information for LYVE1 |
| There's no related Drug. |
| Top |
| Cross referenced IDs for LYVE1 |
| * We obtained these cross-references from Uniprot database. It covers 150 different DBs, 18 categories. http://www.uniprot.org/help/cross_references_section |
: Open all cross reference information
|
Copyright © 2016-Present - The Univsersity of Texas Health Science Center at Houston @ |