|
||||||||||||||||||||||||||||||||||||||||||||||||||||||||||||||||||||||||||||||||||||||||||||||||||||||||||||||||||||||||||||||||||||||||||||||||||||||||||||||||||||||||||||||||||||||||||||||||||||||||||||||||||||||||||||||||||||||||||||||||||||||||||||||||||||||||||||||||||||||||||||||||||||||||||||||||||||||||||||||||||||||||||||||||||||||
| |
| Phenotypic Information (metabolism pathway, cancer, disease, phenome) |
| |
| |
| Gene-Gene Network Information: Co-Expression Network, Interacting Genes & KEGG |
| |
|


| Gene Summary for ADCY3 |
| Basic gene info. | Gene symbol | ADCY3 |
| Gene name | adenylate cyclase 3 | |
| Synonyms | AC3 | |
| Cytomap | UCSC genome browser: 2p23.3 | |
| Genomic location | chr2 :25042038-25142055 | |
| Type of gene | protein-coding | |
| RefGenes | NM_004036.3, | |
| Ensembl id | ENSG00000138031 | |
| Description | AC-IIIATP pyrophosphate-lyase 3adenylate cyclase type 3adenylate cyclase type IIIadenylate cyclase, olfactive typeadenylyl cyclase 3adenylyl cyclase, type III | |
| Modification date | 20141207 | |
| dbXrefs | MIM : 600291 | |
| HGNC : HGNC | ||
| Ensembl : ENSG00000138031 | ||
| HPRD : 02620 | ||
| Vega : OTTHUMG00000094765 | ||
| Protein | UniProt: O60266 go to UniProt's Cross Reference DB Table | |
| Expression | CleanEX: HS_ADCY3 | |
| BioGPS: 109 | ||
| Gene Expression Atlas: ENSG00000138031 | ||
| The Human Protein Atlas: ENSG00000138031 | ||
| Pathway | NCI Pathway Interaction Database: ADCY3 | |
| KEGG: ADCY3 | ||
| REACTOME: ADCY3 | ||
| ConsensusPathDB | ||
| Pathway Commons: ADCY3 | ||
| Metabolism | MetaCyc: ADCY3 | |
| HUMANCyc: ADCY3 | ||
| Regulation | Ensembl's Regulation: ENSG00000138031 | |
| miRBase: chr2 :25,042,038-25,142,055 | ||
| TargetScan: NM_004036 | ||
| cisRED: ENSG00000138031 | ||
| Context | iHOP: ADCY3 | |
| cancer metabolism search in PubMed: ADCY3 | ||
| UCL Cancer Institute: ADCY3 | ||
| Assigned class in ccmGDB | A - This gene has a literature evidence and it belongs to cancer gene. | |
| References showing role of ADCY3 in cancer cell metabolism | 1. Hong SH, Goh SH, Lee SJ, Hwang JA, Lee J, et al. (2013) Upregulation of adenylate cyclase 3 (ADCY3) increases the tumorigenic potential of cells by activating the CREB pathway. Oncotarget 4: 1791-1803. pmid: 3858564. go to article | |
| Top |
| Phenotypic Information for ADCY3(metabolism pathway, cancer, disease, phenome) |
| Cancer | CGAP: ADCY3 |
| Familial Cancer Database: ADCY3 | |
| * This gene is included in those cancer gene databases. |
|
|
|
|
|
| . | ||||||||||||||||||||||||||||||||||||||||||||||||||||||||||||||||||||||||||||||||||||||||||||||||||||||||||||||||||||||||||||||||||||||||||||||||||||||||||||||||||||||||||||||||||||||||||||||||||||||||||||||||||||||||||||||||||||||||||||||||||||||||||||||||||||||||||||||||||||||||||||||||||||||||||||||||||||||||||||||||||||||||||||||||
Oncogene 1 | Significant driver gene in | |||||||||||||||||||||||||||||||||||||||||||||||||||||||||||||||||||||||||||||||||||||||||||||||||||||||||||||||||||||||||||||||||||||||||||||||||||||||||||||||||||||||||||||||||||||||||||||||||||||||||||||||||||||||||||||||||||||||||||||||||||||||||||||||||||||||||||||||||||||||||||||||||||||||||||||||||||||||||||||||||||||||||||||||||||||
| cf) number; DB name 1 Oncogene; http://nar.oxfordjournals.org/content/35/suppl_1/D721.long, 2 Tumor Suppressor gene; https://bioinfo.uth.edu/TSGene/, 3 Cancer Gene Census; http://www.nature.com/nrc/journal/v4/n3/abs/nrc1299.html, 4 CancerGenes; http://nar.oxfordjournals.org/content/35/suppl_1/D721.long, 5 Network of Cancer Gene; http://ncg.kcl.ac.uk/index.php, 1Therapeutic Vulnerabilities in Cancer; http://cbio.mskcc.org/cancergenomics/statius/ |
| KEGG_PURINE_METABOLISM REACTOME_INTEGRATION_OF_ENERGY_METABOLISM | |
| OMIM | 600291; gene. |
| Orphanet | |
| Disease | KEGG Disease: ADCY3 |
| MedGen: ADCY3 (Human Medical Genetics with Condition) | |
| ClinVar: ADCY3 | |
| Phenotype | MGI: ADCY3 (International Mouse Phenotyping Consortium) |
| PhenomicDB: ADCY3 | |
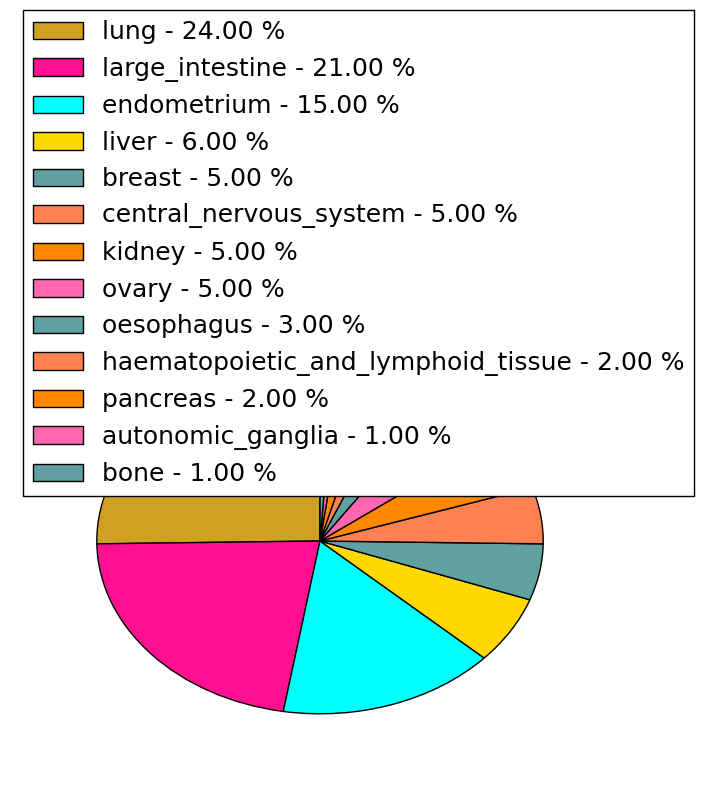
| Mutations for ADCY3 |
| * Under tables are showing count per each tissue to give us broad intuition about tissue specific mutation patterns.You can go to the detailed page for each mutation database's web site. |
| - Statistics for Tissue and Mutation type | Top |
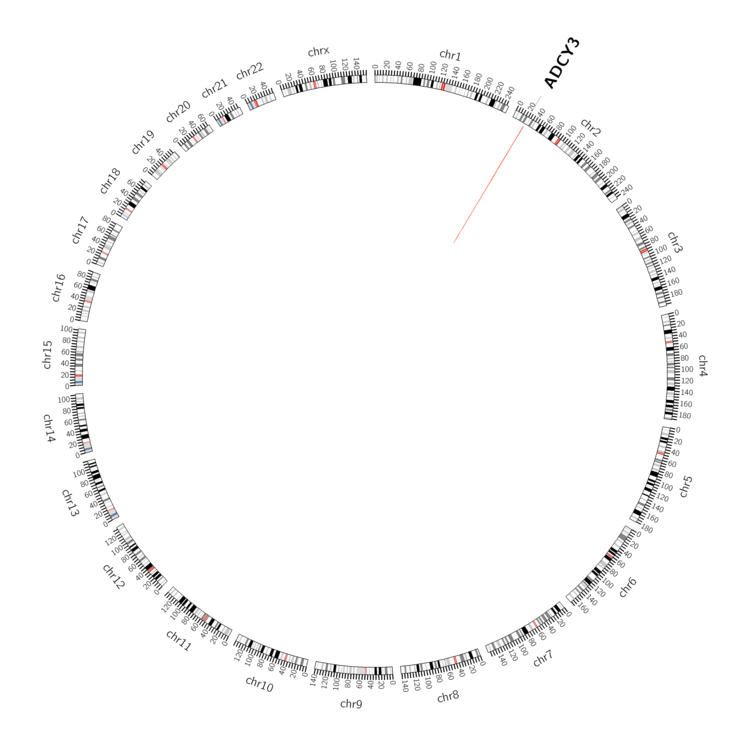 |
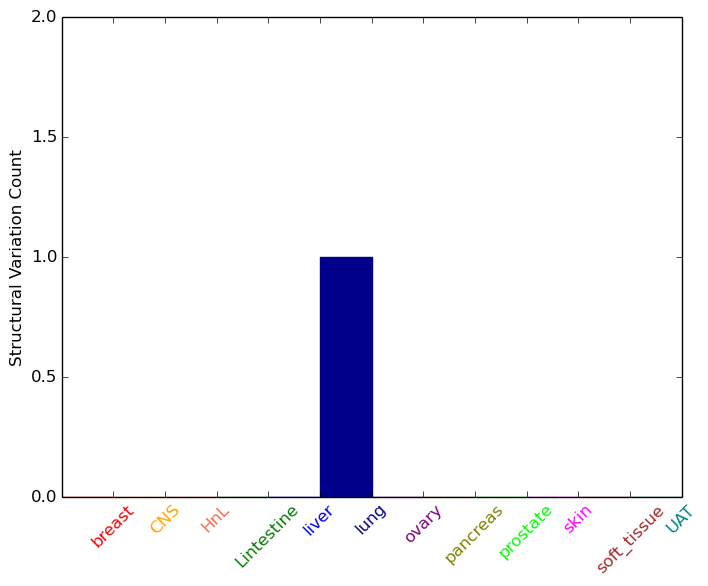
| - For Inter-chromosomal Variations |
| There's no inter-chromosomal structural variation. |
| - For Intra-chromosomal Variations |
| * Intra-chromosomal variantions includes 'intrachromosomal amplicon to amplicon', 'intrachromosomal amplicon to non-amplified dna', 'intrachromosomal deletion', 'intrachromosomal fold-back inversion', 'intrachromosomal inversion', 'intrachromosomal tandem duplication', 'Intrachromosomal unknown type', 'intrachromosomal with inverted orientation', 'intrachromosomal with non-inverted orientation'. |
 |
| Sample | Symbol_a | Chr_a | Start_a | End_a | Symbol_b | Chr_b | Start_b | End_b |
| lung | ADCY3 | chr2 | 25081092 | 25081092 | chr2 | 25942209 | 25942209 |
| cf) Tissue number; Tissue name (1;Breast, 2;Central_nervous_system, 3;Haematopoietic_and_lymphoid_tissue, 4;Large_intestine, 5;Liver, 6;Lung, 7;Ovary, 8;Pancreas, 9;Prostate, 10;Skin, 11;Soft_tissue, 12;Upper_aerodigestive_tract) |
| * From mRNA Sanger sequences, Chitars2.0 arranged chimeric transcripts. This table shows ADCY3 related fusion information. |
| ID | Head Gene | Tail Gene | Accession | Gene_a | qStart_a | qEnd_a | Chromosome_a | tStart_a | tEnd_a | Gene_a | qStart_a | qEnd_a | Chromosome_a | tStart_a | tEnd_a |
| Top |
| Mutation type/ Tissue ID | brca | cns | cerv | endome | haematopo | kidn | Lintest | liver | lung | ns | ovary | pancre | prost | skin | stoma | thyro | urina | |||
| Total # sample | 1 | 1 | ||||||||||||||||||
| GAIN (# sample) | 1 | |||||||||||||||||||
| LOSS (# sample) | 1 |
| cf) Tissue ID; Tissue type (1; Breast, 2; Central_nervous_system, 3; Cervix, 4; Endometrium, 5; Haematopoietic_and_lymphoid_tissue, 6; Kidney, 7; Large_intestine, 8; Liver, 9; Lung, 10; NS, 11; Ovary, 12; Pancreas, 13; Prostate, 14; Skin, 15; Stomach, 16; Thyroid, 17; Urinary_tract) |
| Top |
|
 |
| Top |
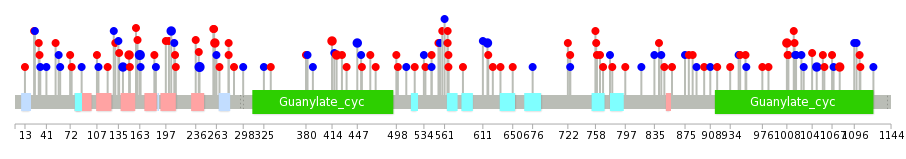
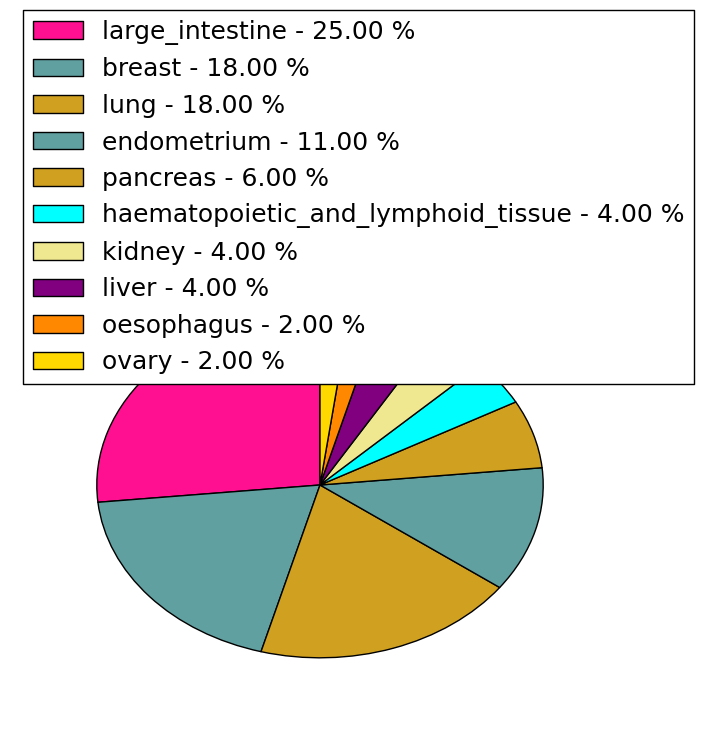
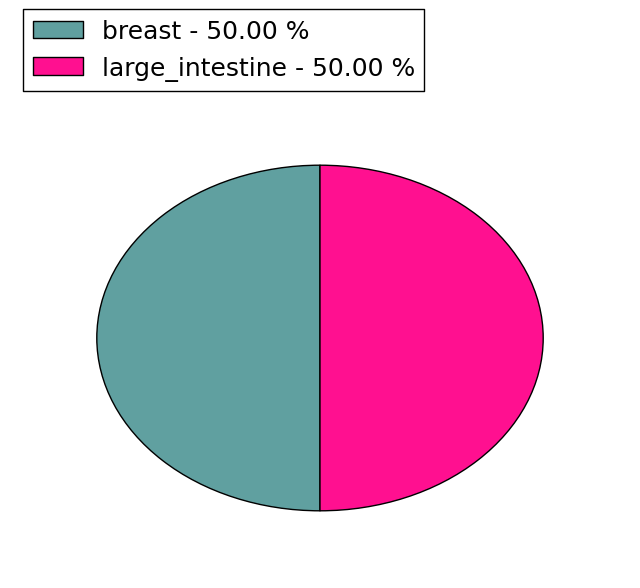
| Stat. for Non-Synonymous SNVs (# total SNVs=78) | (# total SNVs=43) |
 |  |
(# total SNVs=2) | (# total SNVs=0) |
 |
| Top |
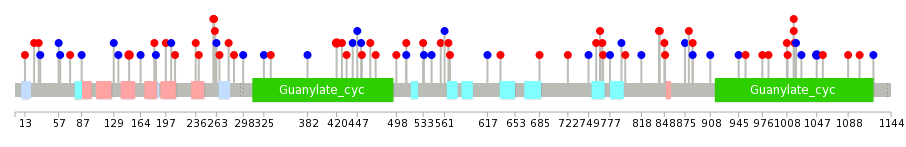
| * When you move the cursor on each content, you can see more deailed mutation information on the Tooltip. Those are primary_site,primary_histology,mutation(aa),pubmedID. |
| GRCh37 position | Mutation(aa) | Unique sampleID count |
| chr2:25095541-25095541 | p.I241I | 3 |
| chr2:25141368-25141368 | p.H163H | 3 |
| chr2:25044490-25044490 | p.E1008V | 2 |
| chr2:25062857-25062857 | p.G414W | 2 |
| chr2:25141412-25141412 | p.A149T | 2 |
| chr2:25141245-25141245 | p.V204V | 2 |
| chr2:25141434-25141434 | p.Y141Y | 2 |
| chr2:25057470-25057470 | p.D617D | 2 |
| chr2:25095482-25095482 | p.S261L | 2 |
| chr2:25062756-25062756 | p.A447A | 2 |
| Top |
|
 |
| Point Mutation/ Tissue ID | 1 | 2 | 3 | 4 | 5 | 6 | 7 | 8 | 9 | 10 | 11 | 12 | 13 | 14 | 15 | 16 | 17 | 18 | 19 | 20 |
| # sample | 3 | 4 | 16 | 2 | 6 | 2 | 1 | 1 | 8 | 6 | 2 | 9 | 7 | 1 | 15 | |||||
| # mutation | 3 | 4 | 17 | 2 | 6 | 2 | 1 | 1 | 8 | 7 | 2 | 10 | 8 | 1 | 15 | |||||
| nonsynonymous SNV | 2 | 2 | 9 | 2 | 4 | 2 | 1 | 1 | 5 | 6 | 2 | 1 | 6 | 1 | 10 | |||||
| synonymous SNV | 1 | 2 | 8 | 2 | 3 | 1 | 9 | 2 | 5 |
| cf) Tissue ID; Tissue type (1; BLCA[Bladder Urothelial Carcinoma], 2; BRCA[Breast invasive carcinoma], 3; CESC[Cervical squamous cell carcinoma and endocervical adenocarcinoma], 4; COAD[Colon adenocarcinoma], 5; GBM[Glioblastoma multiforme], 6; Glioma Low Grade, 7; HNSC[Head and Neck squamous cell carcinoma], 8; KICH[Kidney Chromophobe], 9; KIRC[Kidney renal clear cell carcinoma], 10; KIRP[Kidney renal papillary cell carcinoma], 11; LAML[Acute Myeloid Leukemia], 12; LUAD[Lung adenocarcinoma], 13; LUSC[Lung squamous cell carcinoma], 14; OV[Ovarian serous cystadenocarcinoma ], 15; PAAD[Pancreatic adenocarcinoma], 16; PRAD[Prostate adenocarcinoma], 17; SKCM[Skin Cutaneous Melanoma], 18:STAD[Stomach adenocarcinoma], 19:THCA[Thyroid carcinoma], 20:UCEC[Uterine Corpus Endometrial Carcinoma]) |
| Top |
| * We represented just top 10 SNVs. When you move the cursor on each content, you can see more deailed mutation information on the Tooltip. Those are primary_site, primary_histology, mutation(aa), pubmedID. |
| Genomic Position | Mutation(aa) | Unique sampleID count |
| chr2:25141412 | p.G1047G | 2 |
| chr2:25062839 | p.V420M | 2 |
| chr2:25043704 | p.A149T | 2 |
| chr2:25048948 | p.Q260R | 1 |
| chr2:25062800 | p.F57F | 1 |
| chr2:25141819 | p.E1088K | 1 |
| chr2:25042928 | p.R885R | 1 |
| chr2:25050956 | p.V722M | 1 |
| chr2:25095482 | p.R453L | 1 |
| chr2:25045432 | p.R259H | 1 |
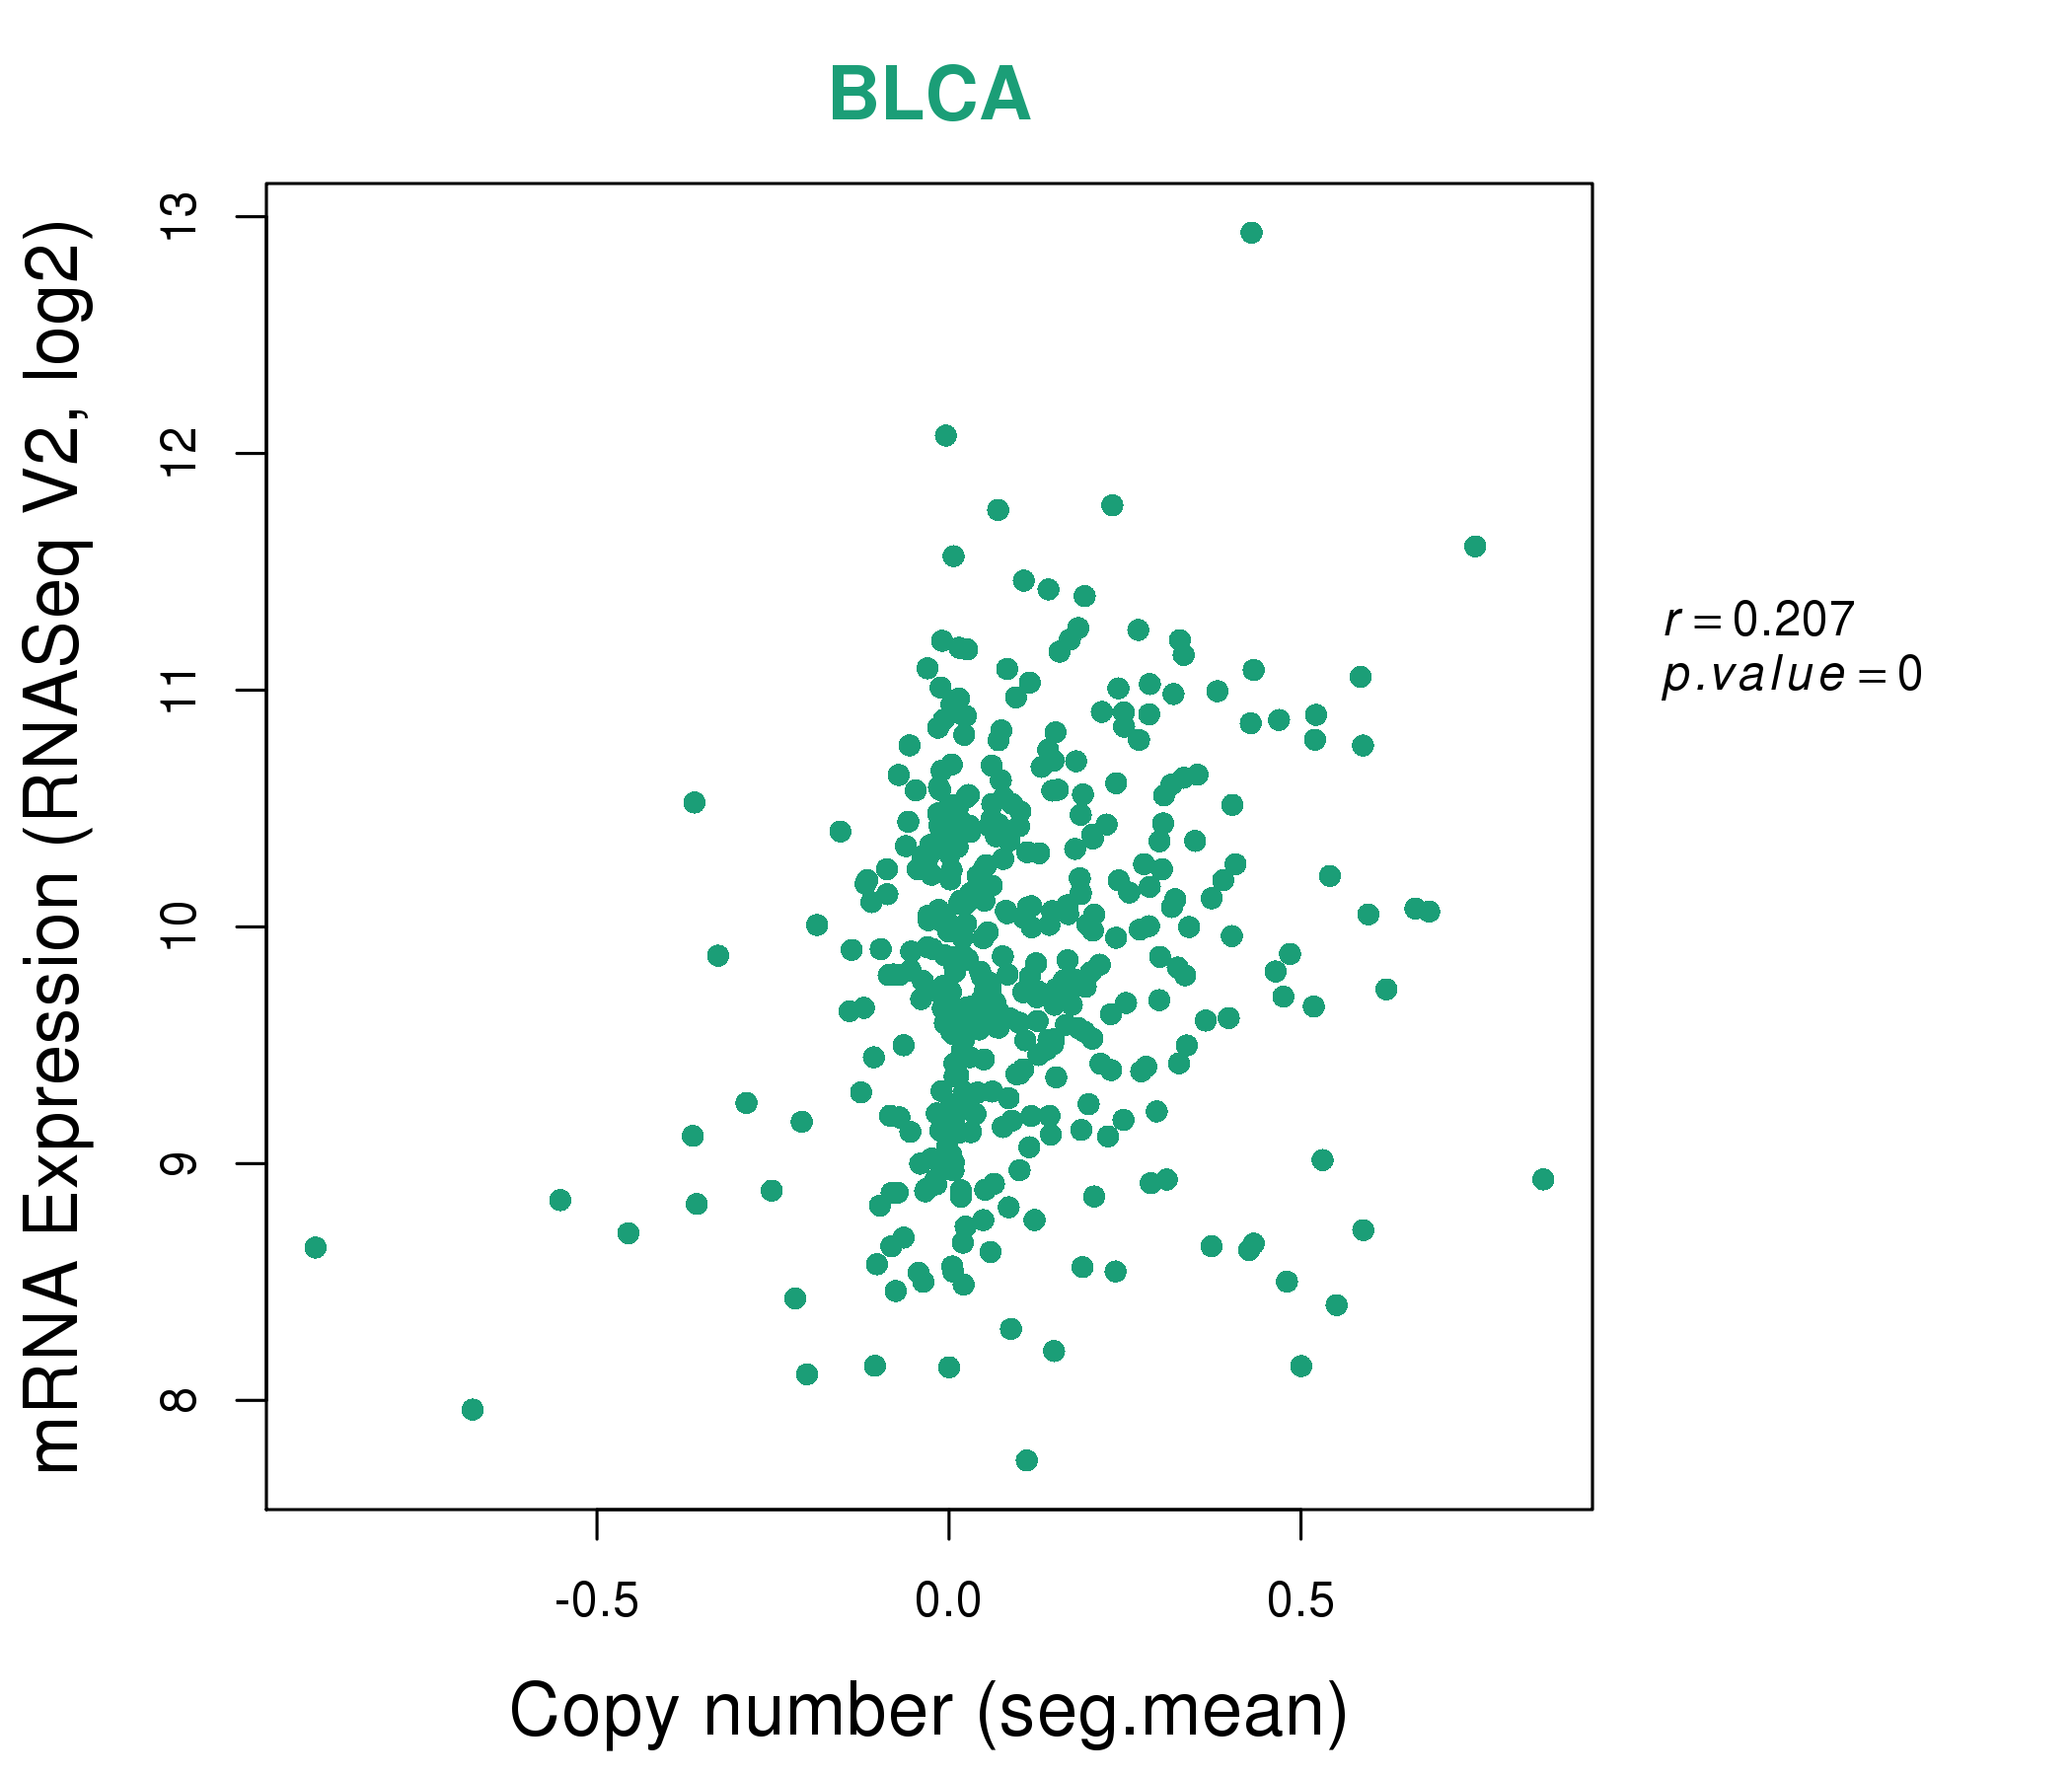
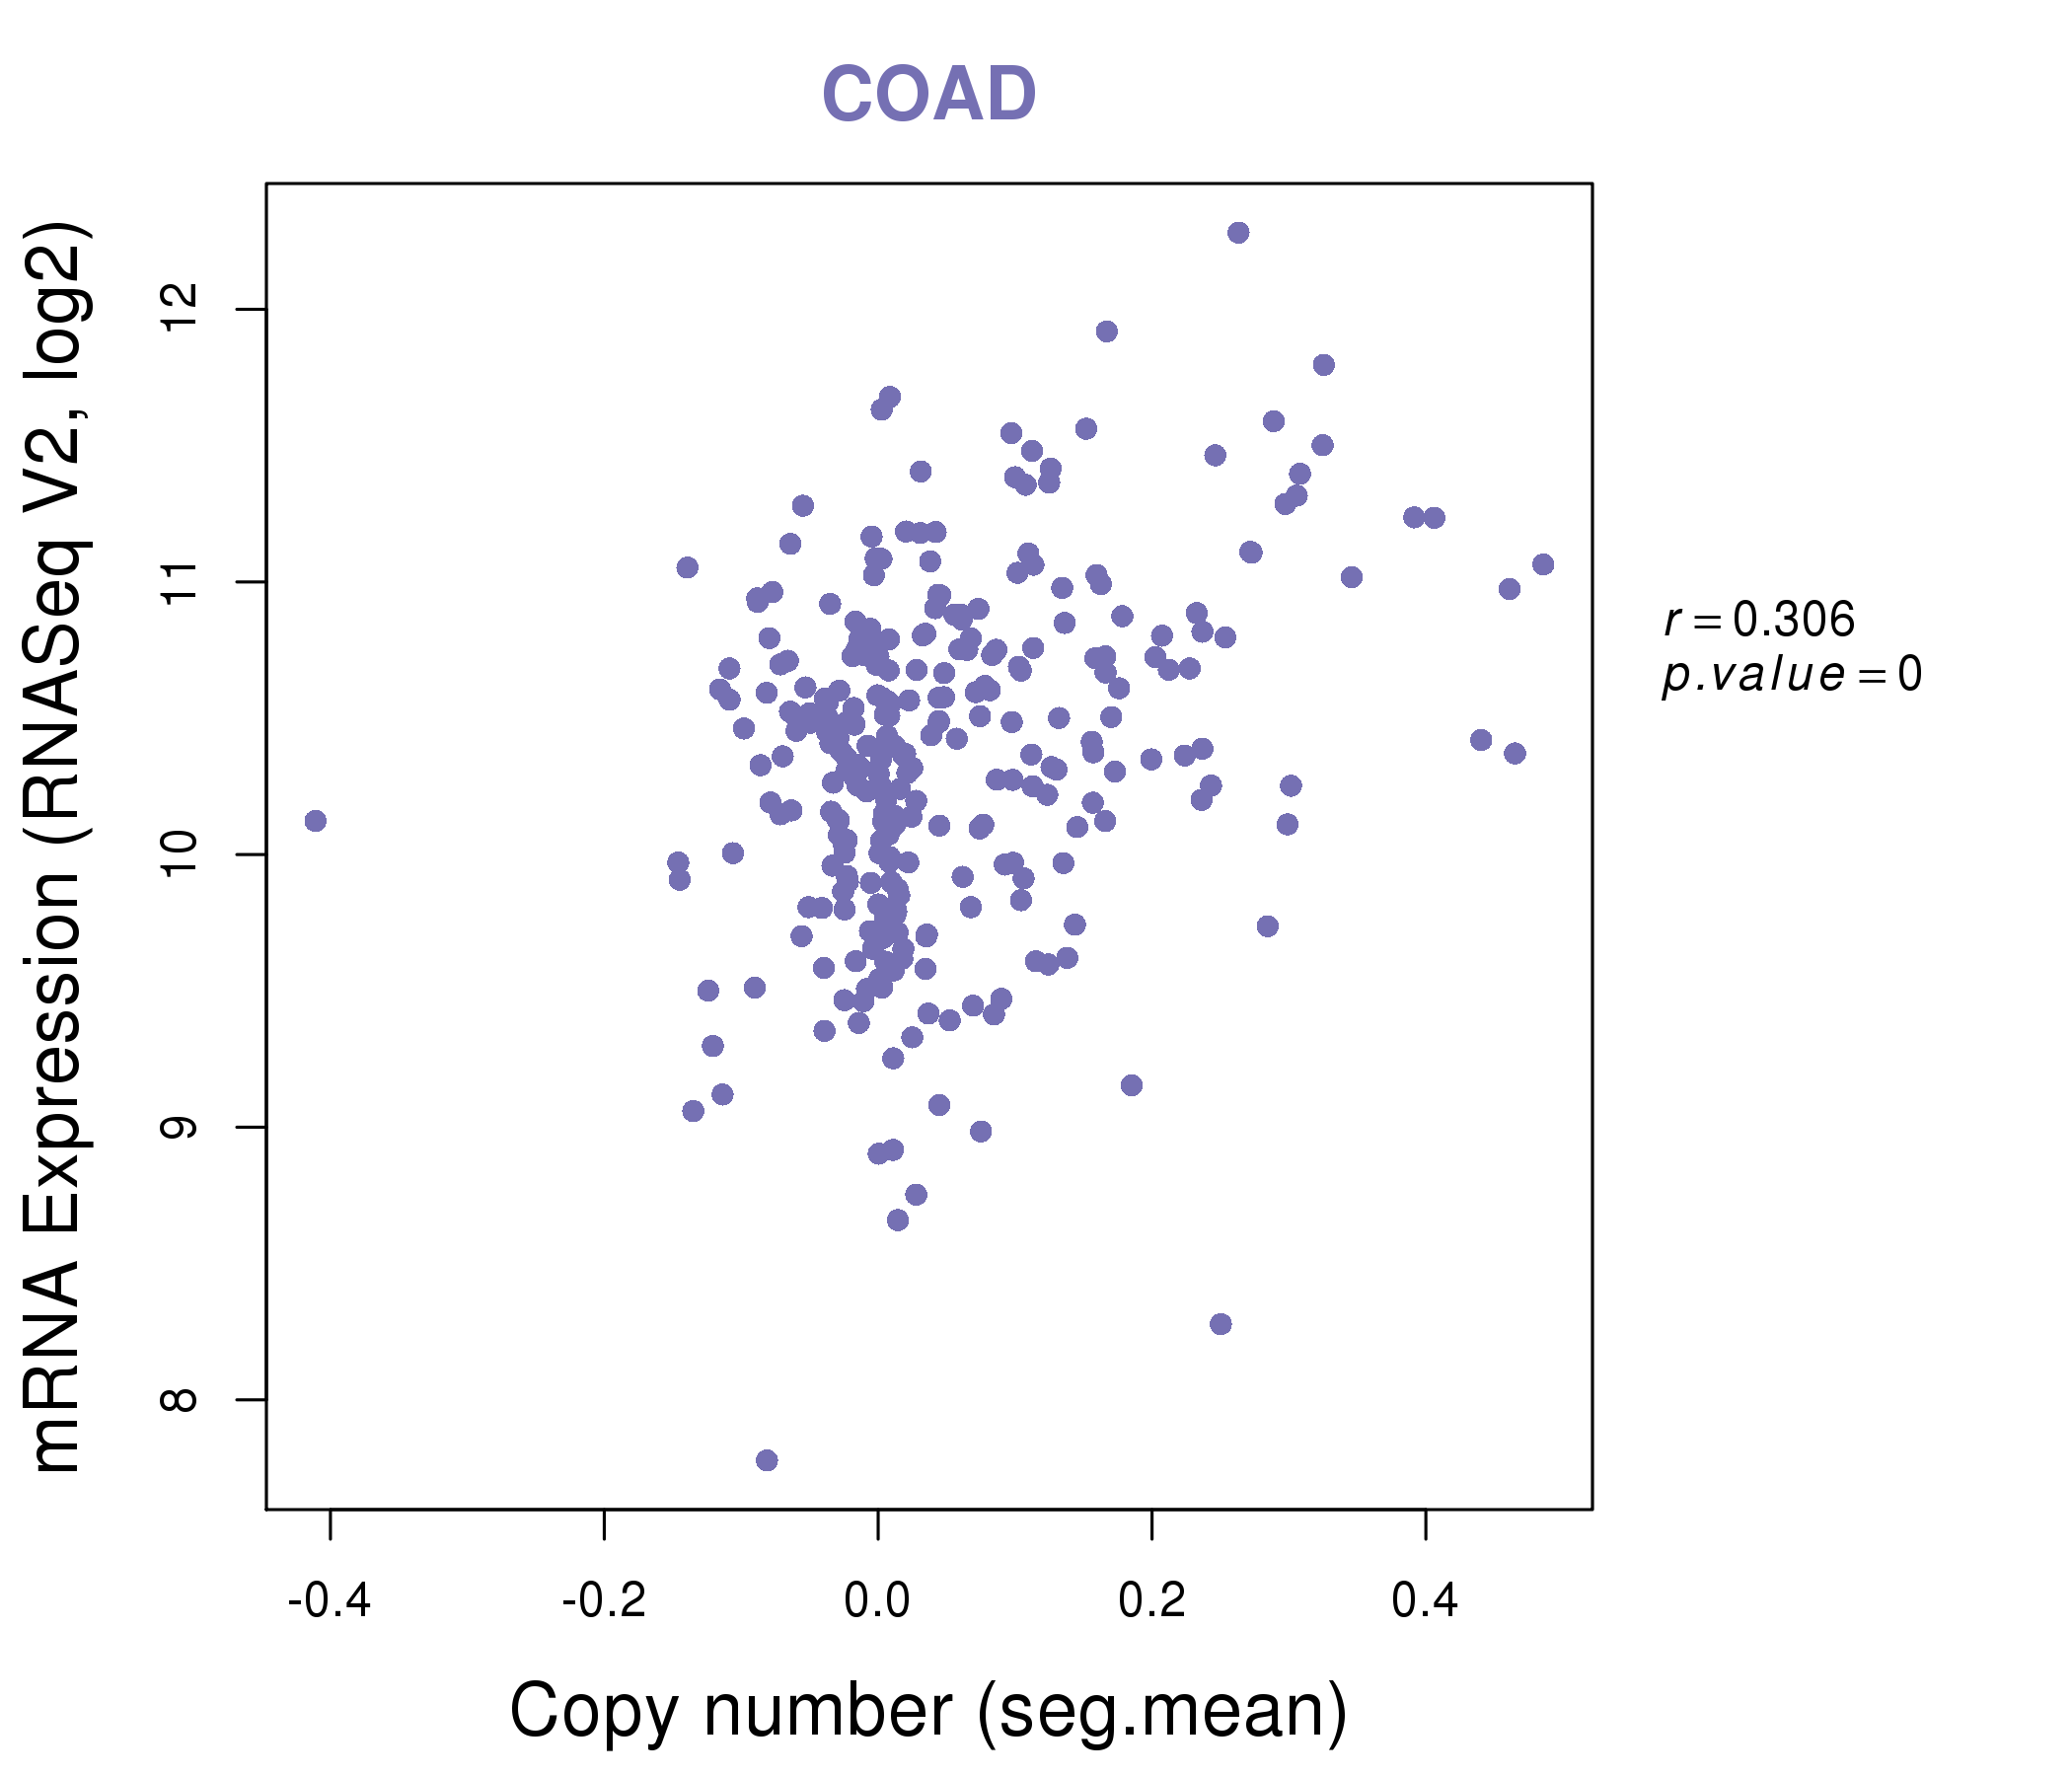
| * Copy number data were extracted from TCGA using R package TCGA-Assembler. The URLs of all public data files on TCGA DCC data server were gathered on Jan-05-2015. Function ProcessCNAData in TCGA-Assembler package was used to obtain gene-level copy number value which is calculated as the average copy number of the genomic region of a gene. |
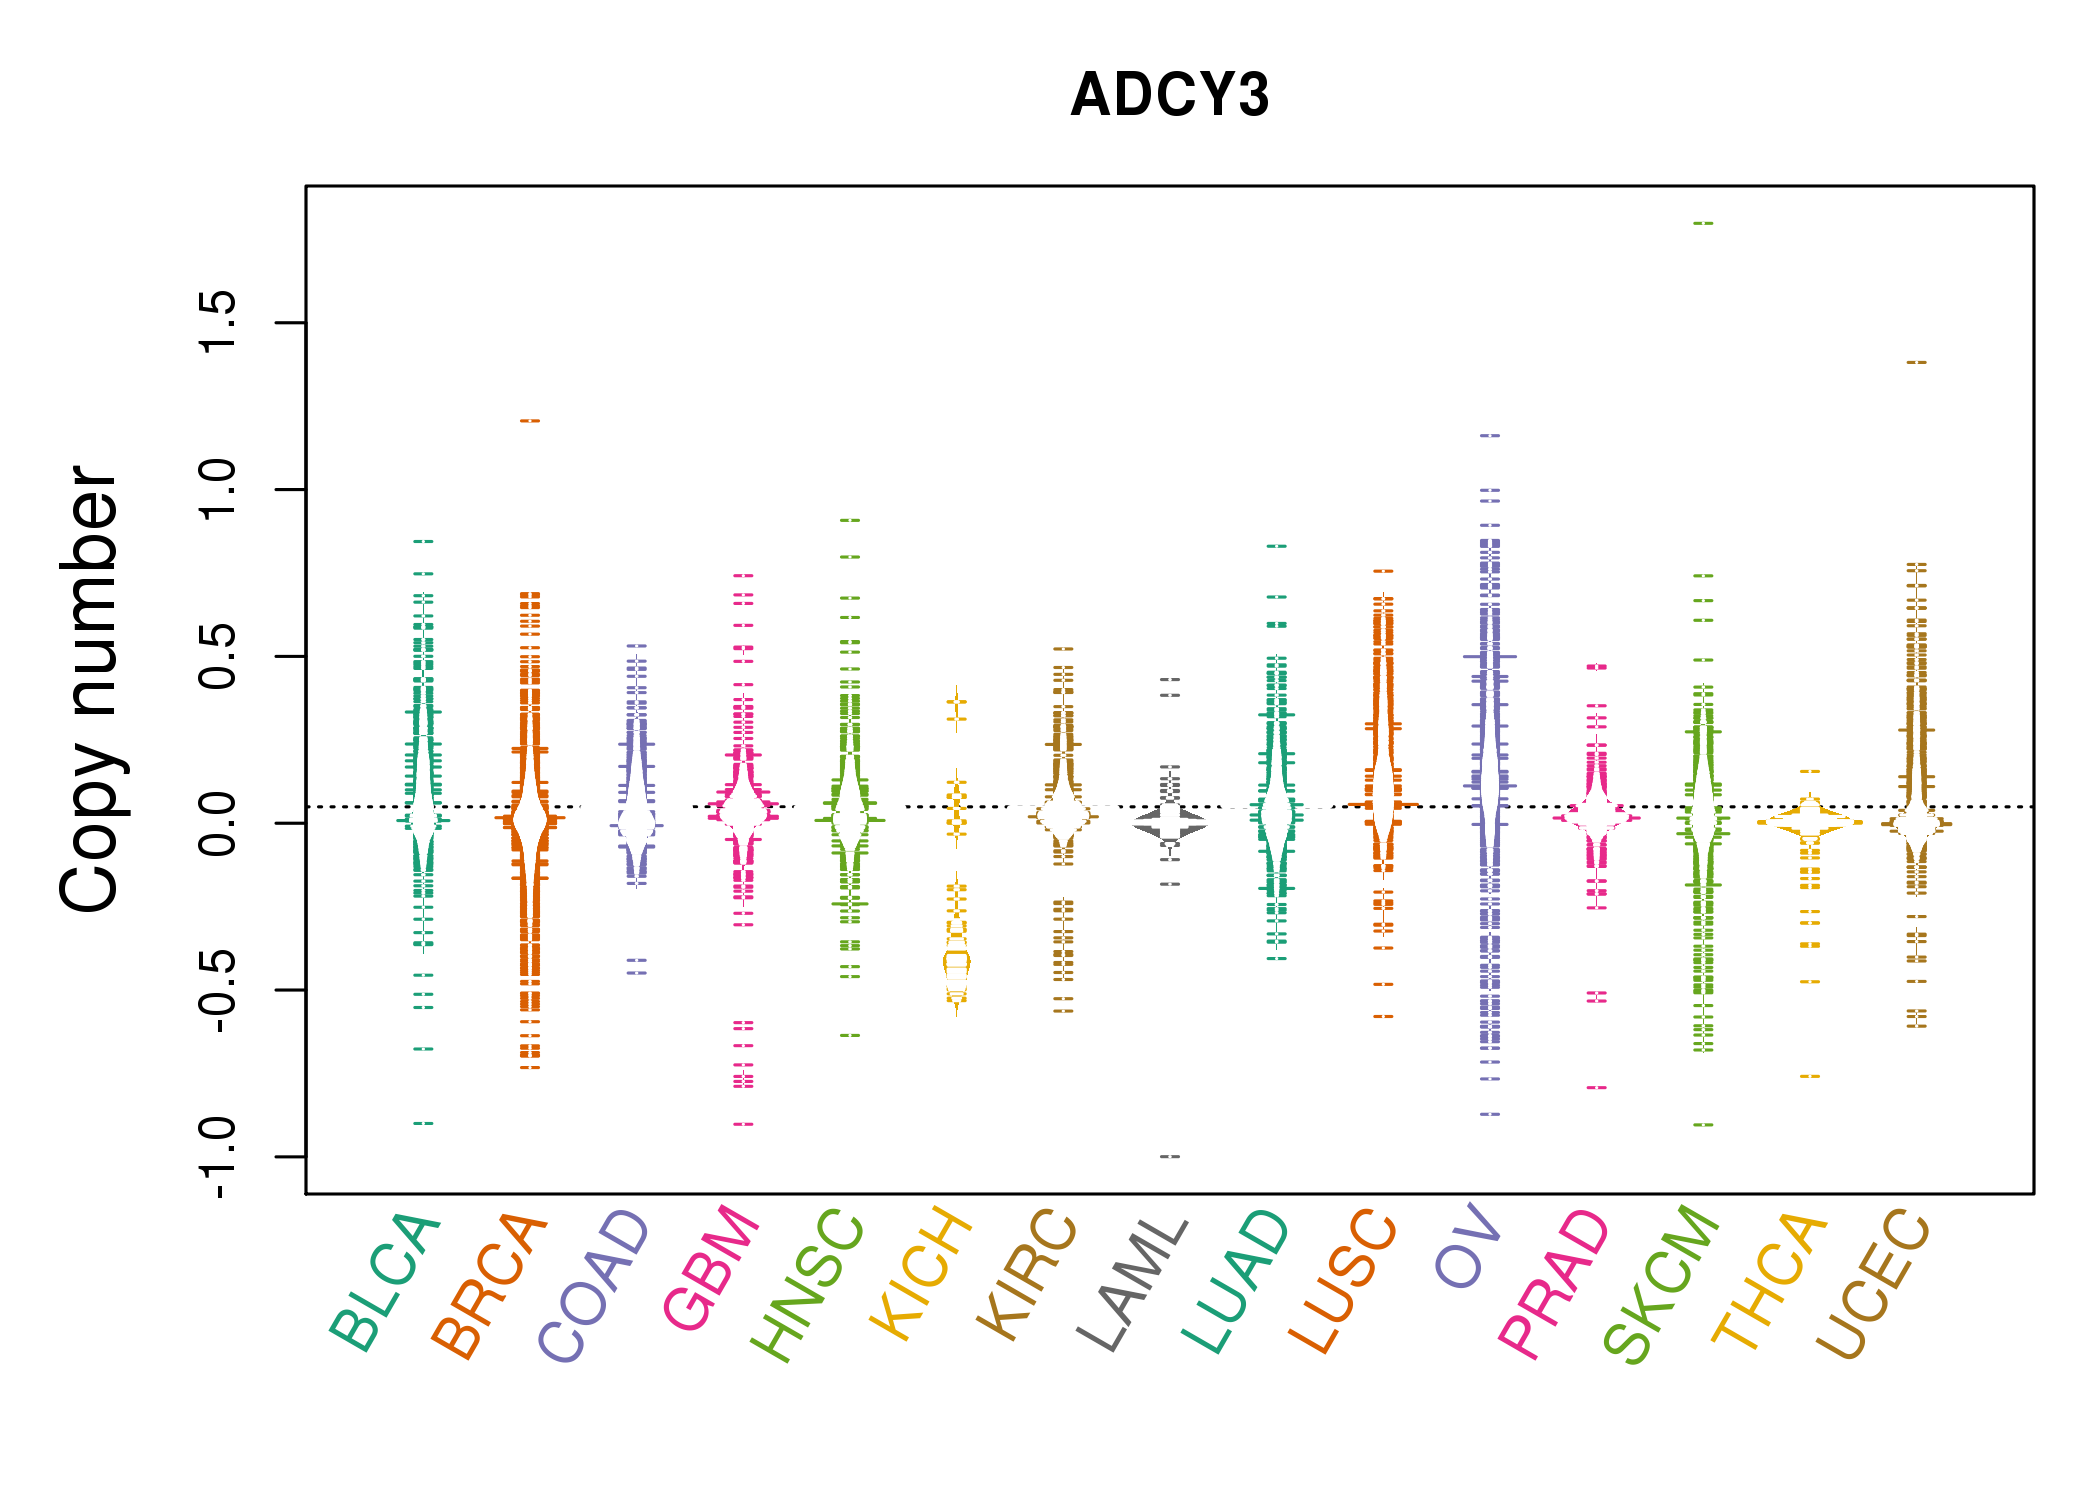 |
| cf) Tissue ID[Tissue type]: BLCA[Bladder Urothelial Carcinoma], BRCA[Breast invasive carcinoma], CESC[Cervical squamous cell carcinoma and endocervical adenocarcinoma], COAD[Colon adenocarcinoma], GBM[Glioblastoma multiforme], Glioma Low Grade, HNSC[Head and Neck squamous cell carcinoma], KICH[Kidney Chromophobe], KIRC[Kidney renal clear cell carcinoma], KIRP[Kidney renal papillary cell carcinoma], LAML[Acute Myeloid Leukemia], LUAD[Lung adenocarcinoma], LUSC[Lung squamous cell carcinoma], OV[Ovarian serous cystadenocarcinoma ], PAAD[Pancreatic adenocarcinoma], PRAD[Prostate adenocarcinoma], SKCM[Skin Cutaneous Melanoma], STAD[Stomach adenocarcinoma], THCA[Thyroid carcinoma], UCEC[Uterine Corpus Endometrial Carcinoma] |
| Top |
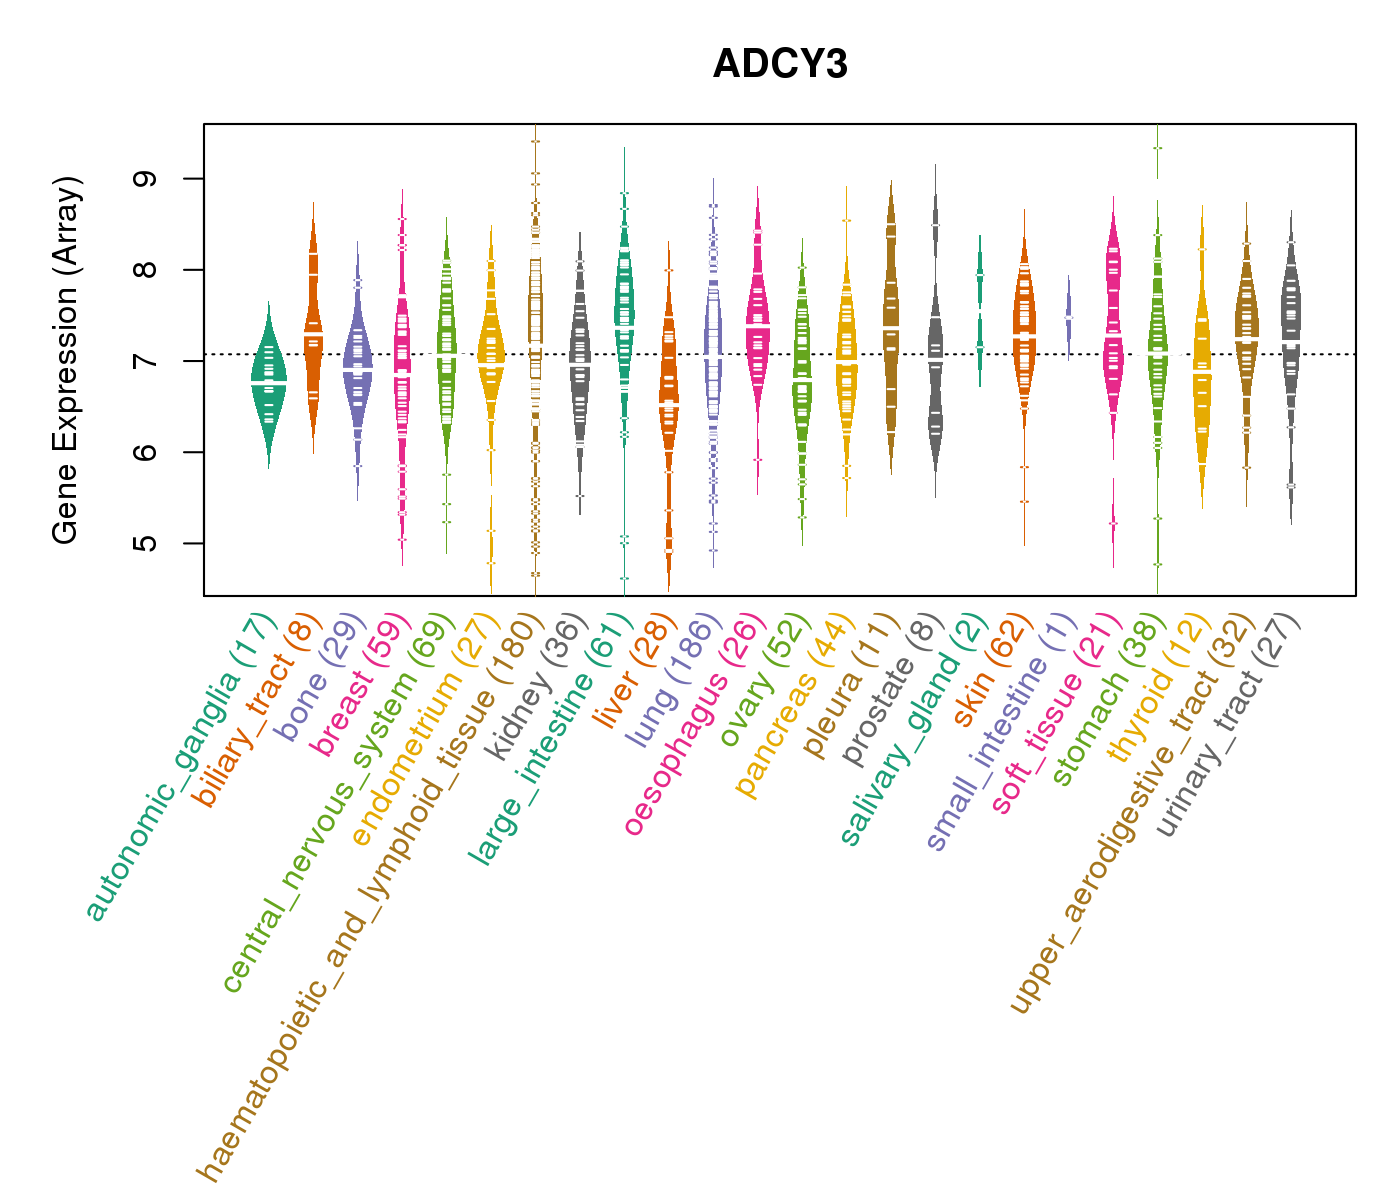
| Gene Expression for ADCY3 |
| * CCLE gene expression data were extracted from CCLE_Expression_Entrez_2012-10-18.res: Gene-centric RMA-normalized mRNA expression data. |
 |
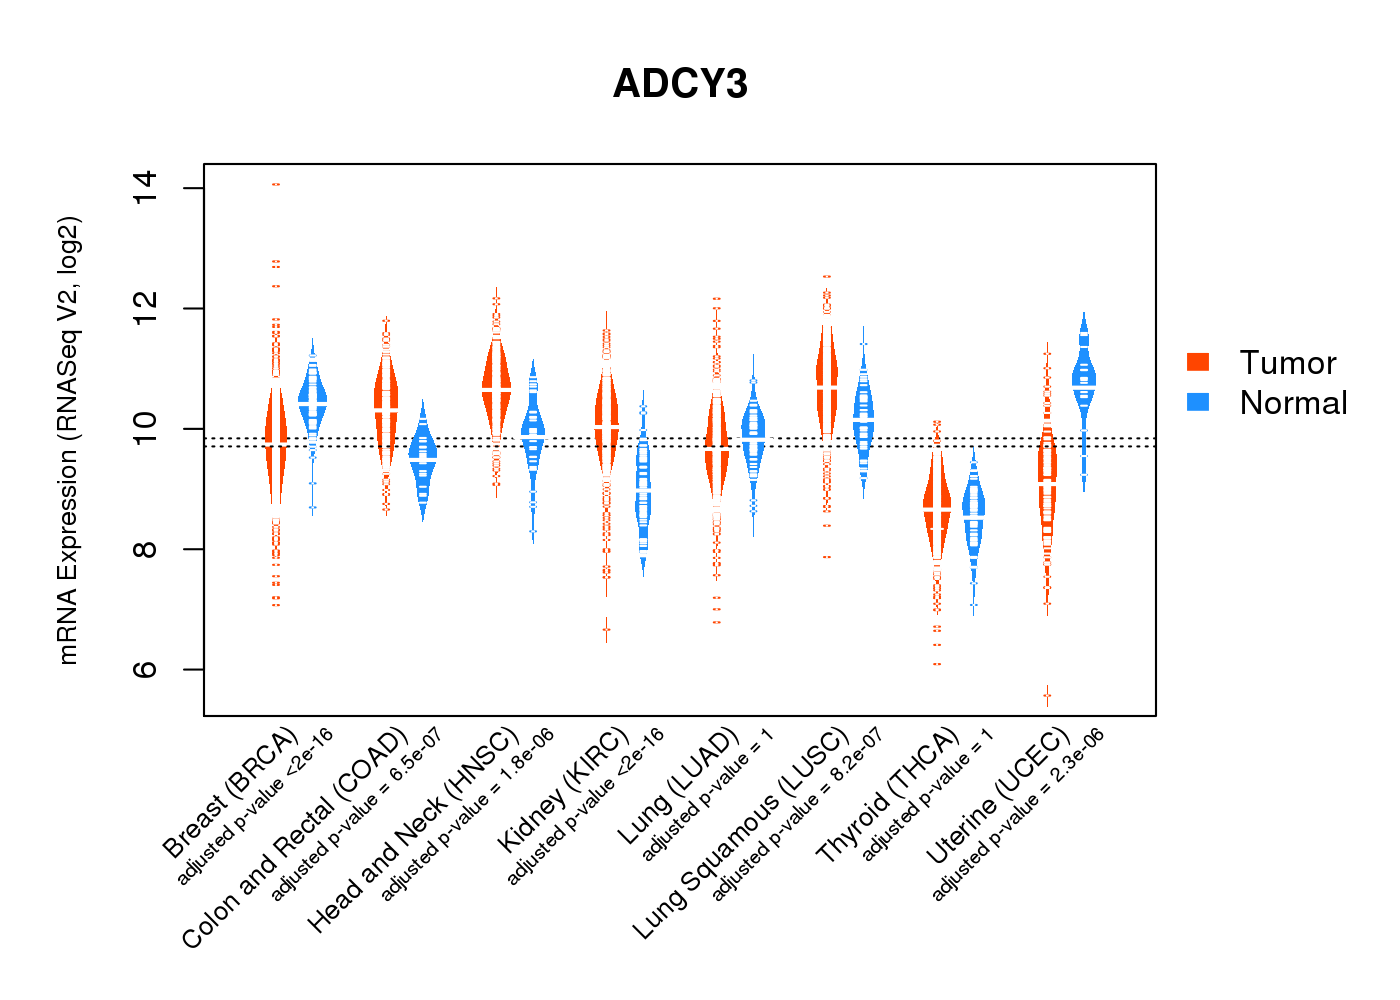
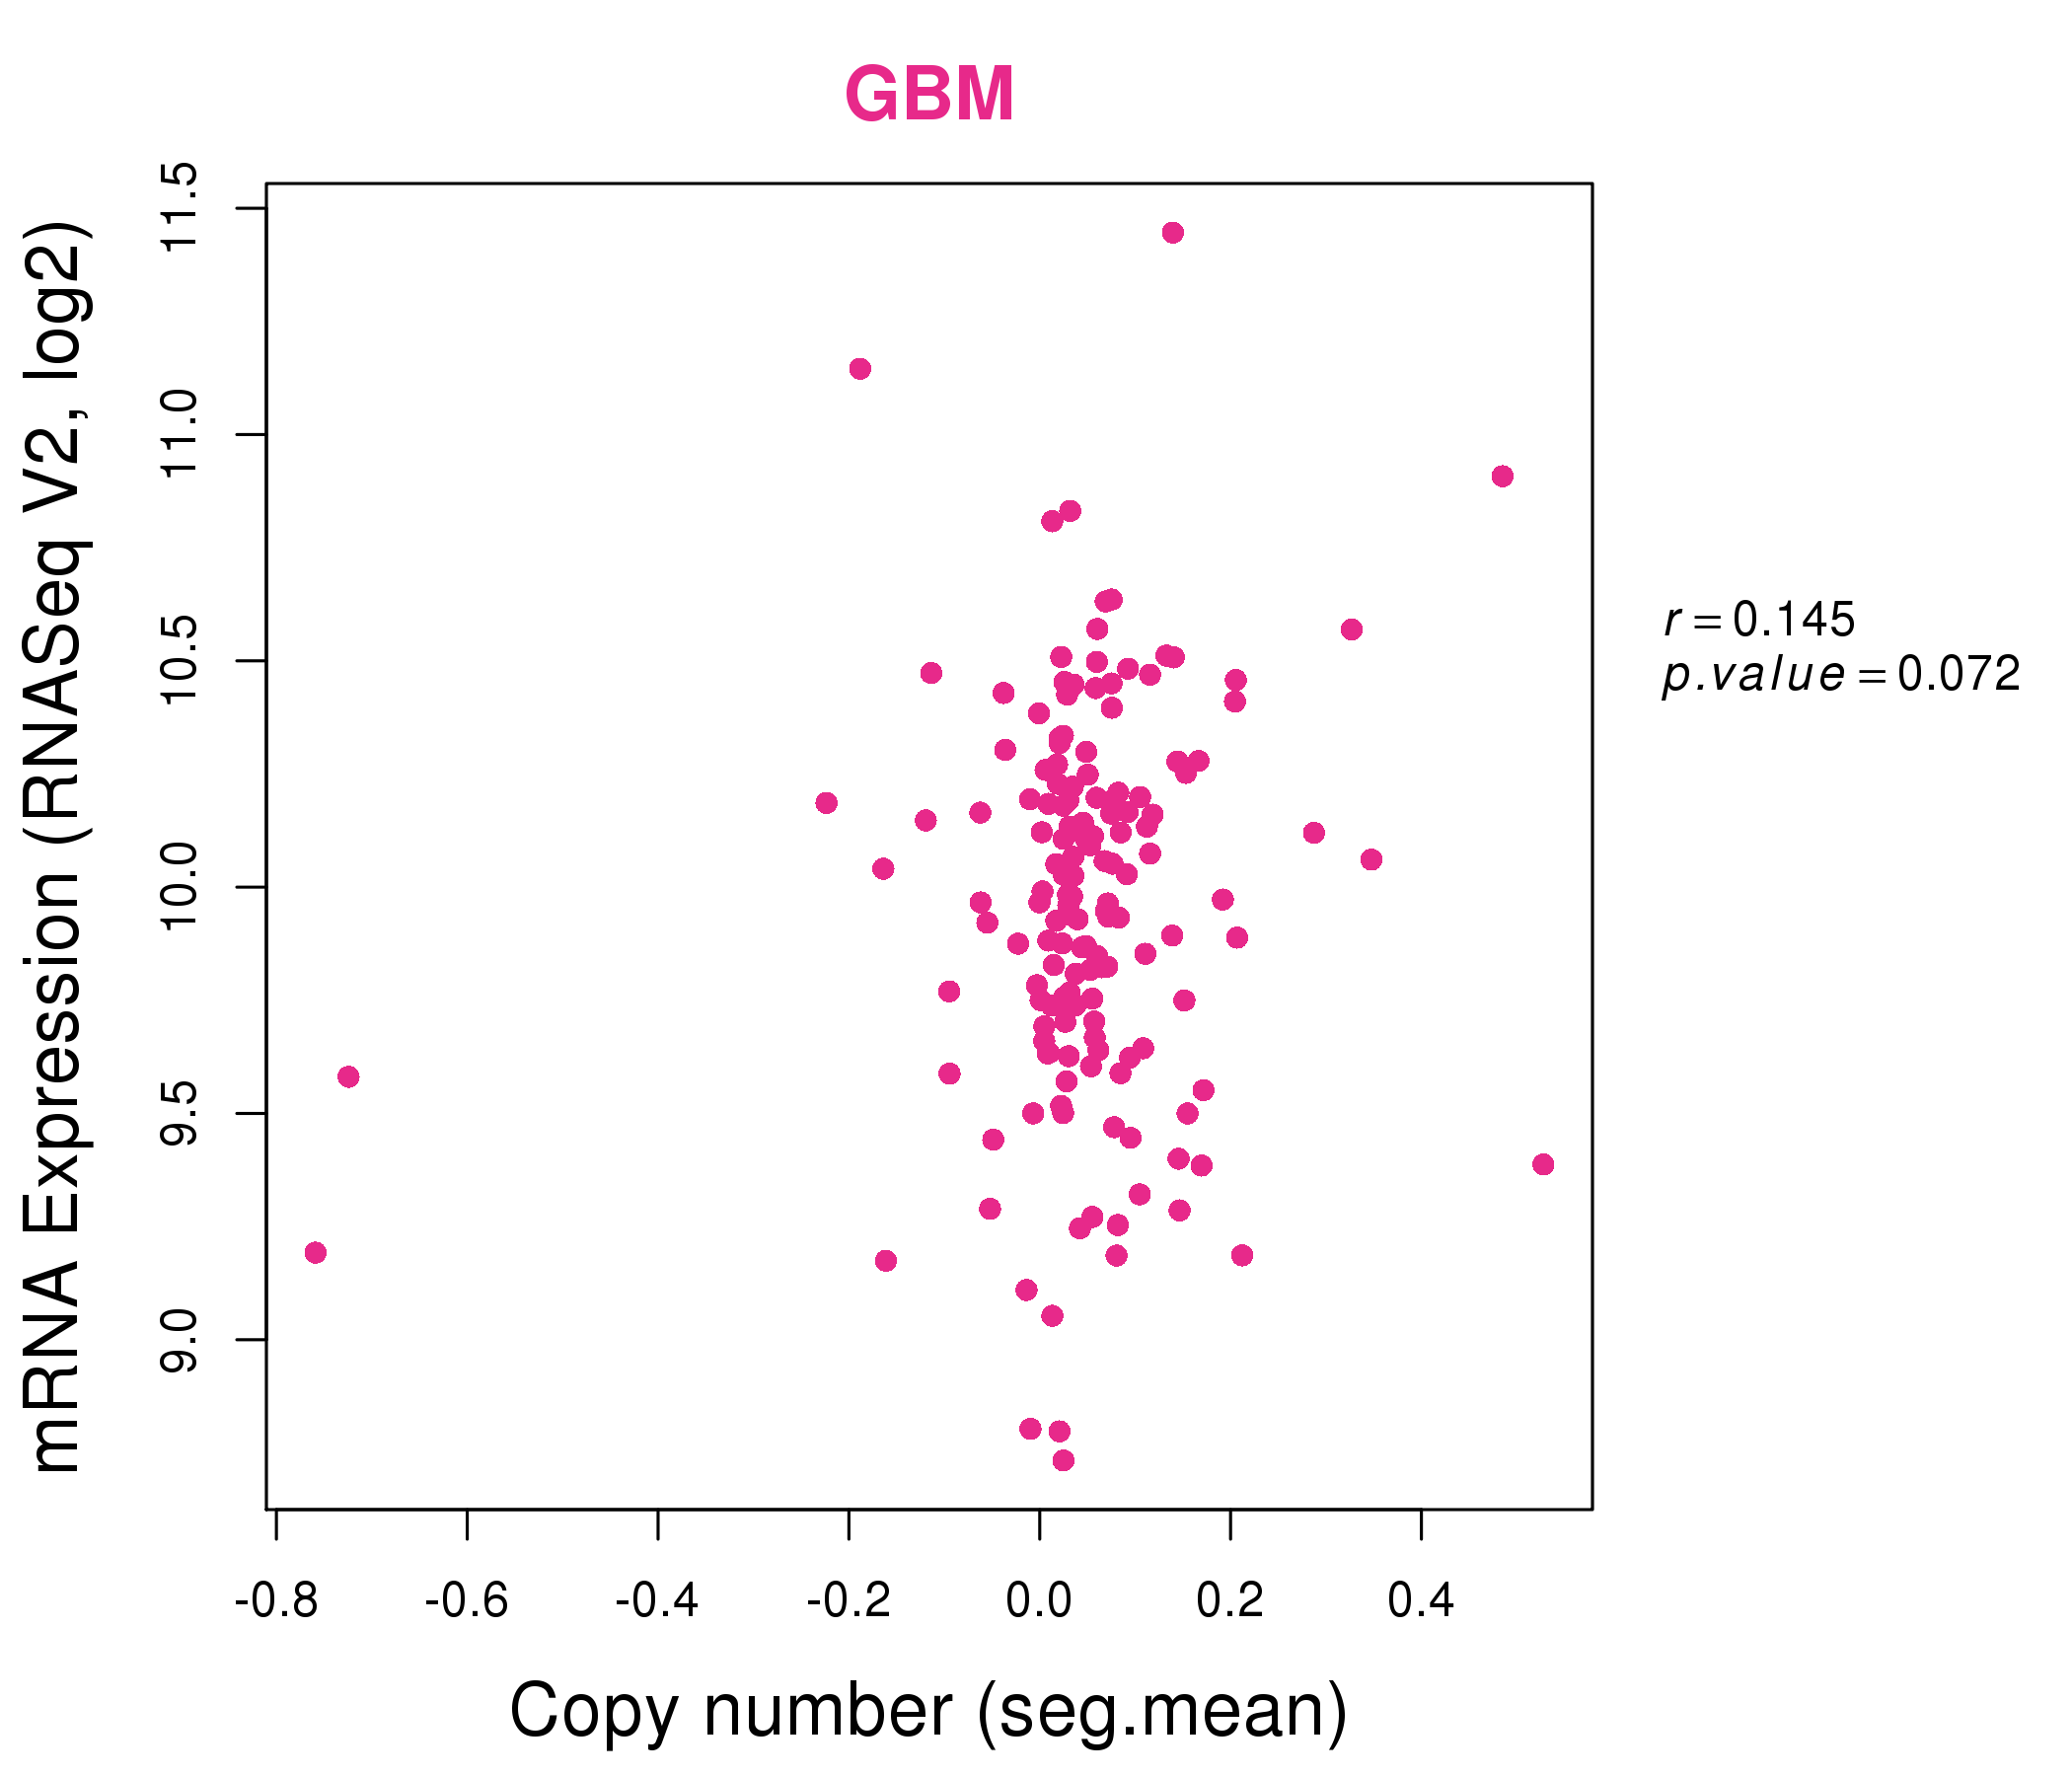
| * Normalized gene expression data of RNASeqV2 was extracted from TCGA using R package TCGA-Assembler. The URLs of all public data files on TCGA DCC data server were gathered at Jan-05-2015. Only eight cancer types have enough normal control samples for differential expression analysis. (t test, adjusted p<0.05 (using Benjamini-Hochberg FDR)) |
 |
| Top |
| * This plots show the correlation between CNV and gene expression. |
: Open all plots for all cancer types
 |
|
 |
|

| Top |
| Gene-Gene Network Information |
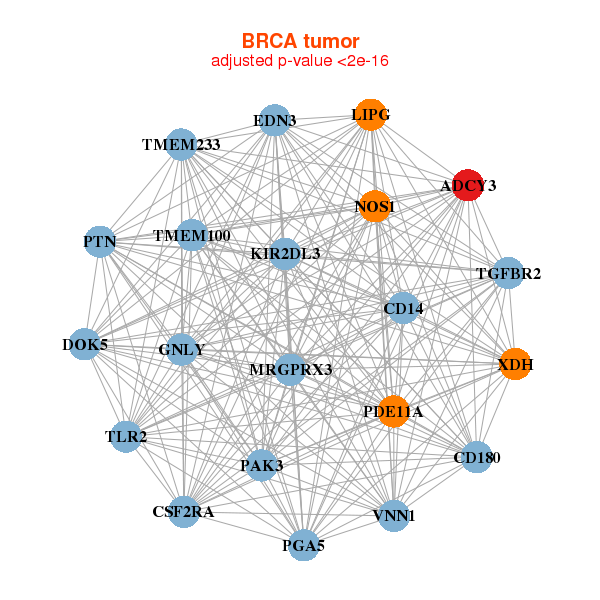
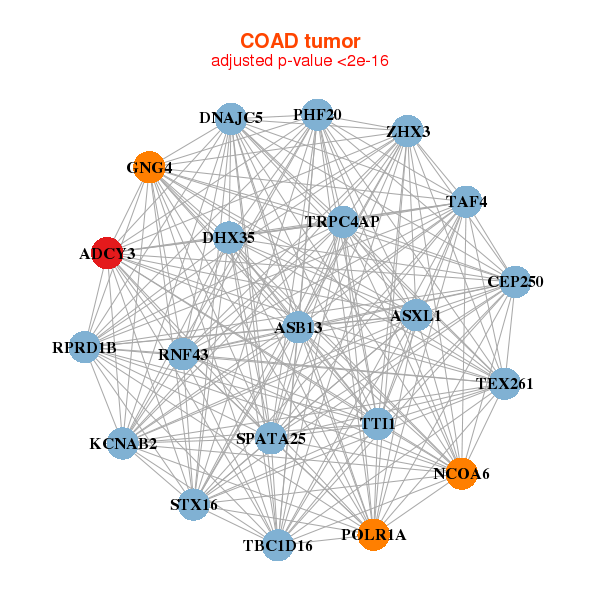
| * Co-Expression network figures were drawn using R package igraph. Only the top 20 genes with the highest correlations were shown. Red circle: input gene, orange circle: cell metabolism gene, sky circle: other gene |
: Open all plots for all cancer types
 |
| ||||
| ADCY3,CD14,CD180,CSF2RA,DOK5,EDN3,GNLY, KIR2DL3,LIPG,MRGPRX3,NOS1,PAK3,PDE11A,PGA5, PTN,TGFBR2,TLR2,TMEM100,TMEM233,VNN1,XDH | ACVRL1,ADCY3,AEBP1,BMP1,C1R,C1S,C3, CALHM2,CNTNAP1,GLIS2,GNAI2,GRK5,ITGA5,MAN1C1, MFNG,PLXND1,SYDE1,TMEM119,TMEM173,TNFRSF1A,TNFRSF1B | ||||
 |
| ||||
| ADCY3,ASB13,ASXL1,SPATA25,CEP250,DHX35,DNAJC5, GNG4,KCNAB2,TTI1,NCOA6,PHF20,POLR1A,RNF43, RPRD1B,STX16,TAF4,TBC1D16,TEX261,TRPC4AP,ZHX3 | ADCY3,ARAP3,BICD1,FAM208B,C1QTNF1,CD276,CEP135, CEP164,CEP97,DDHD1,DPY19L3,ILF3,LOC100129387,MDC1, NTRK3,NUP188,R3HDM1,RFX7,TP53BP1,UBQLN4,URB1 |
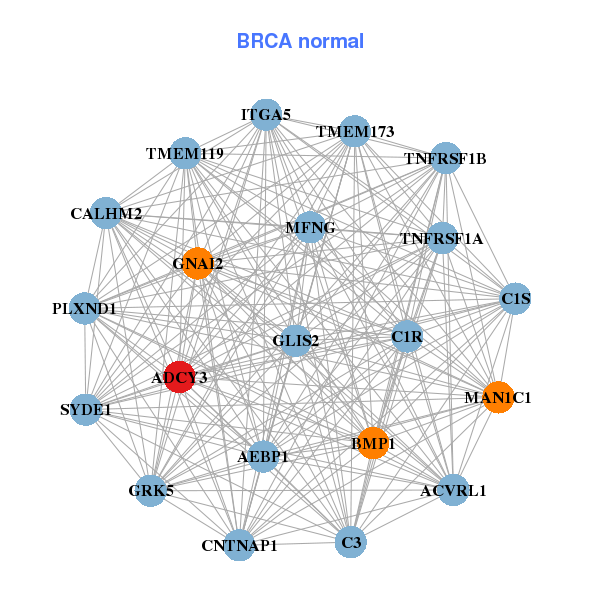
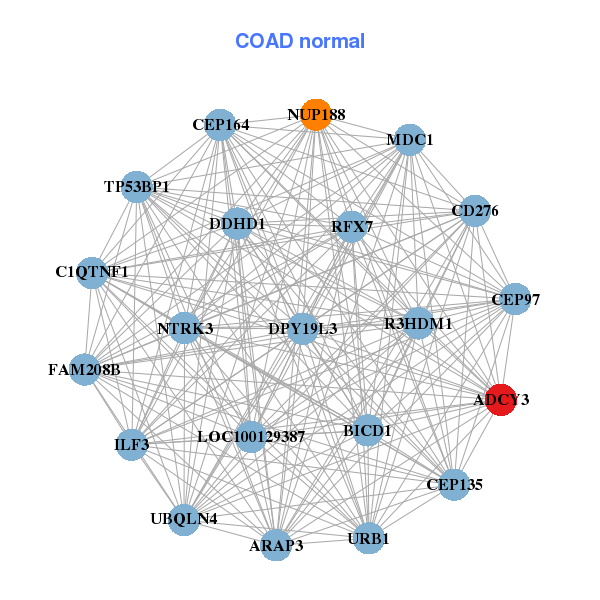
| * Co-Expression network figures were drawn using R package igraph. Only the top 20 genes with the highest correlations were shown. Red circle: input gene, orange circle: cell metabolism gene, sky circle: other gene |
: Open all plots for all cancer types
| Top |
: Open all interacting genes' information including KEGG pathway for all interacting genes from DAVID
| Top |
| Pharmacological Information for ADCY3 |
| DB Category | DB Name | DB's ID and Url link |
| Chemistry | ChEMBL | CHEMBL2097167; -. |
| Organism-specific databases | PharmGKB | PA164741137; -. |
| Organism-specific databases | CTD | 109; -. |
| * Gene Centered Interaction Network. |
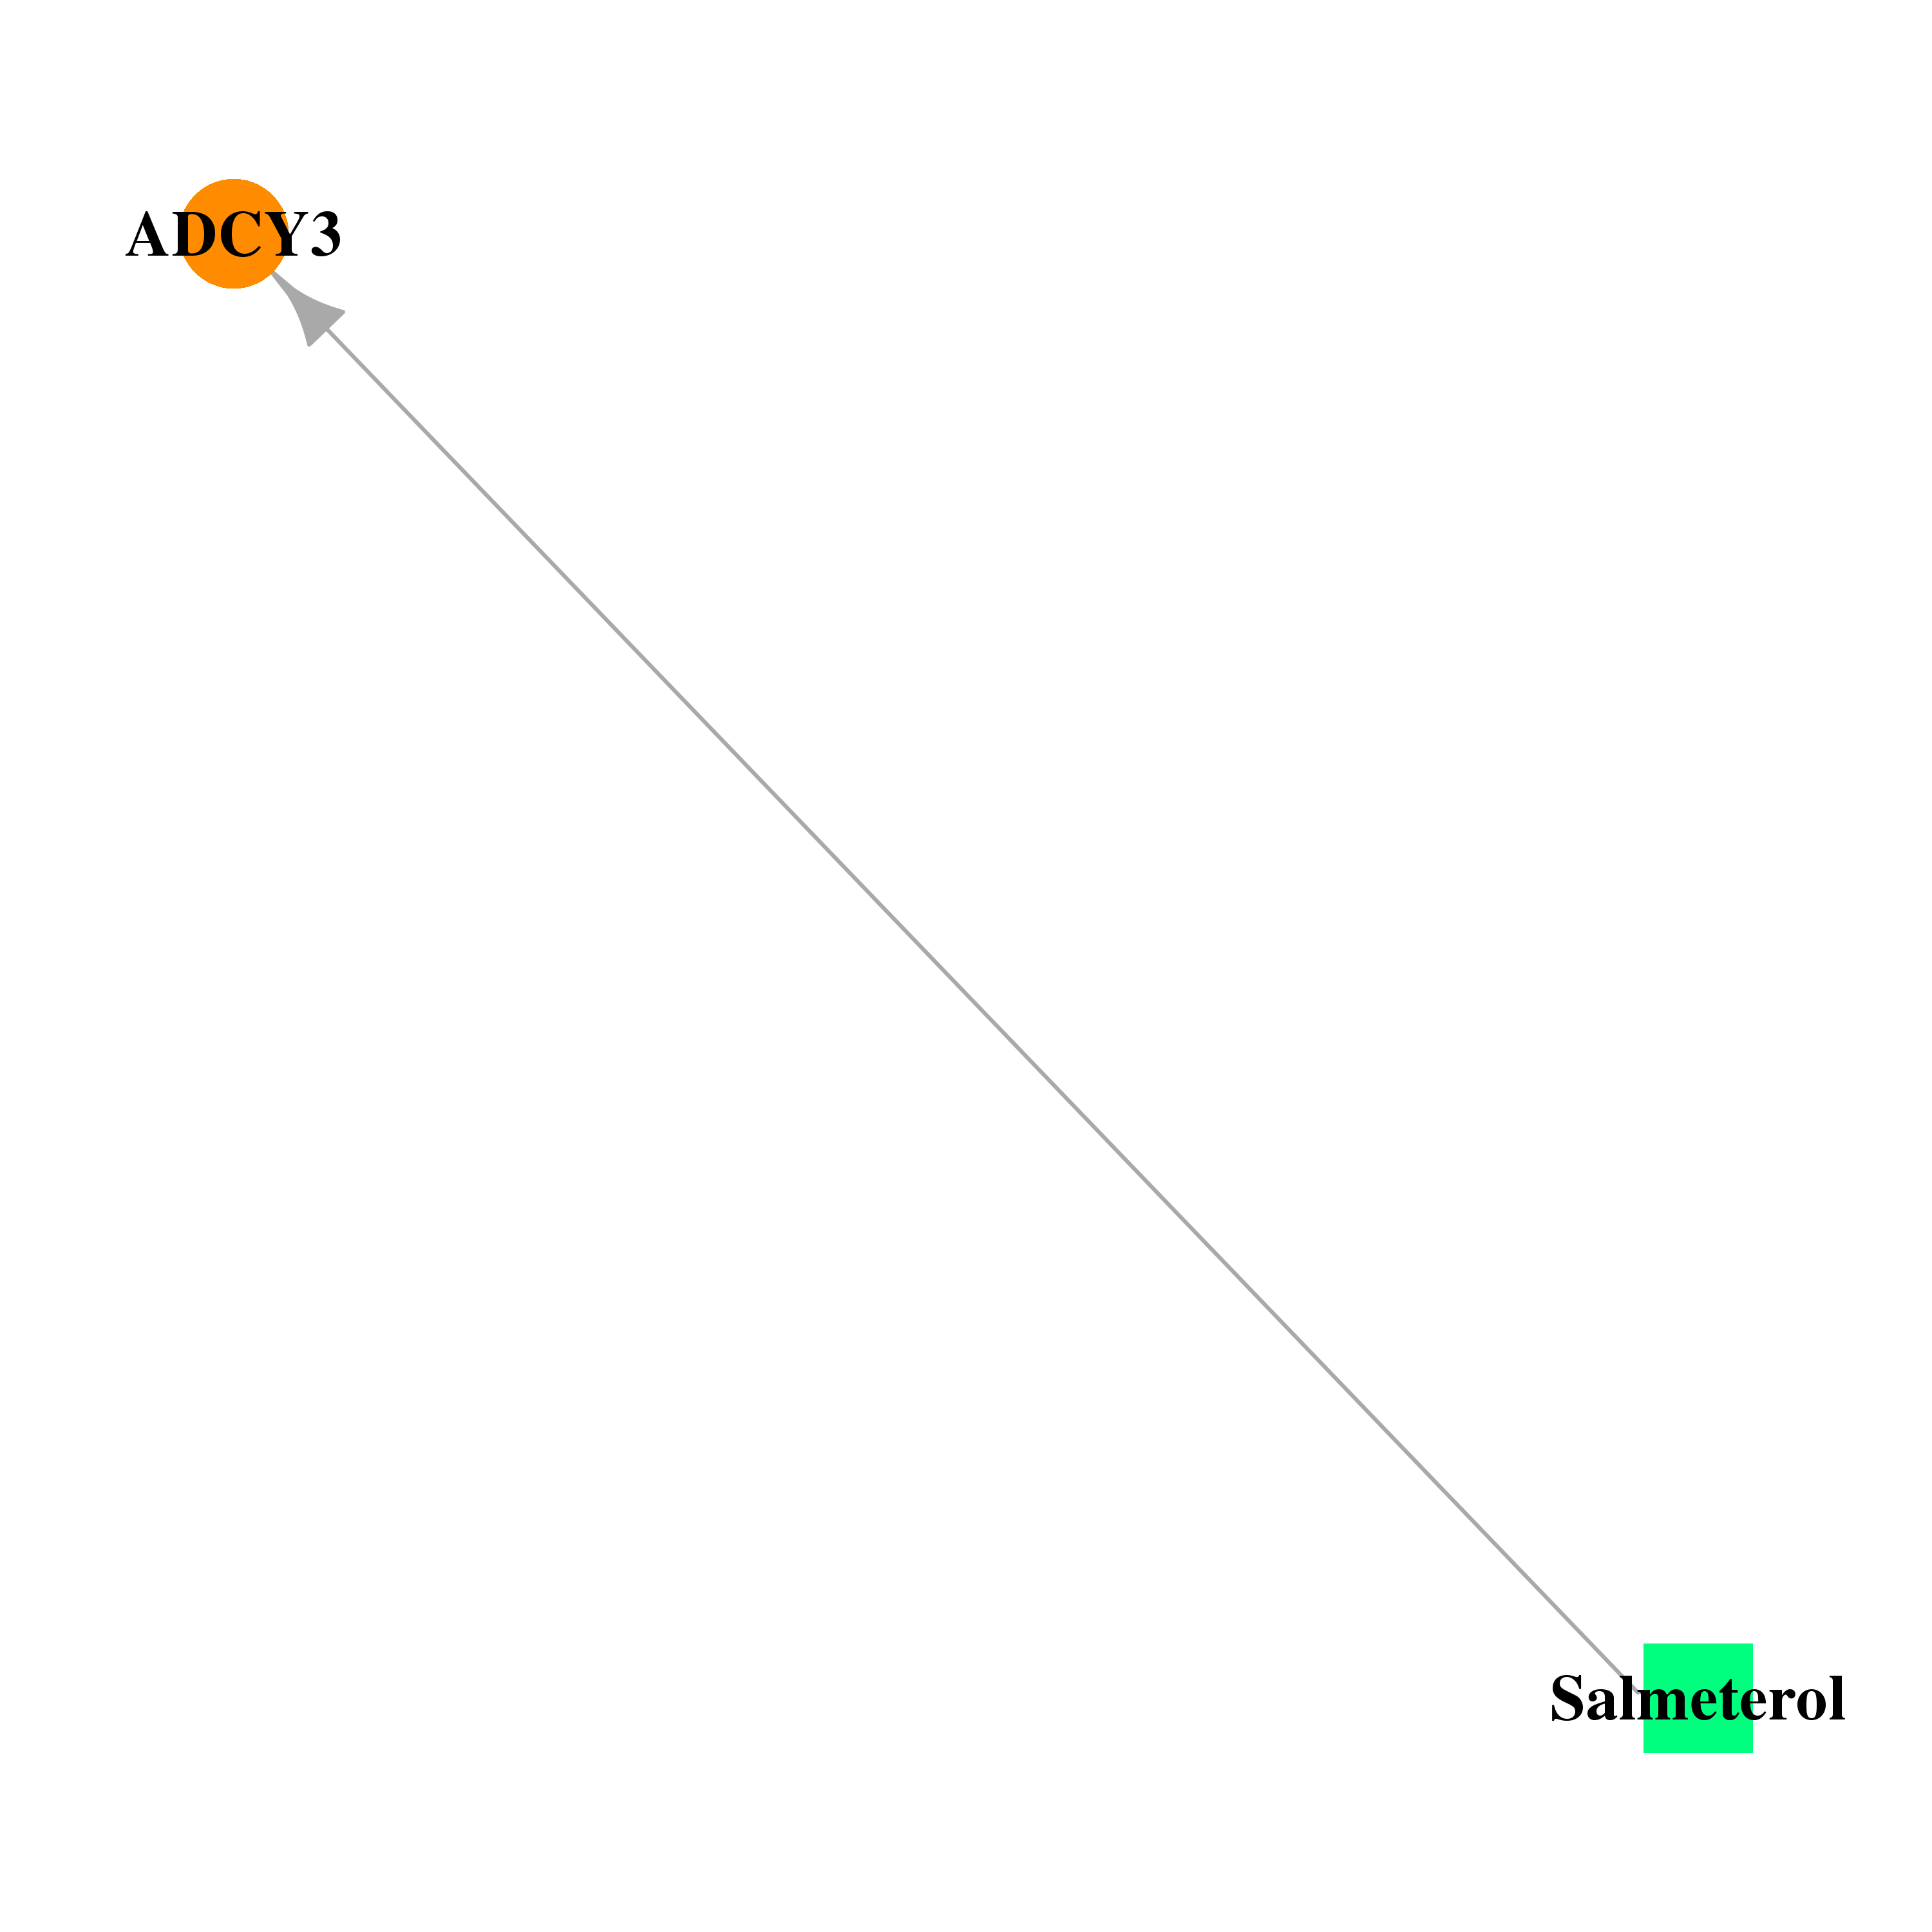 |
| * Drug Centered Interaction Network. |
| DrugBank ID | Target Name | Drug Groups | Generic Name | Drug Centered Network | Drug Structure |
| DB00938 | adenylate cyclase 3 | approved | Salmeterol | 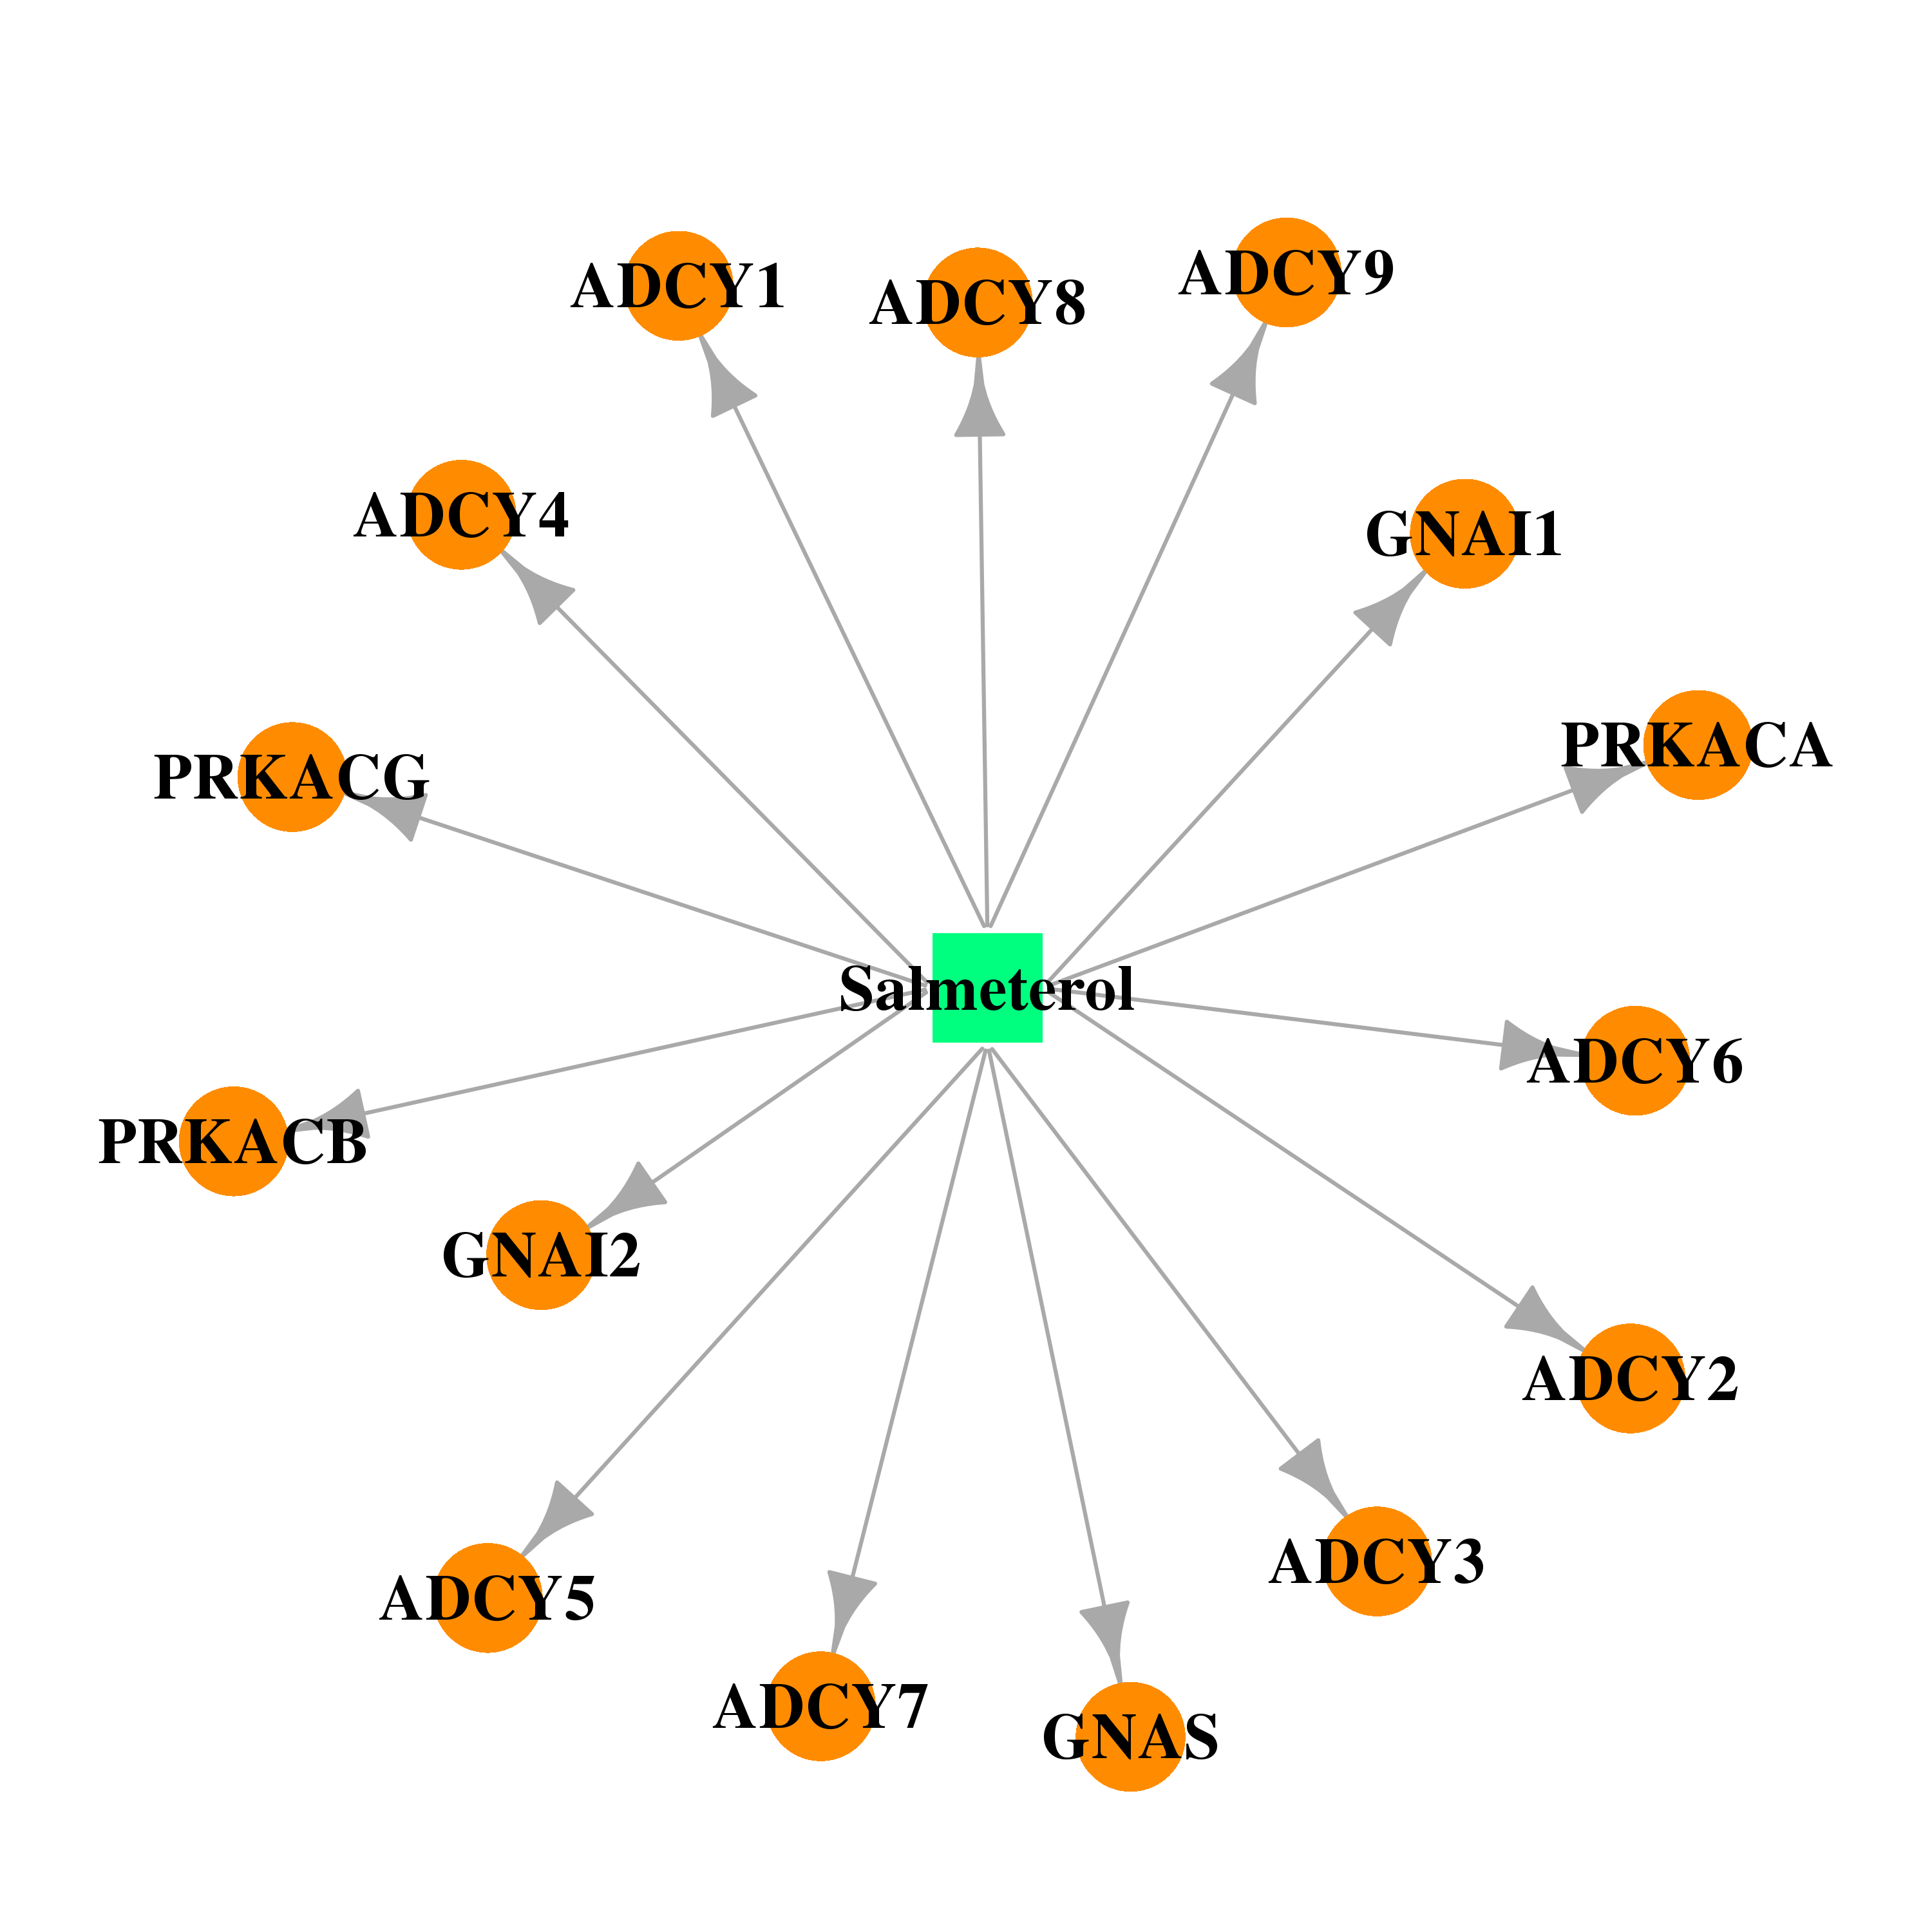 | 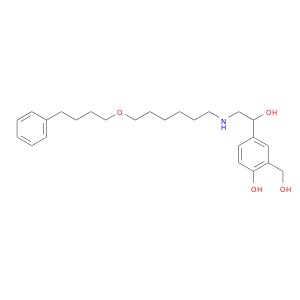 |
| Top |
| Cross referenced IDs for ADCY3 |
| * We obtained these cross-references from Uniprot database. It covers 150 different DBs, 18 categories. http://www.uniprot.org/help/cross_references_section |
: Open all cross reference information
|
Copyright © 2016-Present - The Univsersity of Texas Health Science Center at Houston @ |