|
||||||||||||||||||||||||||||||||||||||||||||||||||||||||||||||||||||||||||||||||||||||||||||||||||||||||||||||||||||||||||||||||||||||||||||||||||||||||||||||||||||||||||||||||||||||||||||||||||||||||||||||||||||||||||||||||||||||||||||||||||||||||||||||||||||||||||||||||||||||||||||||||||||||||||||||||||||||||||
| |
| Phenotypic Information (metabolism pathway, cancer, disease, phenome) |
| |
| |
| Gene-Gene Network Information: Co-Expression Network, Interacting Genes & KEGG |
| |
|


| Gene Summary for MAN1A2 |
| Top |
| Phenotypic Information for MAN1A2(metabolism pathway, cancer, disease, phenome) |
| Cancer | CGAP: MAN1A2 |
| Familial Cancer Database: MAN1A2 | |
| * This gene is included in those cancer gene databases. |
|
|
|
|
|
|
| ||||||||||||||||||||||||||||||||||||||||||||||||||||||||||||||||||||||||||||||||||||||||||||||||||||||||||||||||||||||||||||||||||||||||||||||||||||||||||||||||||||||||||||||||||||||||||||||||||||||||||||||||||||||||||||||||||||||||||||||||||||||||||||||||||||||||||||||||||||||||||||||||||||||||||||||||||||
Oncogene 1 | Significant driver gene in | |||||||||||||||||||||||||||||||||||||||||||||||||||||||||||||||||||||||||||||||||||||||||||||||||||||||||||||||||||||||||||||||||||||||||||||||||||||||||||||||||||||||||||||||||||||||||||||||||||||||||||||||||||||||||||||||||||||||||||||||||||||||||||||||||||||||||||||||||||||||||||||||||||||||||||||||||||||||||
| cf) number; DB name 1 Oncogene; http://nar.oxfordjournals.org/content/35/suppl_1/D721.long, 2 Tumor Suppressor gene; https://bioinfo.uth.edu/TSGene/, 3 Cancer Gene Census; http://www.nature.com/nrc/journal/v4/n3/abs/nrc1299.html, 4 CancerGenes; http://nar.oxfordjournals.org/content/35/suppl_1/D721.long, 5 Network of Cancer Gene; http://ncg.kcl.ac.uk/index.php, 1Therapeutic Vulnerabilities in Cancer; http://cbio.mskcc.org/cancergenomics/statius/ |
| REACTOME_METABOLISM_OF_PROTEINS | |
| OMIM | |
| Orphanet | |
| Disease | KEGG Disease: MAN1A2 |
| MedGen: MAN1A2 (Human Medical Genetics with Condition) | |
| ClinVar: MAN1A2 | |
| Phenotype | MGI: MAN1A2 (International Mouse Phenotyping Consortium) |
| PhenomicDB: MAN1A2 | |
| Mutations for MAN1A2 |
| * Under tables are showing count per each tissue to give us broad intuition about tissue specific mutation patterns.You can go to the detailed page for each mutation database's web site. |
| - Statistics for Tissue and Mutation type | Top |
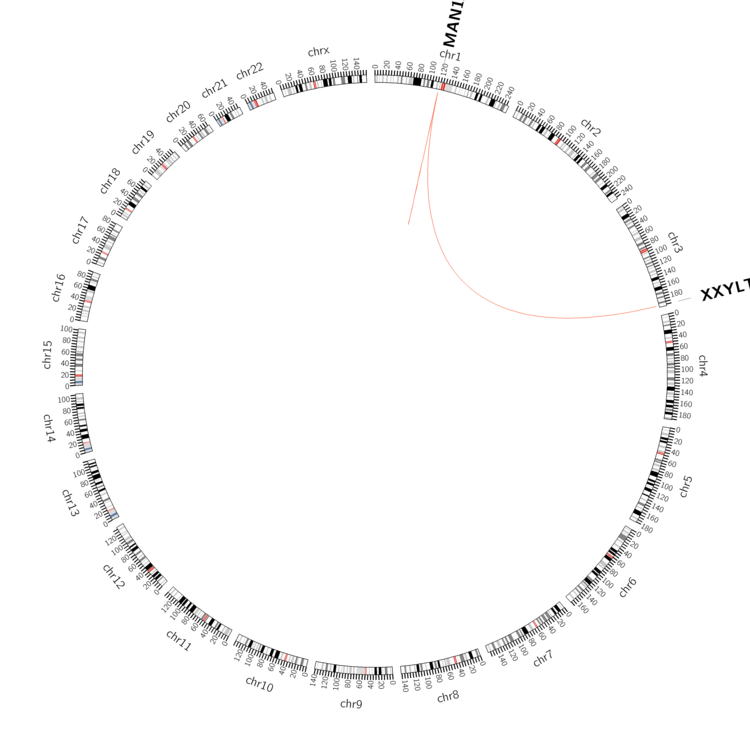 |
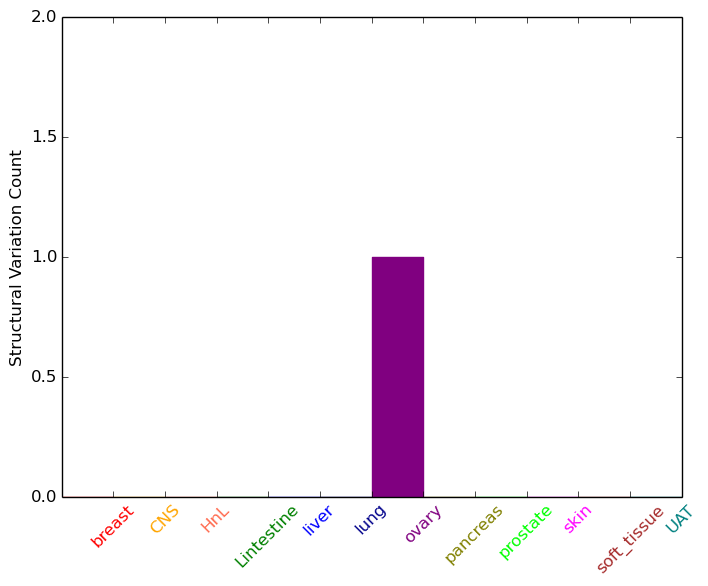
| - For Inter-chromosomal Variations |
| * Inter-chromosomal variantions includes 'interchromosomal amplicon to amplicon', 'interchromosomal amplicon to non-amplified dna', 'interchromosomal insertion', 'Interchromosomal unknown type'. |
 |
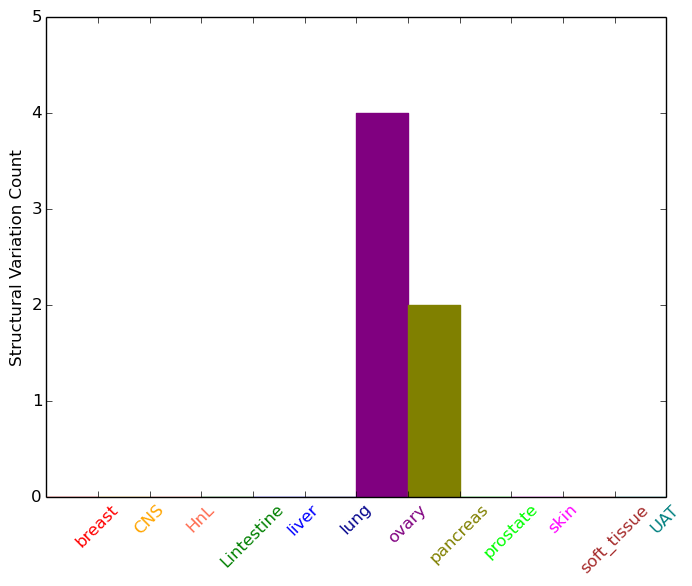
| - For Intra-chromosomal Variations |
| * Intra-chromosomal variantions includes 'intrachromosomal amplicon to amplicon', 'intrachromosomal amplicon to non-amplified dna', 'intrachromosomal deletion', 'intrachromosomal fold-back inversion', 'intrachromosomal inversion', 'intrachromosomal tandem duplication', 'Intrachromosomal unknown type', 'intrachromosomal with inverted orientation', 'intrachromosomal with non-inverted orientation'. |
 |
| Sample | Symbol_a | Chr_a | Start_a | End_a | Symbol_b | Chr_b | Start_b | End_b |
| ovary | MAN1A2 | chr1 | 117937101 | 117937121 | MAN1A2 | chr1 | 117957567 | 117957587 |
| ovary | MAN1A2 | chr1 | 118034766 | 118034786 | MAN1A2 | chr1 | 118023660 | 118023680 |
| ovary | MAN1A2 | chr1 | 118062491 | 118062511 | MAN1A2 | chr1 | 118011584 | 118011604 |
| ovary | MAN1A2 | chr1 | 118066481 | 118066501 | XXYLT1 | chr3 | 194883928 | 194883948 |
| pancreas | MAN1A2 | chr1 | 118016991 | 118017011 | MAN1A2 | chr1 | 118017044 | 118017064 |
| pancreas | MAN1A2 | chr1 | 118041255 | 118041275 | MAN1A2 | chr1 | 118043647 | 118043667 |
| cf) Tissue number; Tissue name (1;Breast, 2;Central_nervous_system, 3;Haematopoietic_and_lymphoid_tissue, 4;Large_intestine, 5;Liver, 6;Lung, 7;Ovary, 8;Pancreas, 9;Prostate, 10;Skin, 11;Soft_tissue, 12;Upper_aerodigestive_tract) |
| * From mRNA Sanger sequences, Chitars2.0 arranged chimeric transcripts. This table shows MAN1A2 related fusion information. |
| ID | Head Gene | Tail Gene | Accession | Gene_a | qStart_a | qEnd_a | Chromosome_a | tStart_a | tEnd_a | Gene_a | qStart_a | qEnd_a | Chromosome_a | tStart_a | tEnd_a |
| AW801968 | MAN1A2 | 1 | 126 | 1 | 117944806 | 117944931 | MAN1A2 | 124 | 200 | 1 | 117963196 | 117963272 | |
| AA668350 | MAN1A2 | 1 | 206 | 1 | 117944806 | 117945011 | MAN1A2 | 204 | 410 | 1 | 117957327 | 117963272 | |
| AK023308 | MAN1A2 | 1 | 1417 | 1 | 117910565 | 118042028 | KIAA2018 | 1412 | 2371 | 3 | 113374275 | 113375234 | |
| AA730065 | MAN1A2 | 36 | 426 | 1 | 117944971 | 117963272 | GYPC | 416 | 435 | 2 | 127452947 | 127452966 | |
| AI768882 | MAN1A2 | 1 | 58 | 1 | 117944806 | 117944863 | MAN1A2 | 56 | 242 | 1 | 117957349 | 117963272 | |
| BE832742 | MAN1A2 | 1 | 227 | 1 | 117948242 | 117963272 | MAN1A2 | 225 | 289 | 1 | 117944806 | 117945074 | |
| BF354622 | DST | 30 | 154 | 6 | 56329531 | 56329656 | MAN1A2 | 146 | 352 | 1 | 117950895 | 117951099 | |
| BG000012 | EML2 | 8 | 193 | 19 | 46128976 | 46129161 | MAN1A2 | 182 | 400 | 1 | 117986828 | 117987045 | |
| AA368655 | MAN1A2 | 1 | 99 | 1 | 117910980 | 117911078 | ZYX | 98 | 296 | 7 | 143087669 | 143087867 | |
| BU859918 | MAN1A2 | 28 | 50 | 1 | 117953465 | 117953492 | LONP1 | 34 | 792 | 19 | 5691845 | 5693781 | |
| BE832754 | MAN1A2 | 26 | 226 | 1 | 117957334 | 117963272 | MAN1A2 | 224 | 288 | 1 | 117944806 | 117945074 | |
| BC004934 | LONP1 | 1 | 1752 | 19 | 5691845 | 5705823 | MAN1A2 | 1736 | 1758 | 1 | 117953465 | 117953492 | |
| DW434893 | MAN1A2 | 17 | 104 | 1 | 117957367 | 117957454 | MAN1A2 | 103 | 206 | 1 | 117944807 | 117944910 | |
| AW894933 | MAN1A2 | 4 | 186 | 1 | 117944806 | 117944987 | MAN1A2 | 184 | 366 | 1 | 117957353 | 117963272 | |
| Top |
| Mutation type/ Tissue ID | brca | cns | cerv | endome | haematopo | kidn | Lintest | liver | lung | ns | ovary | pancre | prost | skin | stoma | thyro | urina | |||
| Total # sample | 3 | 2 | 2 | 4 | 1 | 1 | 2 | 1 | ||||||||||||
| GAIN (# sample) | 3 | 2 | 1 | 4 | 1 | 1 | 2 | 1 | ||||||||||||
| LOSS (# sample) | 1 |
| cf) Tissue ID; Tissue type (1; Breast, 2; Central_nervous_system, 3; Cervix, 4; Endometrium, 5; Haematopoietic_and_lymphoid_tissue, 6; Kidney, 7; Large_intestine, 8; Liver, 9; Lung, 10; NS, 11; Ovary, 12; Pancreas, 13; Prostate, 14; Skin, 15; Stomach, 16; Thyroid, 17; Urinary_tract) |
| Top |
|
 |
| Top |
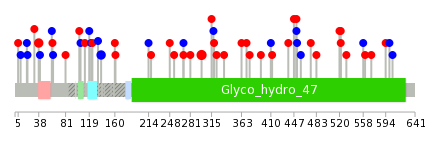
| Stat. for Non-Synonymous SNVs (# total SNVs=38) | (# total SNVs=16) |
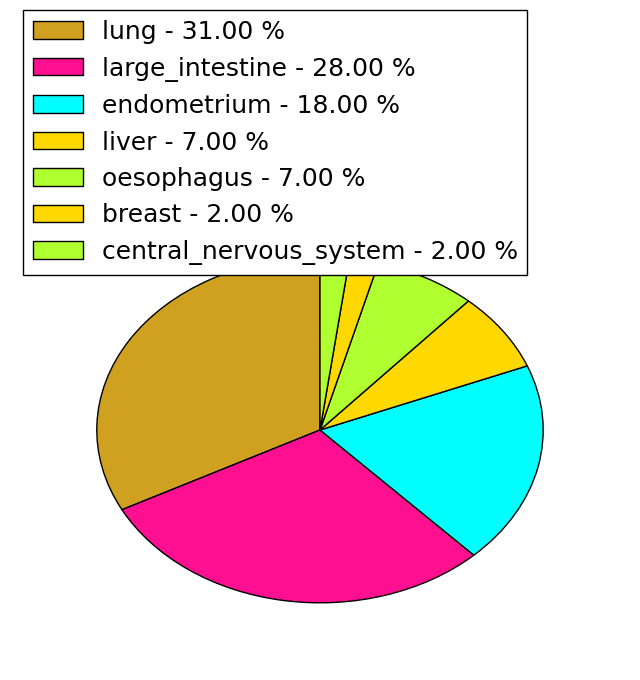 | 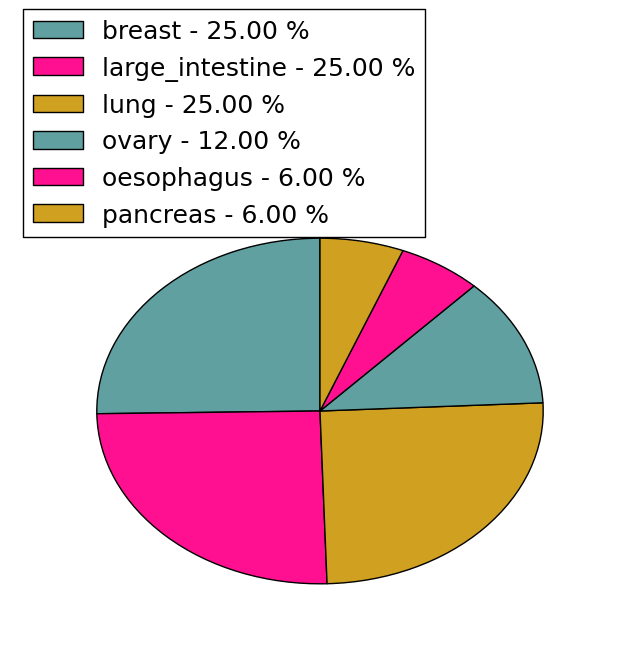 |
(# total SNVs=0) | (# total SNVs=0) |
| Top |
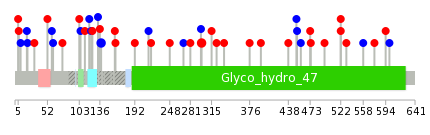
| * When you move the cursor on each content, you can see more deailed mutation information on the Tooltip. Those are primary_site,primary_histology,mutation(aa),pubmedID. |
| GRCh37 position | Mutation(aa) | Unique sampleID count |
| chr1:117944839-117944839 | p.R112* | 3 |
| chr1:117984892-117984892 | p.L299F | 3 |
| chr1:117944941-117944941 | p.Q146* | 2 |
| chr1:117984948-117984948 | p.? | 2 |
| chr1:117910917-117910917 | p.I38V | 2 |
| chr1:117944905-117944905 | p.R134* | 2 |
| chr1:118042153-118042153 | p.Q552* | 2 |
| chr1:117944919-117944919 | p.Q138Q | 2 |
| chr1:118009007-118009007 | p.Y376H | 1 |
| chr1:117911046-117911046 | p.G81S | 1 |
| Top |
|
 |
| Point Mutation/ Tissue ID | 1 | 2 | 3 | 4 | 5 | 6 | 7 | 8 | 9 | 10 | 11 | 12 | 13 | 14 | 15 | 16 | 17 | 18 | 19 | 20 |
| # sample | 4 | 3 | 1 | 8 | 1 | 10 | 4 | 2 | 3 | 6 | 5 | |||||||||
| # mutation | 4 | 3 | 1 | 8 | 1 | 13 | 4 | 2 | 2 | 6 | 5 | |||||||||
| nonsynonymous SNV | 2 | 1 | 4 | 10 | 4 | 1 | 3 | 5 | ||||||||||||
| synonymous SNV | 2 | 3 | 4 | 1 | 3 | 2 | 1 | 3 |
| cf) Tissue ID; Tissue type (1; BLCA[Bladder Urothelial Carcinoma], 2; BRCA[Breast invasive carcinoma], 3; CESC[Cervical squamous cell carcinoma and endocervical adenocarcinoma], 4; COAD[Colon adenocarcinoma], 5; GBM[Glioblastoma multiforme], 6; Glioma Low Grade, 7; HNSC[Head and Neck squamous cell carcinoma], 8; KICH[Kidney Chromophobe], 9; KIRC[Kidney renal clear cell carcinoma], 10; KIRP[Kidney renal papillary cell carcinoma], 11; LAML[Acute Myeloid Leukemia], 12; LUAD[Lung adenocarcinoma], 13; LUSC[Lung squamous cell carcinoma], 14; OV[Ovarian serous cystadenocarcinoma ], 15; PAAD[Pancreatic adenocarcinoma], 16; PRAD[Prostate adenocarcinoma], 17; SKCM[Skin Cutaneous Melanoma], 18:STAD[Stomach adenocarcinoma], 19:THCA[Thyroid carcinoma], 20:UCEC[Uterine Corpus Endometrial Carcinoma]) |
| Top |
| * We represented just top 10 SNVs. When you move the cursor on each content, you can see more deailed mutation information on the Tooltip. Those are primary_site, primary_histology, mutation(aa), pubmedID. |
| Genomic Position | Mutation(aa) | Unique sampleID count |
| chr1:117984892 | p.Q138Q | 2 |
| chr1:117944919 | p.L299F | 2 |
| chr1:118042064 | p.E335K | 1 |
| chr1:117944812 | p.L600L | 1 |
| chr1:117948187 | p.E124Q | 1 |
| chr1:118009007 | p.Y376H | 1 |
| chr1:117910819 | p.A5V | 1 |
| chr1:118042090 | p.I133I | 1 |
| chr1:117944820 | p.V394F | 1 |
| chr1:117948254 | p.L6M | 1 |
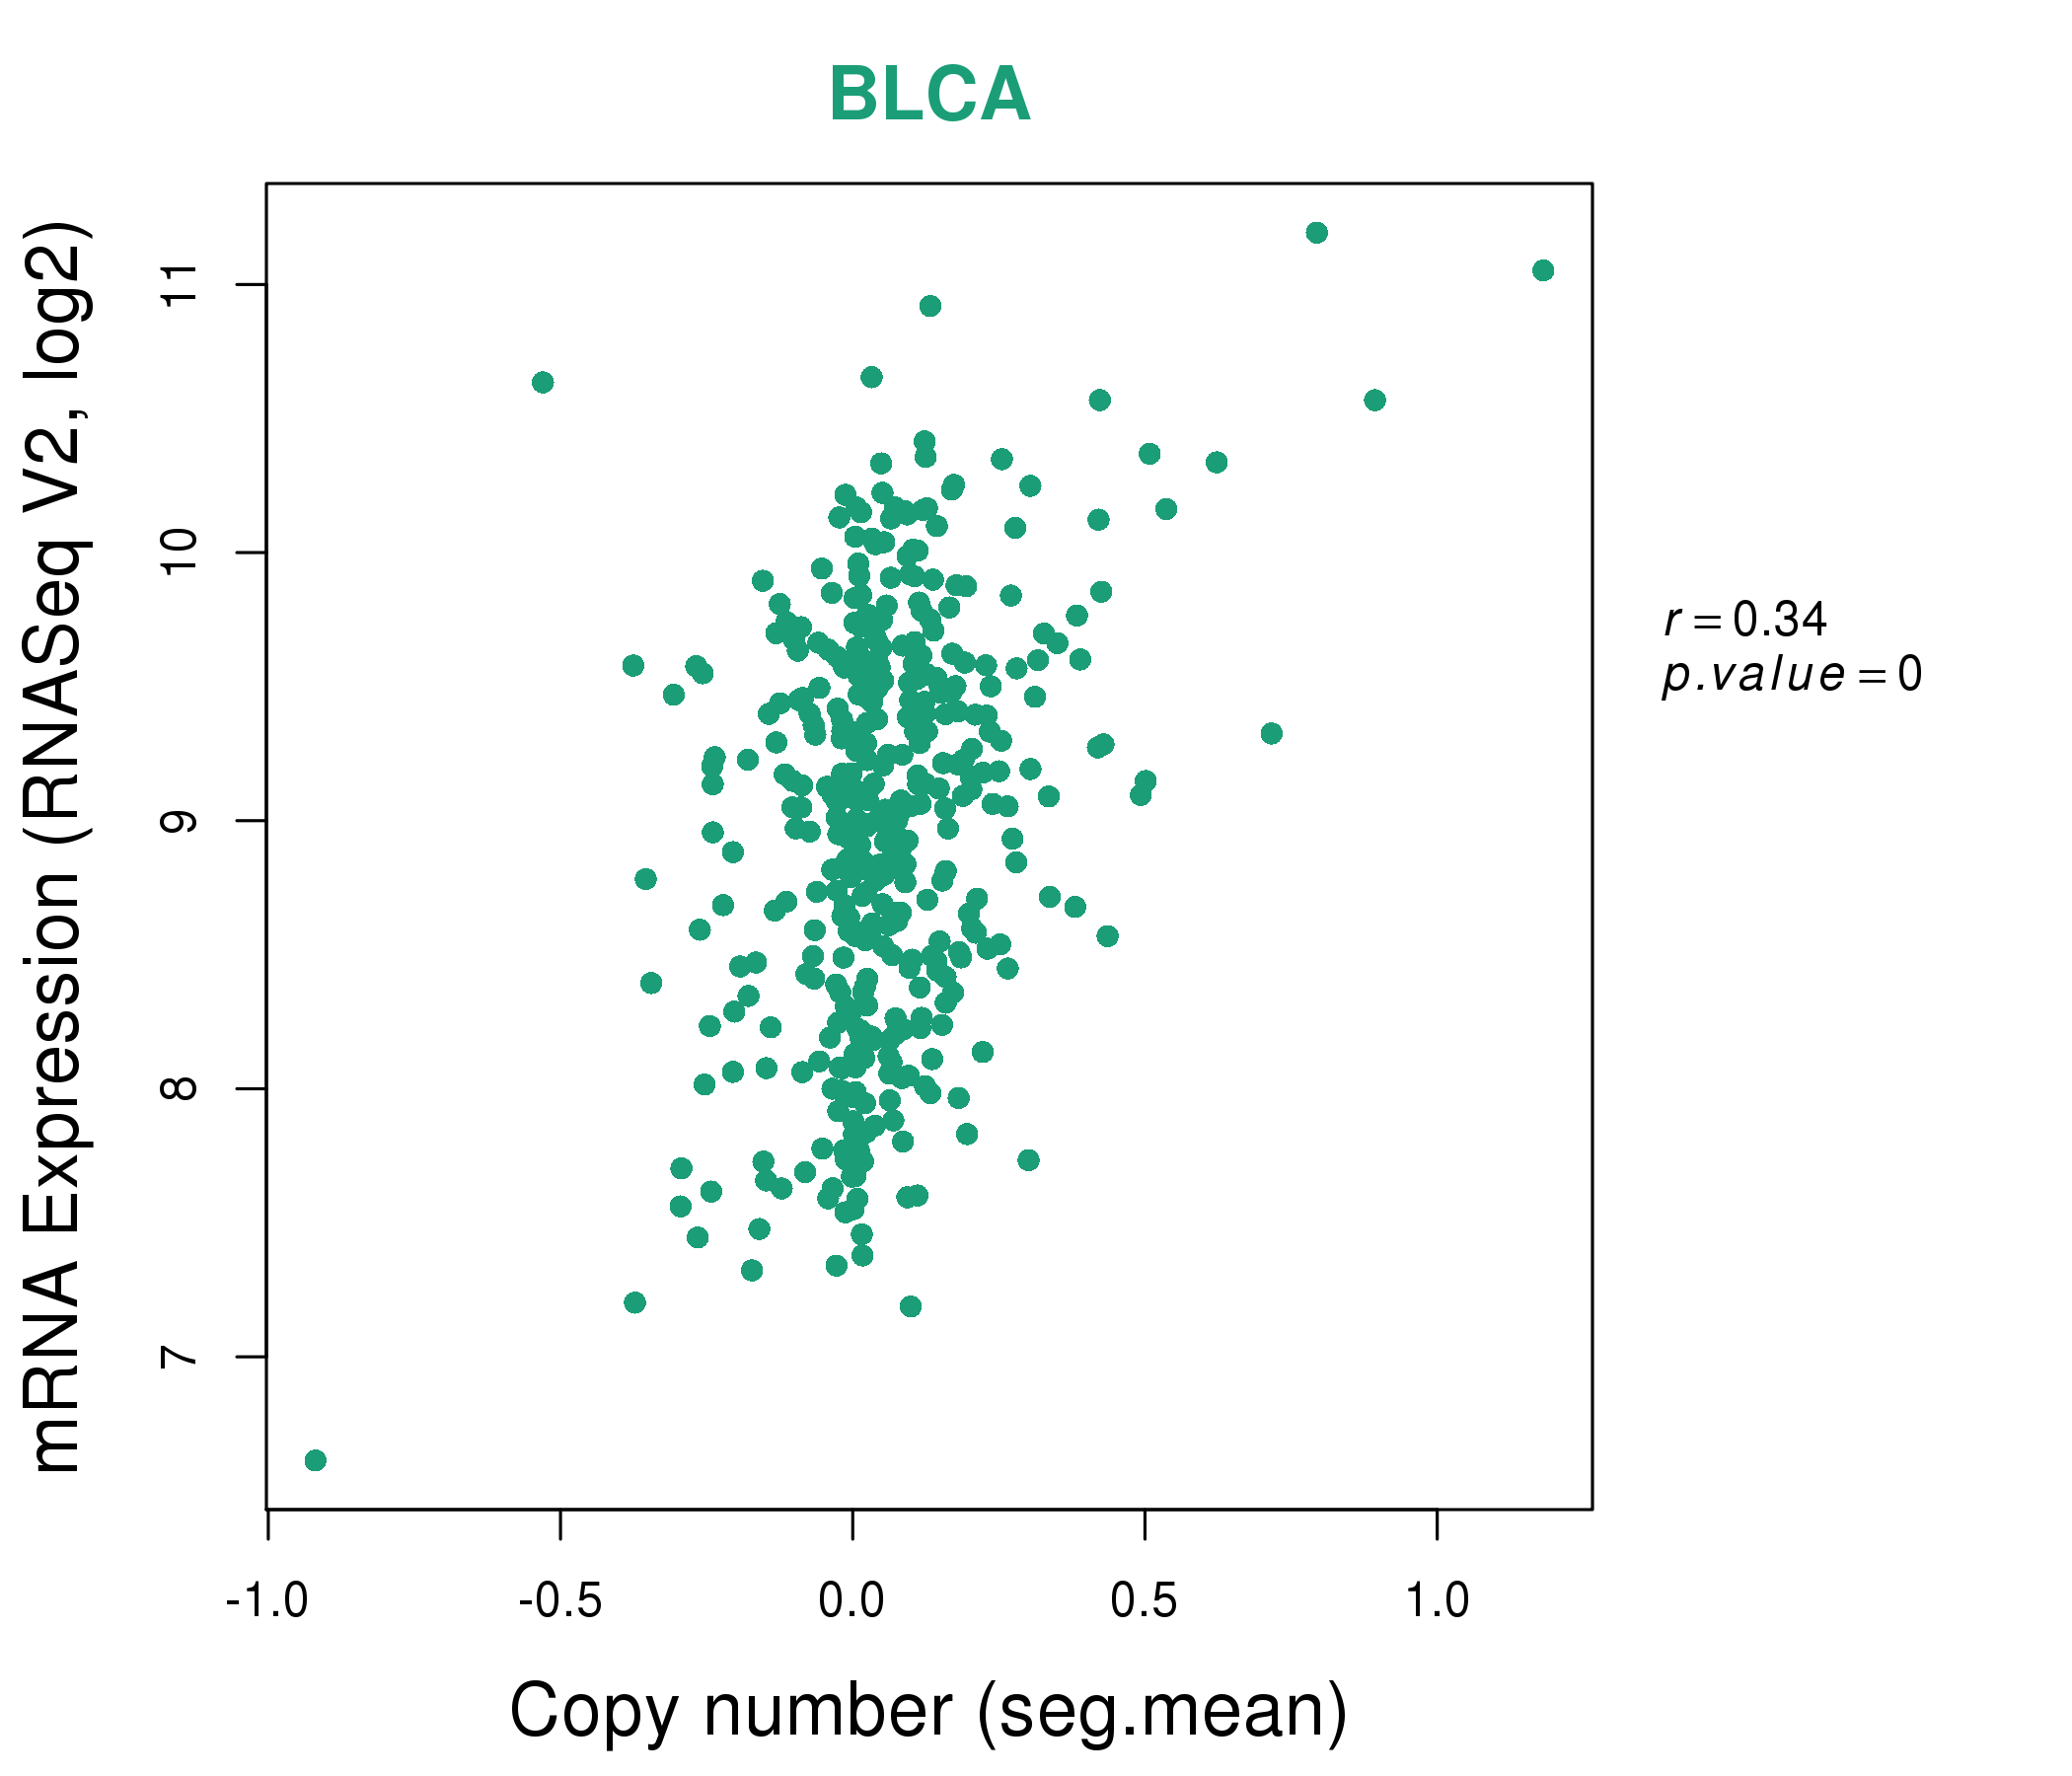
| * Copy number data were extracted from TCGA using R package TCGA-Assembler. The URLs of all public data files on TCGA DCC data server were gathered on Jan-05-2015. Function ProcessCNAData in TCGA-Assembler package was used to obtain gene-level copy number value which is calculated as the average copy number of the genomic region of a gene. |
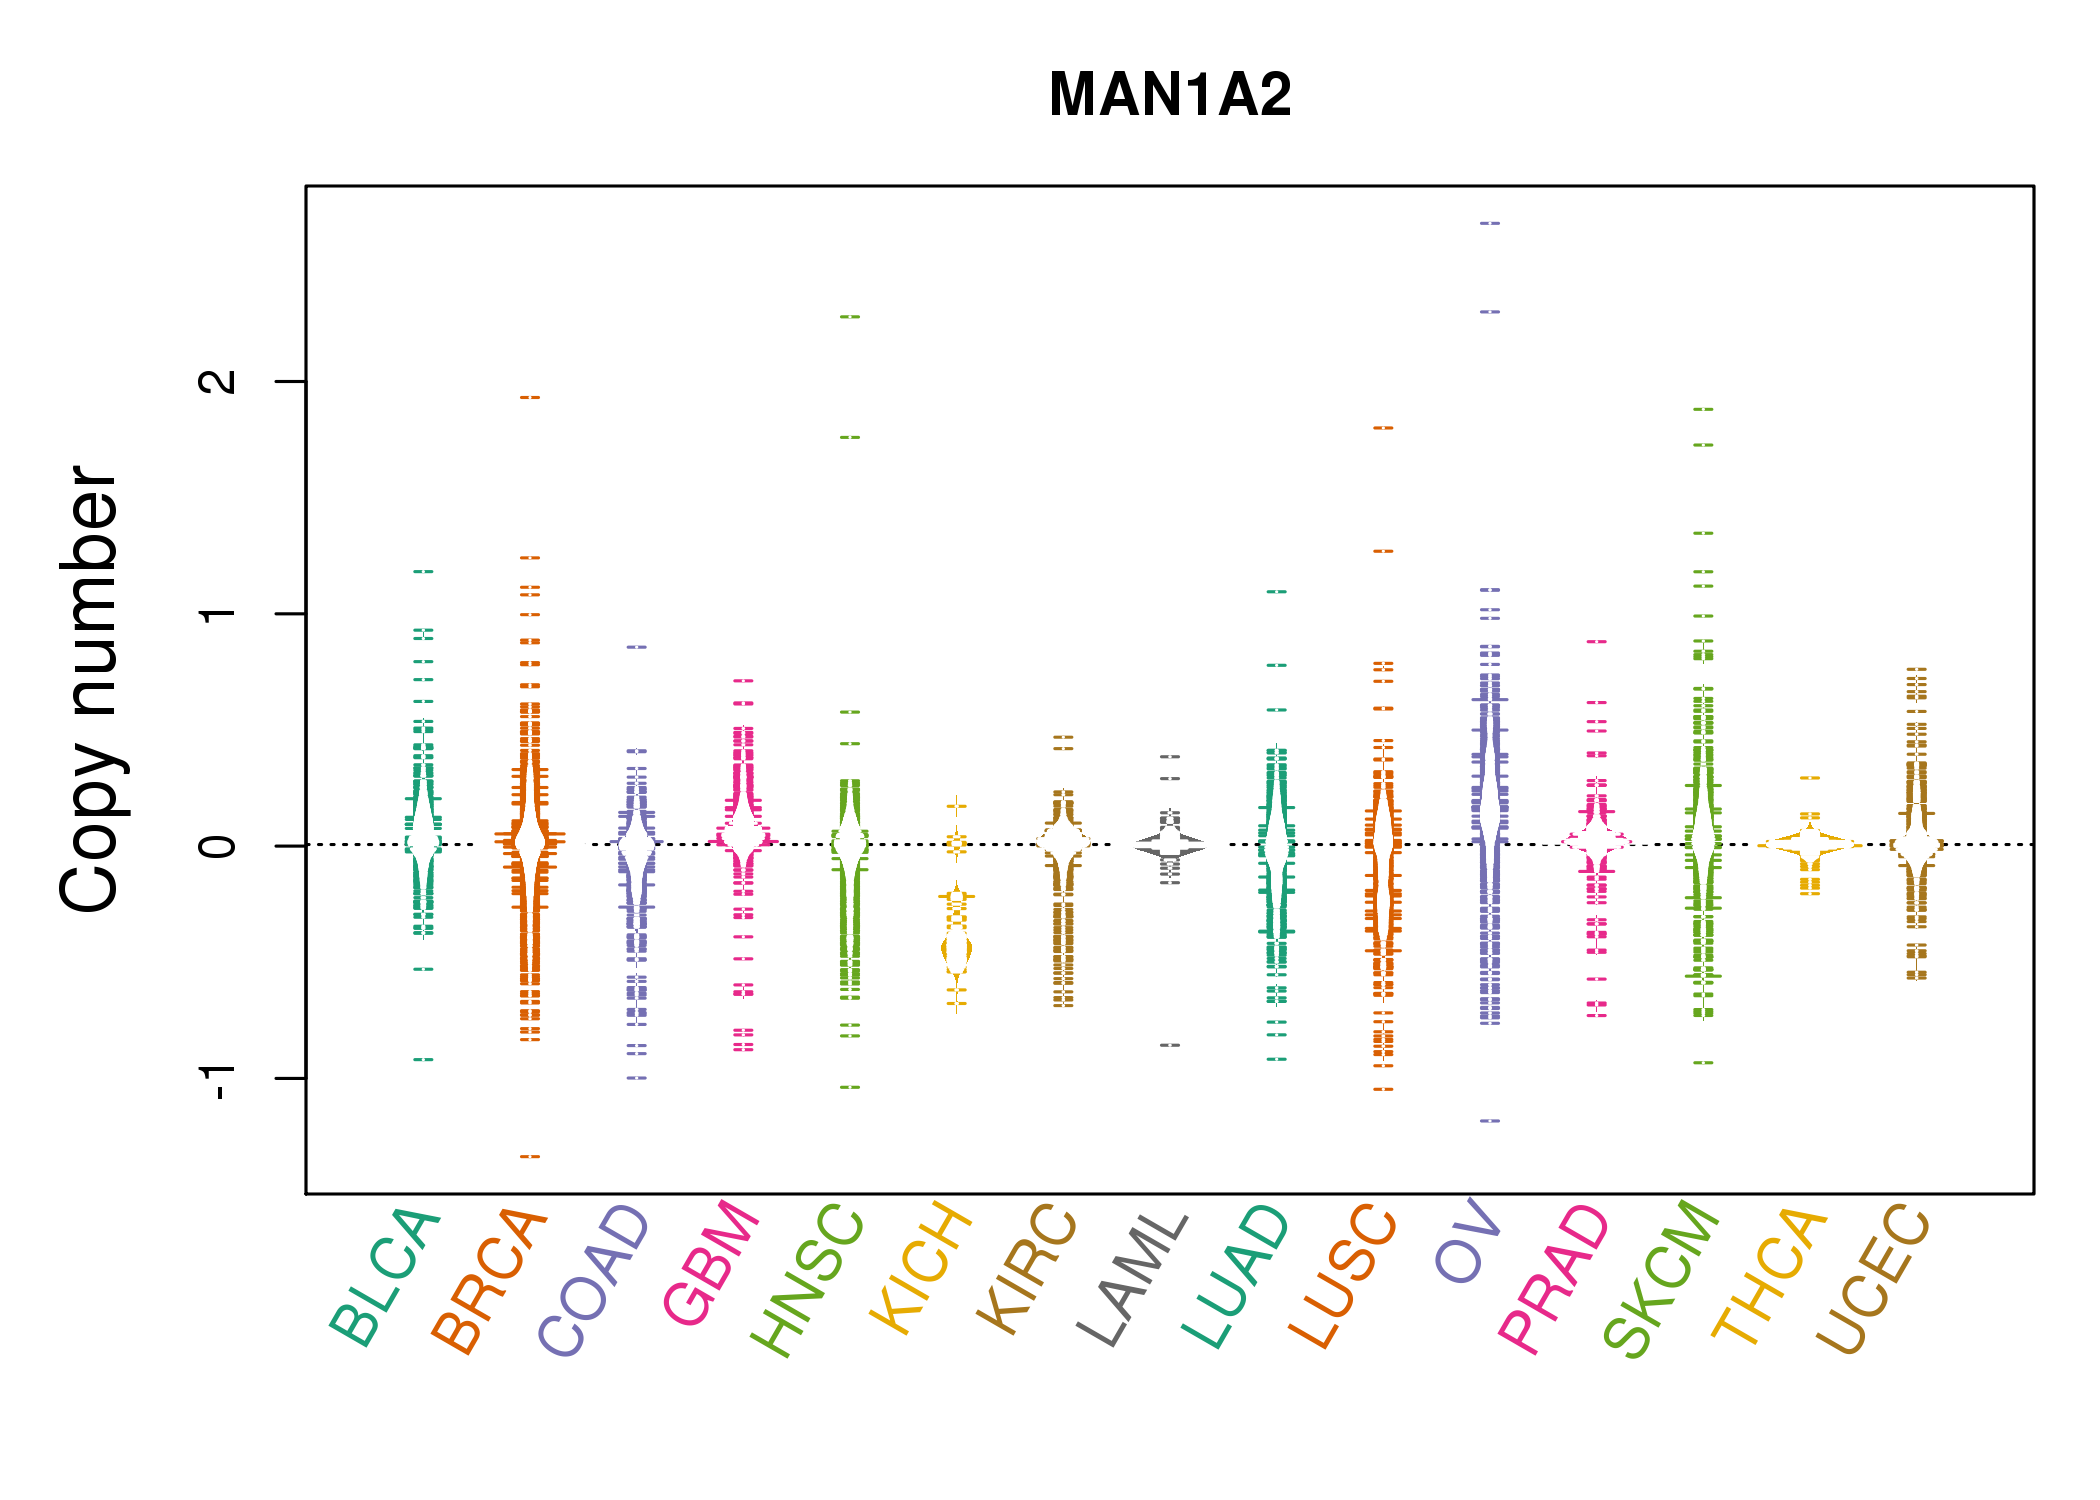 |
| cf) Tissue ID[Tissue type]: BLCA[Bladder Urothelial Carcinoma], BRCA[Breast invasive carcinoma], CESC[Cervical squamous cell carcinoma and endocervical adenocarcinoma], COAD[Colon adenocarcinoma], GBM[Glioblastoma multiforme], Glioma Low Grade, HNSC[Head and Neck squamous cell carcinoma], KICH[Kidney Chromophobe], KIRC[Kidney renal clear cell carcinoma], KIRP[Kidney renal papillary cell carcinoma], LAML[Acute Myeloid Leukemia], LUAD[Lung adenocarcinoma], LUSC[Lung squamous cell carcinoma], OV[Ovarian serous cystadenocarcinoma ], PAAD[Pancreatic adenocarcinoma], PRAD[Prostate adenocarcinoma], SKCM[Skin Cutaneous Melanoma], STAD[Stomach adenocarcinoma], THCA[Thyroid carcinoma], UCEC[Uterine Corpus Endometrial Carcinoma] |
| Top |
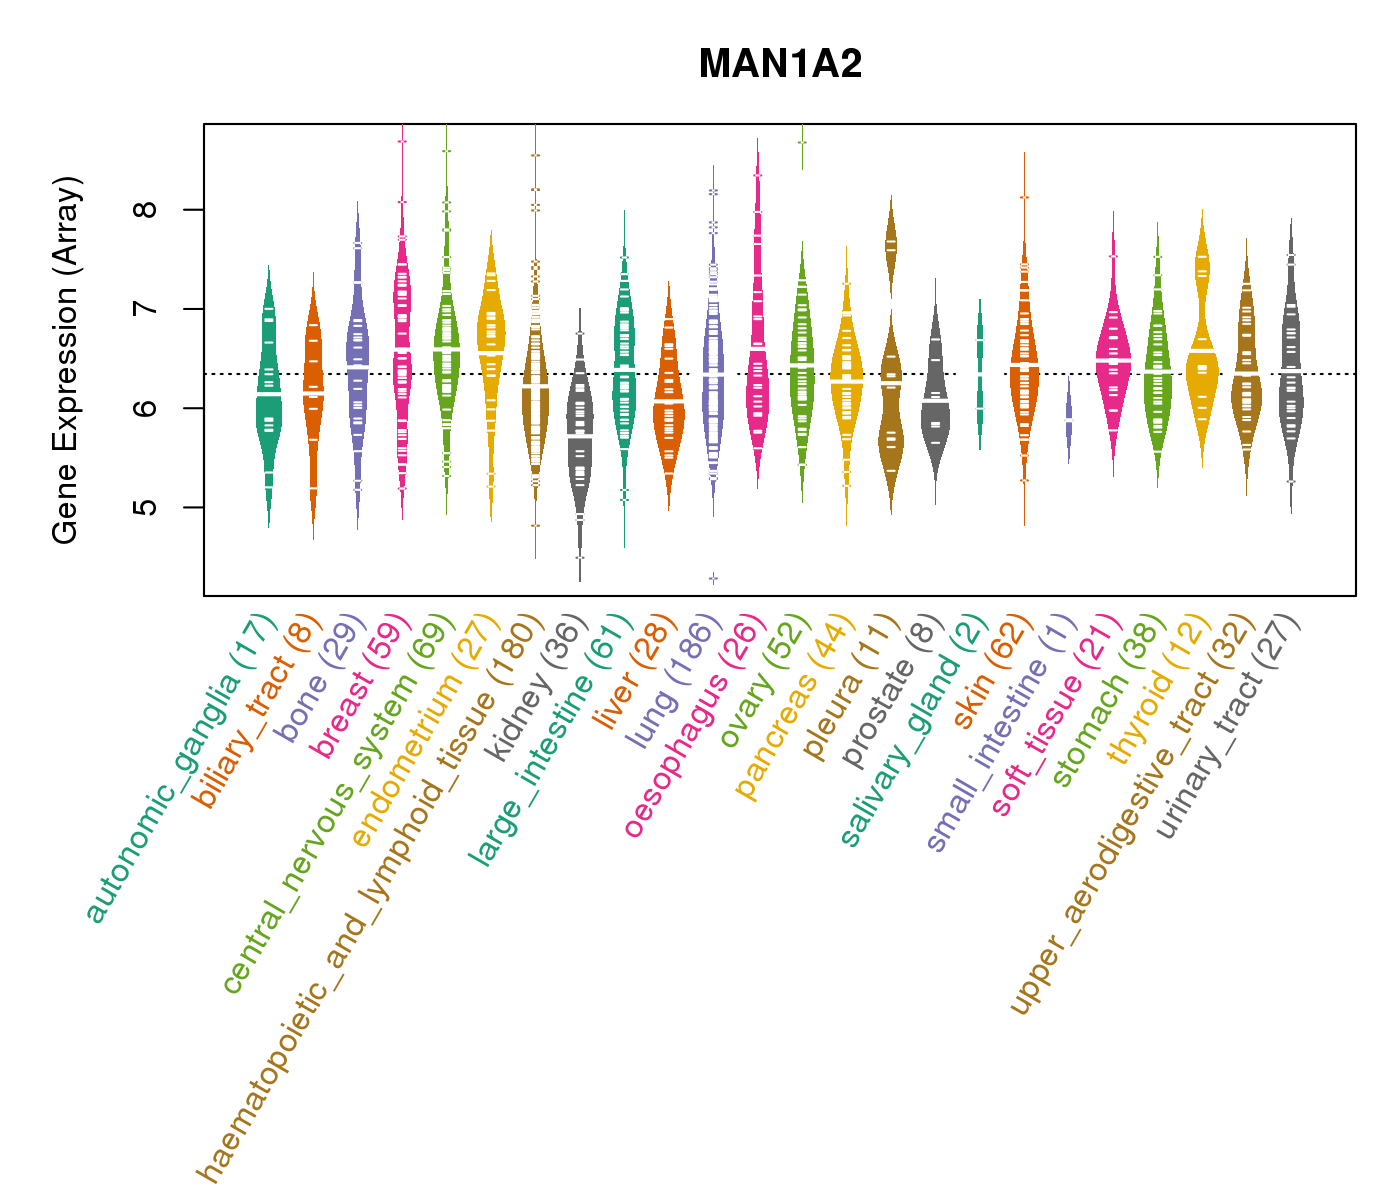
| Gene Expression for MAN1A2 |
| * CCLE gene expression data were extracted from CCLE_Expression_Entrez_2012-10-18.res: Gene-centric RMA-normalized mRNA expression data. |
 |
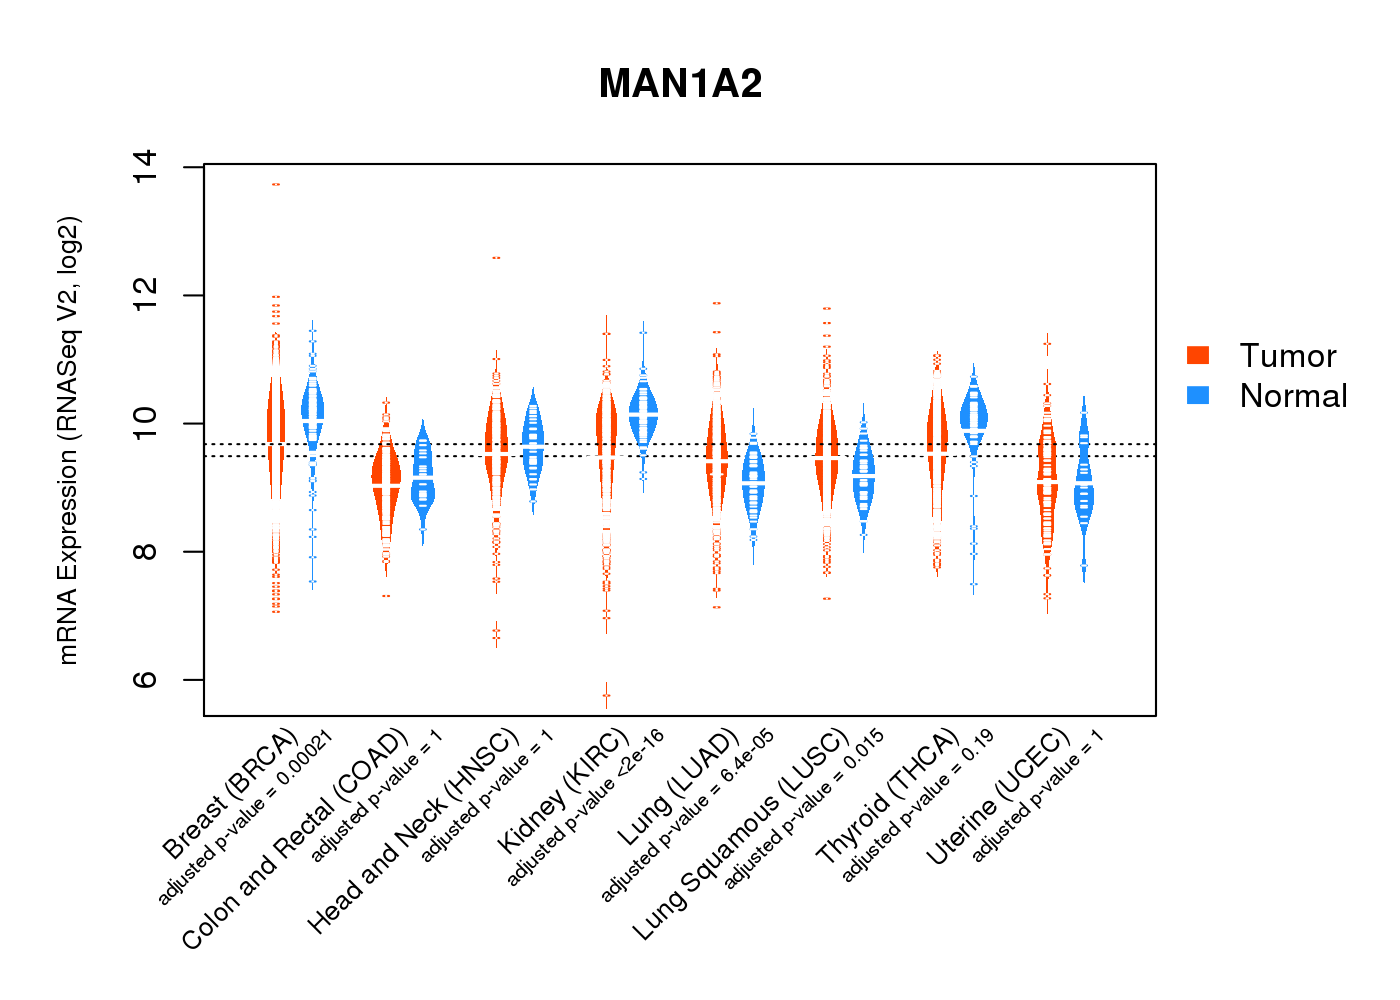
| * Normalized gene expression data of RNASeqV2 was extracted from TCGA using R package TCGA-Assembler. The URLs of all public data files on TCGA DCC data server were gathered at Jan-05-2015. Only eight cancer types have enough normal control samples for differential expression analysis. (t test, adjusted p<0.05 (using Benjamini-Hochberg FDR)) |
 |
| Top |
| * This plots show the correlation between CNV and gene expression. |
: Open all plots for all cancer types
 |
|
 |
|


| Top |
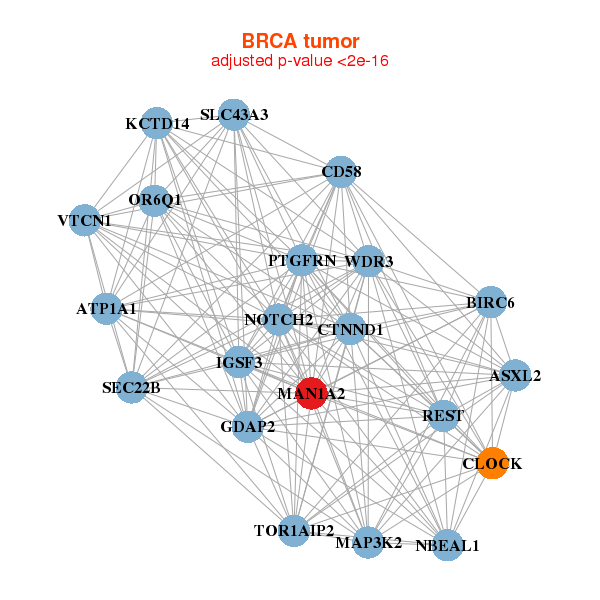
| Gene-Gene Network Information |
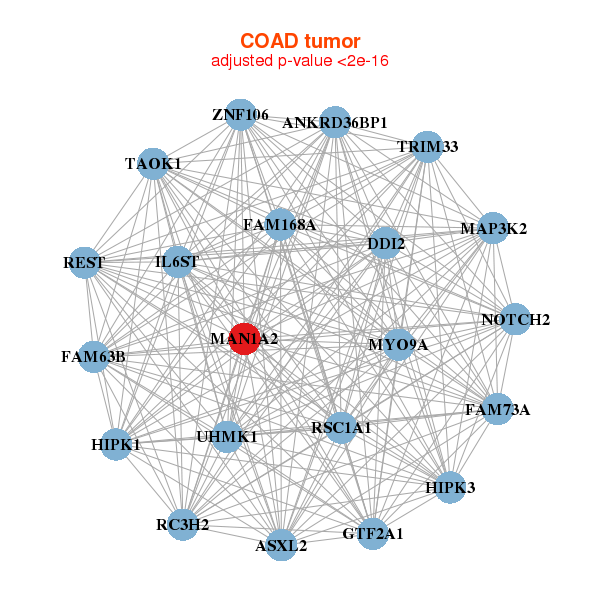
| * Co-Expression network figures were drawn using R package igraph. Only the top 20 genes with the highest correlations were shown. Red circle: input gene, orange circle: cell metabolism gene, sky circle: other gene |
: Open all plots for all cancer types
 |
|
| ASXL2,ATP1A1,BIRC6,CD58,CLOCK,CTNND1,GDAP2, IGSF3,KCTD14,MAN1A2,MAP3K2,NBEAL1,NOTCH2,OR6Q1, PTGFRN,REST,SEC22B,SLC43A3,TOR1AIP2,VTCN1,WDR3 | ANKIB1,ARHGAP42,ATL3,CDC42BPA,CLOCK,EXOC6B,FER, FNDC3B,HEATR5A,LNPEP,MAN1A2,MBNL3,PBRM1,RC3H2, SBF2,TAOK1,TRIM44,TRIP12,USP12,UTRN,XPOT |
 |
|
| ANKRD36BP1,ASXL2,DDI2,FAM168A,FAM63B,FAM73A,GTF2A1, HIPK1,HIPK3,IL6ST,MAN1A2,MAP3K2,MYO9A,NOTCH2, RC3H2,REST,RSC1A1,TAOK1,TRIM33,UHMK1,ZNF106 | SOGA1,CLOCK,FAM63B,HIPK3,IL6ST,KIAA0754,ICE1, KIRREL,LATS1,LNPEP,MAN1A2,NAA25,PBRM1,PIK3C2A, PTPN11,PTPRG,ROCK1,TAOK1,TRAF3IP1,TRIM44,ZC3H13 |
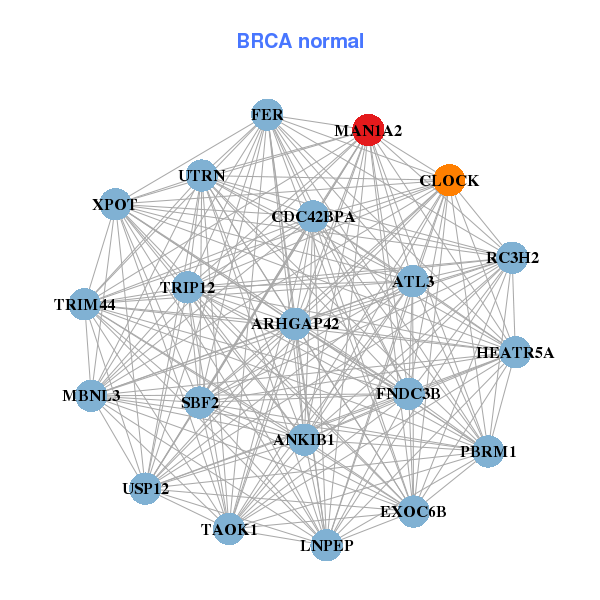
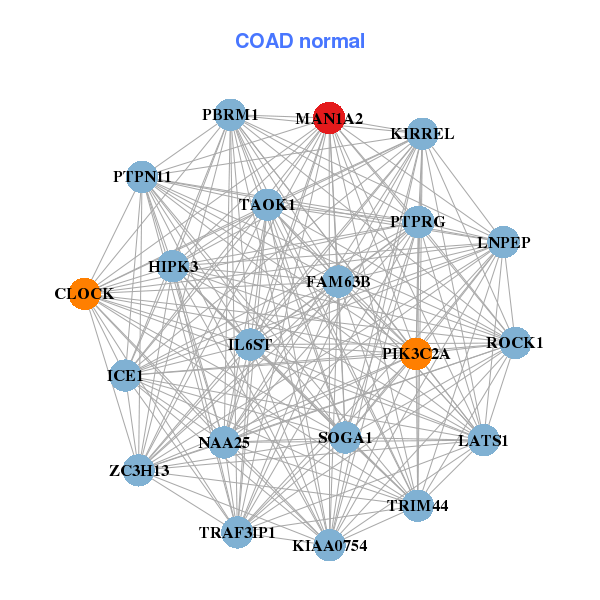
| * Co-Expression network figures were drawn using R package igraph. Only the top 20 genes with the highest correlations were shown. Red circle: input gene, orange circle: cell metabolism gene, sky circle: other gene |
: Open all plots for all cancer types
| Top |
: Open all interacting genes' information including KEGG pathway for all interacting genes from DAVID
| Top |
| Pharmacological Information for MAN1A2 |
| There's no related Drug. |
| Top |
| Cross referenced IDs for MAN1A2 |
| * We obtained these cross-references from Uniprot database. It covers 150 different DBs, 18 categories. http://www.uniprot.org/help/cross_references_section |
: Open all cross reference information
|
Copyright © 2016-Present - The Univsersity of Texas Health Science Center at Houston @ |