|
||||||||||||||||||||||||||||||||||||||||||||||||||||||||||||||||||||||||||||||||||||||||||||||||||||||||||||||||||||||||||||||||||||||||||||||||||||||||||||||||||||||||||||||||||||||||||||||||||||||||||||||||||||||||||||||||||||||||||||||||||||||||||||||||||||||||||||||||||||||||||||||||||||||||||||||||||||||||||
| |
| Phenotypic Information (metabolism pathway, cancer, disease, phenome) |
| |
| |
| Gene-Gene Network Information: Co-Expression Network, Interacting Genes & KEGG |
| |
|


| Gene Summary for RNPS1 |
| Top |
| Phenotypic Information for RNPS1(metabolism pathway, cancer, disease, phenome) |
| Cancer | CGAP: RNPS1 |
| Familial Cancer Database: RNPS1 | |
| * This gene is included in those cancer gene databases. |
|
|
|
|
|
| . | ||||||||||||||||||||||||||||||||||||||||||||||||||||||||||||||||||||||||||||||||||||||||||||||||||||||||||||||||||||||||||||||||||||||||||||||||||||||||||||||||||||||||||||||||||||||||||||||||||||||||||||||||||||||||||||||||||||||||||||||||||||||||||||||||||||||||||||||||||||||||||||||||||||||||||||||||||||
Oncogene 1 | Significant driver gene in | |||||||||||||||||||||||||||||||||||||||||||||||||||||||||||||||||||||||||||||||||||||||||||||||||||||||||||||||||||||||||||||||||||||||||||||||||||||||||||||||||||||||||||||||||||||||||||||||||||||||||||||||||||||||||||||||||||||||||||||||||||||||||||||||||||||||||||||||||||||||||||||||||||||||||||||||||||||||||
| cf) number; DB name 1 Oncogene; http://nar.oxfordjournals.org/content/35/suppl_1/D721.long, 2 Tumor Suppressor gene; https://bioinfo.uth.edu/TSGene/, 3 Cancer Gene Census; http://www.nature.com/nrc/journal/v4/n3/abs/nrc1299.html, 4 CancerGenes; http://nar.oxfordjournals.org/content/35/suppl_1/D721.long, 5 Network of Cancer Gene; http://ncg.kcl.ac.uk/index.php, 1Therapeutic Vulnerabilities in Cancer; http://cbio.mskcc.org/cancergenomics/statius/ |
| REACTOME_METABOLISM_OF_MRNA REACTOME_METABOLISM_OF_RNA | |
| OMIM | |
| Orphanet | |
| Disease | KEGG Disease: RNPS1 |
| MedGen: RNPS1 (Human Medical Genetics with Condition) | |
| ClinVar: RNPS1 | |
| Phenotype | MGI: RNPS1 (International Mouse Phenotyping Consortium) |
| PhenomicDB: RNPS1 | |
| Mutations for RNPS1 |
| * Under tables are showing count per each tissue to give us broad intuition about tissue specific mutation patterns.You can go to the detailed page for each mutation database's web site. |
| - Statistics for Tissue and Mutation type | Top |
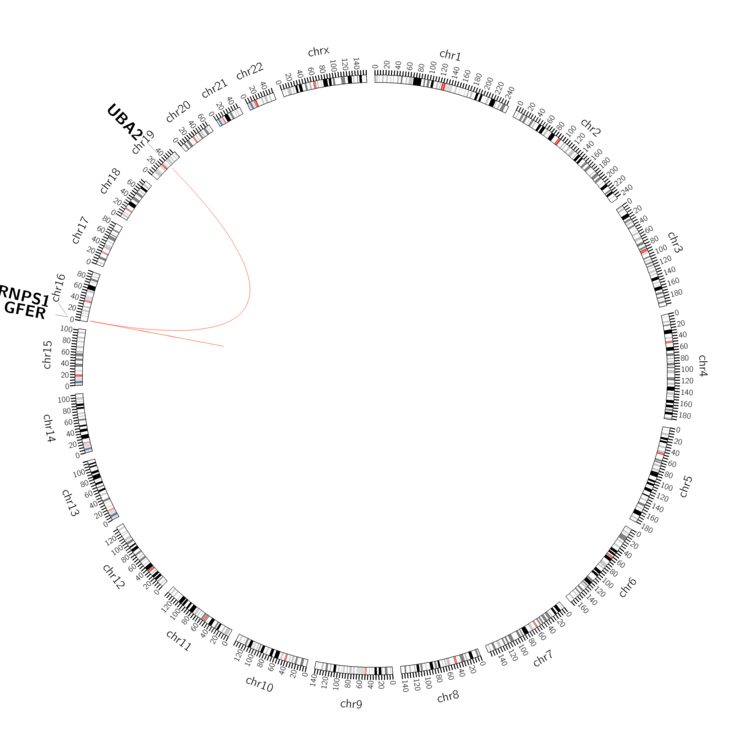 |
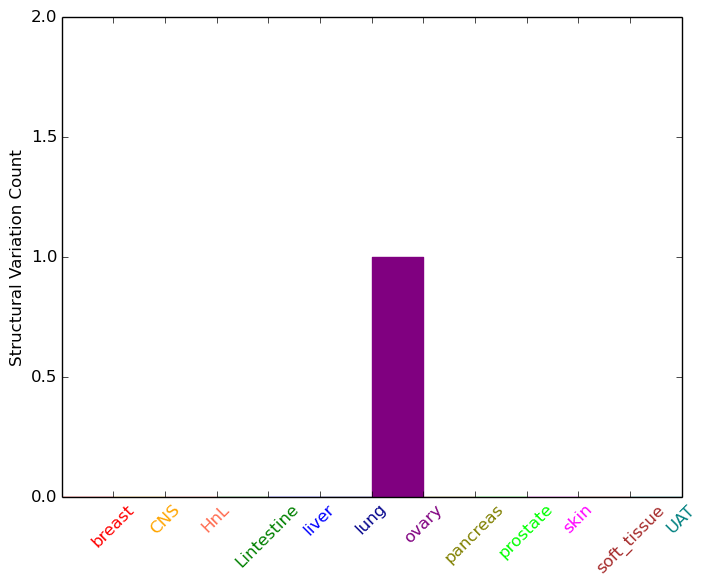
| - For Inter-chromosomal Variations |
| * Inter-chromosomal variantions includes 'interchromosomal amplicon to amplicon', 'interchromosomal amplicon to non-amplified dna', 'interchromosomal insertion', 'Interchromosomal unknown type'. |
 |
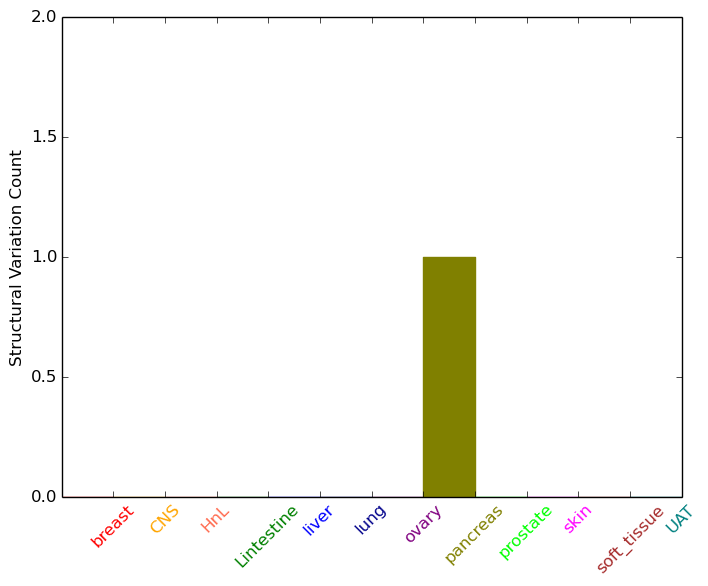
| - For Intra-chromosomal Variations |
| * Intra-chromosomal variantions includes 'intrachromosomal amplicon to amplicon', 'intrachromosomal amplicon to non-amplified dna', 'intrachromosomal deletion', 'intrachromosomal fold-back inversion', 'intrachromosomal inversion', 'intrachromosomal tandem duplication', 'Intrachromosomal unknown type', 'intrachromosomal with inverted orientation', 'intrachromosomal with non-inverted orientation'. |
 |
| Sample | Symbol_a | Chr_a | Start_a | End_a | Symbol_b | Chr_b | Start_b | End_b |
| ovary | RNPS1 | chr16 | 2316974 | 2316994 | UBA2 | chr19 | 34923086 | 34923106 |
| pancreas | RNPS1 | chr16 | 2318264 | 2318284 | GFER | chr16 | 2036880 | 2036900 |
| cf) Tissue number; Tissue name (1;Breast, 2;Central_nervous_system, 3;Haematopoietic_and_lymphoid_tissue, 4;Large_intestine, 5;Liver, 6;Lung, 7;Ovary, 8;Pancreas, 9;Prostate, 10;Skin, 11;Soft_tissue, 12;Upper_aerodigestive_tract) |
| * From mRNA Sanger sequences, Chitars2.0 arranged chimeric transcripts. This table shows RNPS1 related fusion information. |
| ID | Head Gene | Tail Gene | Accession | Gene_a | qStart_a | qEnd_a | Chromosome_a | tStart_a | tEnd_a | Gene_a | qStart_a | qEnd_a | Chromosome_a | tStart_a | tEnd_a |
| BM750508 | ZNF223 | 1 | 277 | 19 | 44556189 | 44564641 | RNPS1 | 268 | 562 | 16 | 2312373 | 2313235 | |
| BG272918 | GFRA1 | 7 | 331 | 10 | 117823236 | 117823560 | RNPS1 | 328 | 424 | 16 | 2312286 | 2312382 | |
| DA134109 | RNU12 | 1 | 71 | 22 | 43011251 | 43011321 | RNPS1 | 72 | 568 | 16 | 2313127 | 2314752 | |
| DA783540 | RNPS1 | 1 | 447 | 16 | 2313246 | 2318115 | ZEB2 | 444 | 601 | 2 | 145154061 | 145155926 | |
| Top |
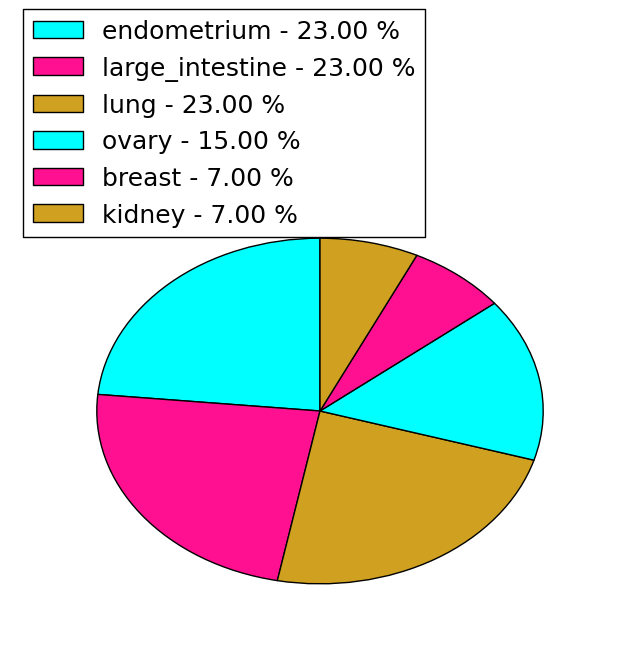
| Mutation type/ Tissue ID | brca | cns | cerv | endome | haematopo | kidn | Lintest | liver | lung | ns | ovary | pancre | prost | skin | stoma | thyro | urina | |||
| Total # sample | 1 | |||||||||||||||||||
| GAIN (# sample) | ||||||||||||||||||||
| LOSS (# sample) | 1 |
| cf) Tissue ID; Tissue type (1; Breast, 2; Central_nervous_system, 3; Cervix, 4; Endometrium, 5; Haematopoietic_and_lymphoid_tissue, 6; Kidney, 7; Large_intestine, 8; Liver, 9; Lung, 10; NS, 11; Ovary, 12; Pancreas, 13; Prostate, 14; Skin, 15; Stomach, 16; Thyroid, 17; Urinary_tract) |
| Top |
|
 |
| Top |
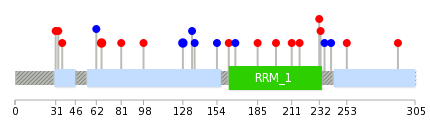
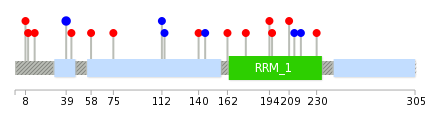
| Stat. for Non-Synonymous SNVs (# total SNVs=13) | (# total SNVs=7) |
 |  |
(# total SNVs=0) | (# total SNVs=0) |
| Top |
| * When you move the cursor on each content, you can see more deailed mutation information on the Tooltip. Those are primary_site,primary_histology,mutation(aa),pubmedID. |
| GRCh37 position | Mutation(aa) | Unique sampleID count |
| chr16:2313134-2313134 | p.R128R | 2 |
| chr16:2314208-2314208 | p.R66C | 2 |
| chr16:2314307-2314307 | p.D33Y | 1 |
| chr16:2305585-2305585 | p.? | 1 |
| chr16:2312776-2312776 | p.V163M | 1 |
| chr16:2314313-2314313 | p.R31C | 1 |
| chr16:2305647-2305647 | p.P253S | 1 |
| chr16:2312803-2312803 | p.R154R | 1 |
| chr16:2314333-2314333 | p.? | 1 |
| chr16:2305681-2305681 | p.P241P | 1 |
| Top |
|
 |
| Point Mutation/ Tissue ID | 1 | 2 | 3 | 4 | 5 | 6 | 7 | 8 | 9 | 10 | 11 | 12 | 13 | 14 | 15 | 16 | 17 | 18 | 19 | 20 |
| # sample | 2 | 1 | 2 | 1 | 1 | 1 | 2 | 1 | 3 | 2 | 1 | 3 | ||||||||
| # mutation | 2 | 1 | 2 | 1 | 1 | 1 | 2 | 1 | 3 | 2 | 1 | 3 | ||||||||
| nonsynonymous SNV | 1 | 2 | 1 | 1 | 1 | 2 | 1 | 1 | 3 | |||||||||||
| synonymous SNV | 1 | 1 | 1 | 2 | 1 | 1 |
| cf) Tissue ID; Tissue type (1; BLCA[Bladder Urothelial Carcinoma], 2; BRCA[Breast invasive carcinoma], 3; CESC[Cervical squamous cell carcinoma and endocervical adenocarcinoma], 4; COAD[Colon adenocarcinoma], 5; GBM[Glioblastoma multiforme], 6; Glioma Low Grade, 7; HNSC[Head and Neck squamous cell carcinoma], 8; KICH[Kidney Chromophobe], 9; KIRC[Kidney renal clear cell carcinoma], 10; KIRP[Kidney renal papillary cell carcinoma], 11; LAML[Acute Myeloid Leukemia], 12; LUAD[Lung adenocarcinoma], 13; LUSC[Lung squamous cell carcinoma], 14; OV[Ovarian serous cystadenocarcinoma ], 15; PAAD[Pancreatic adenocarcinoma], 16; PRAD[Prostate adenocarcinoma], 17; SKCM[Skin Cutaneous Melanoma], 18:STAD[Stomach adenocarcinoma], 19:THCA[Thyroid carcinoma], 20:UCEC[Uterine Corpus Endometrial Carcinoma]) |
| Top |
| * We represented just top 10 SNVs. When you move the cursor on each content, you can see more deailed mutation information on the Tooltip. Those are primary_site, primary_histology, mutation(aa), pubmedID. |
| Genomic Position | Mutation(aa) | Unique sampleID count |
| chr16:2314218 | p.T39T,RNPS1 | 2 |
| chr16:2305681 | p.K15E,RNPS1 | 1 |
| chr16:2313224 | p.T213T,RNPS1 | 1 |
| chr16:2305696 | p.E209D,RNPS1 | 1 |
| chr16:2313274 | p.A196V,RNPS1 | 1 |
| chr16:2305708 | p.E194K,RNPS1 | 1 |
| chr16:2314208 | p.P176L,RNPS1 | 1 |
| chr16:2312299 | p.G162R,RNPS1 | 1 |
| chr16:2312306 | p.L145L,RNPS1 | 1 |
| chr16:2314307 | p.V140M,RNPS1 | 1 |
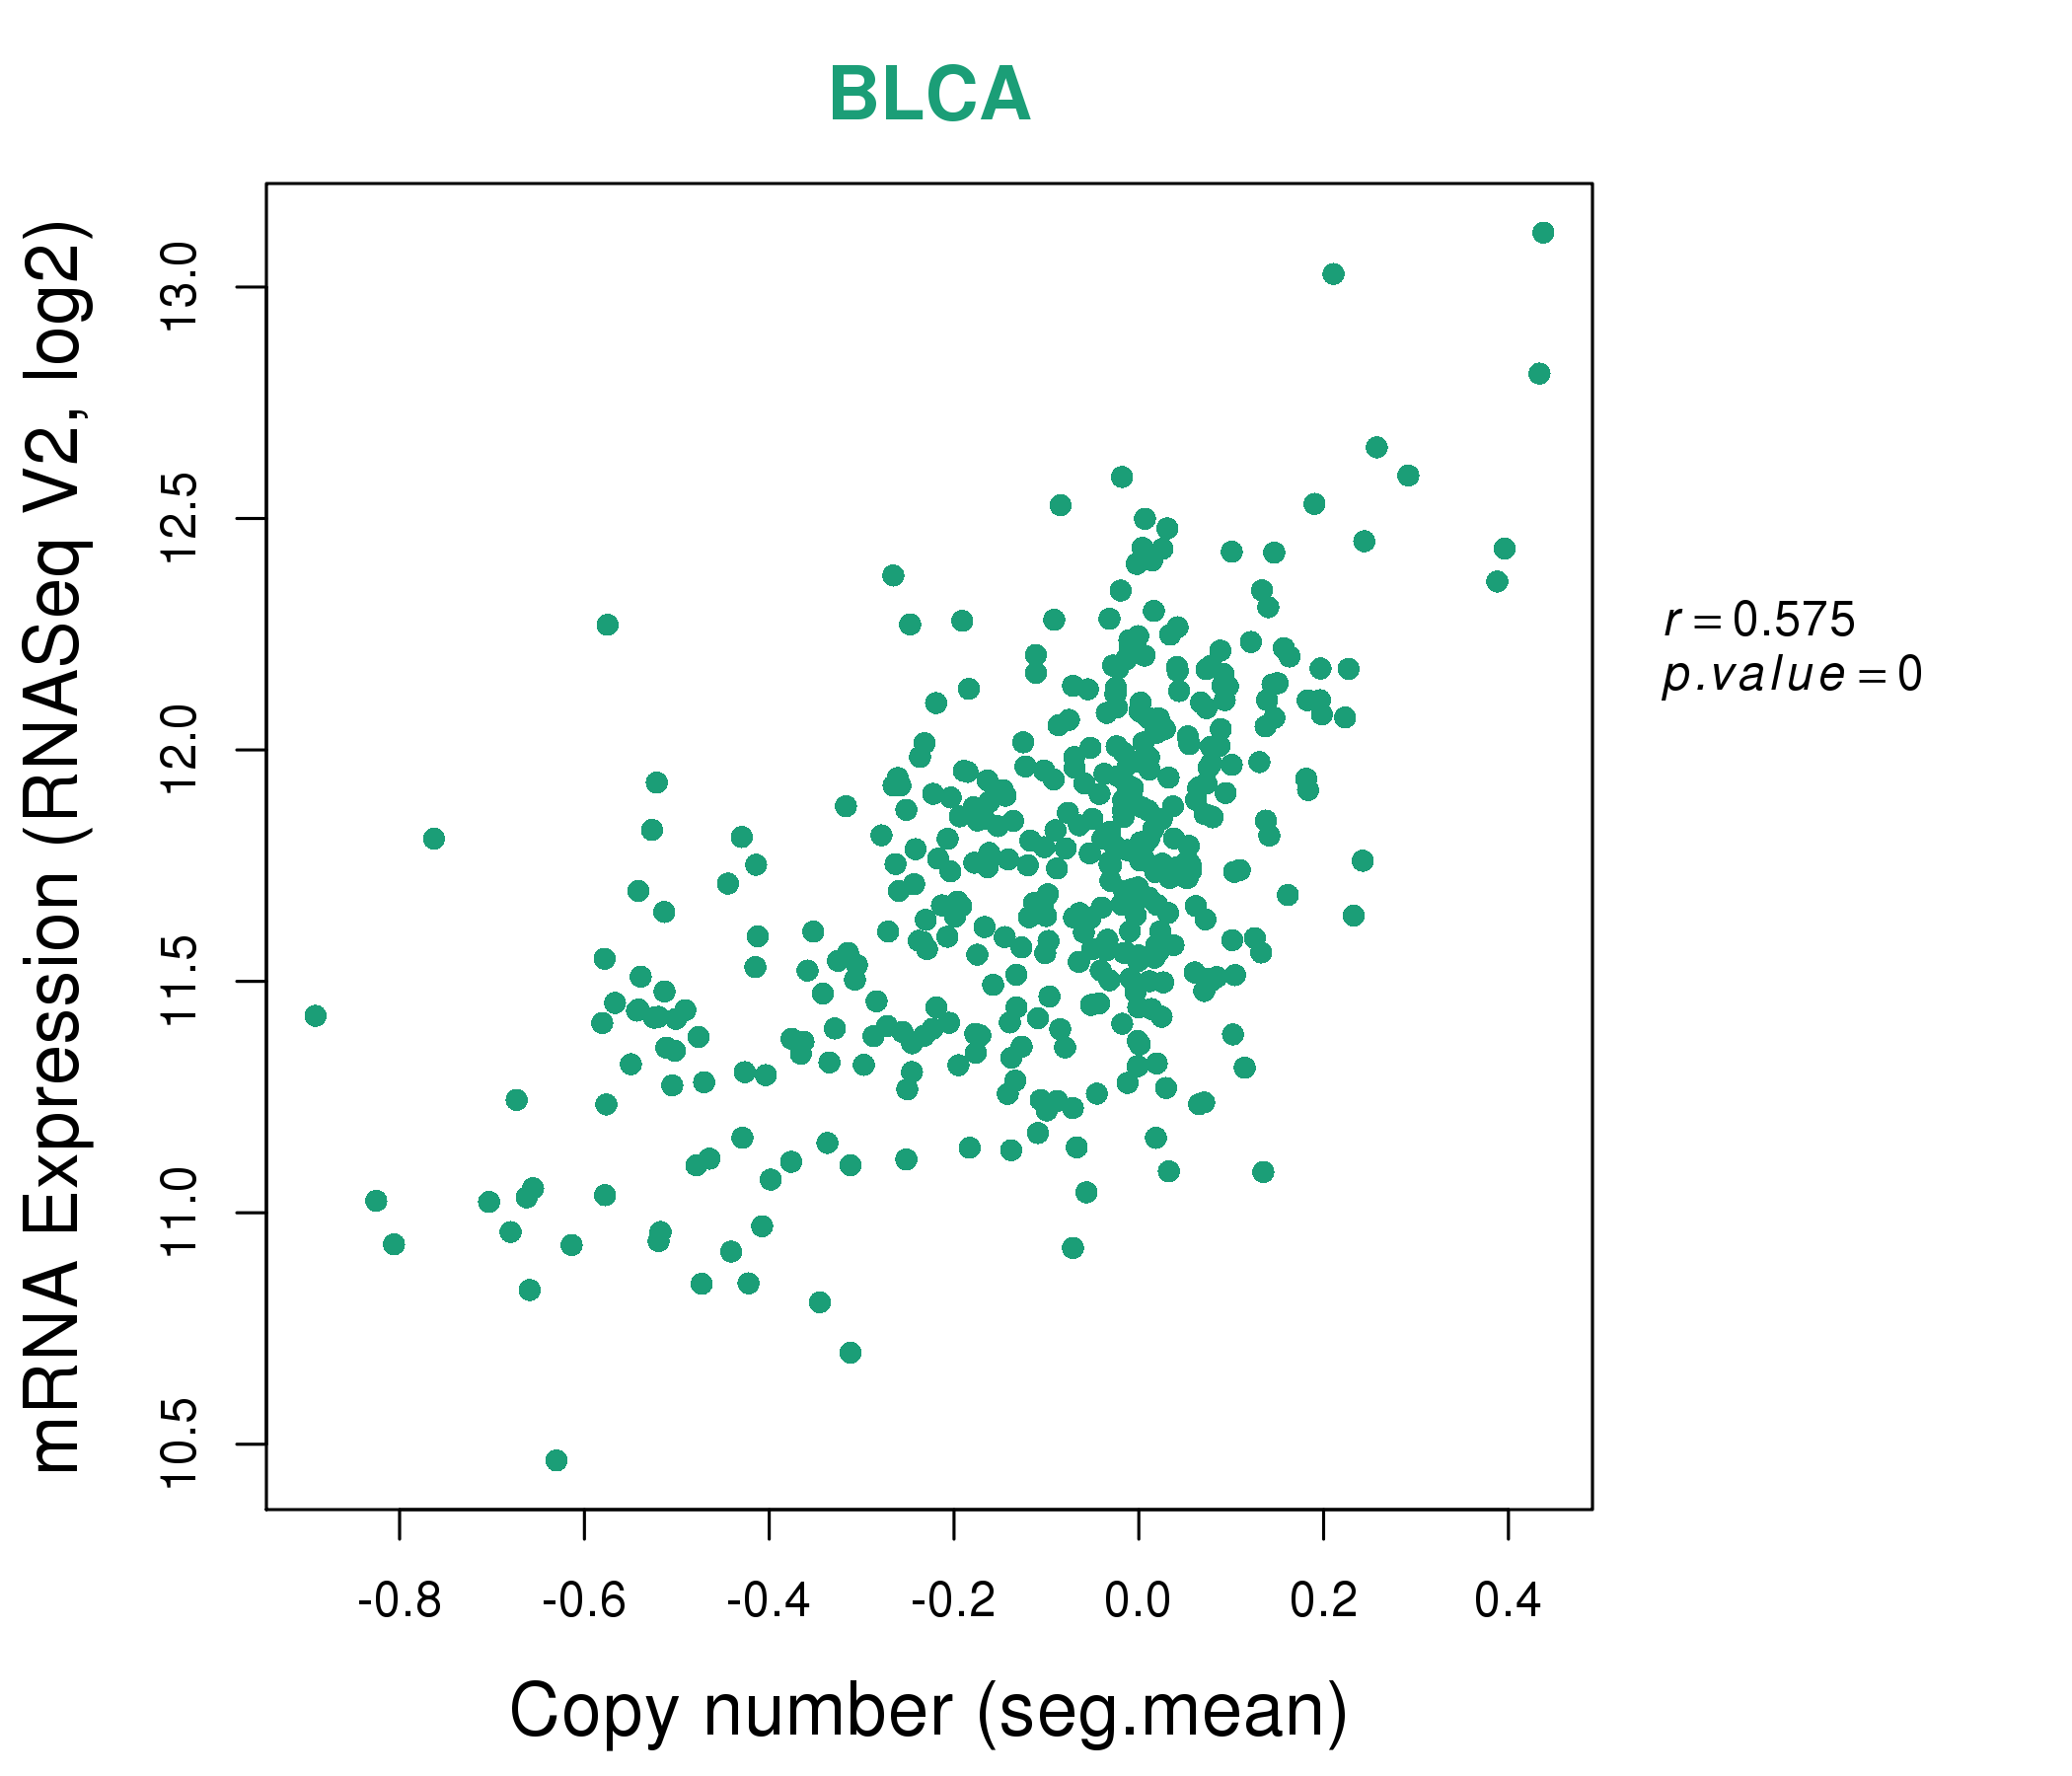
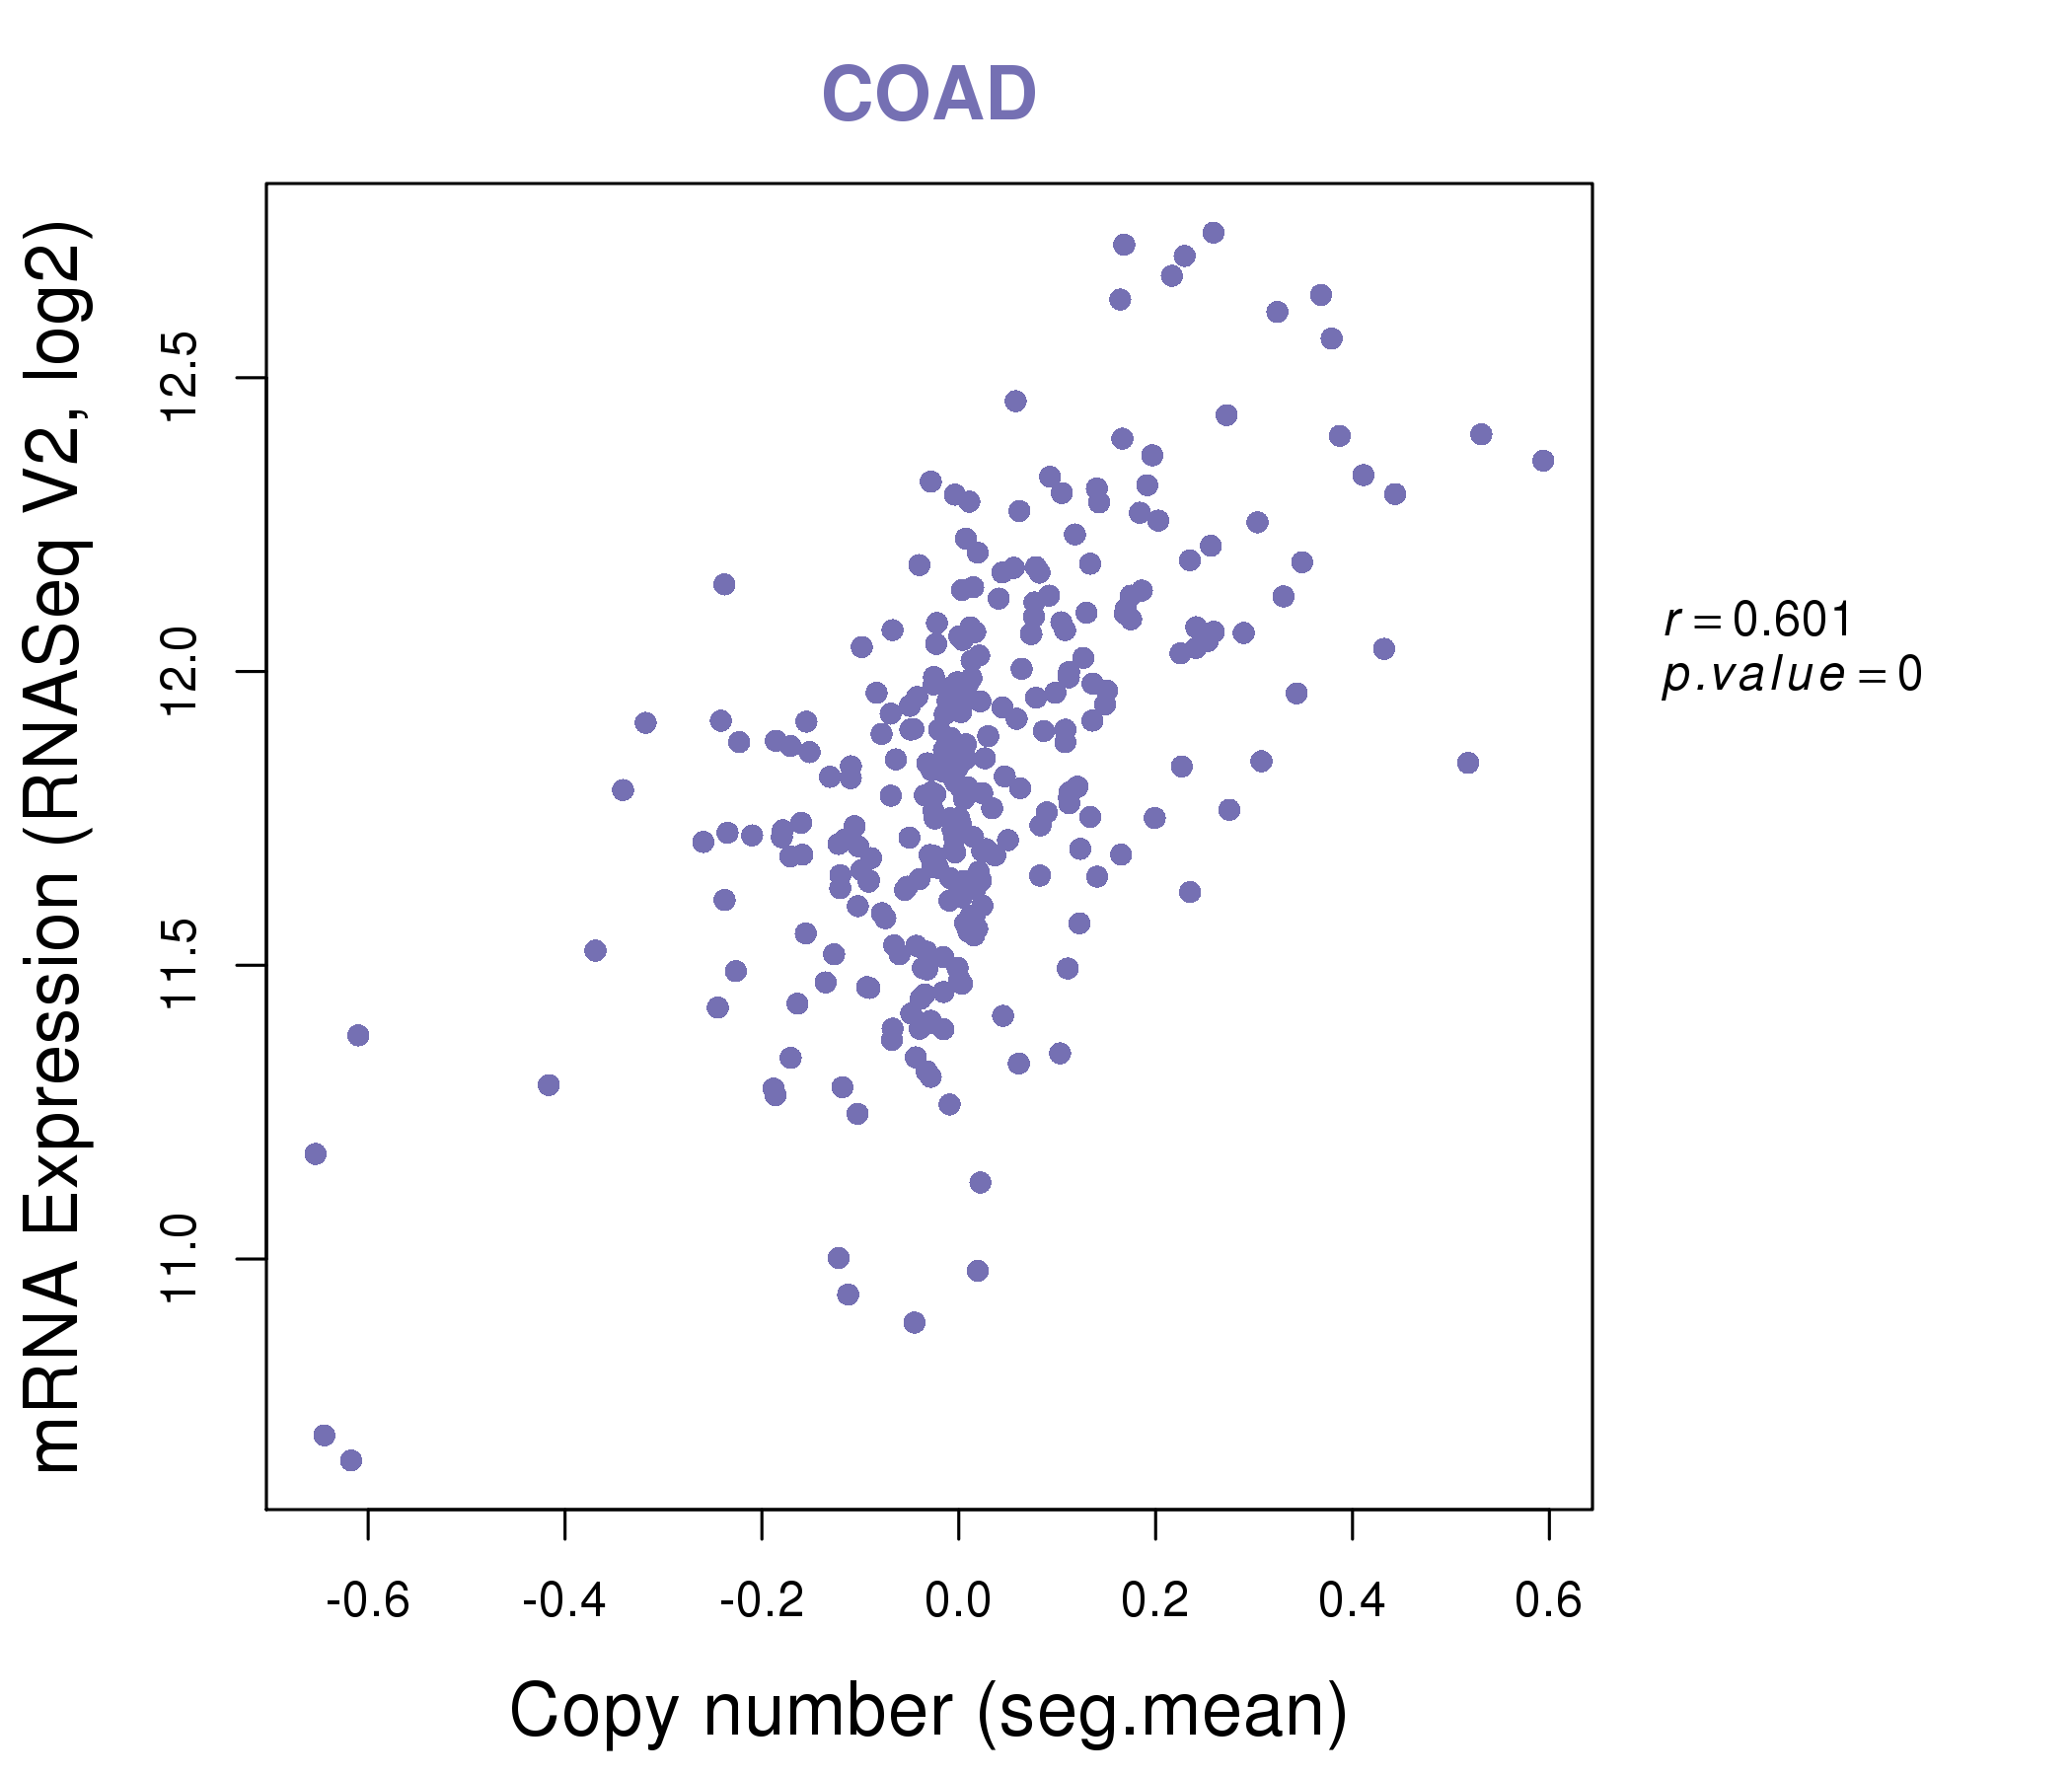
| * Copy number data were extracted from TCGA using R package TCGA-Assembler. The URLs of all public data files on TCGA DCC data server were gathered on Jan-05-2015. Function ProcessCNAData in TCGA-Assembler package was used to obtain gene-level copy number value which is calculated as the average copy number of the genomic region of a gene. |
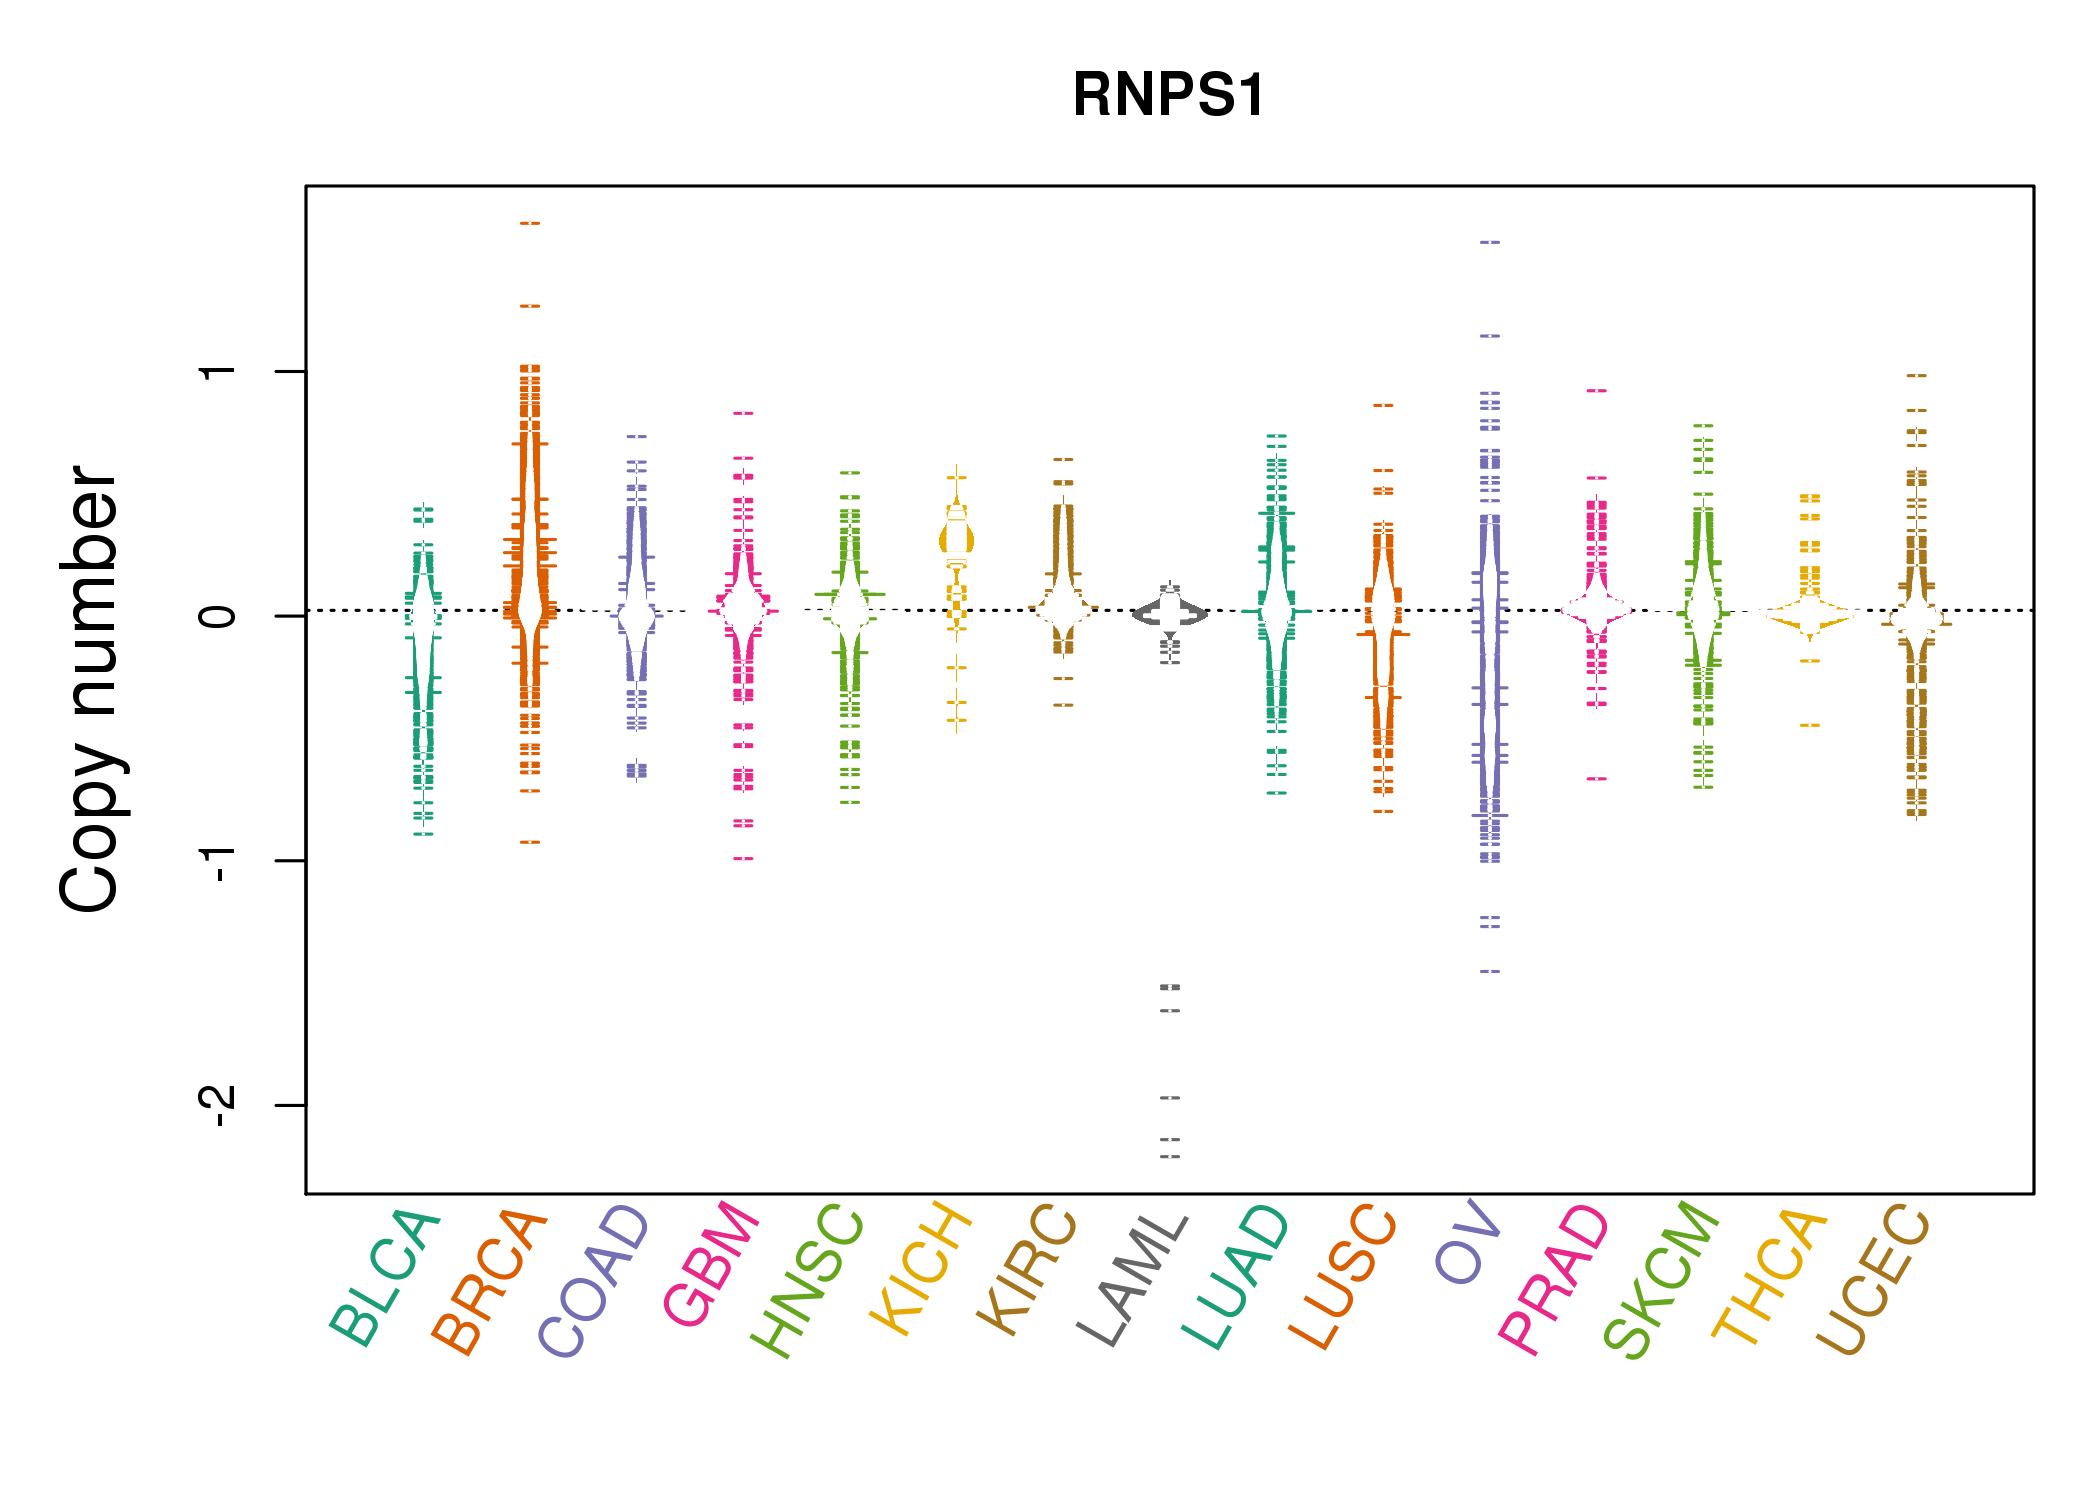 |
| cf) Tissue ID[Tissue type]: BLCA[Bladder Urothelial Carcinoma], BRCA[Breast invasive carcinoma], CESC[Cervical squamous cell carcinoma and endocervical adenocarcinoma], COAD[Colon adenocarcinoma], GBM[Glioblastoma multiforme], Glioma Low Grade, HNSC[Head and Neck squamous cell carcinoma], KICH[Kidney Chromophobe], KIRC[Kidney renal clear cell carcinoma], KIRP[Kidney renal papillary cell carcinoma], LAML[Acute Myeloid Leukemia], LUAD[Lung adenocarcinoma], LUSC[Lung squamous cell carcinoma], OV[Ovarian serous cystadenocarcinoma ], PAAD[Pancreatic adenocarcinoma], PRAD[Prostate adenocarcinoma], SKCM[Skin Cutaneous Melanoma], STAD[Stomach adenocarcinoma], THCA[Thyroid carcinoma], UCEC[Uterine Corpus Endometrial Carcinoma] |
| Top |
| Gene Expression for RNPS1 |
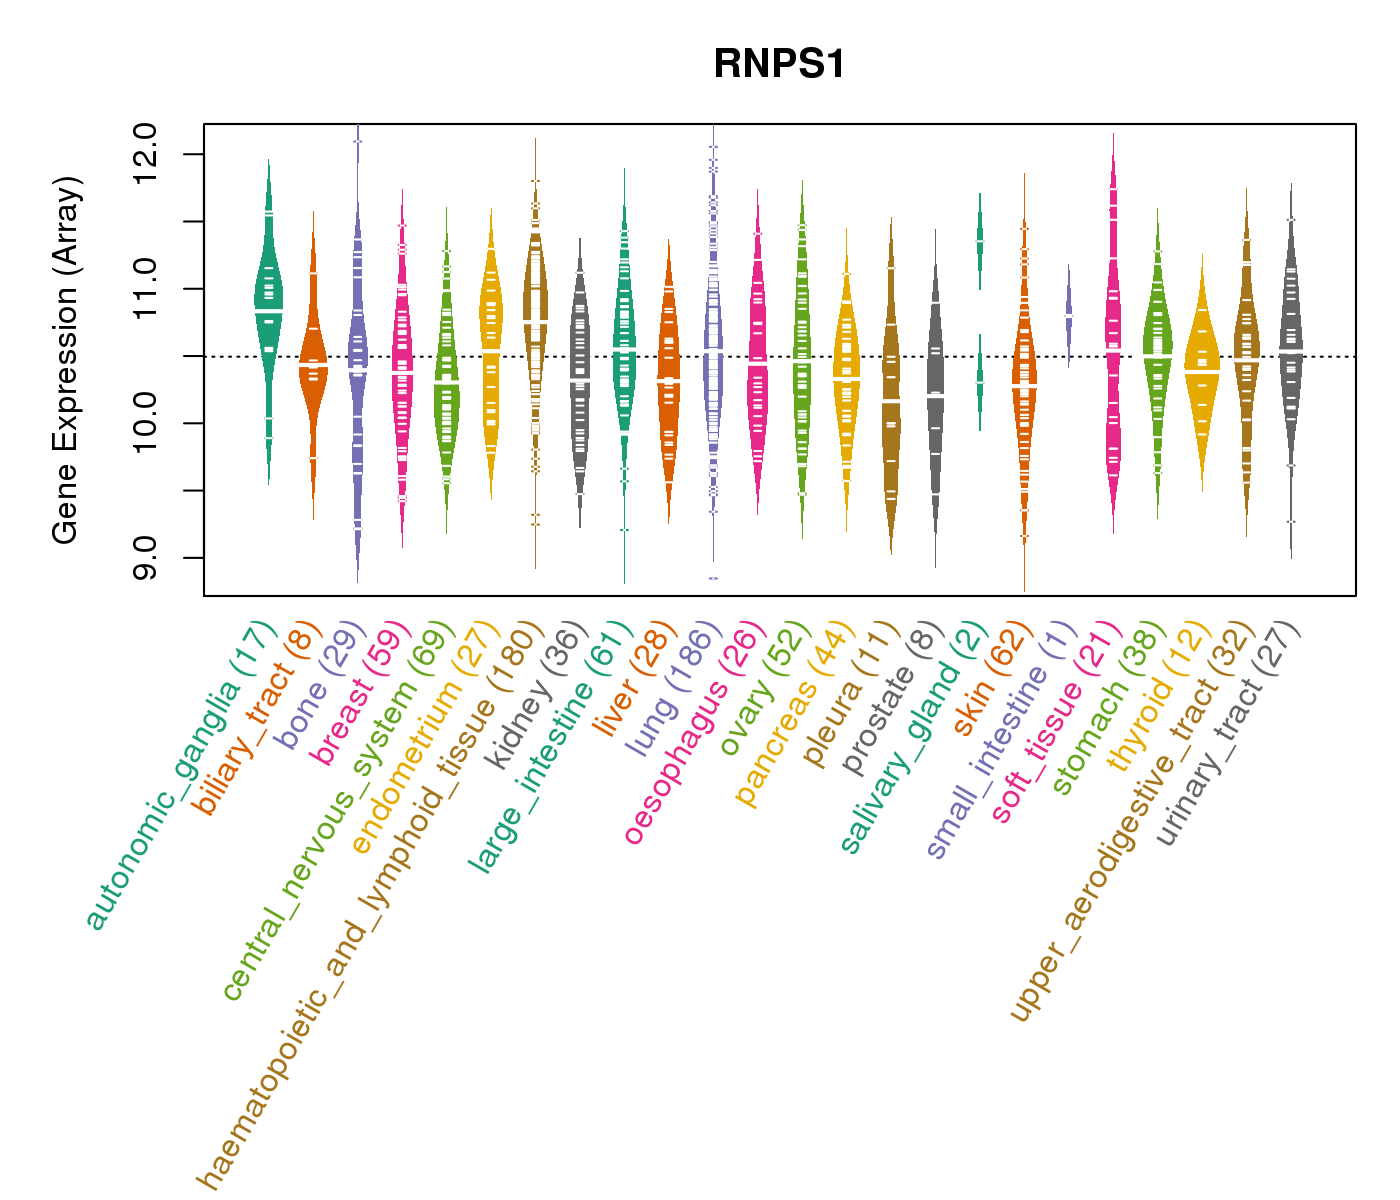
| * CCLE gene expression data were extracted from CCLE_Expression_Entrez_2012-10-18.res: Gene-centric RMA-normalized mRNA expression data. |
 |
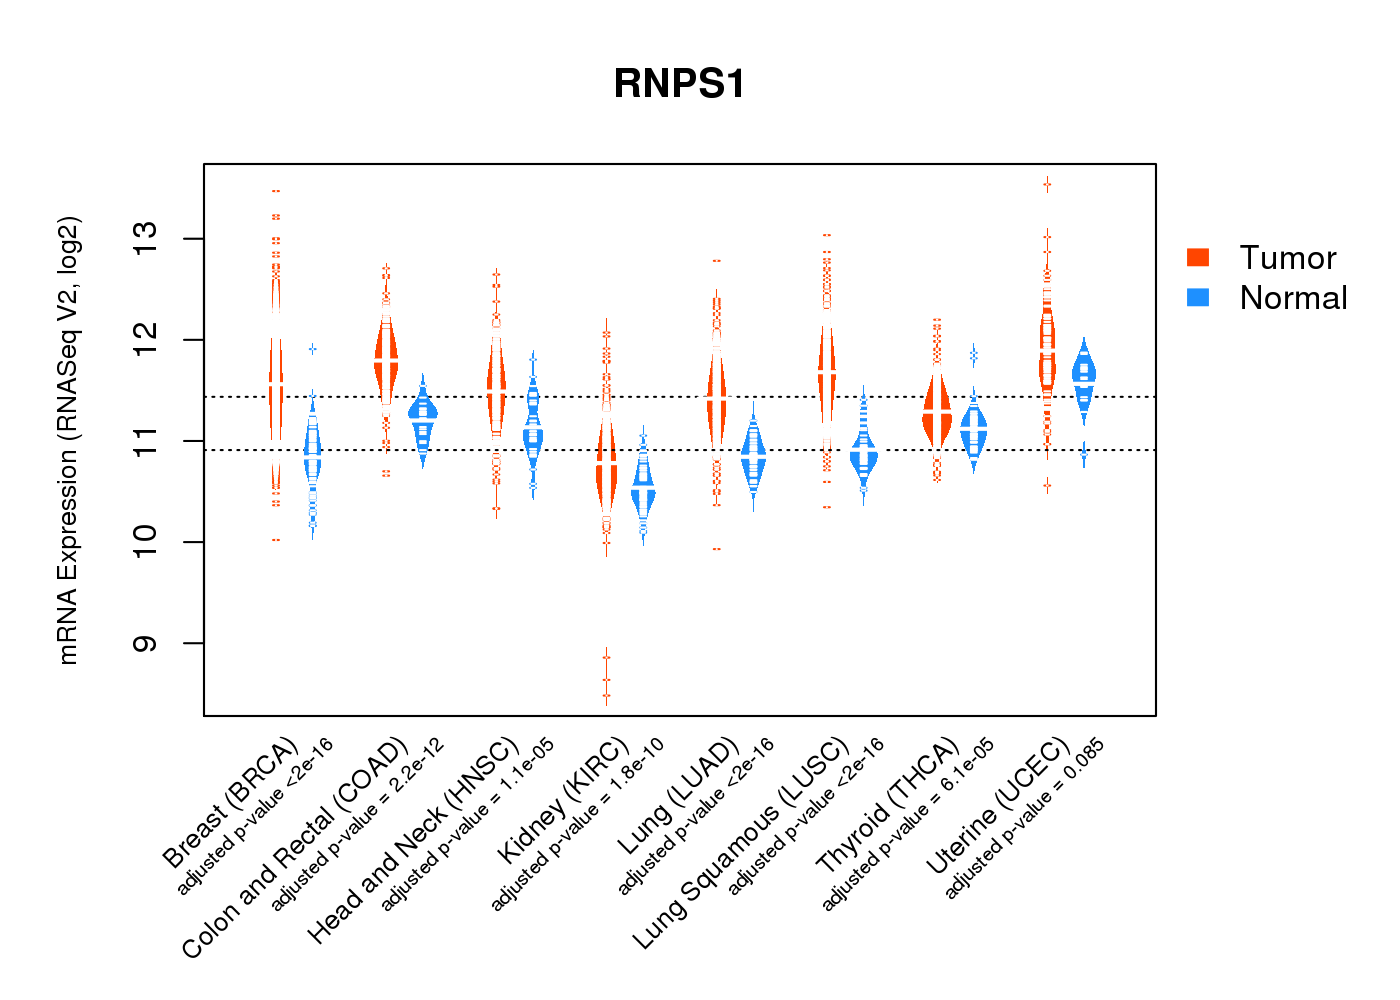
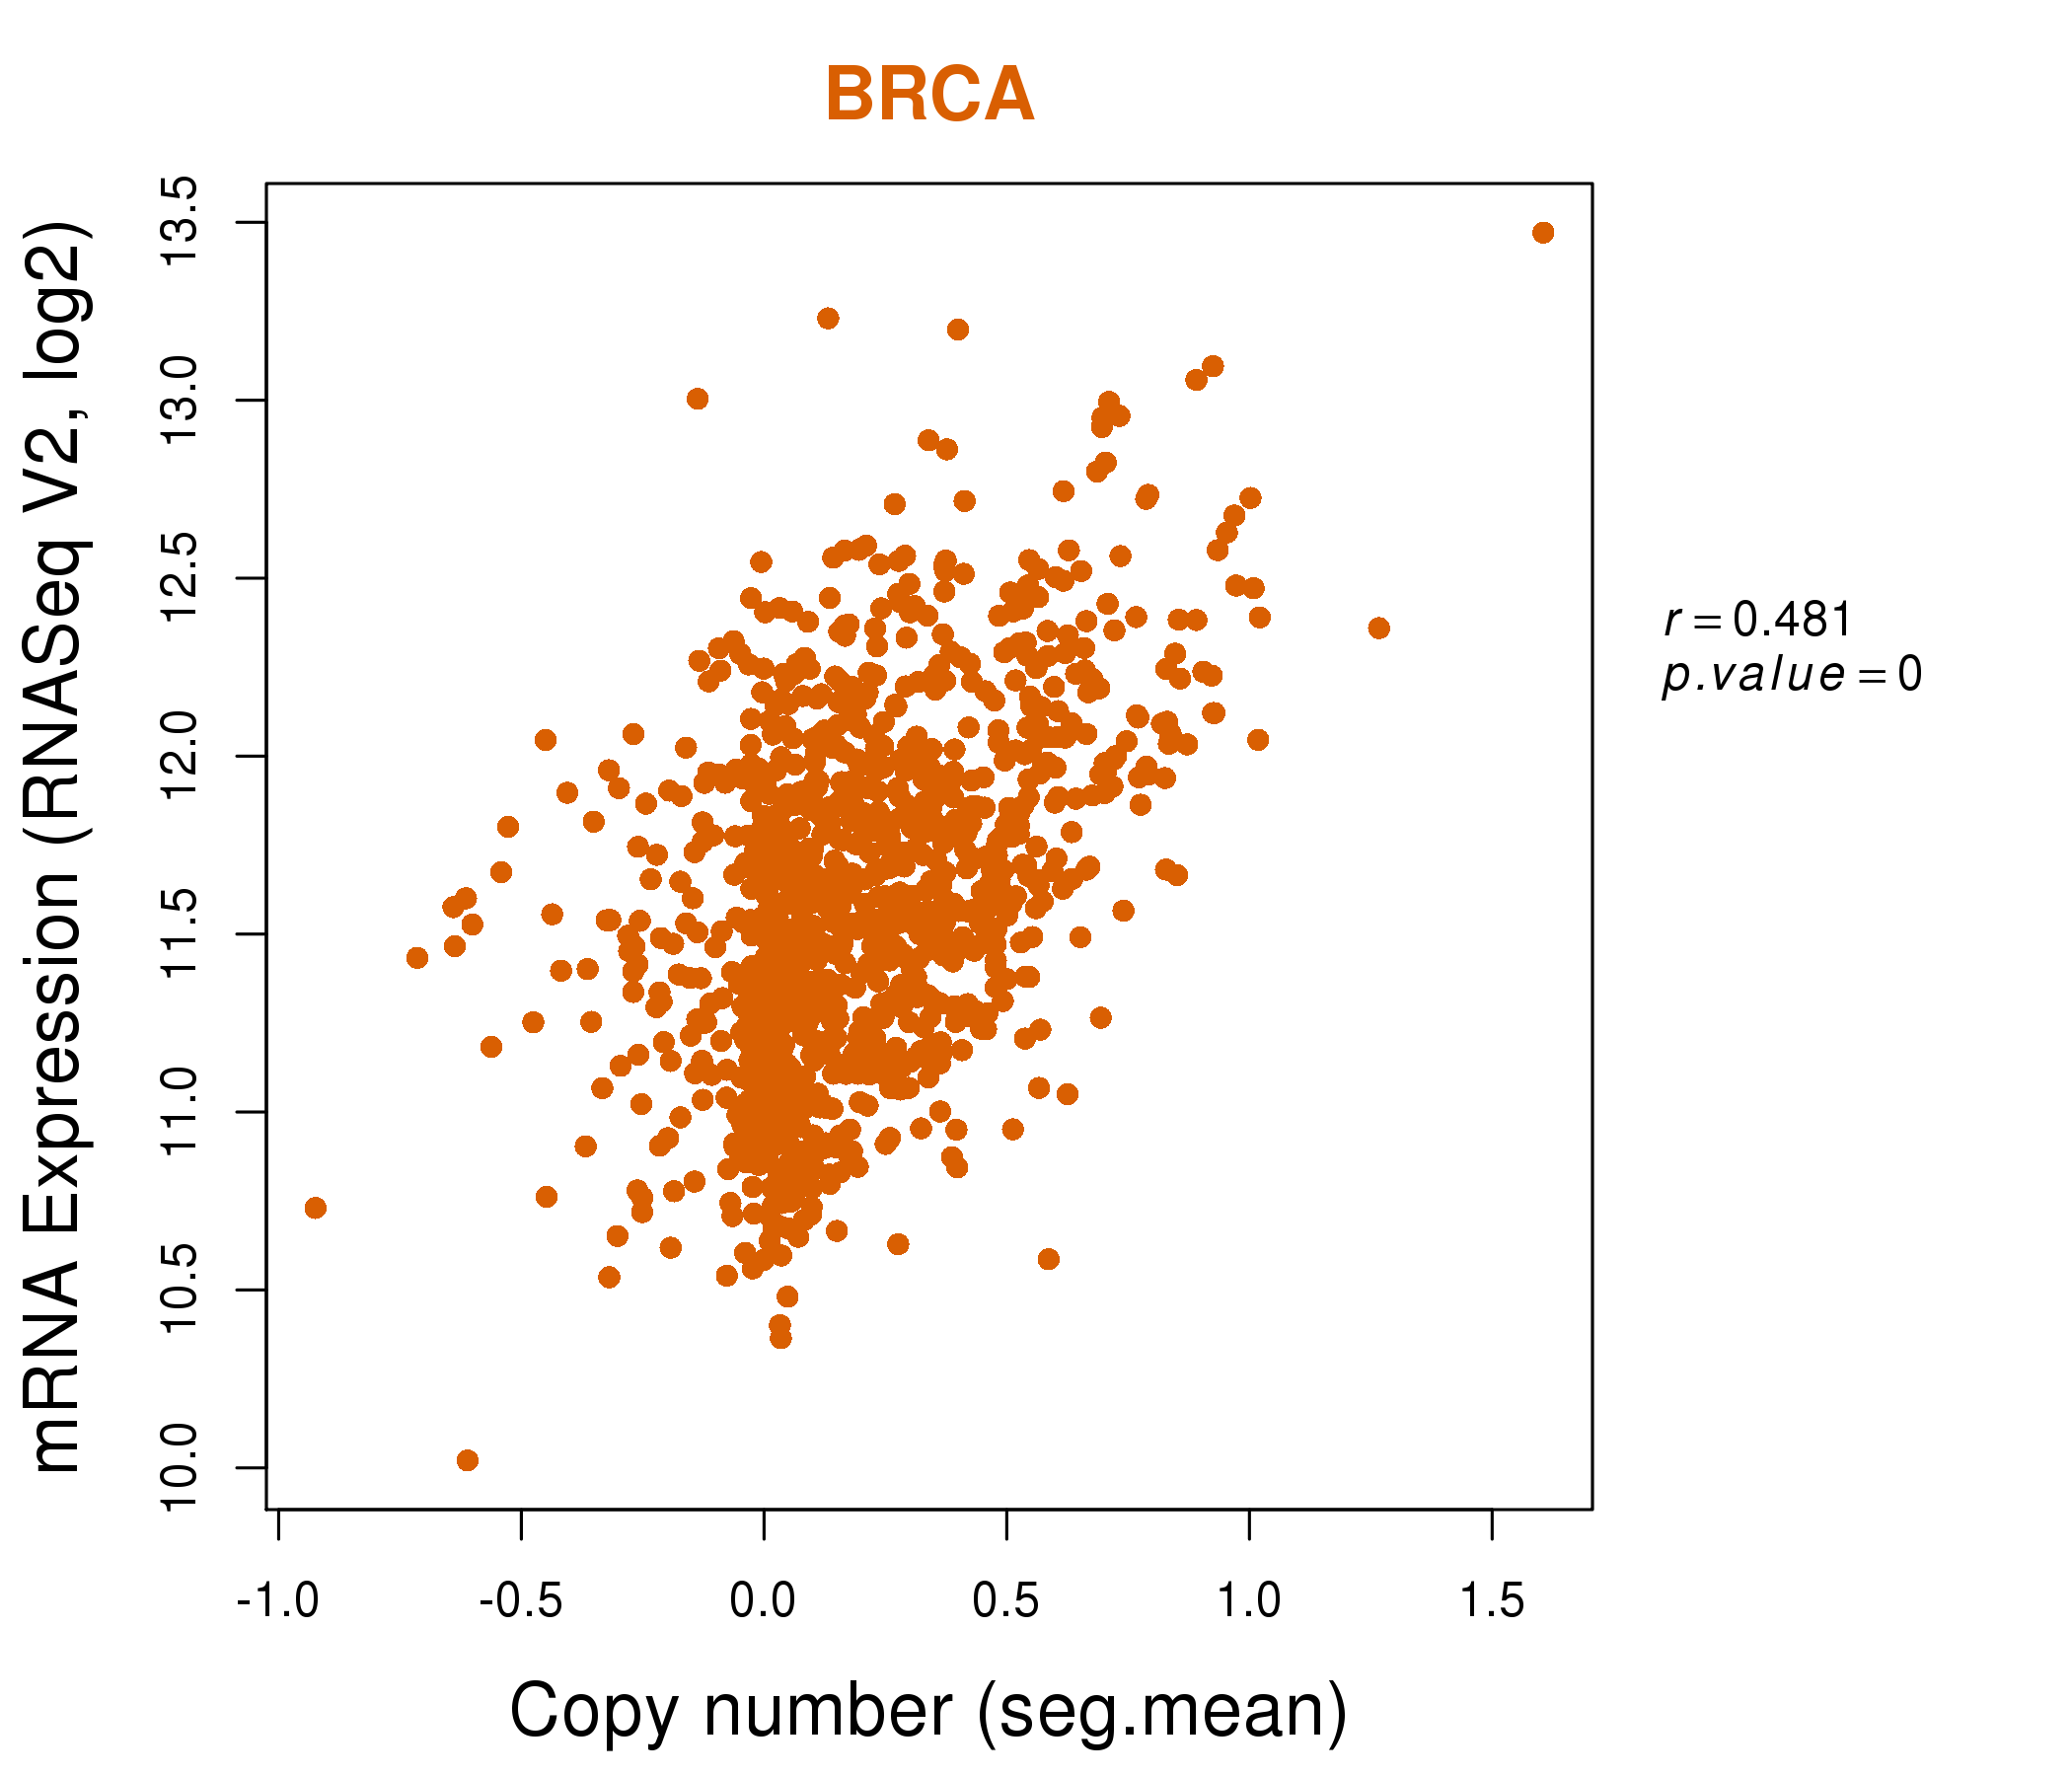
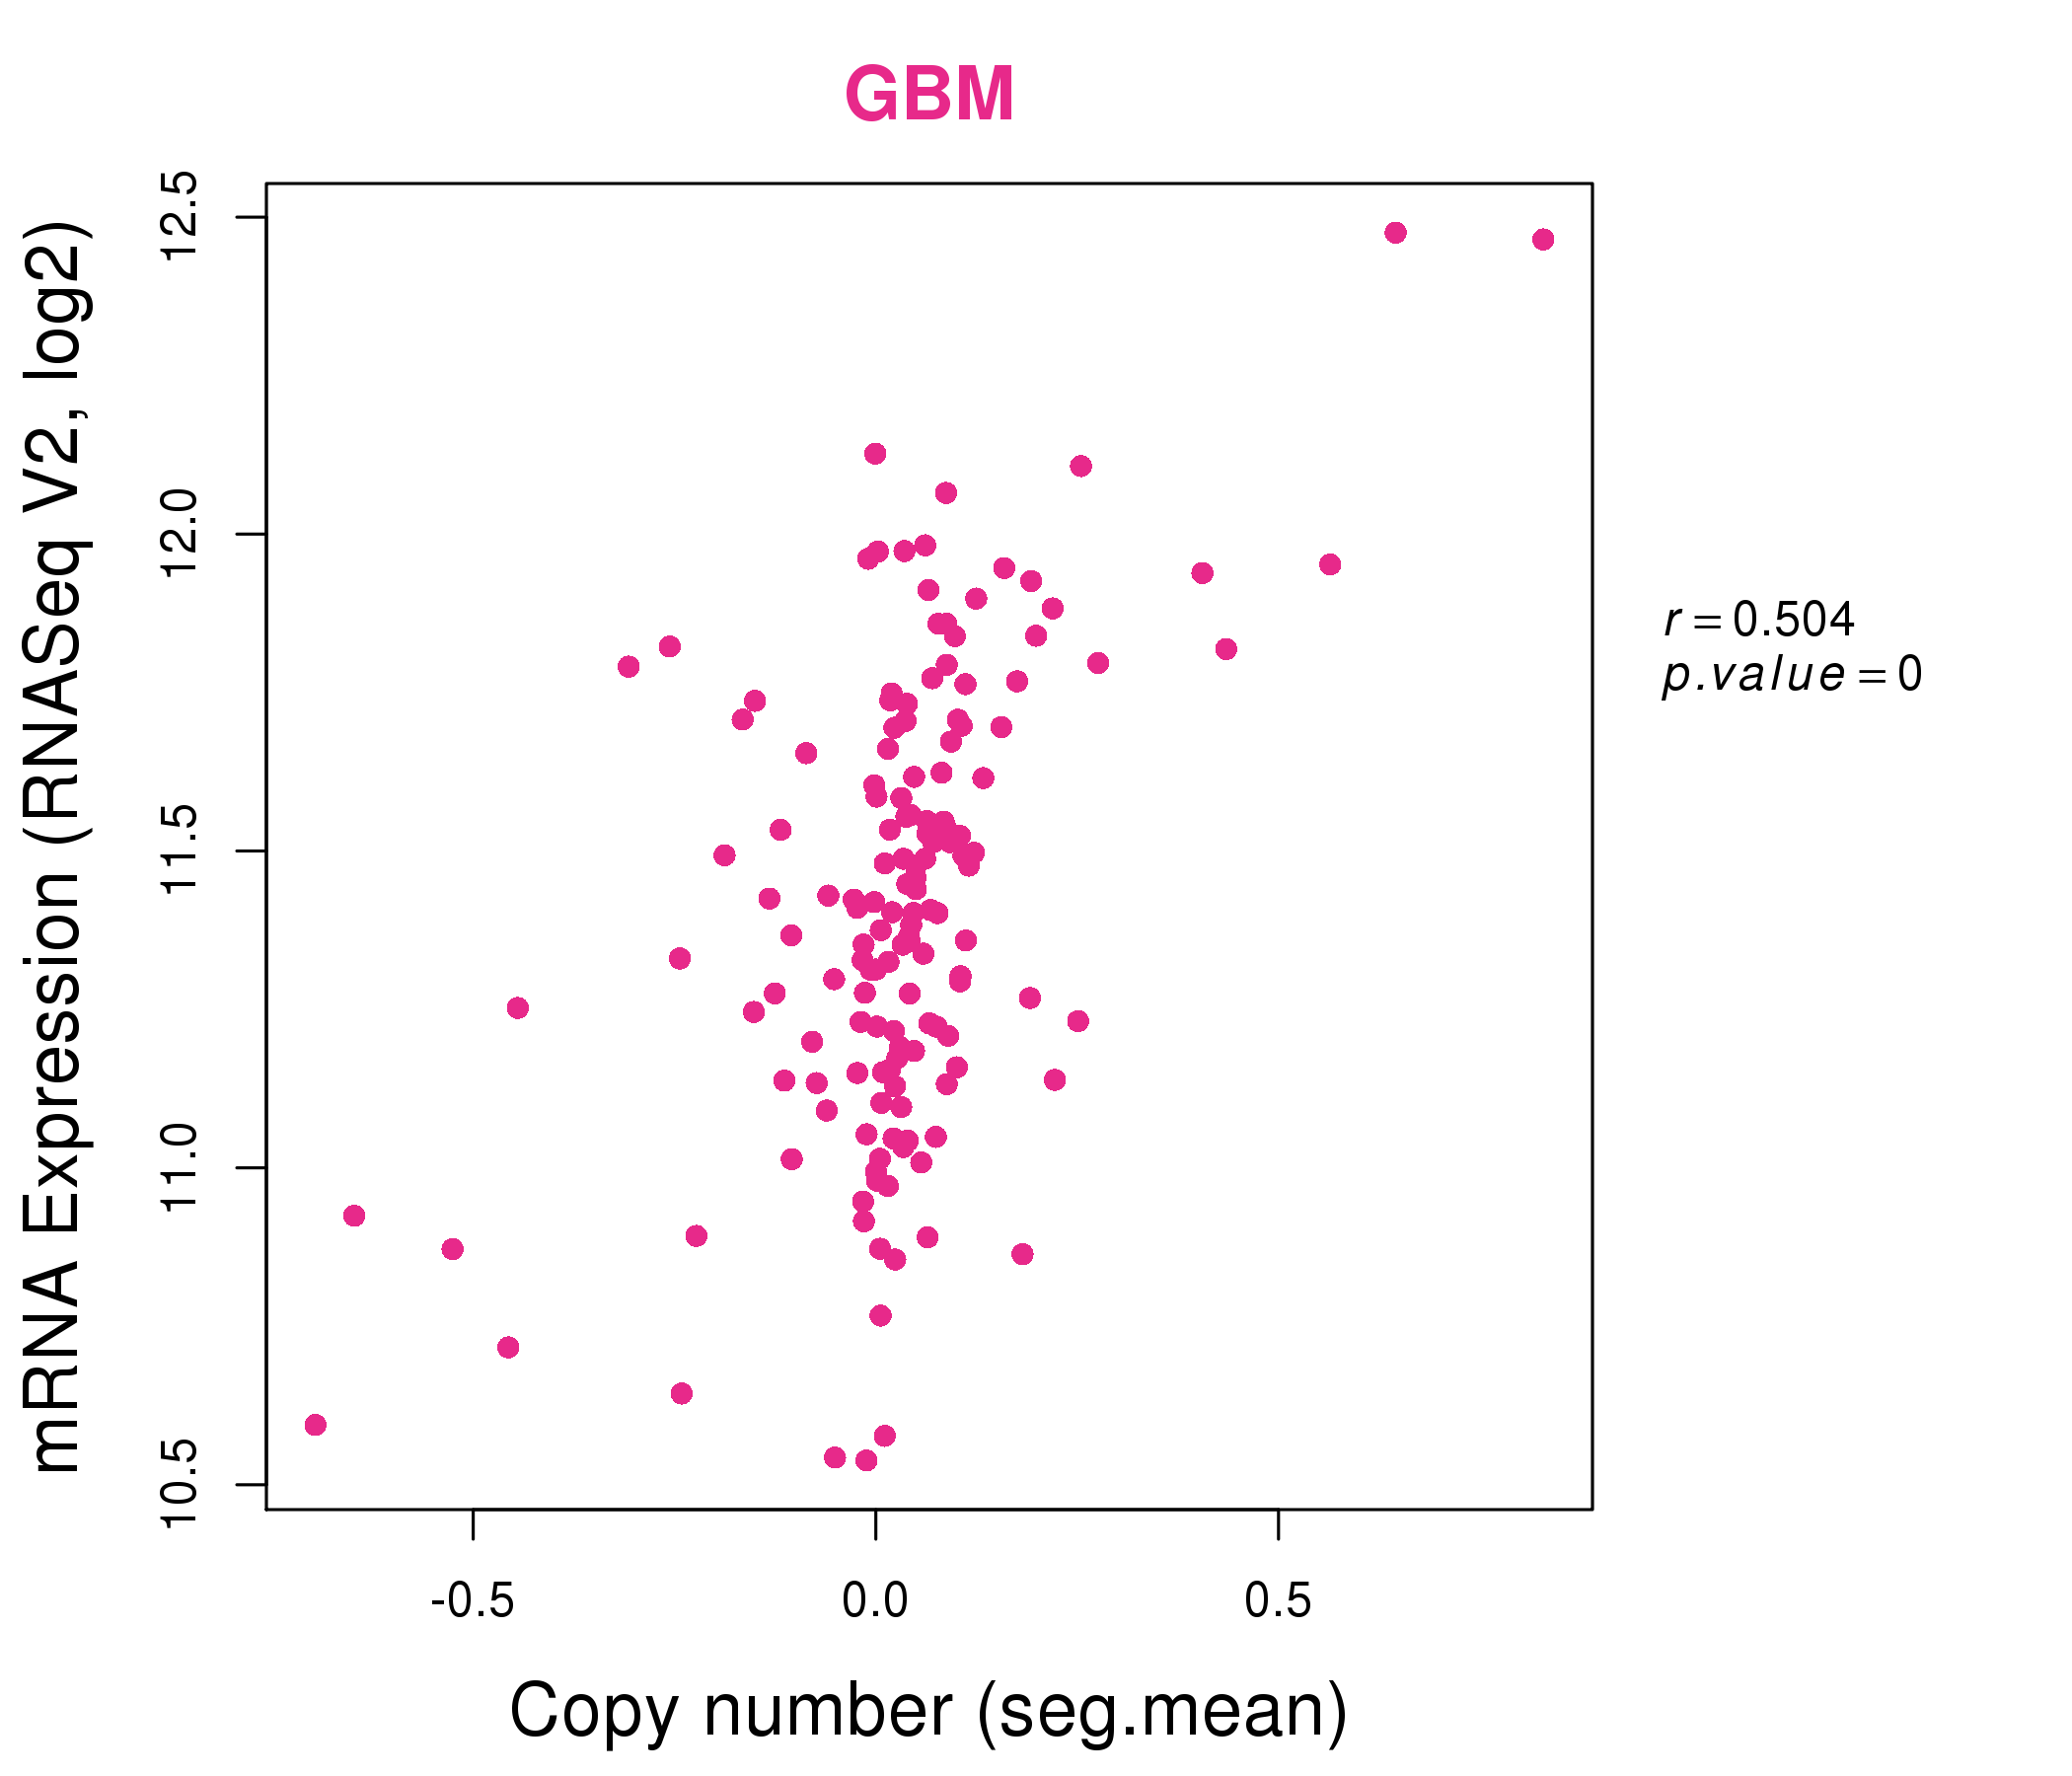
| * Normalized gene expression data of RNASeqV2 was extracted from TCGA using R package TCGA-Assembler. The URLs of all public data files on TCGA DCC data server were gathered at Jan-05-2015. Only eight cancer types have enough normal control samples for differential expression analysis. (t test, adjusted p<0.05 (using Benjamini-Hochberg FDR)) |
 |
| Top |
| * This plots show the correlation between CNV and gene expression. |
: Open all plots for all cancer types
 |
|
 |
|
| Top |
| Gene-Gene Network Information |
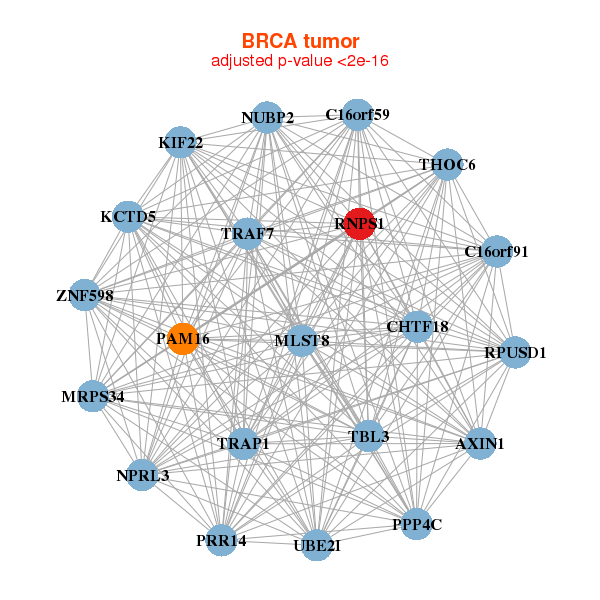
| * Co-Expression network figures were drawn using R package igraph. Only the top 20 genes with the highest correlations were shown. Red circle: input gene, orange circle: cell metabolism gene, sky circle: other gene |
: Open all plots for all cancer types
 |
|
| AXIN1,C16orf59,C16orf91,CHTF18,KCTD5,KIF22,MLST8, MRPS34,NPRL3,NUBP2,PPP4C,PRR14,RNPS1,RPUSD1, TBL3,THOC6,PAM16,TRAF7,TRAP1,UBE2I,ZNF598 | ABT1,BCL2L12,C16orf91,ETHE1,FBRSL1,HSPBP1,KAT8, NSUN5,OTUB1,PRCC,RCE1,RNPS1,RPS21,SF3A2, SLC35C2,SNRPB,TARBP2,THAP7,THOC6,TRIM28,ZNF414 |
 |
|
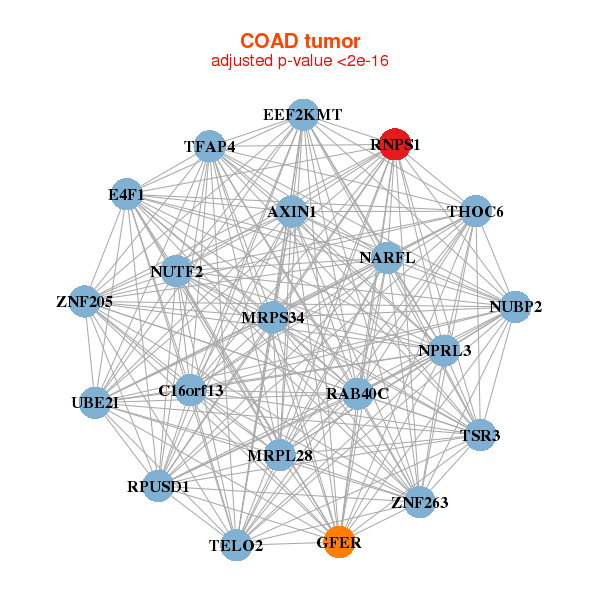
| AXIN1,C16orf13,TSR3,E4F1,EEF2KMT,GFER,MRPL28, MRPS34,NARFL,NPRL3,NUBP2,NUTF2,RAB40C,RNPS1, RPUSD1,TELO2,TFAP4,THOC6,UBE2I,ZNF205,ZNF263 | BYSL,C19orf47,C7orf26,CCDC86,CD3EAP,CDC42EP1,FARSA, GRWD1,MRPL4,NAP1L4,PES1,PPAN,RNPS1,RRP1, RRP9,RUVBL2,SGTA,TOMM40,TRMT1,UBIAD1,ZMYND19 |
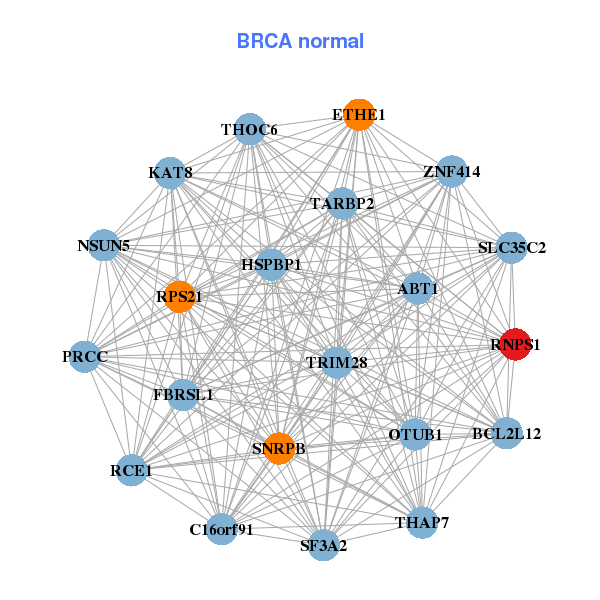
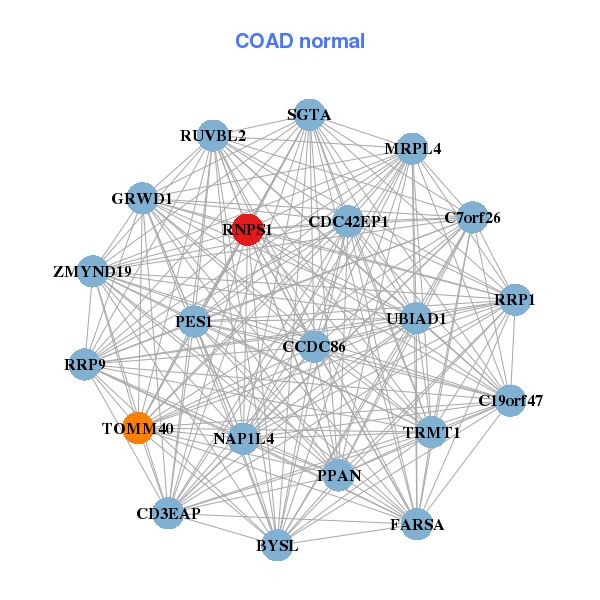
| * Co-Expression network figures were drawn using R package igraph. Only the top 20 genes with the highest correlations were shown. Red circle: input gene, orange circle: cell metabolism gene, sky circle: other gene |
: Open all plots for all cancer types
| Top |
: Open all interacting genes' information including KEGG pathway for all interacting genes from DAVID
| Top |
| Pharmacological Information for RNPS1 |
| There's no related Drug. |
| Top |
| Cross referenced IDs for RNPS1 |
| * We obtained these cross-references from Uniprot database. It covers 150 different DBs, 18 categories. http://www.uniprot.org/help/cross_references_section |
: Open all cross reference information
|
Copyright © 2016-Present - The Univsersity of Texas Health Science Center at Houston @ |