|
||||||||||||||||||||
| |
| Phenotypic Information (metabolism pathway, cancer, disease, phenome) |
| |
| |
| Gene-Gene Network Information: Co-Expression Network, Interacting Genes & KEGG |
| |
|


| Gene Summary for SLC27A5 |
| Basic gene info. | Gene symbol | SLC27A5 |
| Gene name | solute carrier family 27 (fatty acid transporter), member 5 | |
| Synonyms | ACSB|ACSVL6|BACS|BAL|FACVL3|FATP-5|FATP5|VLACSR|VLCS-H2|VLCSH2 | |
| Cytomap | UCSC genome browser: 19q13.43 | |
| Genomic location | chr19 :59009699-59023432 | |
| Type of gene | protein-coding | |
| RefGenes | NM_012254.2, | |
| Ensembl id | ENSG00000083807 | |
| Description | BA-CoA ligaseVLACS-relatedbile acid-CoA ligasebile acyl-CoA synthetasecholate--CoA ligasefatty acid transport protein 5fatty-acid-Coenzyme A ligase, very long-chain 3solute carrier family 27 member 5very long-chain acyl-CoA synthetase homolog 2ve | |
| Modification date | 20141207 | |
| dbXrefs | MIM : 603314 | |
| HGNC : HGNC | ||
| Ensembl : ENSG00000083807 | ||
| HPRD : 04499 | ||
| Vega : OTTHUMG00000183543 | ||
| Protein | UniProt: go to UniProt's Cross Reference DB Table | |
| Expression | CleanEX: HS_SLC27A5 | |
| BioGPS: 10998 | ||
| Gene Expression Atlas: ENSG00000083807 | ||
| The Human Protein Atlas: ENSG00000083807 | ||
| Pathway | NCI Pathway Interaction Database: SLC27A5 | |
| KEGG: SLC27A5 | ||
| REACTOME: SLC27A5 | ||
| ConsensusPathDB | ||
| Pathway Commons: SLC27A5 | ||
| Metabolism | MetaCyc: SLC27A5 | |
| HUMANCyc: SLC27A5 | ||
| Regulation | Ensembl's Regulation: ENSG00000083807 | |
| miRBase: chr19 :59,009,699-59,023,432 | ||
| TargetScan: NM_012254 | ||
| cisRED: ENSG00000083807 | ||
| Context | iHOP: SLC27A5 | |
| cancer metabolism search in PubMed: SLC27A5 | ||
| UCL Cancer Institute: SLC27A5 | ||
| Assigned class in ccmGDB | C | |
| Top |
| Phenotypic Information for SLC27A5(metabolism pathway, cancer, disease, phenome) |
| Cancer | CGAP: SLC27A5 |
| Familial Cancer Database: SLC27A5 | |
| * This gene is included in those cancer gene databases. |
|
|
|
|
|
| . | ||||||||||||||
Oncogene 1 | Significant driver gene in | |||||||||||||||||||
| cf) number; DB name 1 Oncogene; http://nar.oxfordjournals.org/content/35/suppl_1/D721.long, 2 Tumor Suppressor gene; https://bioinfo.uth.edu/TSGene/, 3 Cancer Gene Census; http://www.nature.com/nrc/journal/v4/n3/abs/nrc1299.html, 4 CancerGenes; http://nar.oxfordjournals.org/content/35/suppl_1/D721.long, 5 Network of Cancer Gene; http://ncg.kcl.ac.uk/index.php, 1Therapeutic Vulnerabilities in Cancer; http://cbio.mskcc.org/cancergenomics/statius/ |
| REACTOME_METABOLISM_OF_LIPIDS_AND_LIPOPROTEINS | |
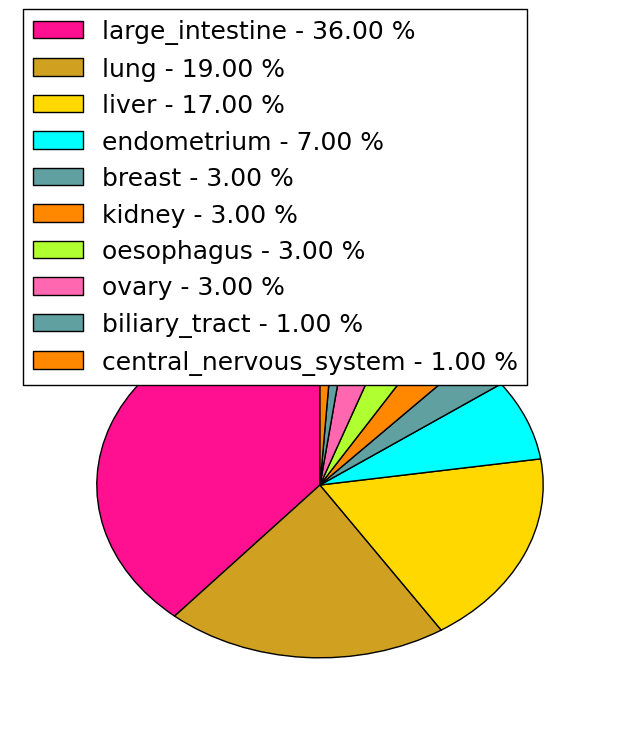
| Mutations for SLC27A5 |
| * Under tables are showing count per each tissue to give us broad intuition about tissue specific mutation patterns.You can go to the detailed page for each mutation database's web site. |
| - Statistics for Tissue and Mutation type | Top |
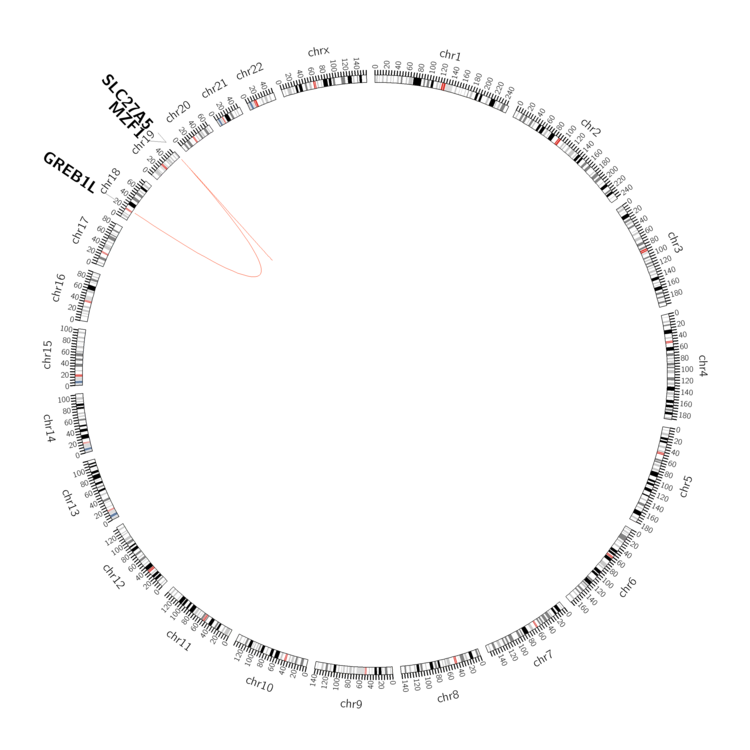 |
| - For Inter-chromosomal Variations |
| * Inter-chromosomal variantions includes 'interchromosomal amplicon to amplicon', 'interchromosomal amplicon to non-amplified dna', 'interchromosomal insertion', 'Interchromosomal unknown type'. |
 |
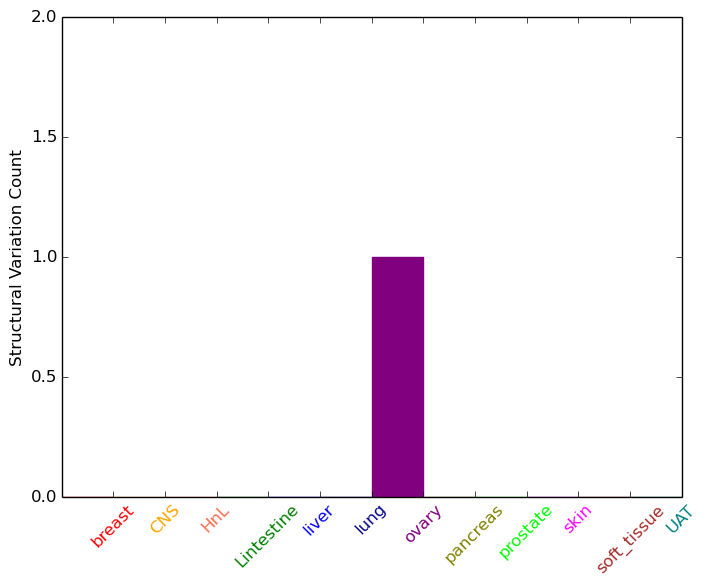
| - For Intra-chromosomal Variations |
| * Intra-chromosomal variantions includes 'intrachromosomal amplicon to amplicon', 'intrachromosomal amplicon to non-amplified dna', 'intrachromosomal deletion', 'intrachromosomal fold-back inversion', 'intrachromosomal inversion', 'intrachromosomal tandem duplication', 'Intrachromosomal unknown type', 'intrachromosomal with inverted orientation', 'intrachromosomal with non-inverted orientation'. |
 |
| Sample | Symbol_a | Chr_a | Start_a | End_a | Symbol_b | Chr_b | Start_b | End_b |
| ovary | SLC27A5 | chr19 | 59019124 | 59019144 | MZF1 | chr19 | 59077200 | 59077220 |
| cf) Tissue number; Tissue name (1;Breast, 2;Central_nervous_system, 3;Haematopoietic_and_lymphoid_tissue, 4;Large_intestine, 5;Liver, 6;Lung, 7;Ovary, 8;Pancreas, 9;Prostate, 10;Skin, 11;Soft_tissue, 12;Upper_aerodigestive_tract) |
| * From mRNA Sanger sequences, Chitars2.0 arranged chimeric transcripts. This table shows SLC27A5 related fusion information. |
| ID | Head Gene | Tail Gene | Accession | Gene_a | qStart_a | qEnd_a | Chromosome_a | tStart_a | tEnd_a | Gene_a | qStart_a | qEnd_a | Chromosome_a | tStart_a | tEnd_a |
| AA457551 | SLC27A5 | 1 | 56 | 19 | 59014991 | 59015502 | ESRRG | 40 | 74 | 1 | 216730758 | 216731096 | |
| DA285853 | SNHG1 | 2 | 59 | 11 | 62621379 | 62621436 | SLC27A5 | 47 | 485 | 19 | 59022932 | 59023364 | |
| Top |
| There's no copy number variation information in COSMIC data for this gene. |
| Top |
|
 |
| Top |
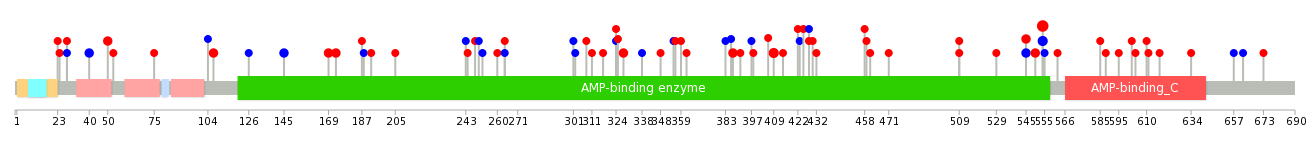
| Stat. for Non-Synonymous SNVs (# total SNVs=52) | (# total SNVs=16) |
 | 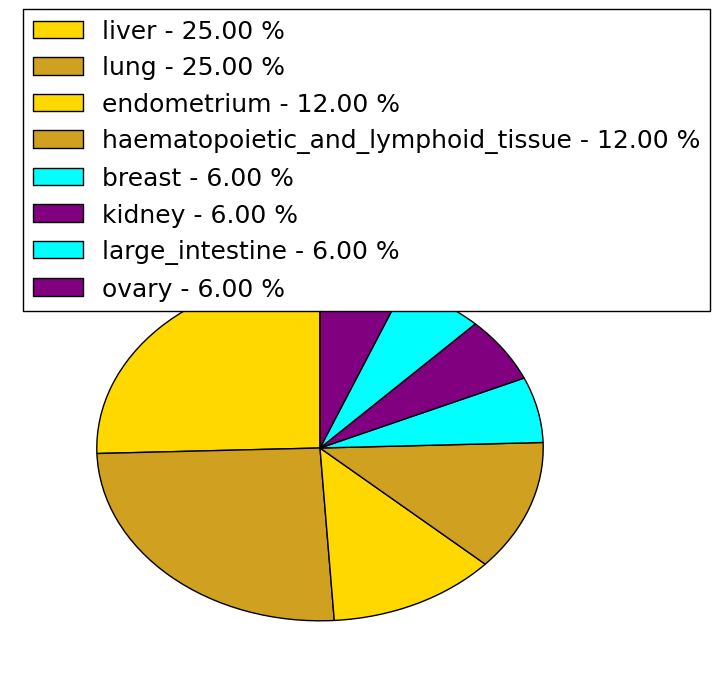 |
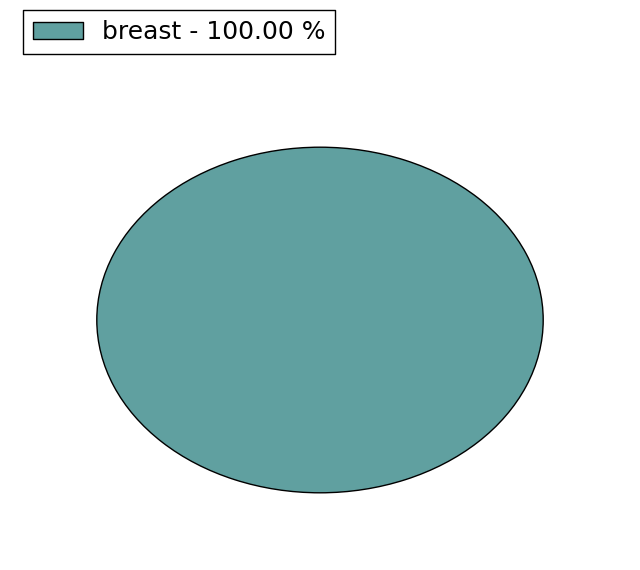
(# total SNVs=2) | (# total SNVs=1) |
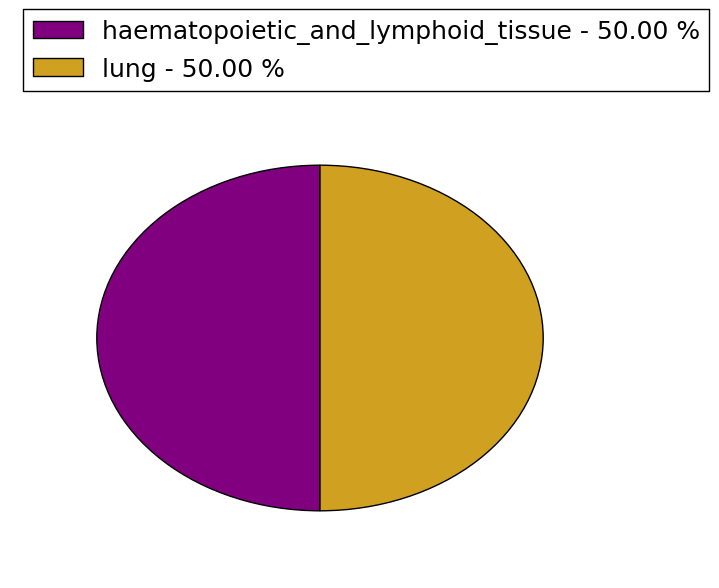 |  |
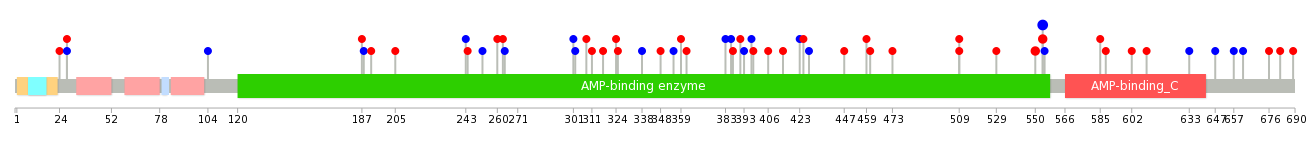
| Top |
| * When you move the cursor on each content, you can see more deailed mutation information on the Tooltip. Those are primary_site,primary_histology,mutation(aa),pubmedID. |
| GRCh37 position | Mutation(aa) | Unique sampleID count |
| chr19:59010865-59010865 | p.T554I | 4 |
| chr19:59012030-59012030 | p.N409T | 3 |
| chr19:59010864-59010864 | p.T554T | 3 |
| chr19:59010864-59010865 | p.T554I | 2 |
| chr19:59022196-59022196 | p.L264M | 2 |
| chr19:59023174-59023174 | p.M50T | 2 |
| chr19:59022806-59022806 | p.E173Q | 2 |
| chr19:59023203-59023203 | p.P40P | 2 |
| chr19:59010878-59010878 | p.R550C | 2 |
| chr19:59021289-59021289 | p.D328N | 2 |
| Top |
|
 |
| Point Mutation/ Tissue ID | 1 | 2 | 3 | 4 | 5 | 6 | 7 | 8 | 9 | 10 | 11 | 12 | 13 | 14 | 15 | 16 | 17 | 18 | 19 | 20 |
| # sample | 4 | 3 | 9 | 3 | 3 | 4 | 6 | 2 | 13 | 6 | 5 | |||||||||
| # mutation | 4 | 3 | 9 | 4 | 3 | 4 | 6 | 2 | 11 | 8 | 5 | |||||||||
| nonsynonymous SNV | 3 | 2 | 8 | 2 | 2 | 2 | 4 | 1 | 4 | 5 | 3 | |||||||||
| synonymous SNV | 1 | 1 | 1 | 2 | 1 | 2 | 2 | 1 | 7 | 3 | 2 |
| cf) Tissue ID; Tissue type (1; BLCA[Bladder Urothelial Carcinoma], 2; BRCA[Breast invasive carcinoma], 3; CESC[Cervical squamous cell carcinoma and endocervical adenocarcinoma], 4; COAD[Colon adenocarcinoma], 5; GBM[Glioblastoma multiforme], 6; Glioma Low Grade, 7; HNSC[Head and Neck squamous cell carcinoma], 8; KICH[Kidney Chromophobe], 9; KIRC[Kidney renal clear cell carcinoma], 10; KIRP[Kidney renal papillary cell carcinoma], 11; LAML[Acute Myeloid Leukemia], 12; LUAD[Lung adenocarcinoma], 13; LUSC[Lung squamous cell carcinoma], 14; OV[Ovarian serous cystadenocarcinoma ], 15; PAAD[Pancreatic adenocarcinoma], 16; PRAD[Prostate adenocarcinoma], 17; SKCM[Skin Cutaneous Melanoma], 18:STAD[Stomach adenocarcinoma], 19:THCA[Thyroid carcinoma], 20:UCEC[Uterine Corpus Endometrial Carcinoma]) |
| Top |
| * We represented just top 10 SNVs. When you move the cursor on each content, you can see more deailed mutation information on the Tooltip. Those are primary_site, primary_histology, mutation(aa), pubmedID. |
| Genomic Position | Mutation(aa) | Unique sampleID count |
| chr19:59010864 | p.T554T | 4 |
| chr19:59010865 | p.T554I | 2 |
| chr19:59010878 | p.R550C | 2 |
| chr19:59011000 | p.F555F | 1 |
| chr19:59022207 | p.D398N | 1 |
| chr19:59012064 | p.T308A | 1 |
| chr19:59023253 | p.V24M | 1 |
| chr19:59010056 | p.E397E | 1 |
| chr19:59021257 | p.P302P | 1 |
| chr19:59011001 | p.P393P | 1 |
| * Copy number data were extracted from TCGA using R package TCGA-Assembler. The URLs of all public data files on TCGA DCC data server were gathered on Jan-05-2015. Function ProcessCNAData in TCGA-Assembler package was used to obtain gene-level copy number value which is calculated as the average copy number of the genomic region of a gene. |
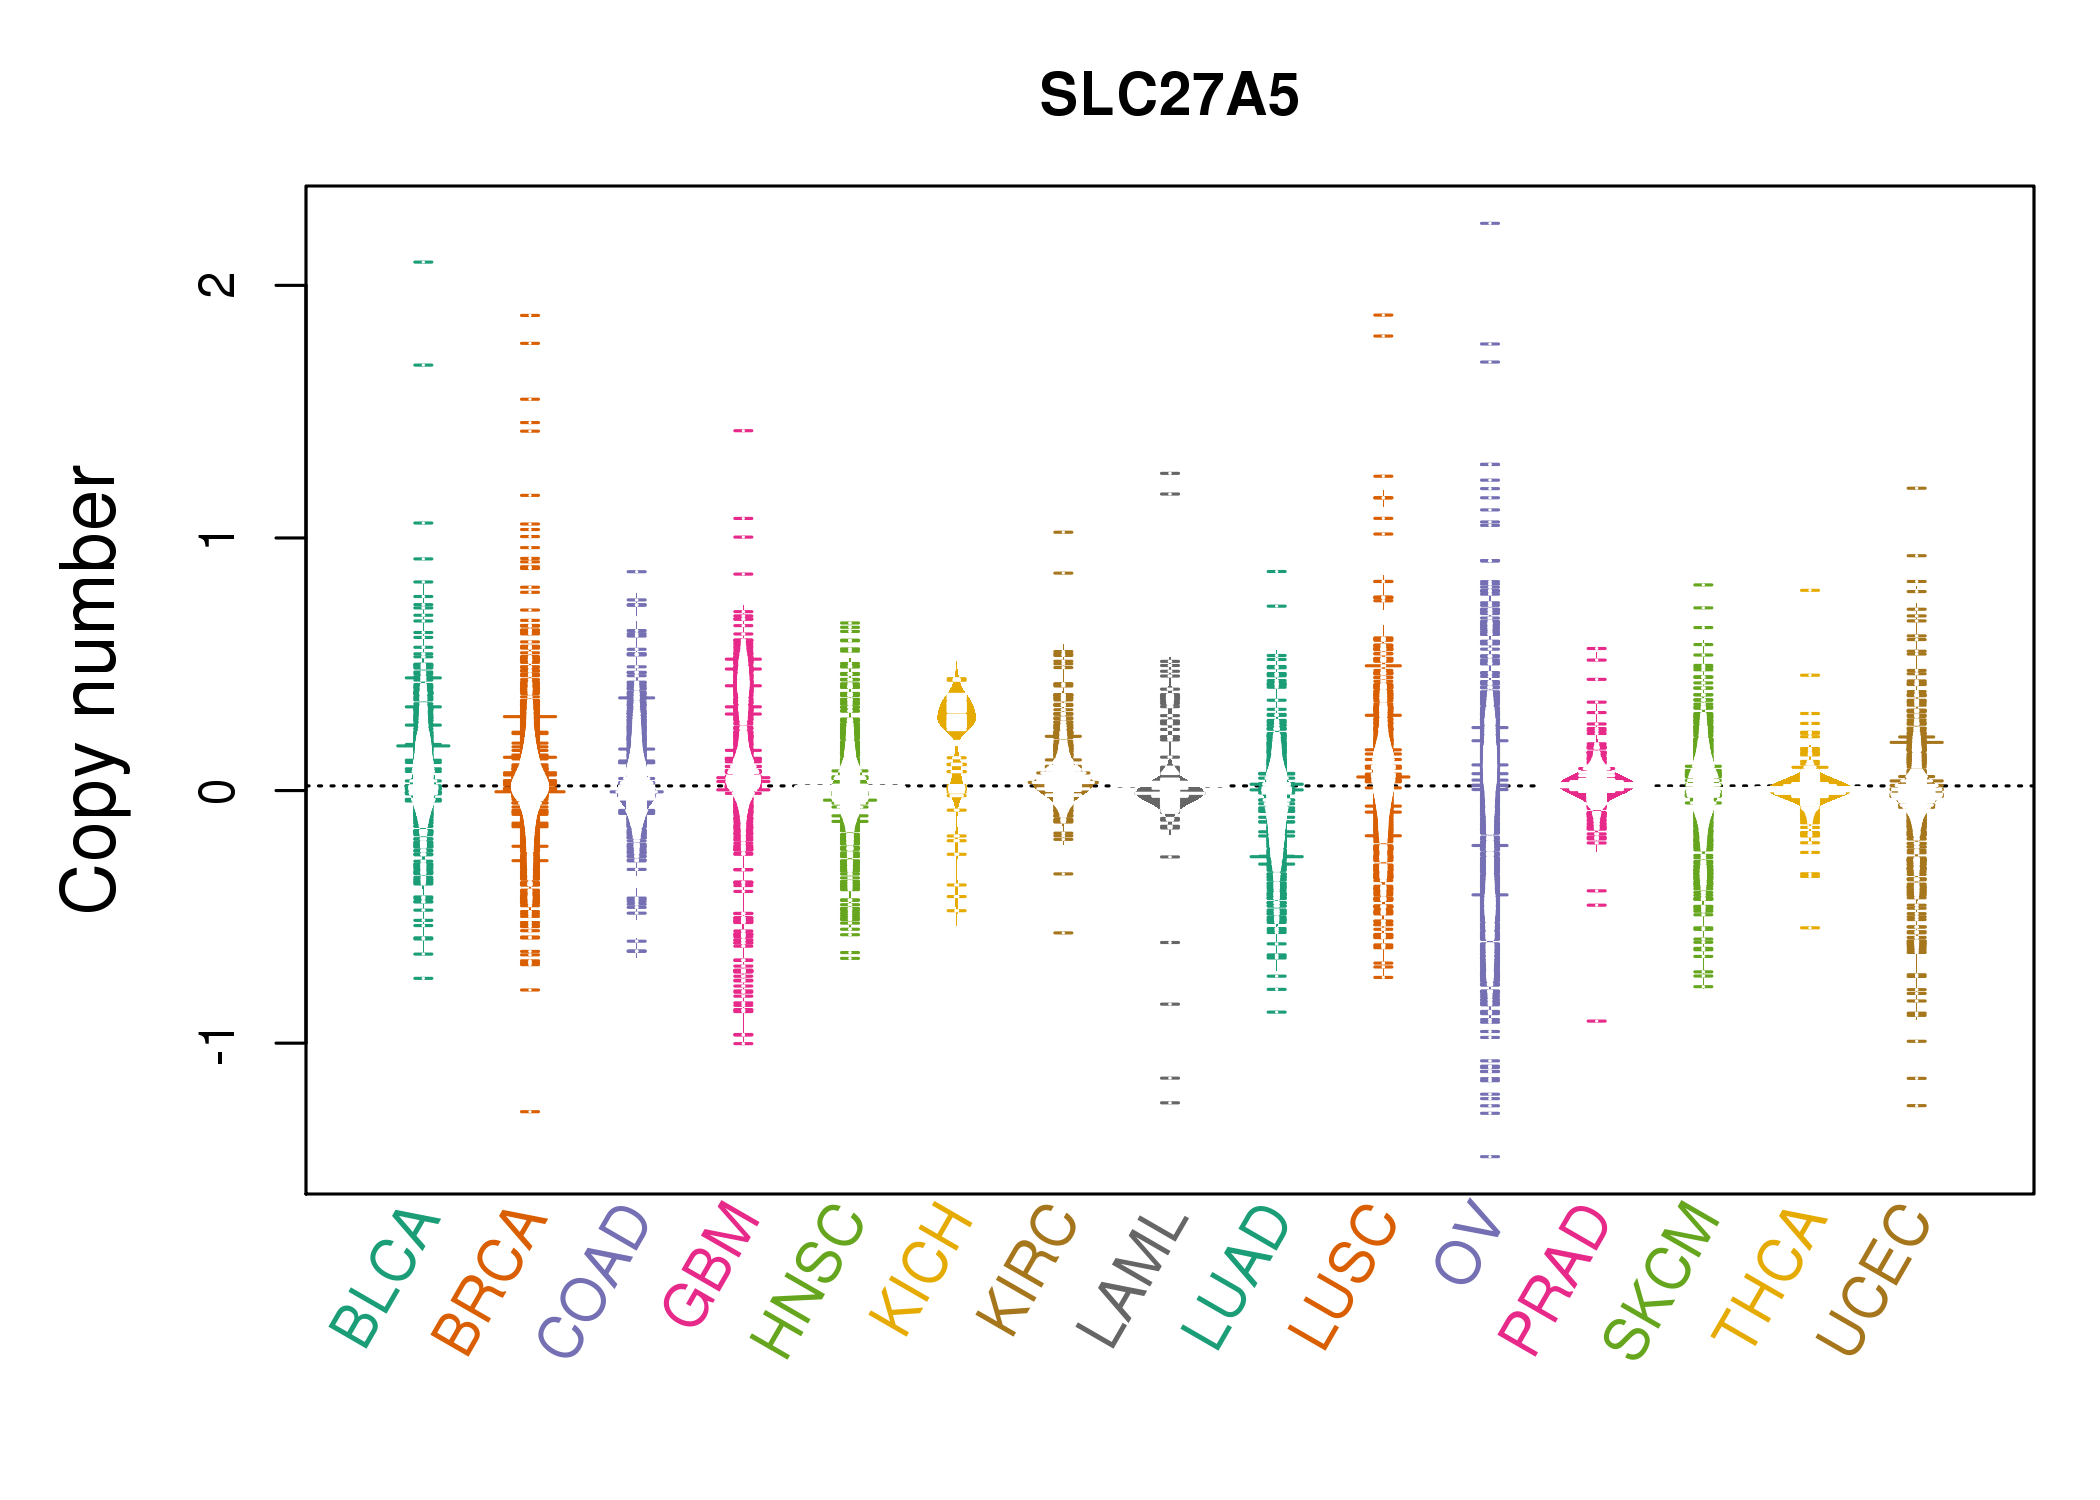 |
| cf) Tissue ID[Tissue type]: BLCA[Bladder Urothelial Carcinoma], BRCA[Breast invasive carcinoma], CESC[Cervical squamous cell carcinoma and endocervical adenocarcinoma], COAD[Colon adenocarcinoma], GBM[Glioblastoma multiforme], Glioma Low Grade, HNSC[Head and Neck squamous cell carcinoma], KICH[Kidney Chromophobe], KIRC[Kidney renal clear cell carcinoma], KIRP[Kidney renal papillary cell carcinoma], LAML[Acute Myeloid Leukemia], LUAD[Lung adenocarcinoma], LUSC[Lung squamous cell carcinoma], OV[Ovarian serous cystadenocarcinoma ], PAAD[Pancreatic adenocarcinoma], PRAD[Prostate adenocarcinoma], SKCM[Skin Cutaneous Melanoma], STAD[Stomach adenocarcinoma], THCA[Thyroid carcinoma], UCEC[Uterine Corpus Endometrial Carcinoma] |
| Top |
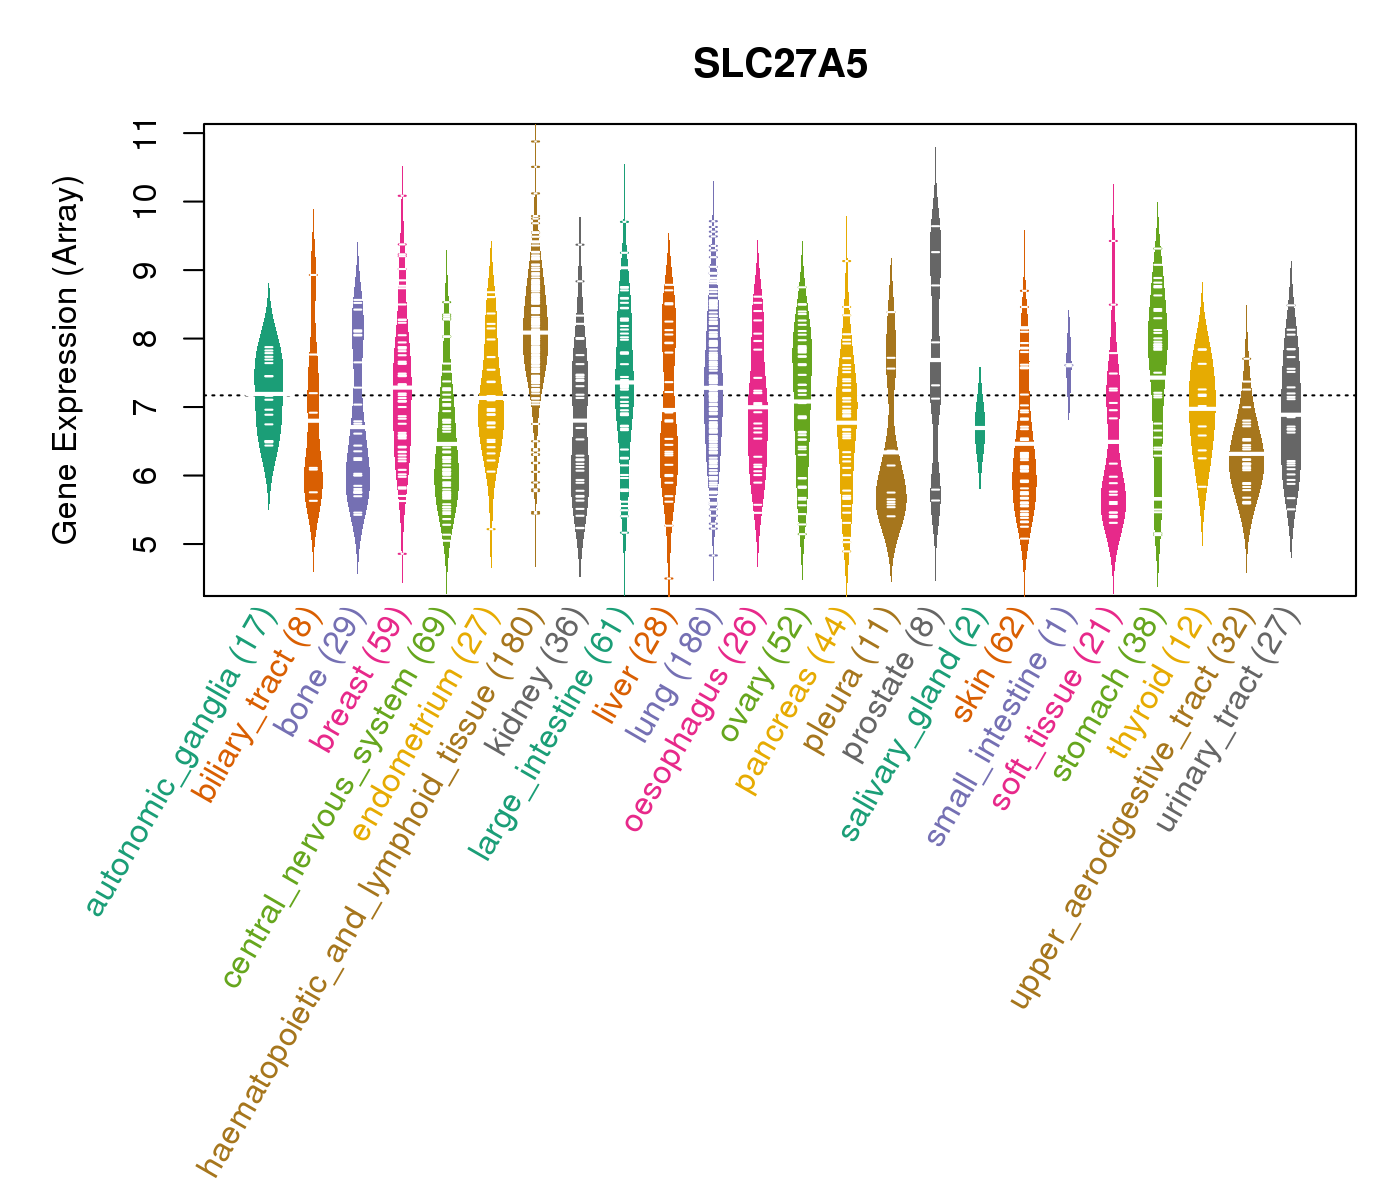
| Gene Expression for SLC27A5 |
| * CCLE gene expression data were extracted from CCLE_Expression_Entrez_2012-10-18.res: Gene-centric RMA-normalized mRNA expression data. |
 |
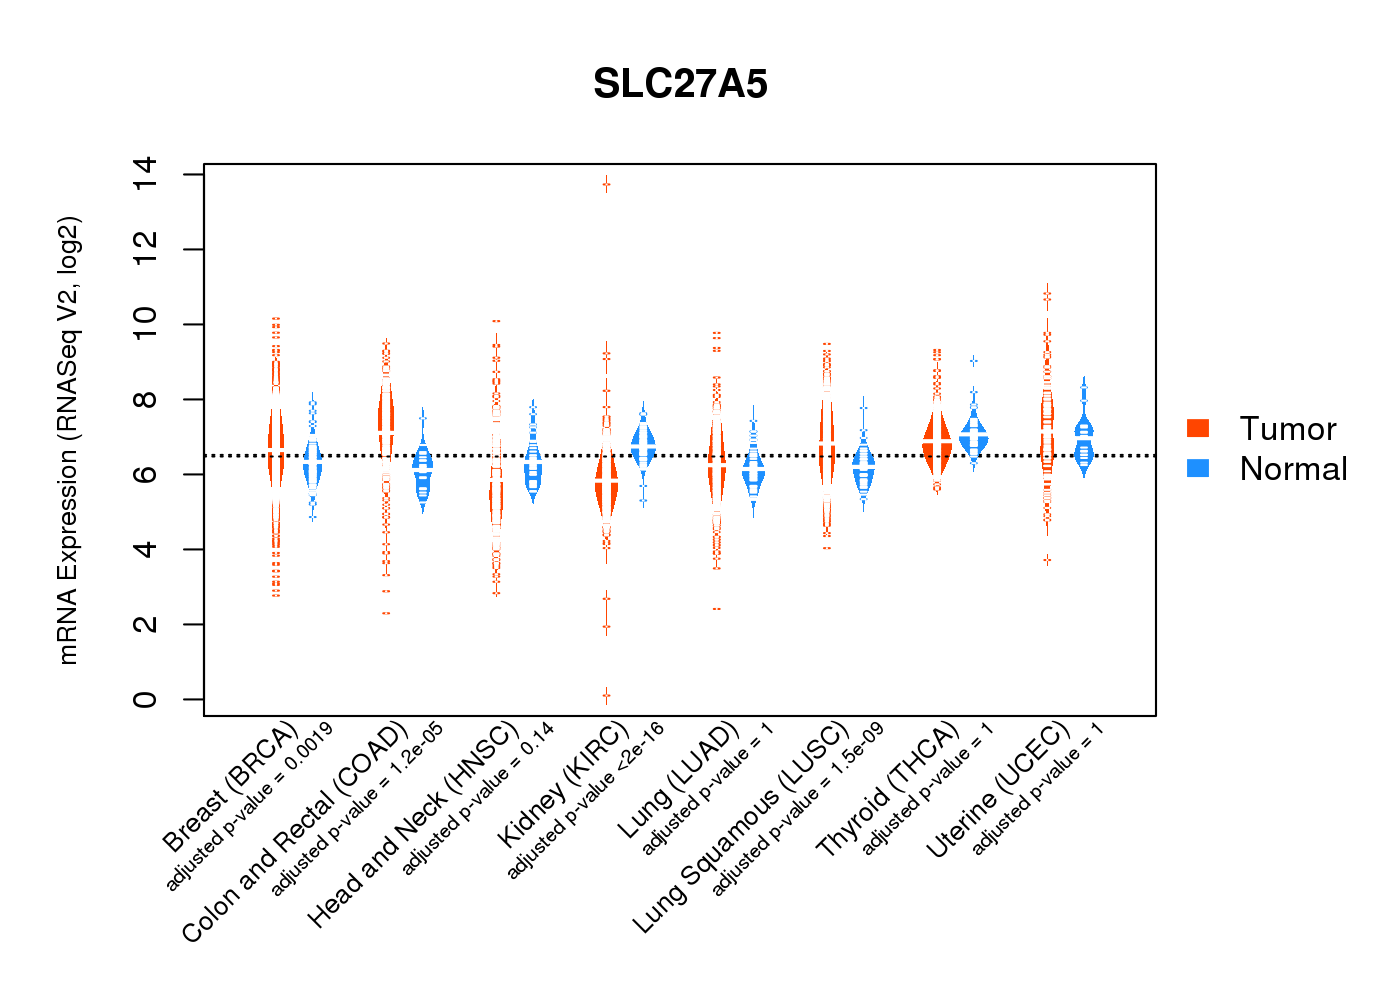
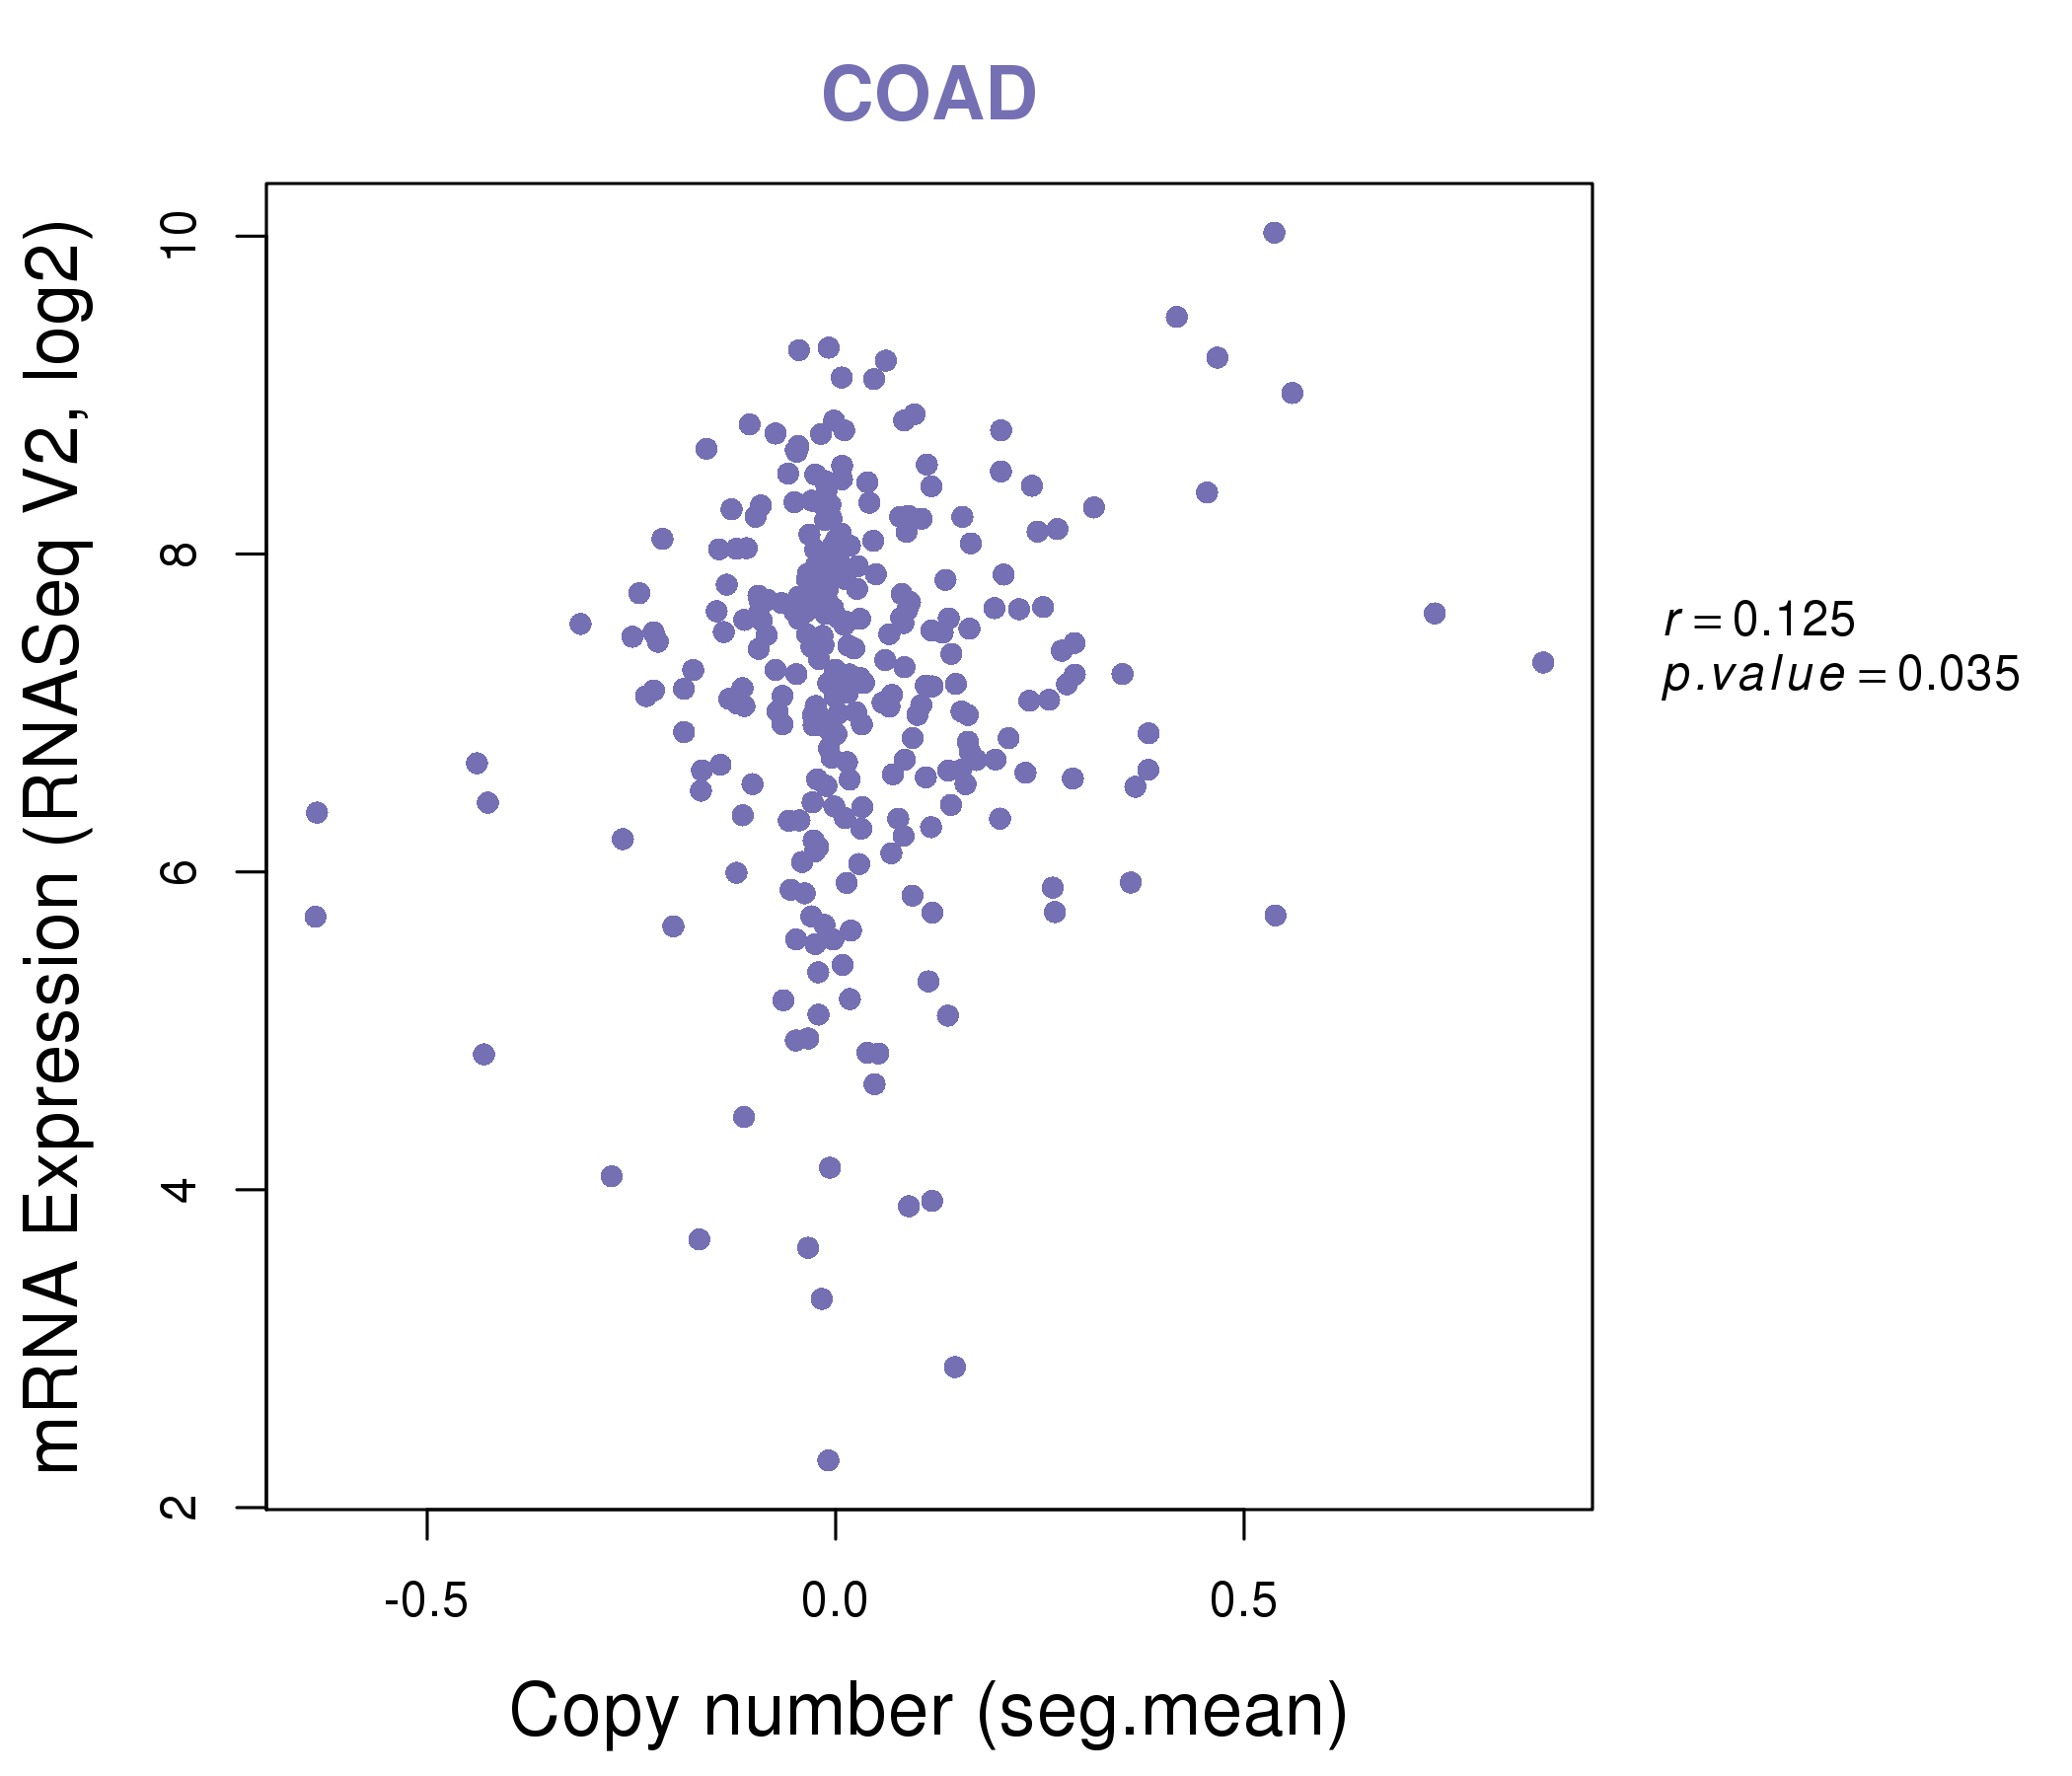
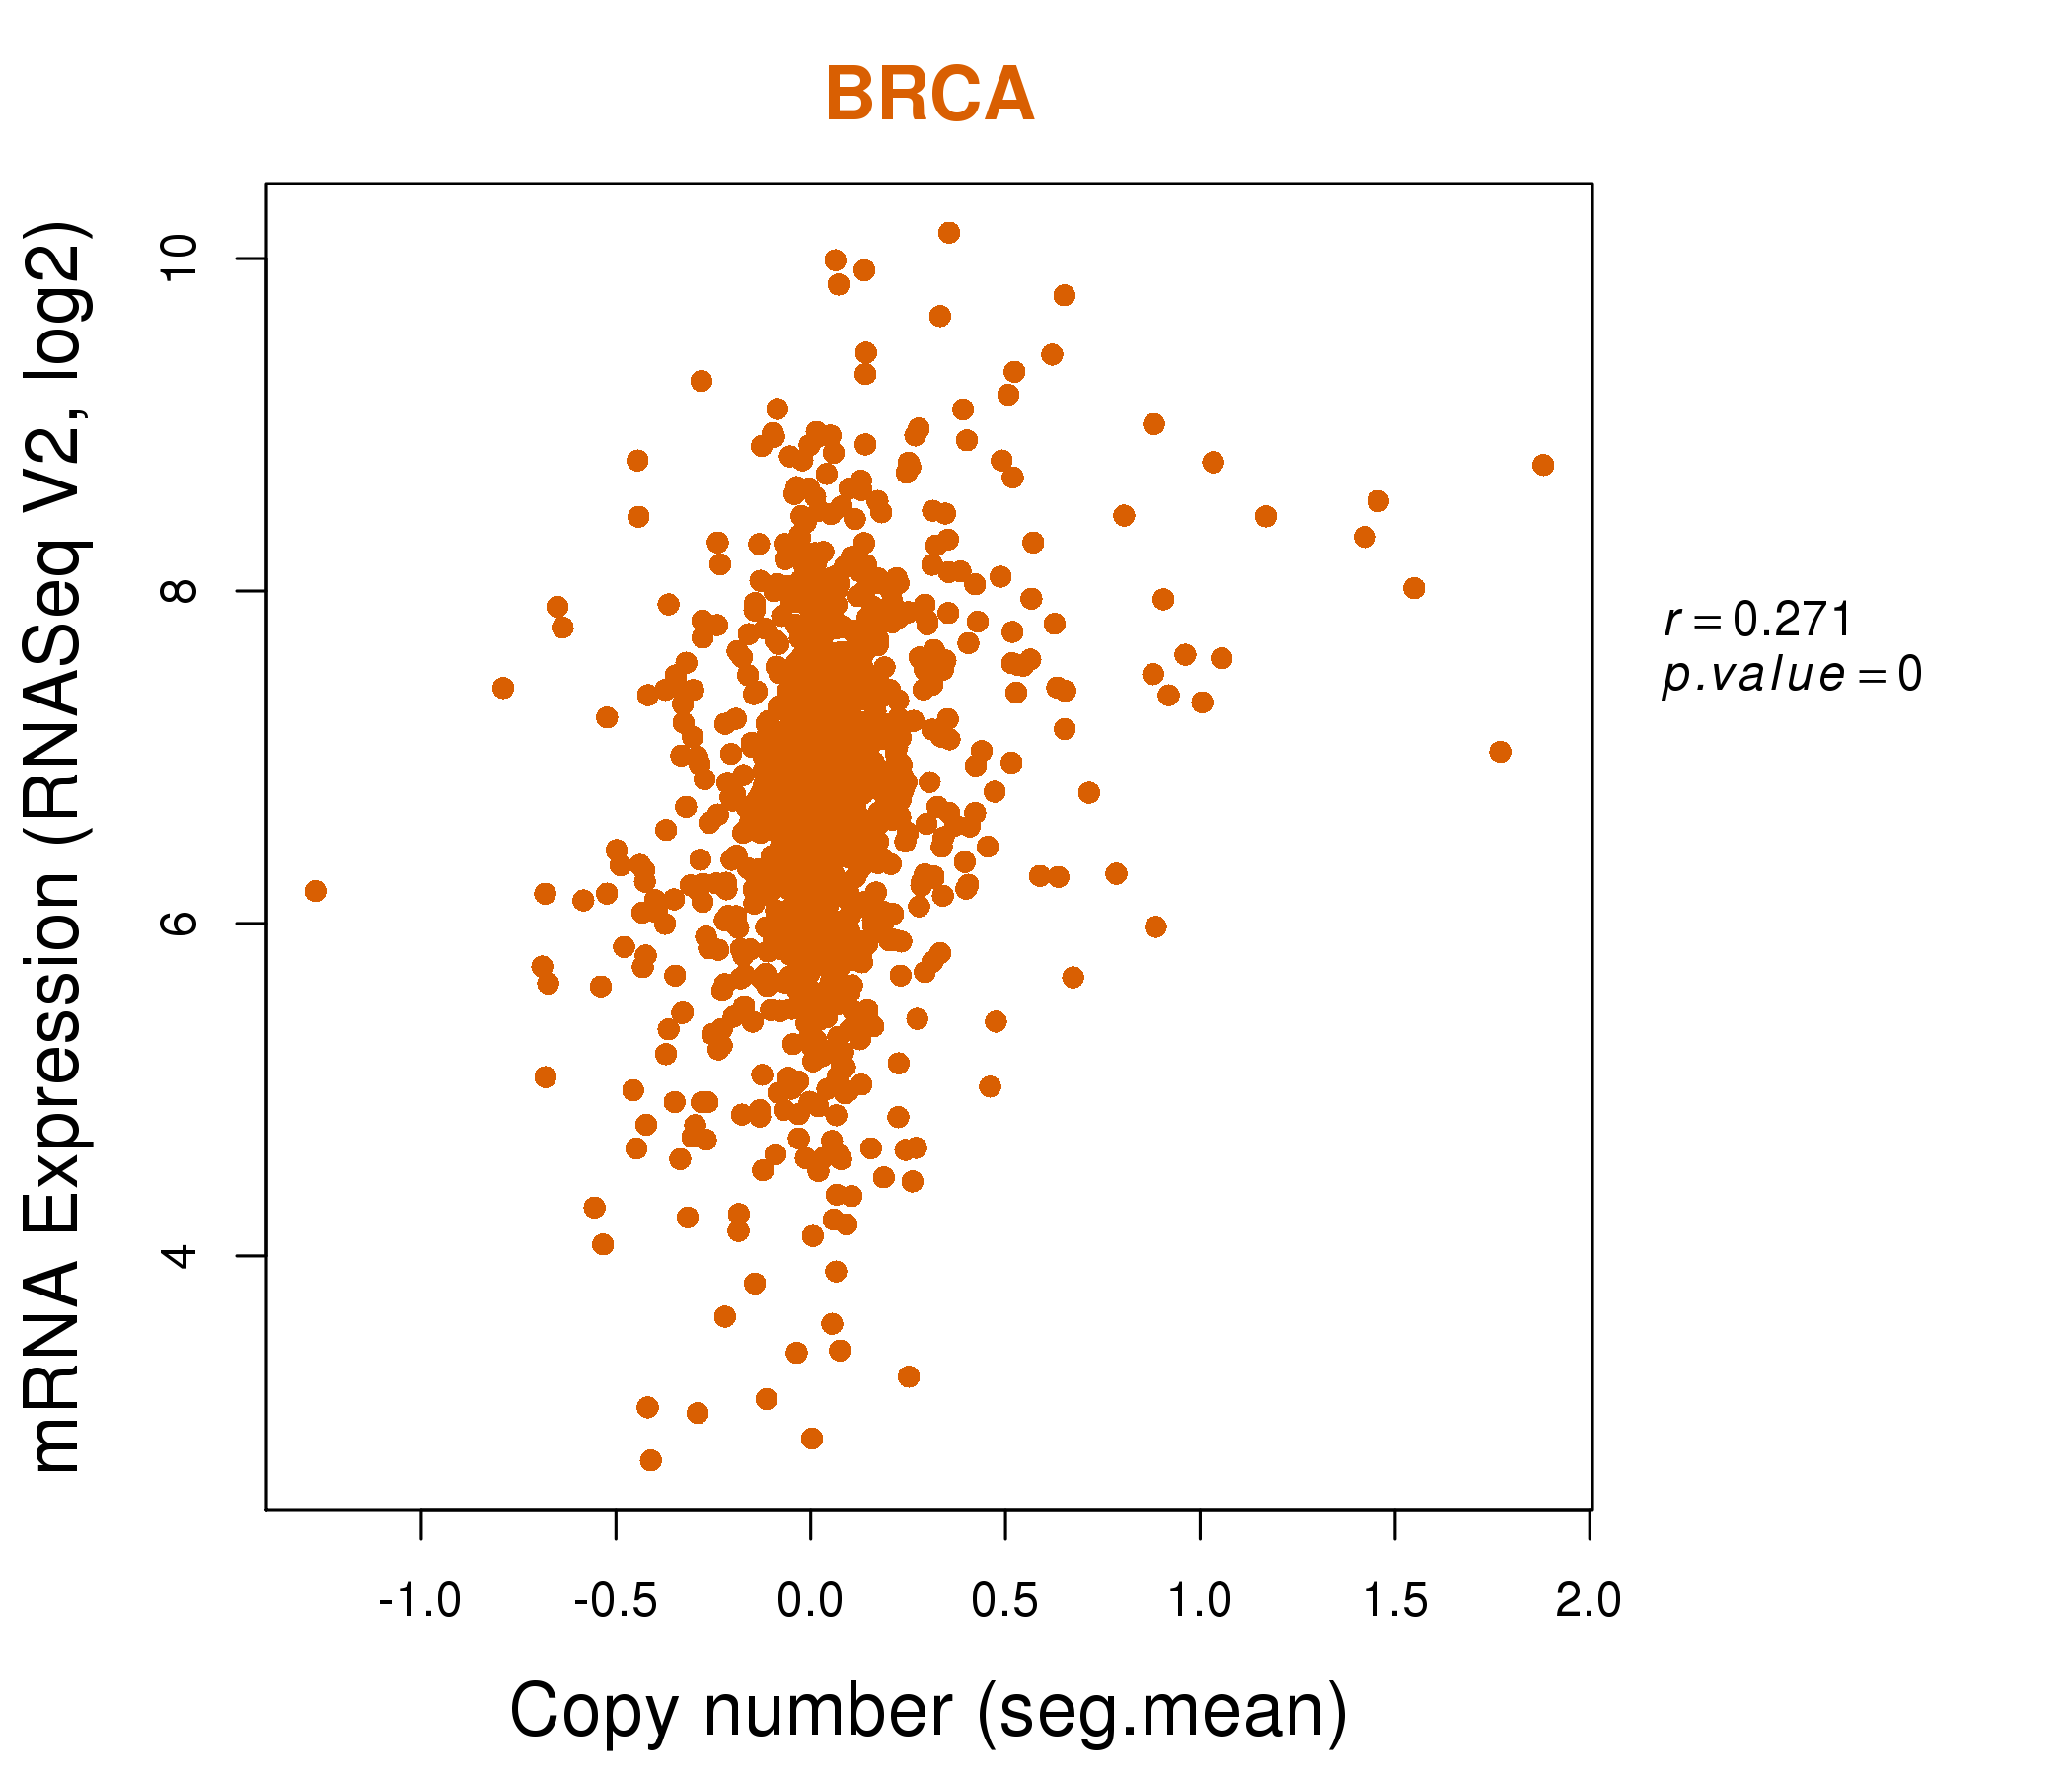
| * Normalized gene expression data of RNASeqV2 was extracted from TCGA using R package TCGA-Assembler. The URLs of all public data files on TCGA DCC data server were gathered at Jan-05-2015. Only eight cancer types have enough normal control samples for differential expression analysis. (t test, adjusted p<0.05 (using Benjamini-Hochberg FDR)) |
 |
| Top |
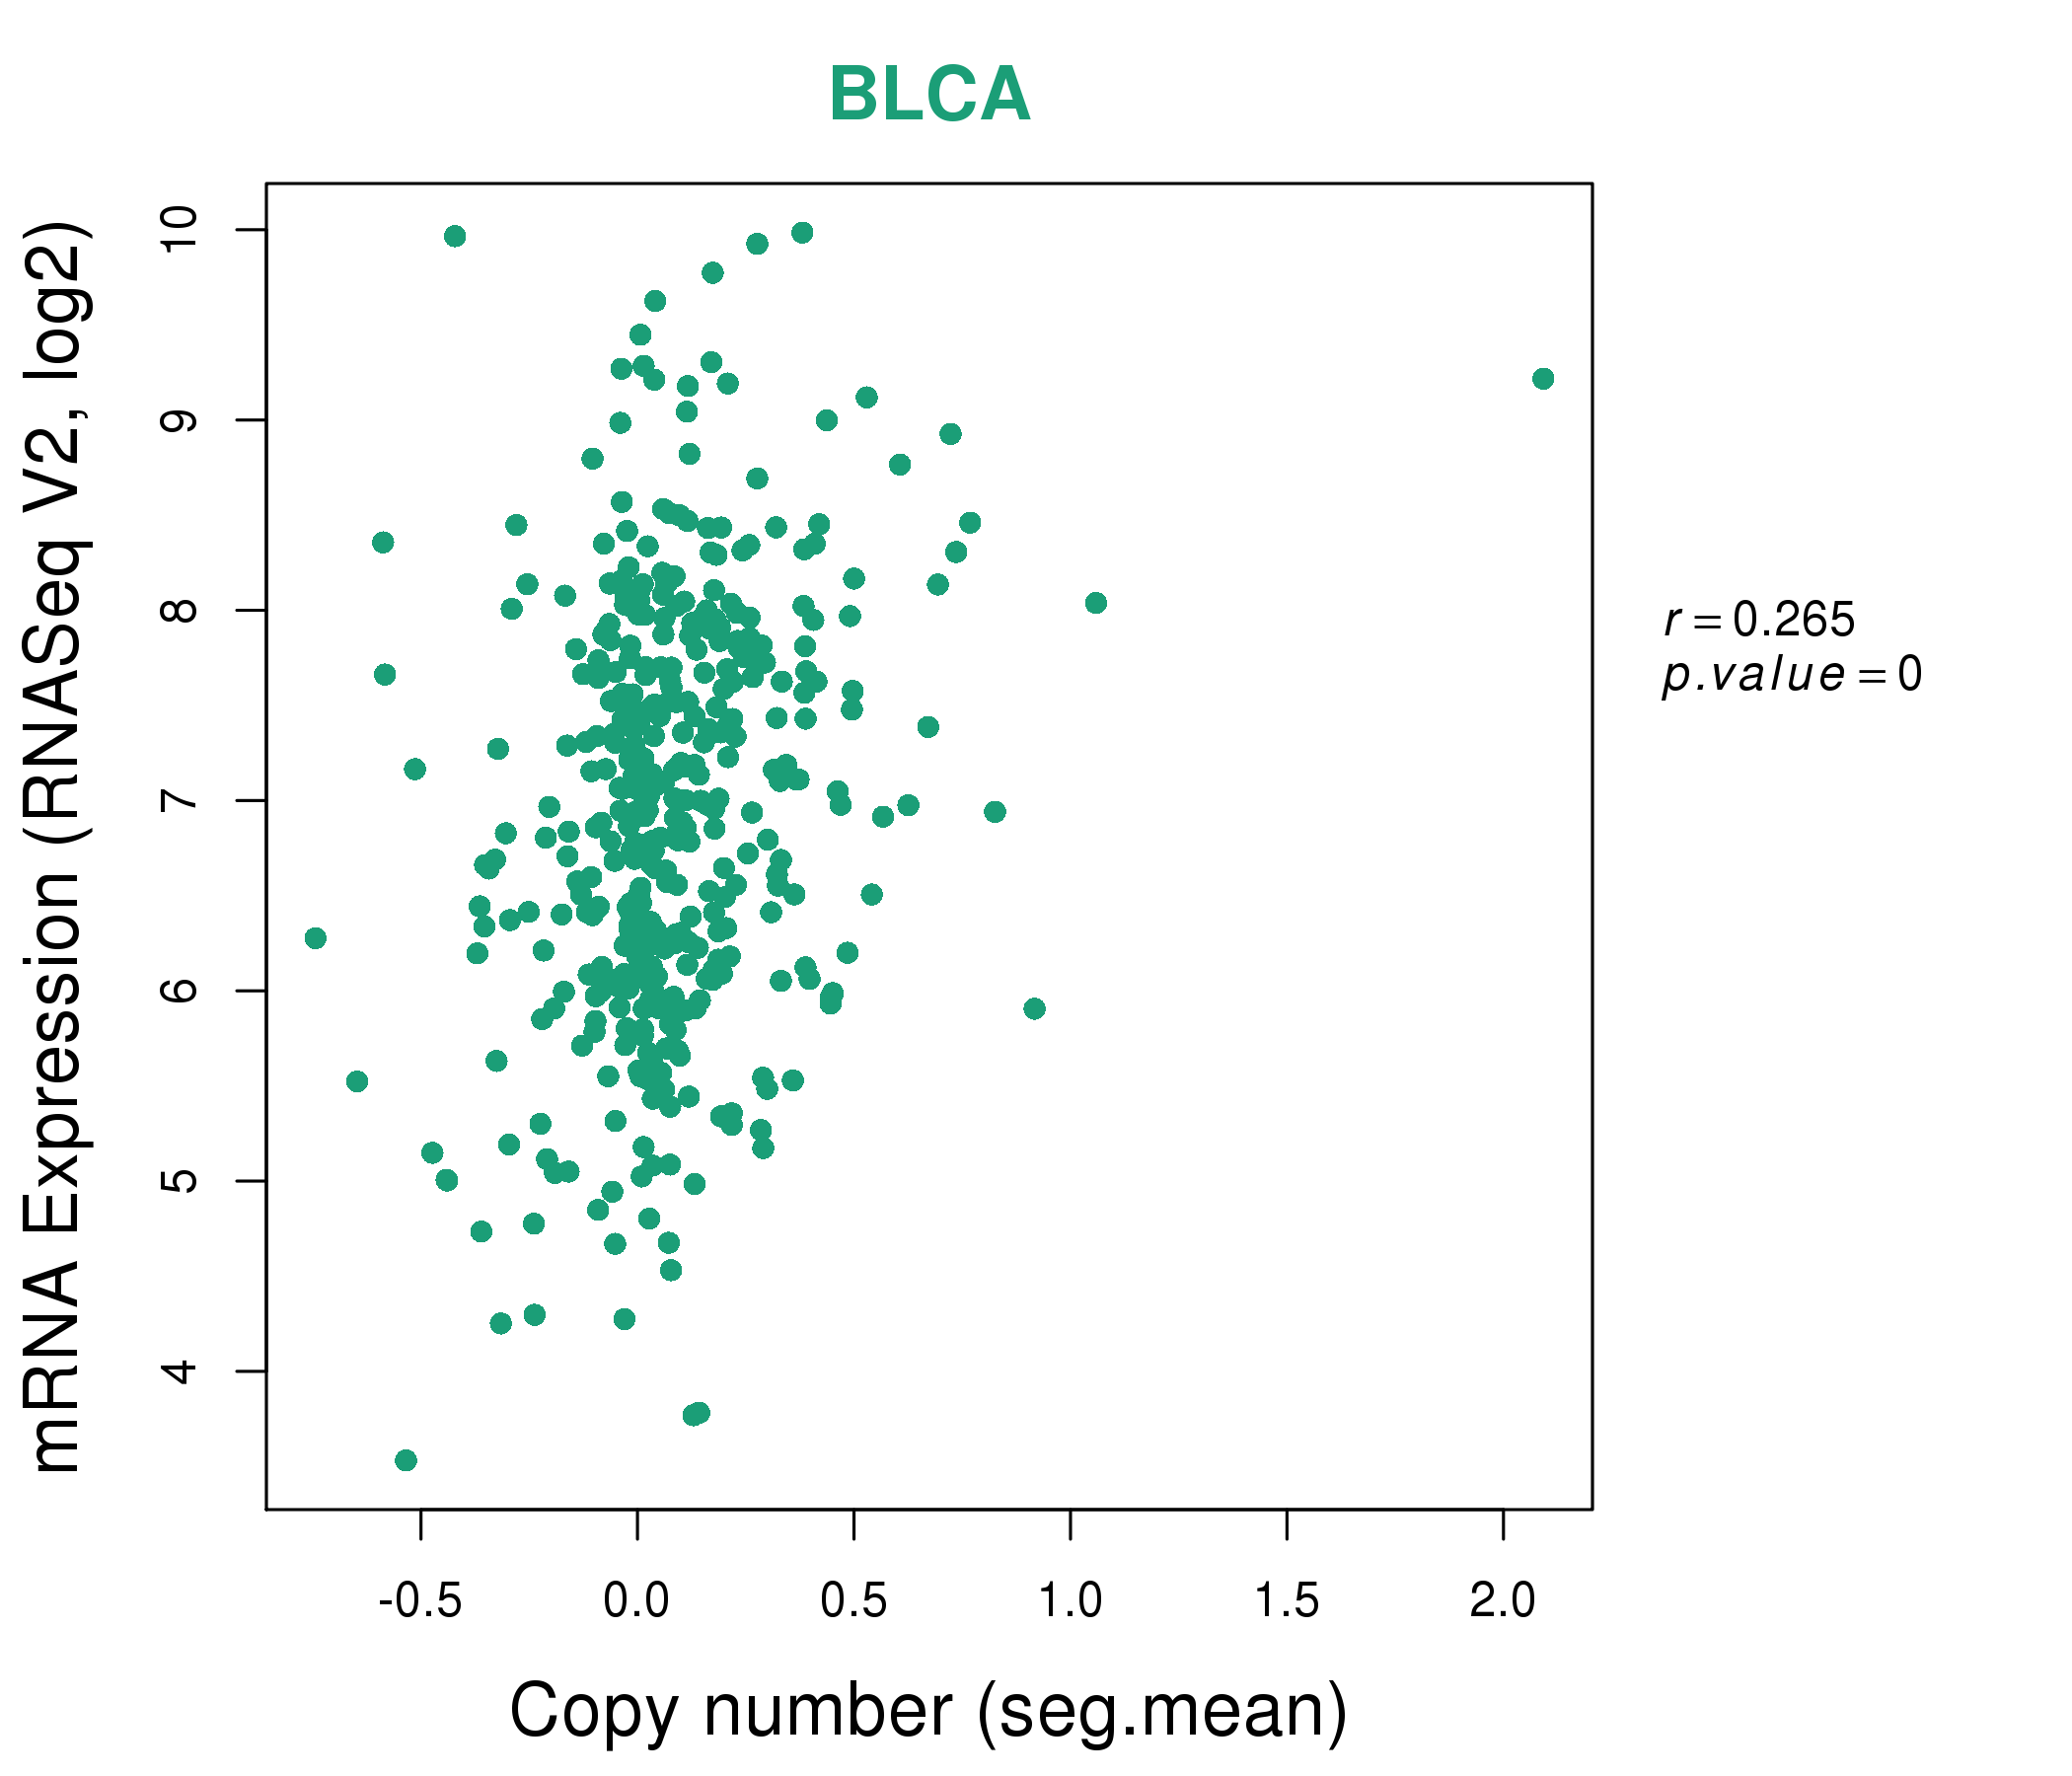
| * This plots show the correlation between CNV and gene expression. |
: Open all plots for all cancer types
 |
|
 |
|

| Top |
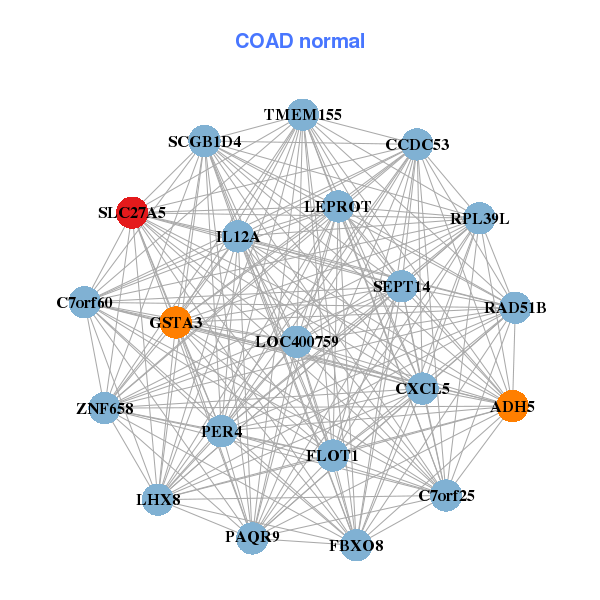
| Gene-Gene Network Information |
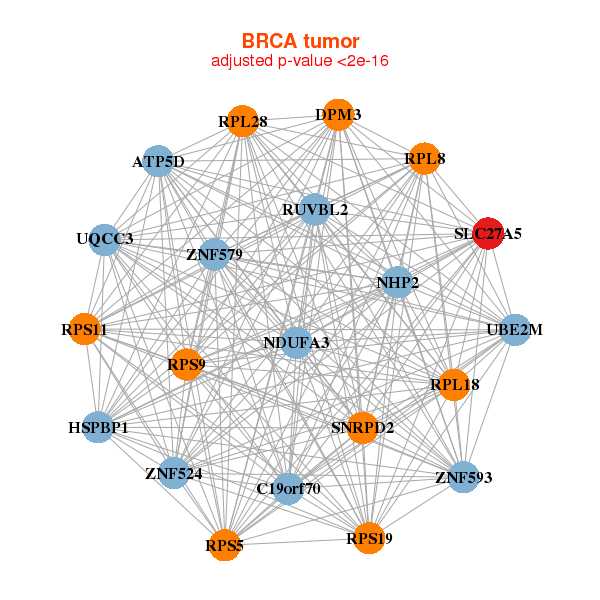
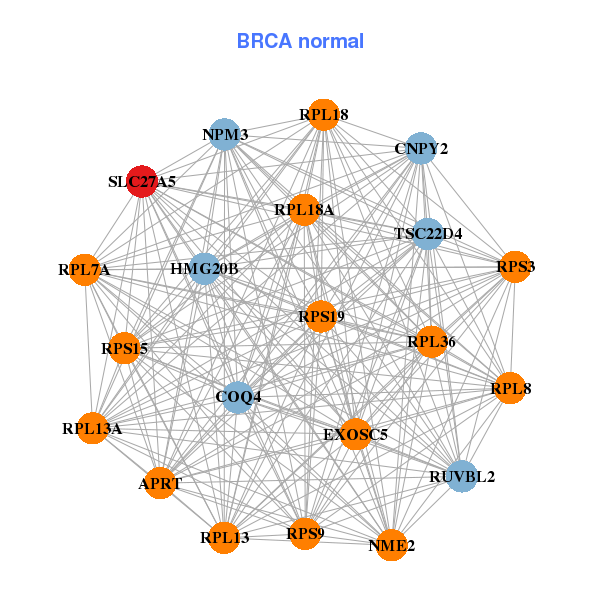
| * Co-Expression network figures were drawn using R package igraph. Only the top 20 genes with the highest correlations were shown. Red circle: input gene, orange circle: cell metabolism gene, sky circle: other gene |
: Open all plots for all cancer types
 |
| ||||
| ATP5D,UQCC3,C19orf70,DPM3,HSPBP1,NDUFA3,NHP2, RPL18,RPL28,RPL8,RPS11,RPS19,RPS5,RPS9, RUVBL2,SLC27A5,SNRPD2,UBE2M,ZNF524,ZNF579,ZNF593 | APRT,CNPY2,COQ4,EXOSC5,HMG20B,NME2,NPM3, RPL13,RPL13A,RPL18,RPL18A,RPL36,RPL7A,RPL8, RPS15,RPS19,RPS3,RPS9,RUVBL2,SLC27A5,TSC22D4 | ||||
 |
| ||||
| BCL2L12,UQCC3,C7orf55,RPP25L,FBL,ISOC2,MRPL12, MRPL4,MRPS12,POP7,PRMT1,RPL18,RPS19,RUVBL2, SDHAF1,SIVA1,SLC27A5,SNRPD2,TIMM50,UBE2M,UBE2S | ADH5,C7orf25,C7orf60,CCDC53,CXCL5,FBXO8,FLOT1, GSTA3,IL12A,LEPROT,LHX8,LOC400759,PAQR9,PER4, RAD51B,RPL39L,SCGB1D4,SEPT14,SLC27A5,TMEM155,ZNF658 |
| * Co-Expression network figures were drawn using R package igraph. Only the top 20 genes with the highest correlations were shown. Red circle: input gene, orange circle: cell metabolism gene, sky circle: other gene |
: Open all plots for all cancer types
| Top |
: Open all interacting genes' information including KEGG pathway for all interacting genes from DAVID
| Top |
| Pharmacological Information for SLC27A5 |
| DB Category | DB Name | DB's ID and Url link |
| * Gene Centered Interaction Network. |
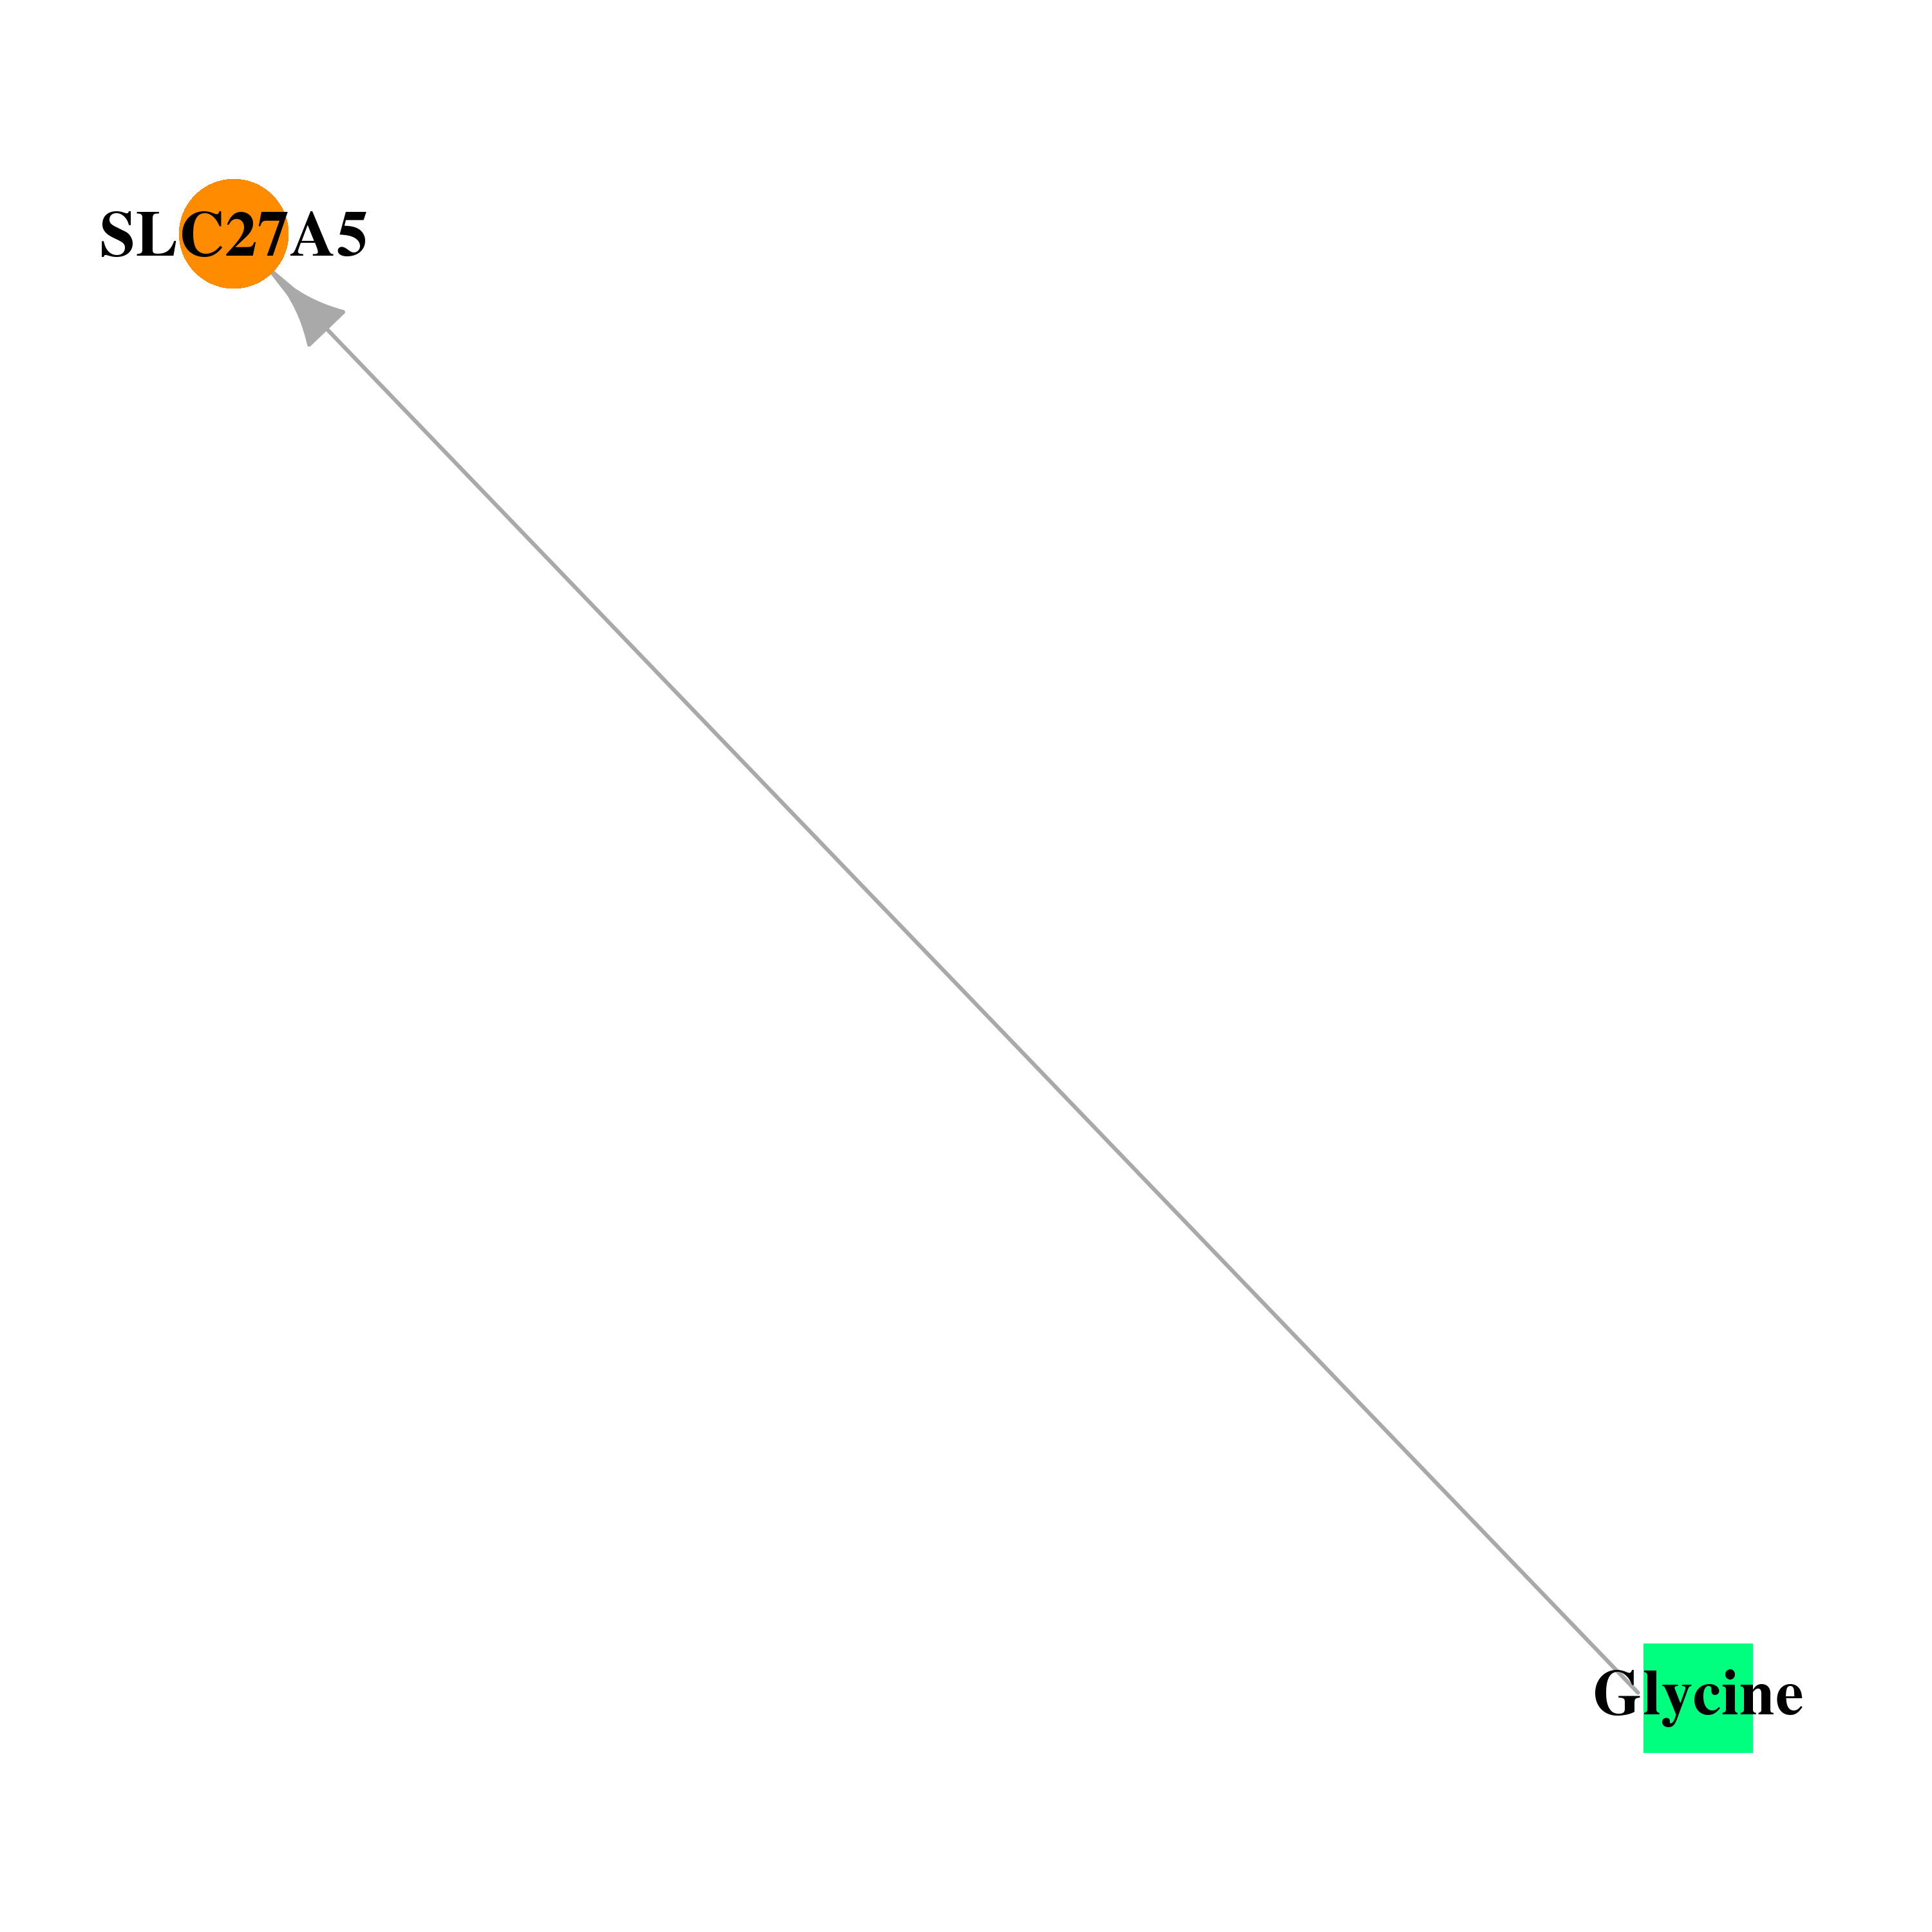 |
| * Drug Centered Interaction Network. |
| DrugBank ID | Target Name | Drug Groups | Generic Name | Drug Centered Network | Drug Structure |
| DB00145 | solute carrier family 27 (fatty acid transporter), member 5 | approved; nutraceutical | Glycine |  |  |
| Top |
| Cross referenced IDs for SLC27A5 |
| * We obtained these cross-references from Uniprot database. It covers 150 different DBs, 18 categories. http://www.uniprot.org/help/cross_references_section |
: Open all cross reference information
|
Copyright © 2016-Present - The Univsersity of Texas Health Science Center at Houston @ |