|
|||||||||||||||||||||||||||||||||||||||||||||||||||||||||||||||||||||||||||||||||||||||||||||||||||||||||||||||||||||||||||||||||||||||||||||||||||||||||||||||||||||||||||||||||||||||||||||||||||||||||||||||||||||||||||||||||||||||||||||||||||||||||||||||||||||||||||||||||||||||||||||||||||||||||||||||||||||||||||||||||||||||||||||
| |
| Phenotypic Information (metabolism pathway, cancer, disease, phenome) |
| |
| |
| Gene-Gene Network Information: Co-Expression Network, Interacting Genes & KEGG |
| |
|


| Gene Summary for SLC27A2 |
| Basic gene info. | Gene symbol | SLC27A2 |
| Gene name | solute carrier family 27 (fatty acid transporter), member 2 | |
| Synonyms | ACSVL1|FACVL1|FATP2|HsT17226|VLACS|VLCS|hFACVL1 | |
| Cytomap | UCSC genome browser: 15q21.2 | |
| Genomic location | chr15 :50474392-50528589 | |
| Type of gene | protein-coding | |
| RefGenes | NM_001159629.1, NM_003645.3, | |
| Ensembl id | ENSG00000140284 | |
| Description | FATP-2THCA-CoA ligasefatty acid transport protein 2fatty-acid-coenzyme A ligase, very long-chain 1long-chain-fatty-acid--CoA ligasesolute carrier family 27 member 2very long-chain acyl-CoA synthetasevery long-chain fatty-acid-coenzyme A ligase 1ve | |
| Modification date | 20141211 | |
| dbXrefs | MIM : 603247 | |
| HGNC : HGNC | ||
| Ensembl : ENSG00000140284 | ||
| HPRD : 11935 | ||
| Vega : OTTHUMG00000131643 | ||
| Protein | UniProt: go to UniProt's Cross Reference DB Table | |
| Expression | CleanEX: HS_SLC27A2 | |
| BioGPS: 11001 | ||
| Gene Expression Atlas: ENSG00000140284 | ||
| The Human Protein Atlas: ENSG00000140284 | ||
| Pathway | NCI Pathway Interaction Database: SLC27A2 | |
| KEGG: SLC27A2 | ||
| REACTOME: SLC27A2 | ||
| ConsensusPathDB | ||
| Pathway Commons: SLC27A2 | ||
| Metabolism | MetaCyc: SLC27A2 | |
| HUMANCyc: SLC27A2 | ||
| Regulation | Ensembl's Regulation: ENSG00000140284 | |
| miRBase: chr15 :50,474,392-50,528,589 | ||
| TargetScan: NM_001159629 | ||
| cisRED: ENSG00000140284 | ||
| Context | iHOP: SLC27A2 | |
| cancer metabolism search in PubMed: SLC27A2 | ||
| UCL Cancer Institute: SLC27A2 | ||
| Assigned class in ccmGDB | C | |
| Top |
| Phenotypic Information for SLC27A2(metabolism pathway, cancer, disease, phenome) |
| Cancer | CGAP: SLC27A2 |
| Familial Cancer Database: SLC27A2 | |
| * This gene is included in those cancer gene databases. |
|
|
|
|
|
| . | |||||||||||||||||||||||||||||||||||||||||||||||||||||||||||||||||||||||||||||||||||||||||||||||||||||||||||||||||||||||||||||||||||||||||||||||||||||||||||||||||||||||||||||||||||||||||||||||||||||||||||||||||||||||||||||||||||||||||||||||||||||||||||||||||||||||||||||||||||||||||||||||||||||||||||||||||||||||||||||||||||||||
Oncogene 1 | Significant driver gene in | ||||||||||||||||||||||||||||||||||||||||||||||||||||||||||||||||||||||||||||||||||||||||||||||||||||||||||||||||||||||||||||||||||||||||||||||||||||||||||||||||||||||||||||||||||||||||||||||||||||||||||||||||||||||||||||||||||||||||||||||||||||||||||||||||||||||||||||||||||||||||||||||||||||||||||||||||||||||||||||||||||||||||||||
| cf) number; DB name 1 Oncogene; http://nar.oxfordjournals.org/content/35/suppl_1/D721.long, 2 Tumor Suppressor gene; https://bioinfo.uth.edu/TSGene/, 3 Cancer Gene Census; http://www.nature.com/nrc/journal/v4/n3/abs/nrc1299.html, 4 CancerGenes; http://nar.oxfordjournals.org/content/35/suppl_1/D721.long, 5 Network of Cancer Gene; http://ncg.kcl.ac.uk/index.php, 1Therapeutic Vulnerabilities in Cancer; http://cbio.mskcc.org/cancergenomics/statius/ |
| REACTOME_PEROXISOMAL_LIPID_METABOLISM REACTOME_METABOLISM_OF_LIPIDS_AND_LIPOPROTEINS | |
| Mutations for SLC27A2 |
| * Under tables are showing count per each tissue to give us broad intuition about tissue specific mutation patterns.You can go to the detailed page for each mutation database's web site. |
| There's no structural variation information in COSMIC data for this gene. |
| * From mRNA Sanger sequences, Chitars2.0 arranged chimeric transcripts. This table shows SLC27A2 related fusion information. |
| ID | Head Gene | Tail Gene | Accession | Gene_a | qStart_a | qEnd_a | Chromosome_a | tStart_a | tEnd_a | Gene_a | qStart_a | qEnd_a | Chromosome_a | tStart_a | tEnd_a |
| AA888112 | RBM14 | 9 | 79 | 11 | 66394744 | 66394814 | SLC27A2 | 72 | 473 | 15 | 50518217 | 50526112 | |
| Top |
| Mutation type/ Tissue ID | brca | cns | cerv | endome | haematopo | kidn | Lintest | liver | lung | ns | ovary | pancre | prost | skin | stoma | thyro | urina | |||
| Total # sample | 1 | |||||||||||||||||||
| GAIN (# sample) | 1 | |||||||||||||||||||
| LOSS (# sample) |
| cf) Tissue ID; Tissue type (1; Breast, 2; Central_nervous_system, 3; Cervix, 4; Endometrium, 5; Haematopoietic_and_lymphoid_tissue, 6; Kidney, 7; Large_intestine, 8; Liver, 9; Lung, 10; NS, 11; Ovary, 12; Pancreas, 13; Prostate, 14; Skin, 15; Stomach, 16; Thyroid, 17; Urinary_tract) |
| Top |
|
 |
| Top |
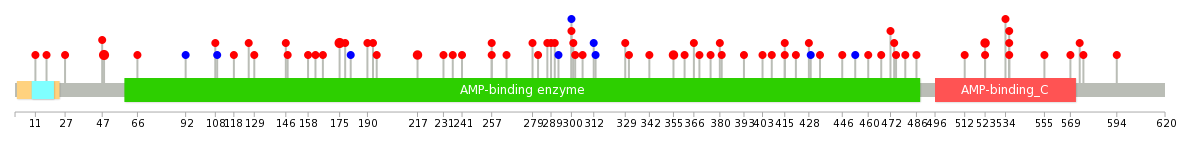
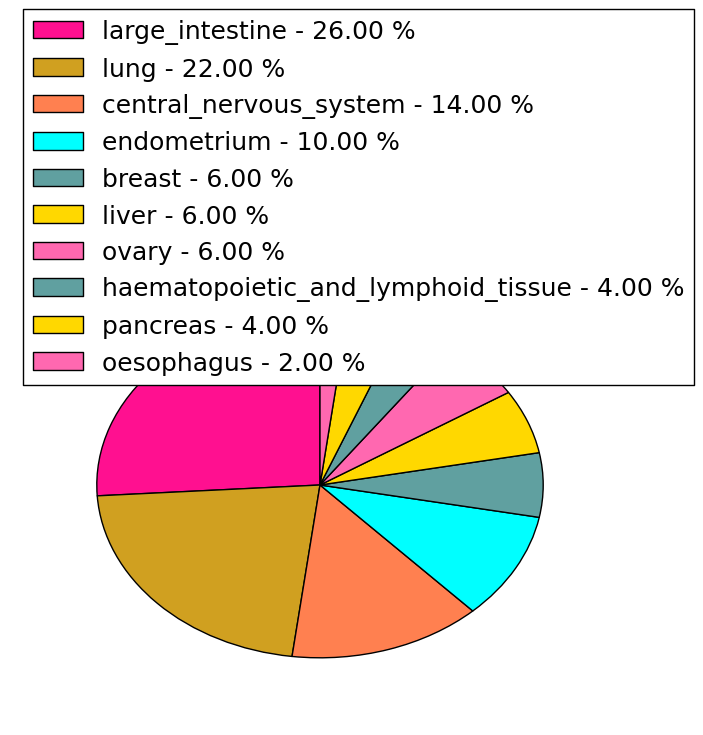
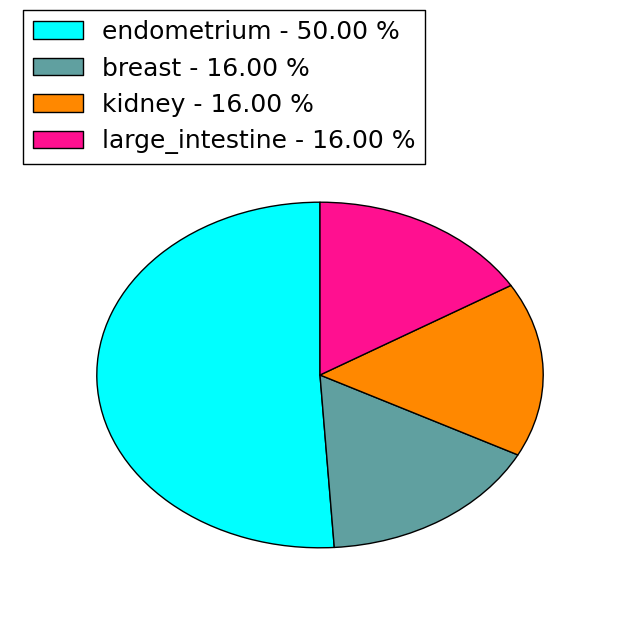
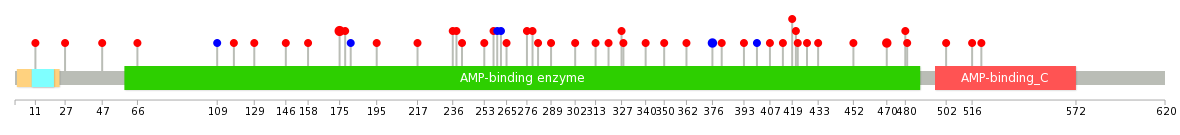
| Stat. for Non-Synonymous SNVs (# total SNVs=50) | (# total SNVs=6) |
 |  |
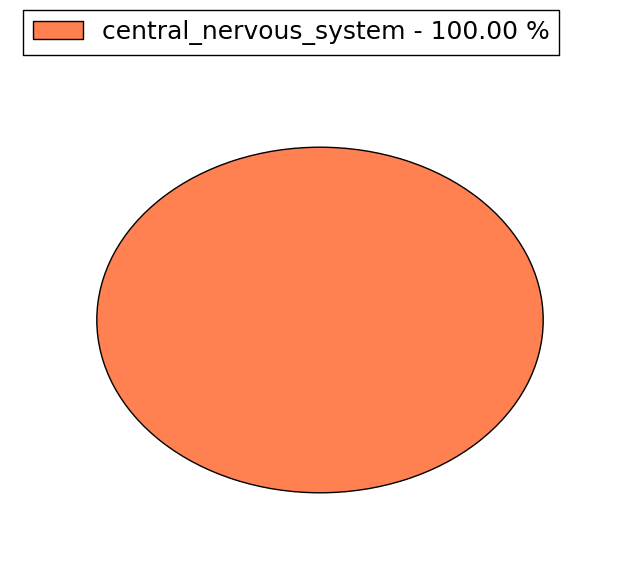
(# total SNVs=0) | (# total SNVs=1) |
 |
| Top |
| * When you move the cursor on each content, you can see more deailed mutation information on the Tooltip. Those are primary_site,primary_histology,mutation(aa),pubmedID. |
| GRCh37 position | Mutation(aa) | Unique sampleID count |
| chr15:50474766-50474766 | p.K48Q | 3 |
| chr15:50489742-50489742 | p.D175G | 3 |
| chr15:50526076-50526076 | p.R523C | 2 |
| chr15:50489868-50489868 | p.S217F | 2 |
| chr15:50526115-50526115 | p.E536Q | 2 |
| chr15:50515253-50515253 | p.D355G | 2 |
| chr15:50518260-50518260 | p.V415L | 2 |
| chr15:50474704-50474704 | p.F27Y | 1 |
| chr15:50494789-50494789 | p.P265L | 1 |
| chr15:50519202-50519202 | p.K428N | 1 |
| Top |
|
 |
| Point Mutation/ Tissue ID | 1 | 2 | 3 | 4 | 5 | 6 | 7 | 8 | 9 | 10 | 11 | 12 | 13 | 14 | 15 | 16 | 17 | 18 | 19 | 20 |
| # sample | 4 | 2 | 1 | 5 | 6 | 3 | 2 | 5 | 2 | 13 | 4 | 7 | ||||||||
| # mutation | 4 | 2 | 1 | 4 | 6 | 3 | 2 | 5 | 2 | 14 | 4 | 8 | ||||||||
| nonsynonymous SNV | 4 | 2 | 1 | 4 | 6 | 2 | 2 | 5 | 2 | 11 | 4 | 5 | ||||||||
| synonymous SNV | 1 | 3 | 3 |
| cf) Tissue ID; Tissue type (1; BLCA[Bladder Urothelial Carcinoma], 2; BRCA[Breast invasive carcinoma], 3; CESC[Cervical squamous cell carcinoma and endocervical adenocarcinoma], 4; COAD[Colon adenocarcinoma], 5; GBM[Glioblastoma multiforme], 6; Glioma Low Grade, 7; HNSC[Head and Neck squamous cell carcinoma], 8; KICH[Kidney Chromophobe], 9; KIRC[Kidney renal clear cell carcinoma], 10; KIRP[Kidney renal papillary cell carcinoma], 11; LAML[Acute Myeloid Leukemia], 12; LUAD[Lung adenocarcinoma], 13; LUSC[Lung squamous cell carcinoma], 14; OV[Ovarian serous cystadenocarcinoma ], 15; PAAD[Pancreatic adenocarcinoma], 16; PRAD[Prostate adenocarcinoma], 17; SKCM[Skin Cutaneous Melanoma], 18:STAD[Stomach adenocarcinoma], 19:THCA[Thyroid carcinoma], 20:UCEC[Uterine Corpus Endometrial Carcinoma]) |
| Top |
| * We represented just top 10 SNVs. When you move the cursor on each content, you can see more deailed mutation information on the Tooltip. Those are primary_site, primary_histology, mutation(aa), pubmedID. |
| Genomic Position | Mutation(aa) | Unique sampleID count |
| chr15:50489742 | p.D175G,SLC27A2 | 3 |
| chr15:50519205 | p.I376I,SLC27A2 | 2 |
| chr15:50526076 | p.R470C,SLC27A2 | 2 |
| chr15:50474763 | p.F27Y,SLC27A2 | 1 |
| chr15:50489868 | p.P265L | 1 |
| chr15:50521197 | p.V362I,SLC27A2 | 1 |
| chr15:50515175 | p.R502S,SLC27A2 | 1 |
| chr15:50474821 | p.G47R,SLC27A2 | 1 |
| chr15:50519219 | p.C279Y | 1 |
| chr15:50494717 | p.G516E,SLC27A2 | 1 |
| * Copy number data were extracted from TCGA using R package TCGA-Assembler. The URLs of all public data files on TCGA DCC data server were gathered on Jan-05-2015. Function ProcessCNAData in TCGA-Assembler package was used to obtain gene-level copy number value which is calculated as the average copy number of the genomic region of a gene. |
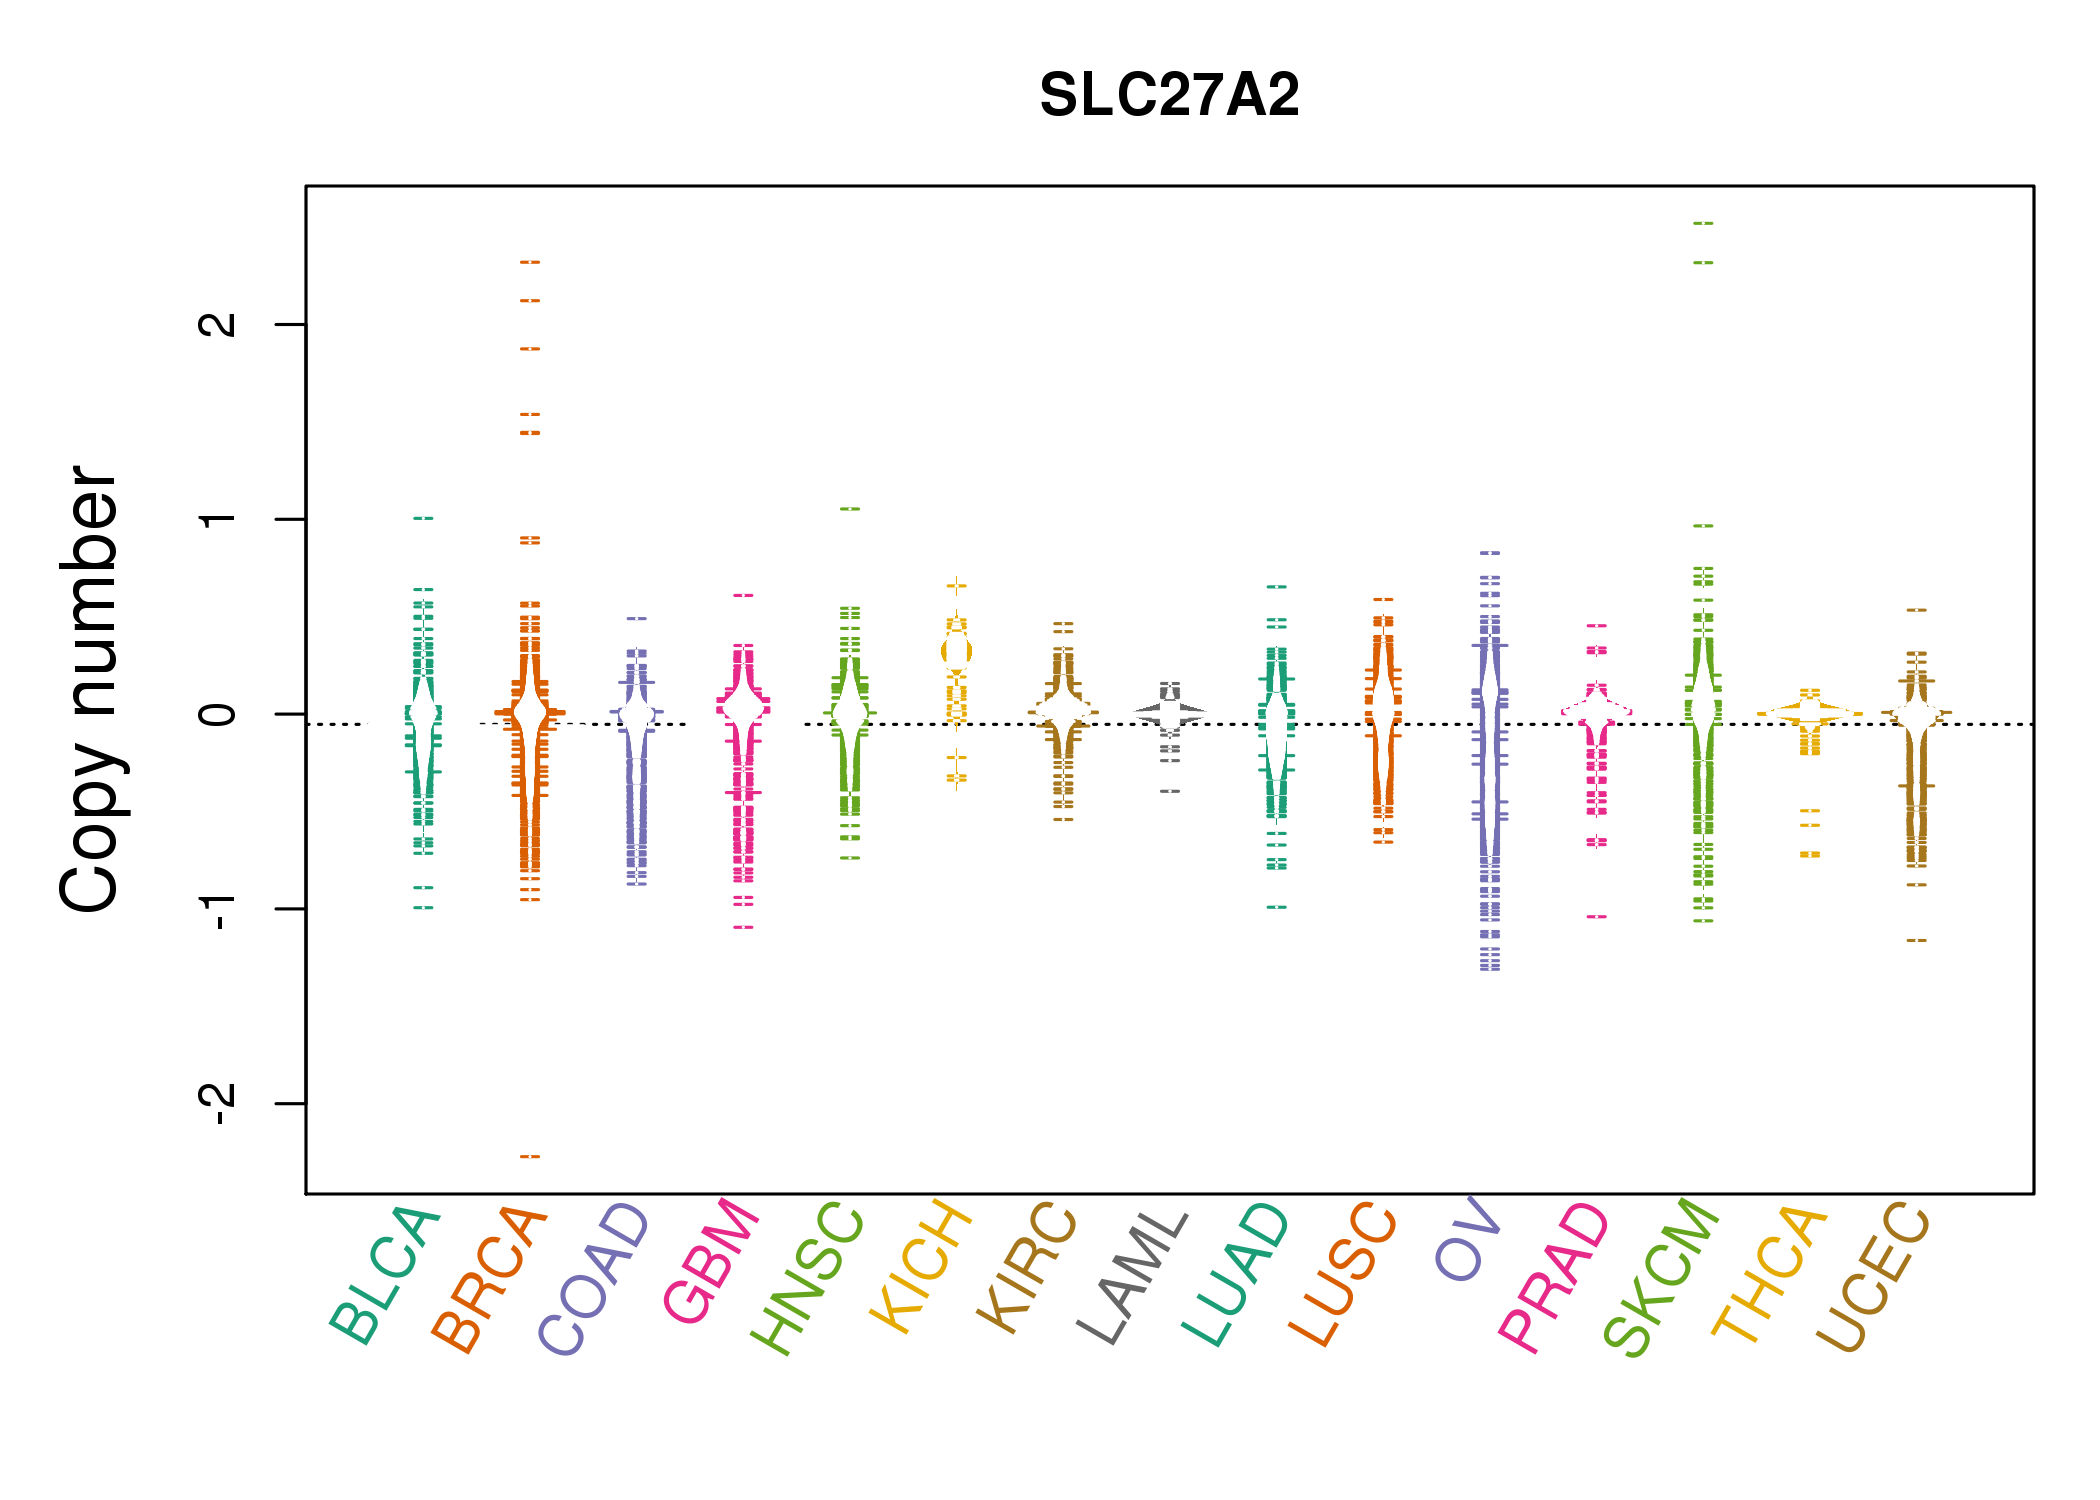 |
| cf) Tissue ID[Tissue type]: BLCA[Bladder Urothelial Carcinoma], BRCA[Breast invasive carcinoma], CESC[Cervical squamous cell carcinoma and endocervical adenocarcinoma], COAD[Colon adenocarcinoma], GBM[Glioblastoma multiforme], Glioma Low Grade, HNSC[Head and Neck squamous cell carcinoma], KICH[Kidney Chromophobe], KIRC[Kidney renal clear cell carcinoma], KIRP[Kidney renal papillary cell carcinoma], LAML[Acute Myeloid Leukemia], LUAD[Lung adenocarcinoma], LUSC[Lung squamous cell carcinoma], OV[Ovarian serous cystadenocarcinoma ], PAAD[Pancreatic adenocarcinoma], PRAD[Prostate adenocarcinoma], SKCM[Skin Cutaneous Melanoma], STAD[Stomach adenocarcinoma], THCA[Thyroid carcinoma], UCEC[Uterine Corpus Endometrial Carcinoma] |
| Top |
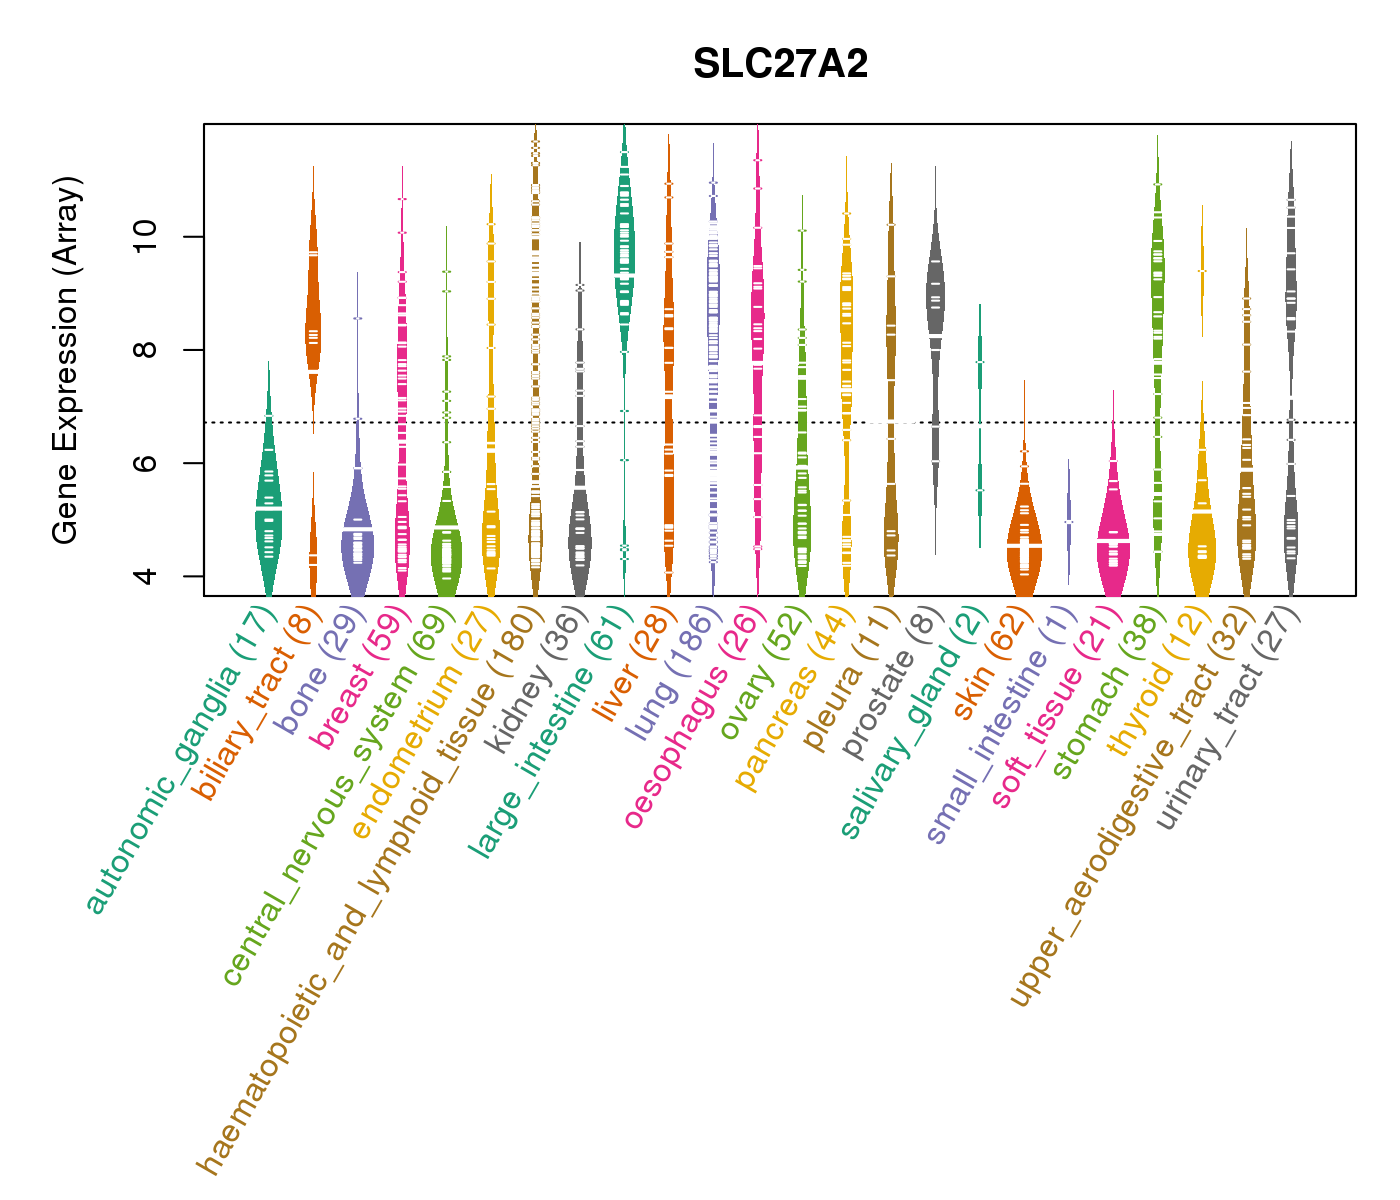
| Gene Expression for SLC27A2 |
| * CCLE gene expression data were extracted from CCLE_Expression_Entrez_2012-10-18.res: Gene-centric RMA-normalized mRNA expression data. |
 |
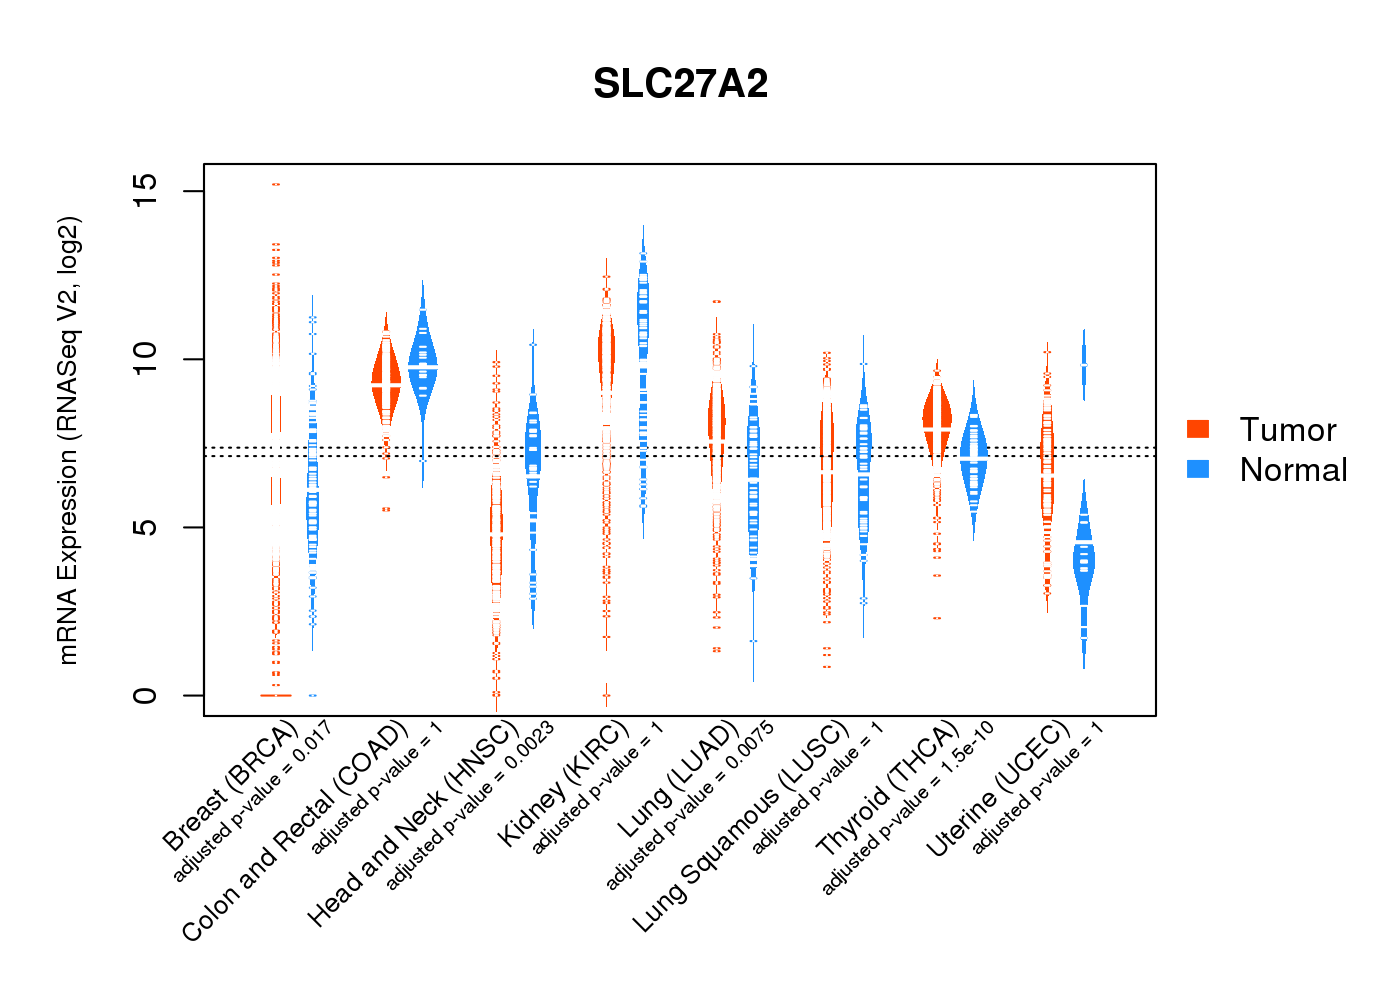
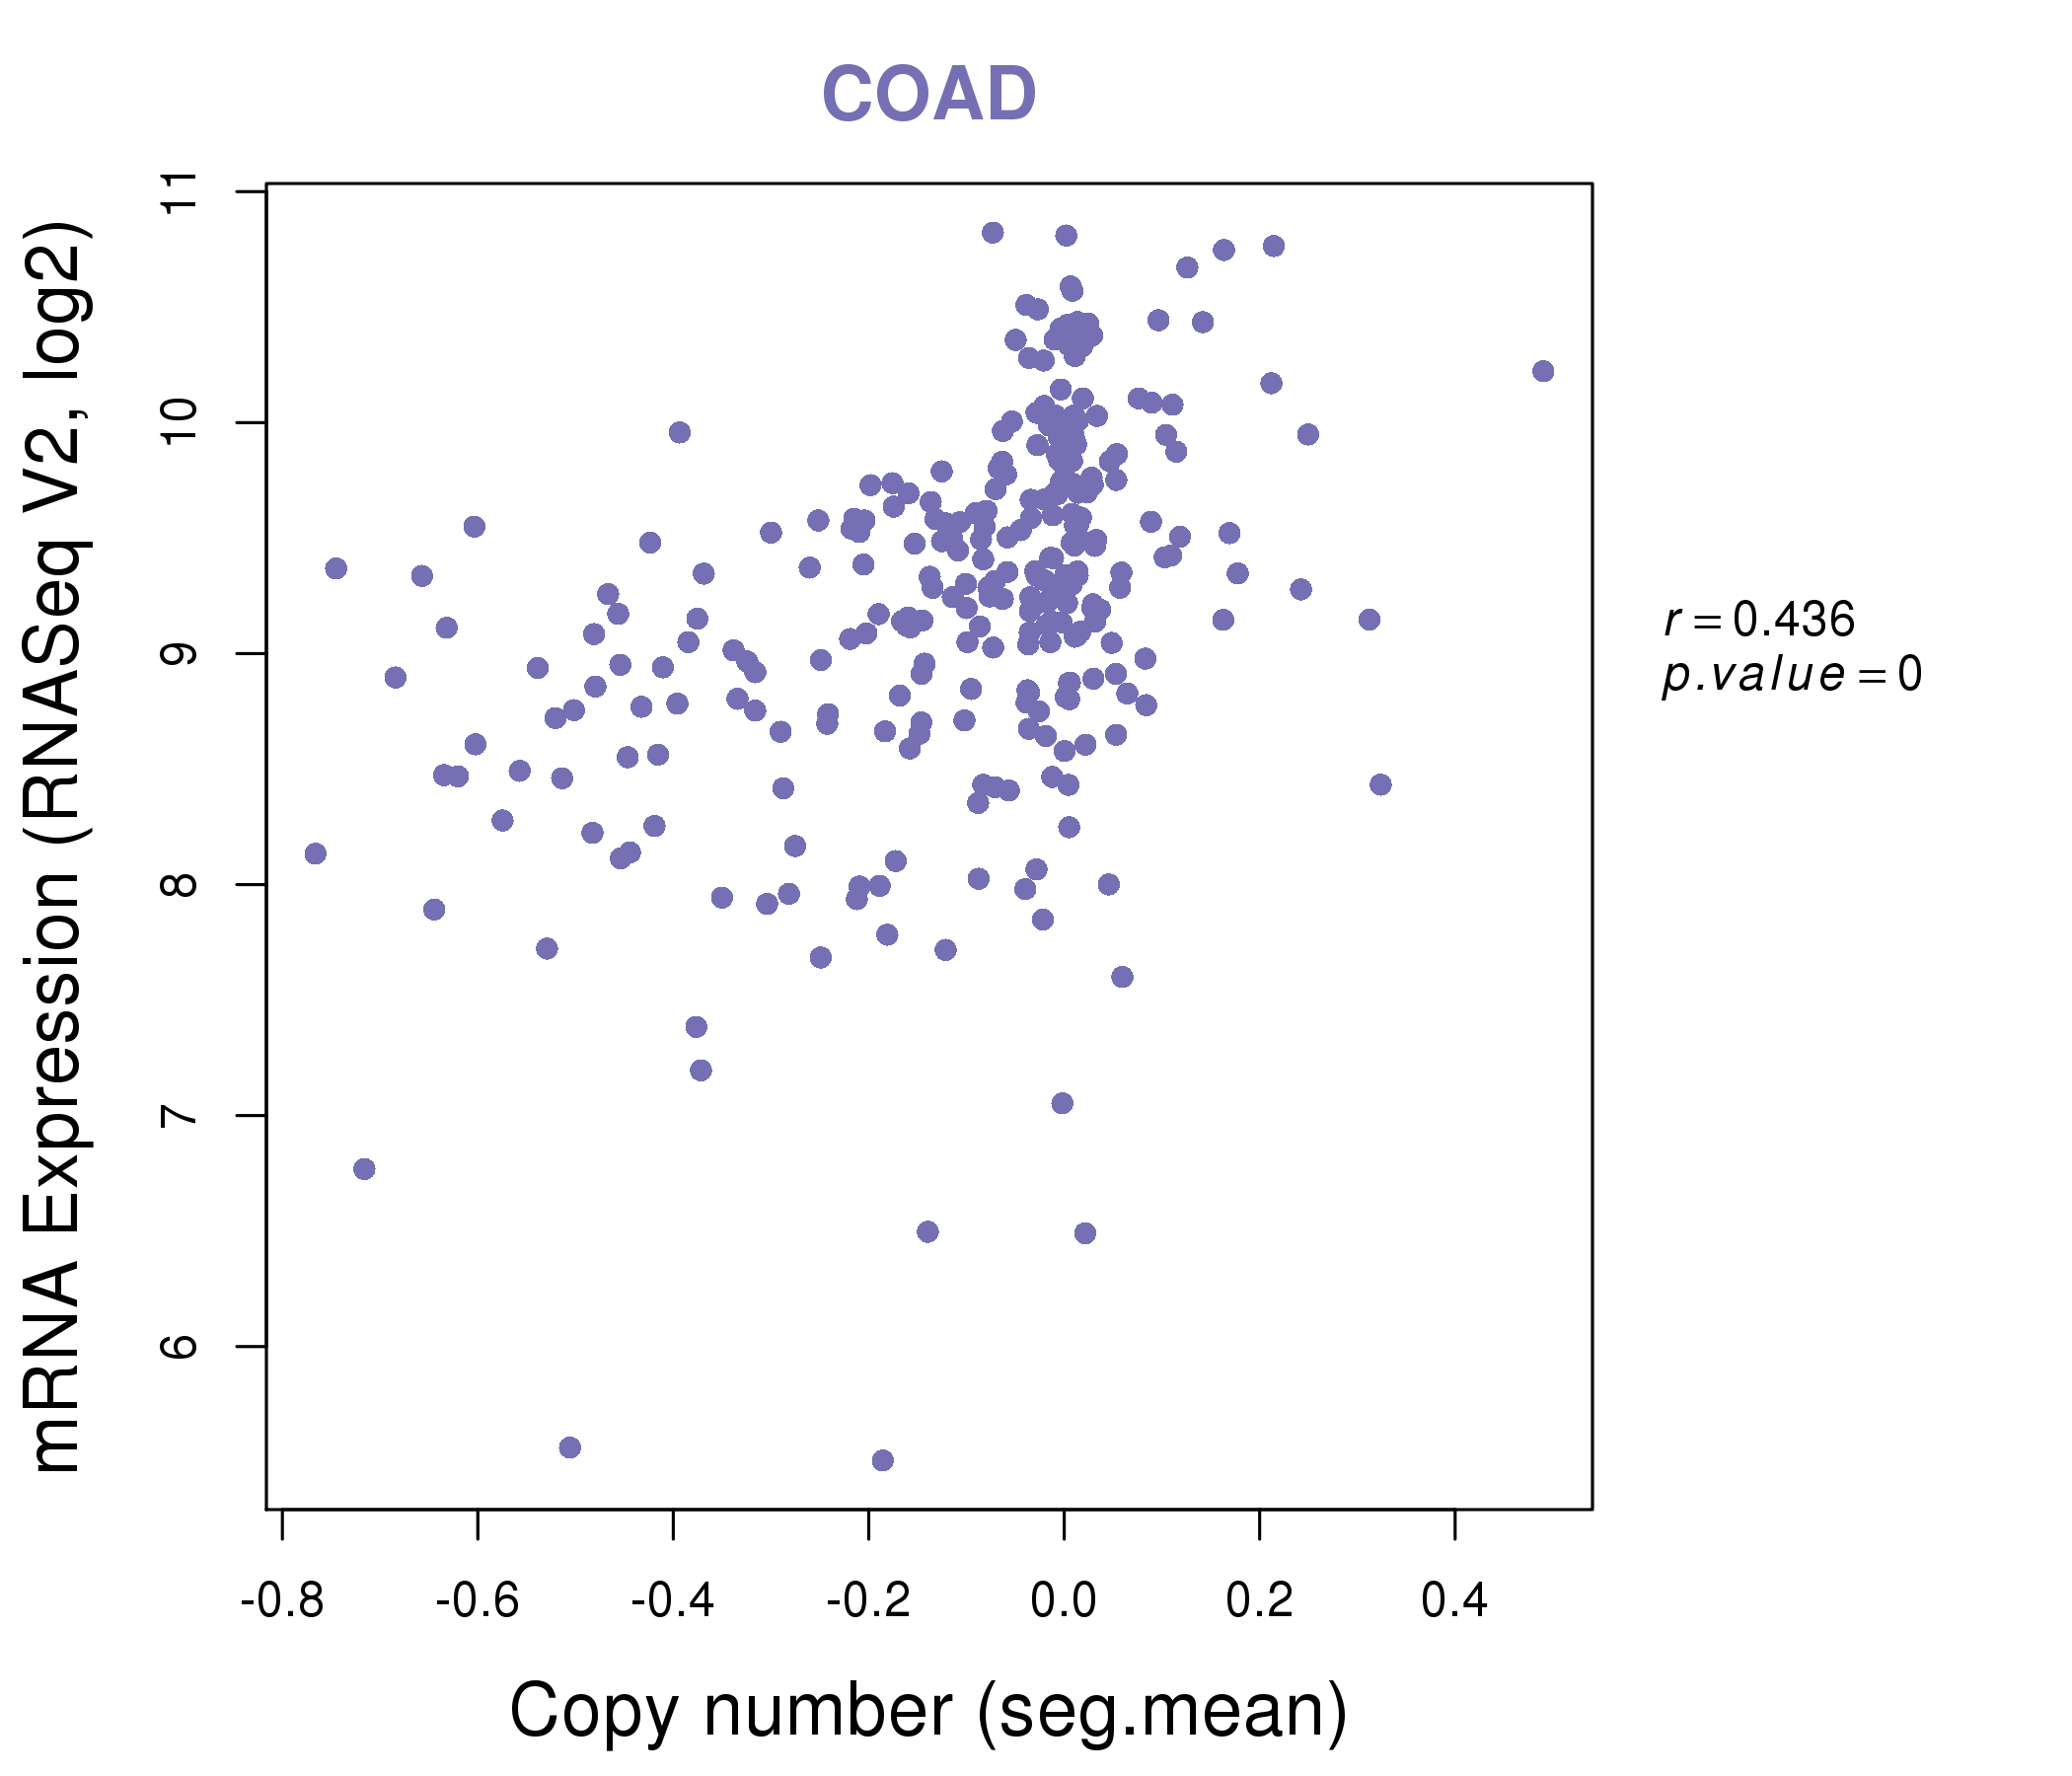
| * Normalized gene expression data of RNASeqV2 was extracted from TCGA using R package TCGA-Assembler. The URLs of all public data files on TCGA DCC data server were gathered at Jan-05-2015. Only eight cancer types have enough normal control samples for differential expression analysis. (t test, adjusted p<0.05 (using Benjamini-Hochberg FDR)) |
 |
| Top |
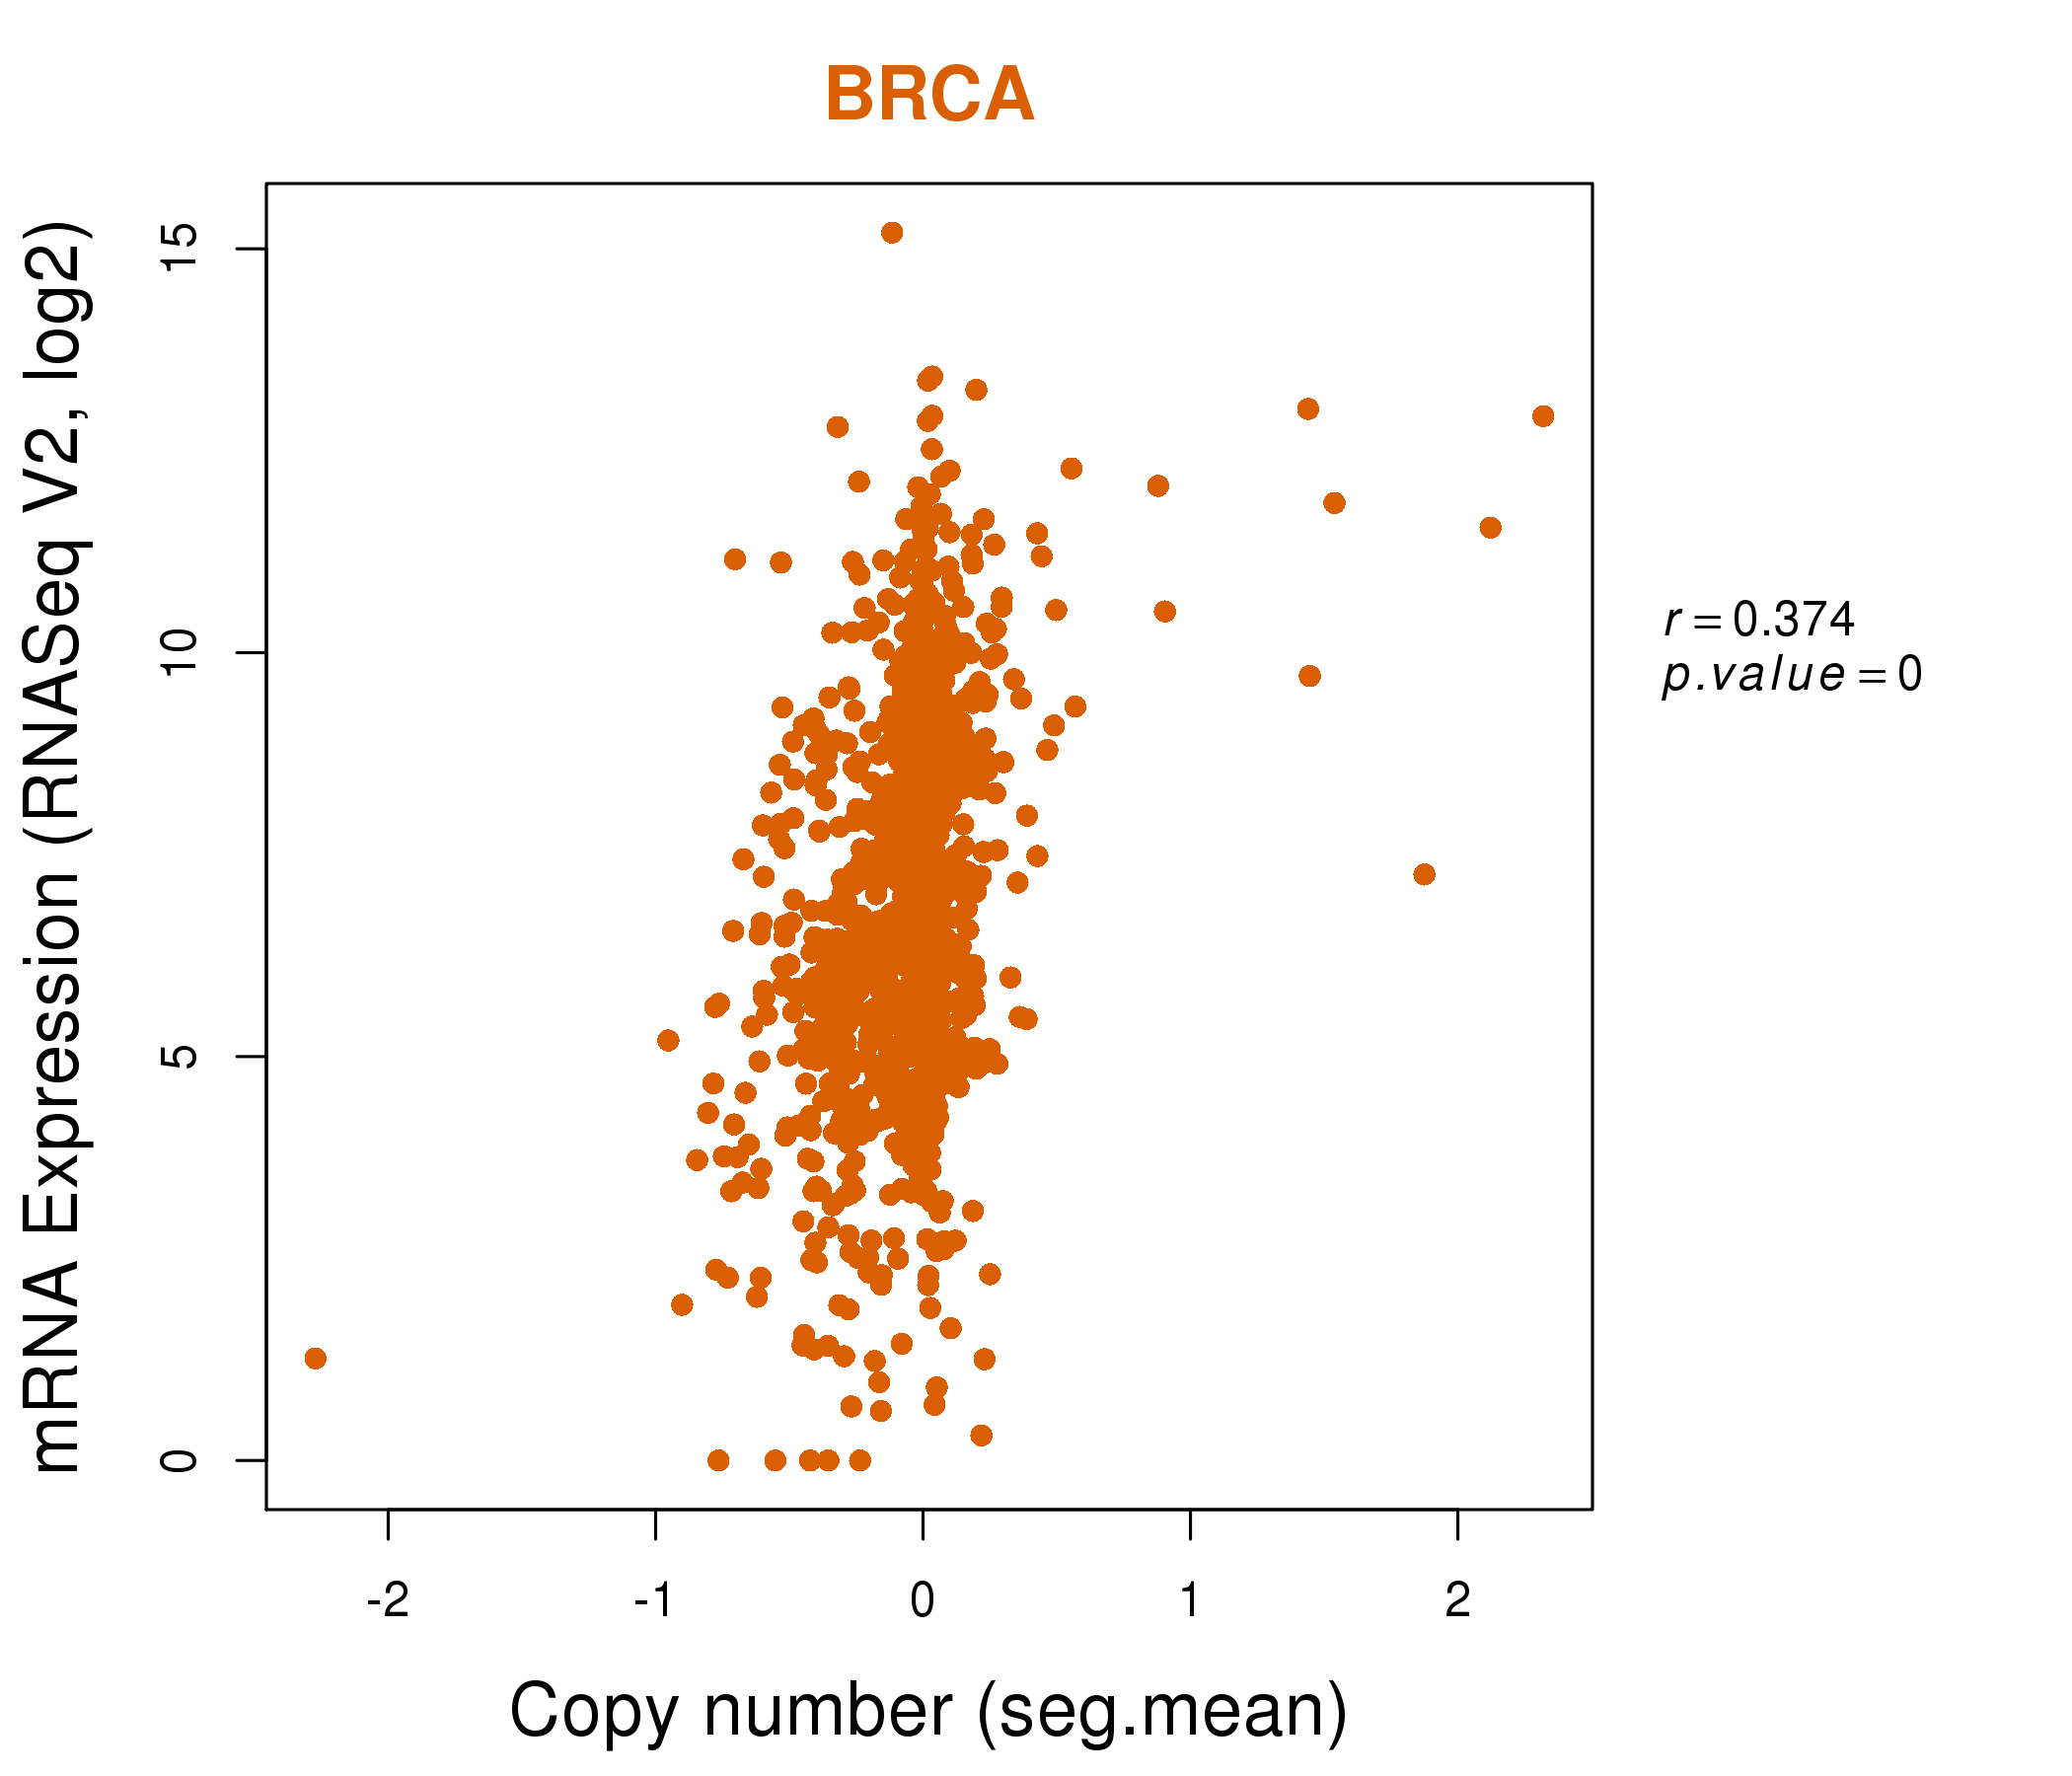
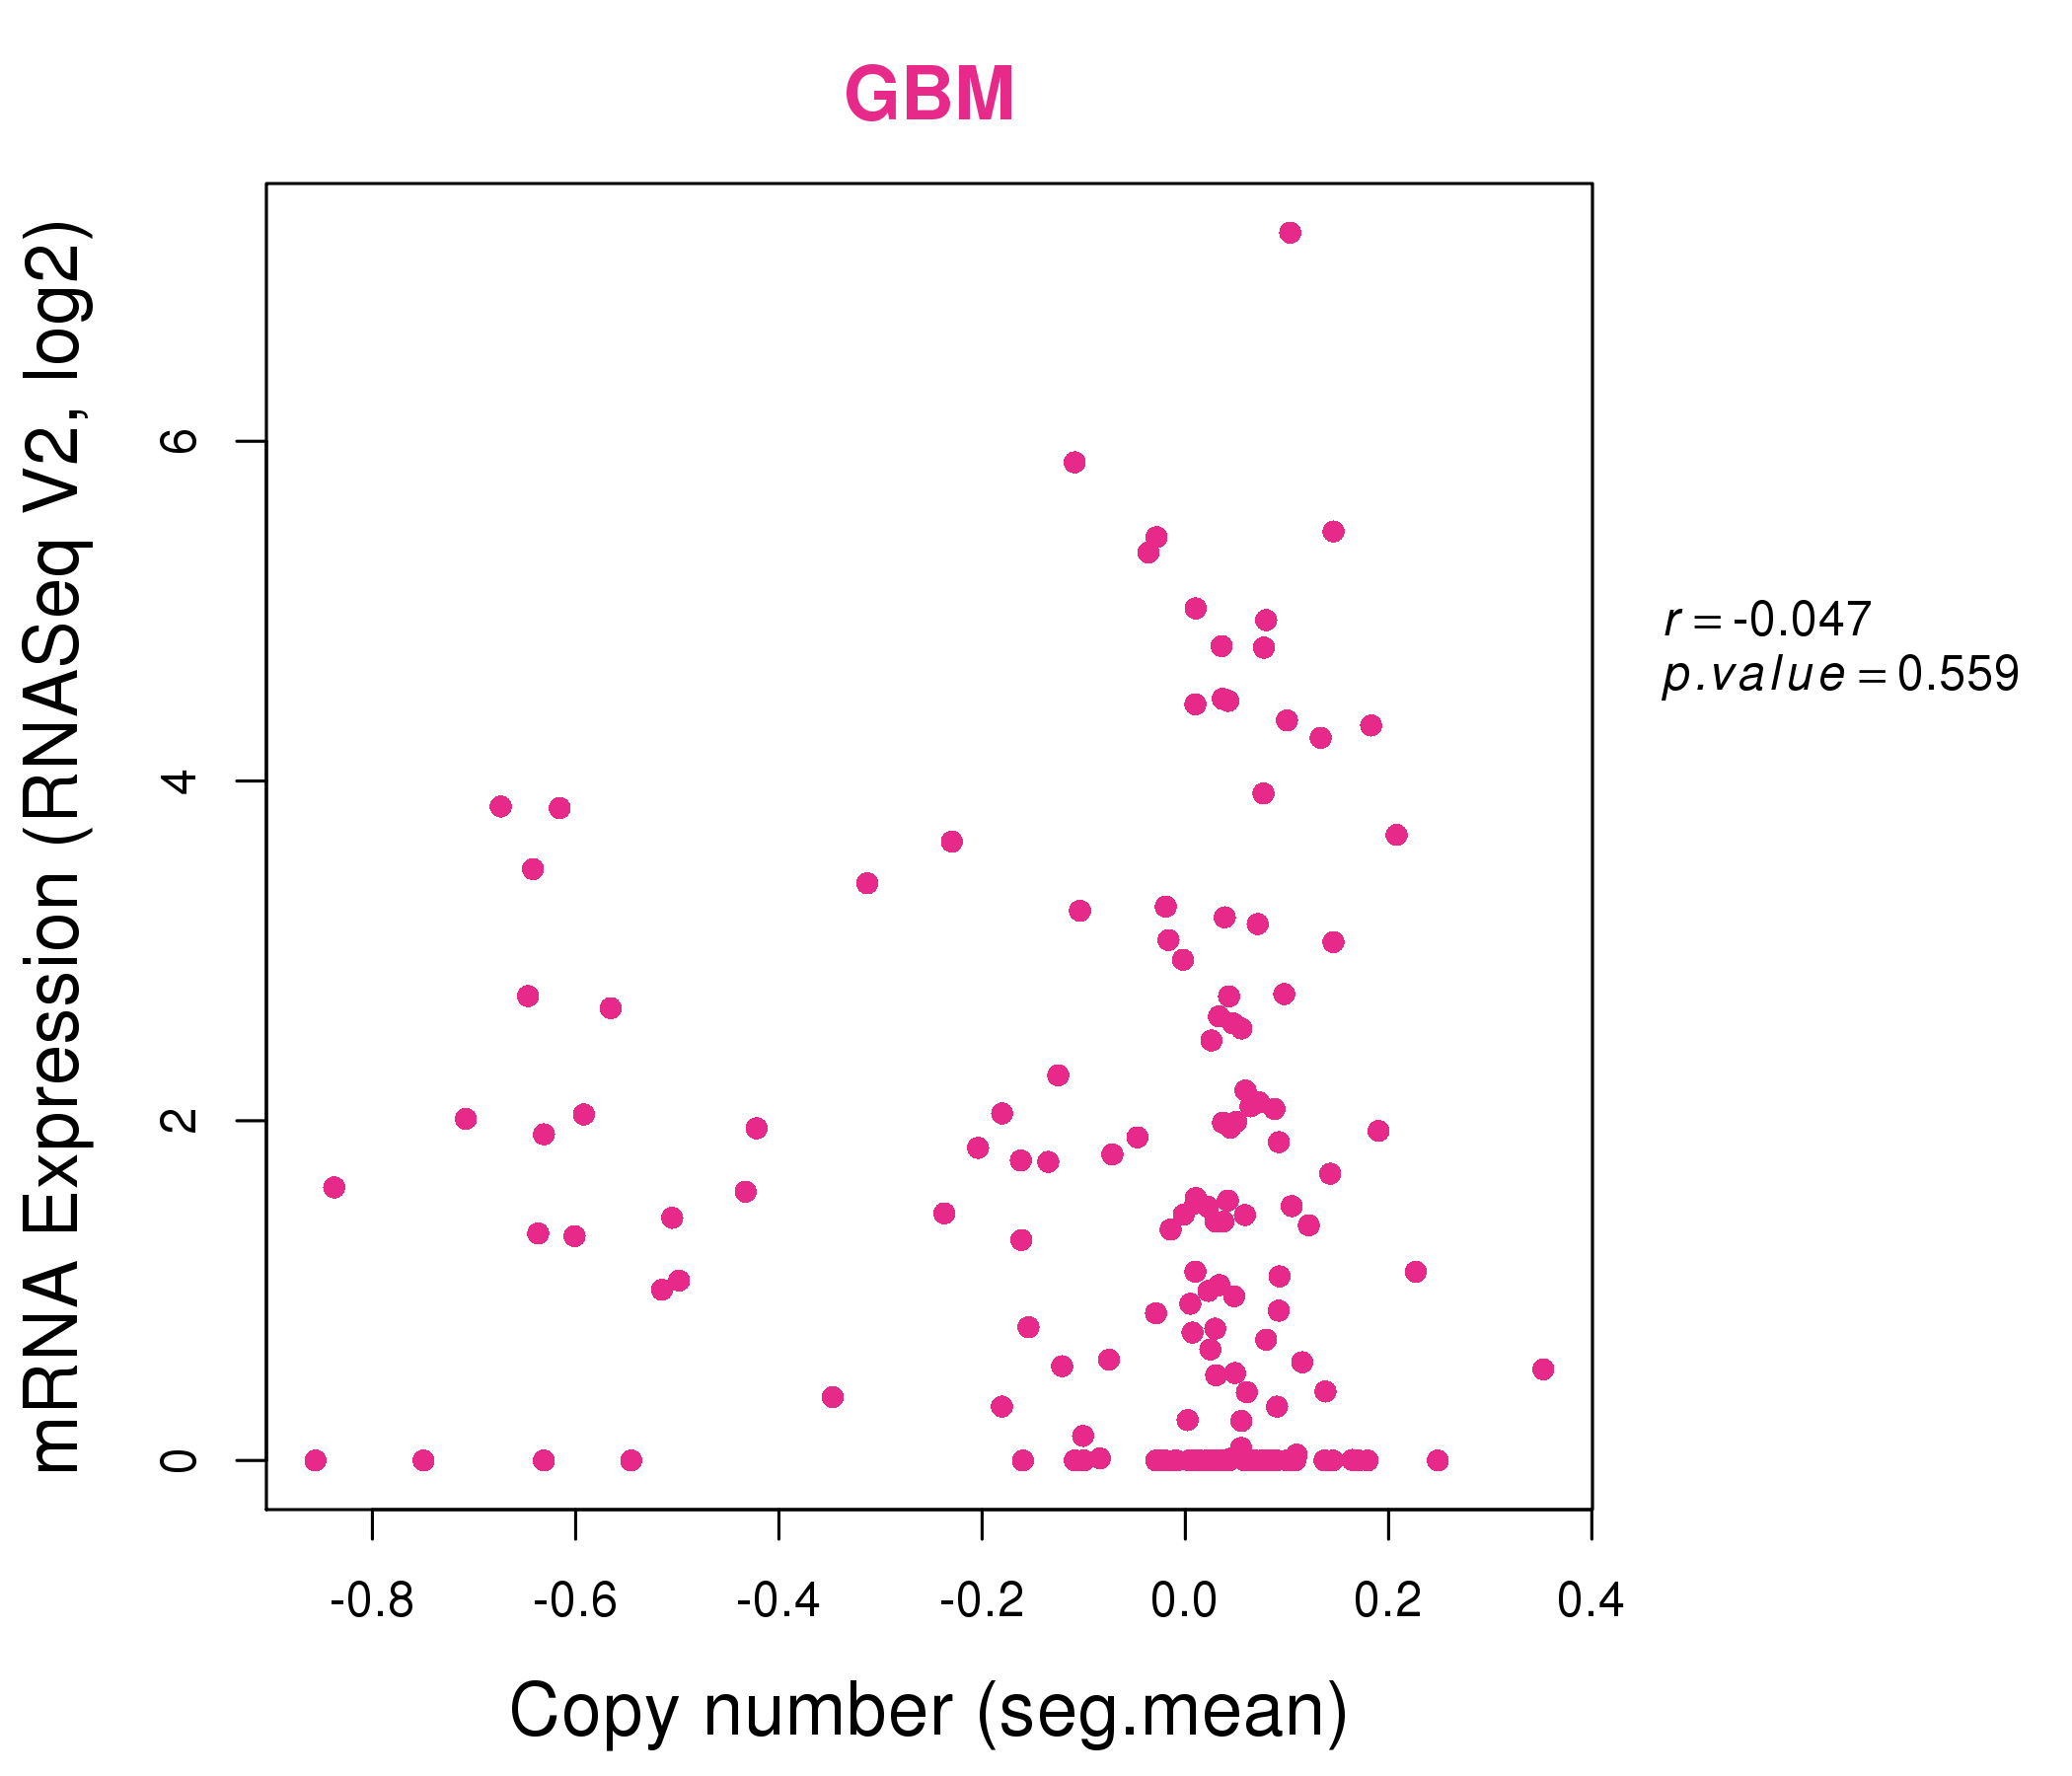
| * This plots show the correlation between CNV and gene expression. |
: Open all plots for all cancer types
 |
|
 |
|
| Top |
| Gene-Gene Network Information |
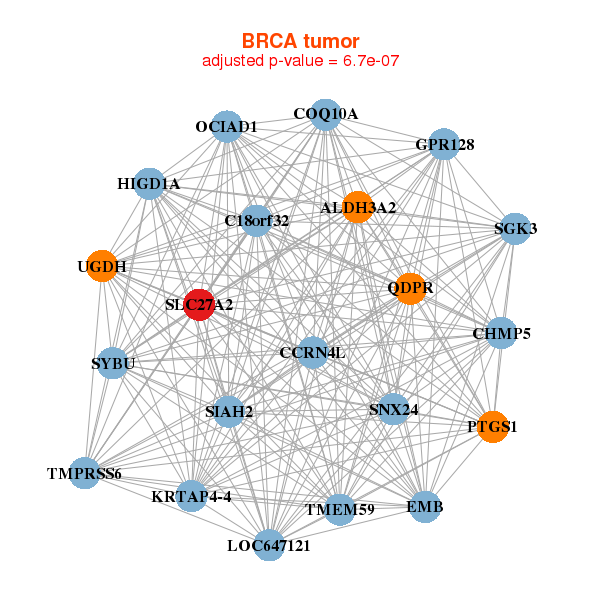
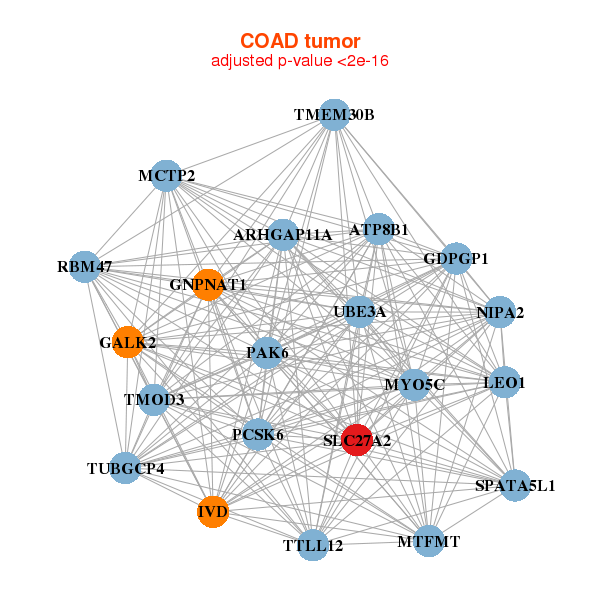
| * Co-Expression network figures were drawn using R package igraph. Only the top 20 genes with the highest correlations were shown. Red circle: input gene, orange circle: cell metabolism gene, sky circle: other gene |
: Open all plots for all cancer types
 |
| ||||
| ALDH3A2,C18orf32,CCRN4L,CHMP5,COQ10A,EMB,GPR128, HIGD1A,KRTAP4-4,LOC647121,OCIAD1,PTGS1,QDPR,SGK3, SIAH2,SLC27A2,SNX24,SYBU,TMEM59,TMPRSS6,UGDH | AACS,ADAM2,AWAT2,MAB21L3,CPB2,CSPG5,FCN2, FDFT1,G6PD,HMGCS1,HPGD,IVD,KRTAP10-4,MCCC1, OR2J2,PNLIPRP3,RIMS2,SCP2,SLC27A2,SLC43A1,UGT2B28 | ||||
 |
| ||||
| ARHGAP11A,ATP8B1,GDPGP1,GALK2,GNPNAT1,IVD,LEO1, MCTP2,MTFMT,MYO5C,NIPA2,PAK6,PCSK6,RBM47, SLC27A2,SPATA5L1,TMEM30B,TMOD3,TTLL12,TUBGCP4,UBE3A | ALDH3A2,ANO10,ATP1B1,BMF,CROT,CTAGE5,GIPC2, GLYCTK,HADHA,HDGF,KALRN,LPCAT3,MOGAT3,OSTalpha, SGPL1,SLC27A2,SLC27A4,SNX24,TMEM139,TMEM41B,TSKU |

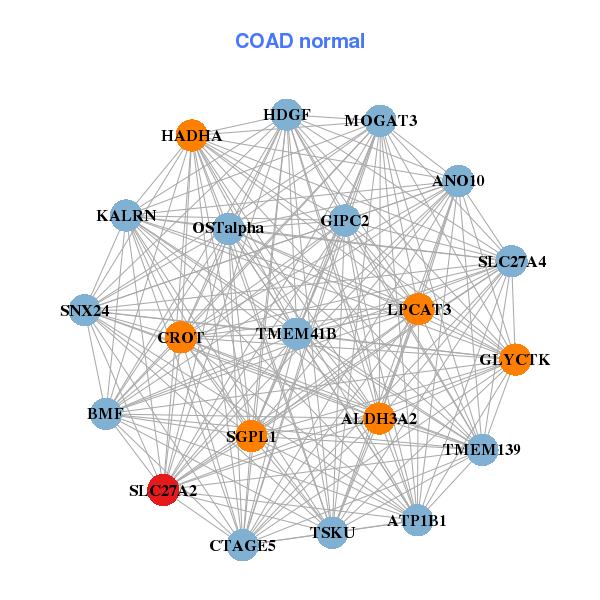
| * Co-Expression network figures were drawn using R package igraph. Only the top 20 genes with the highest correlations were shown. Red circle: input gene, orange circle: cell metabolism gene, sky circle: other gene |
: Open all plots for all cancer types
| Top |
: Open all interacting genes' information including KEGG pathway for all interacting genes from DAVID
| Top |
| Pharmacological Information for SLC27A2 |
| DB Category | DB Name | DB's ID and Url link |
| * Gene Centered Interaction Network. |
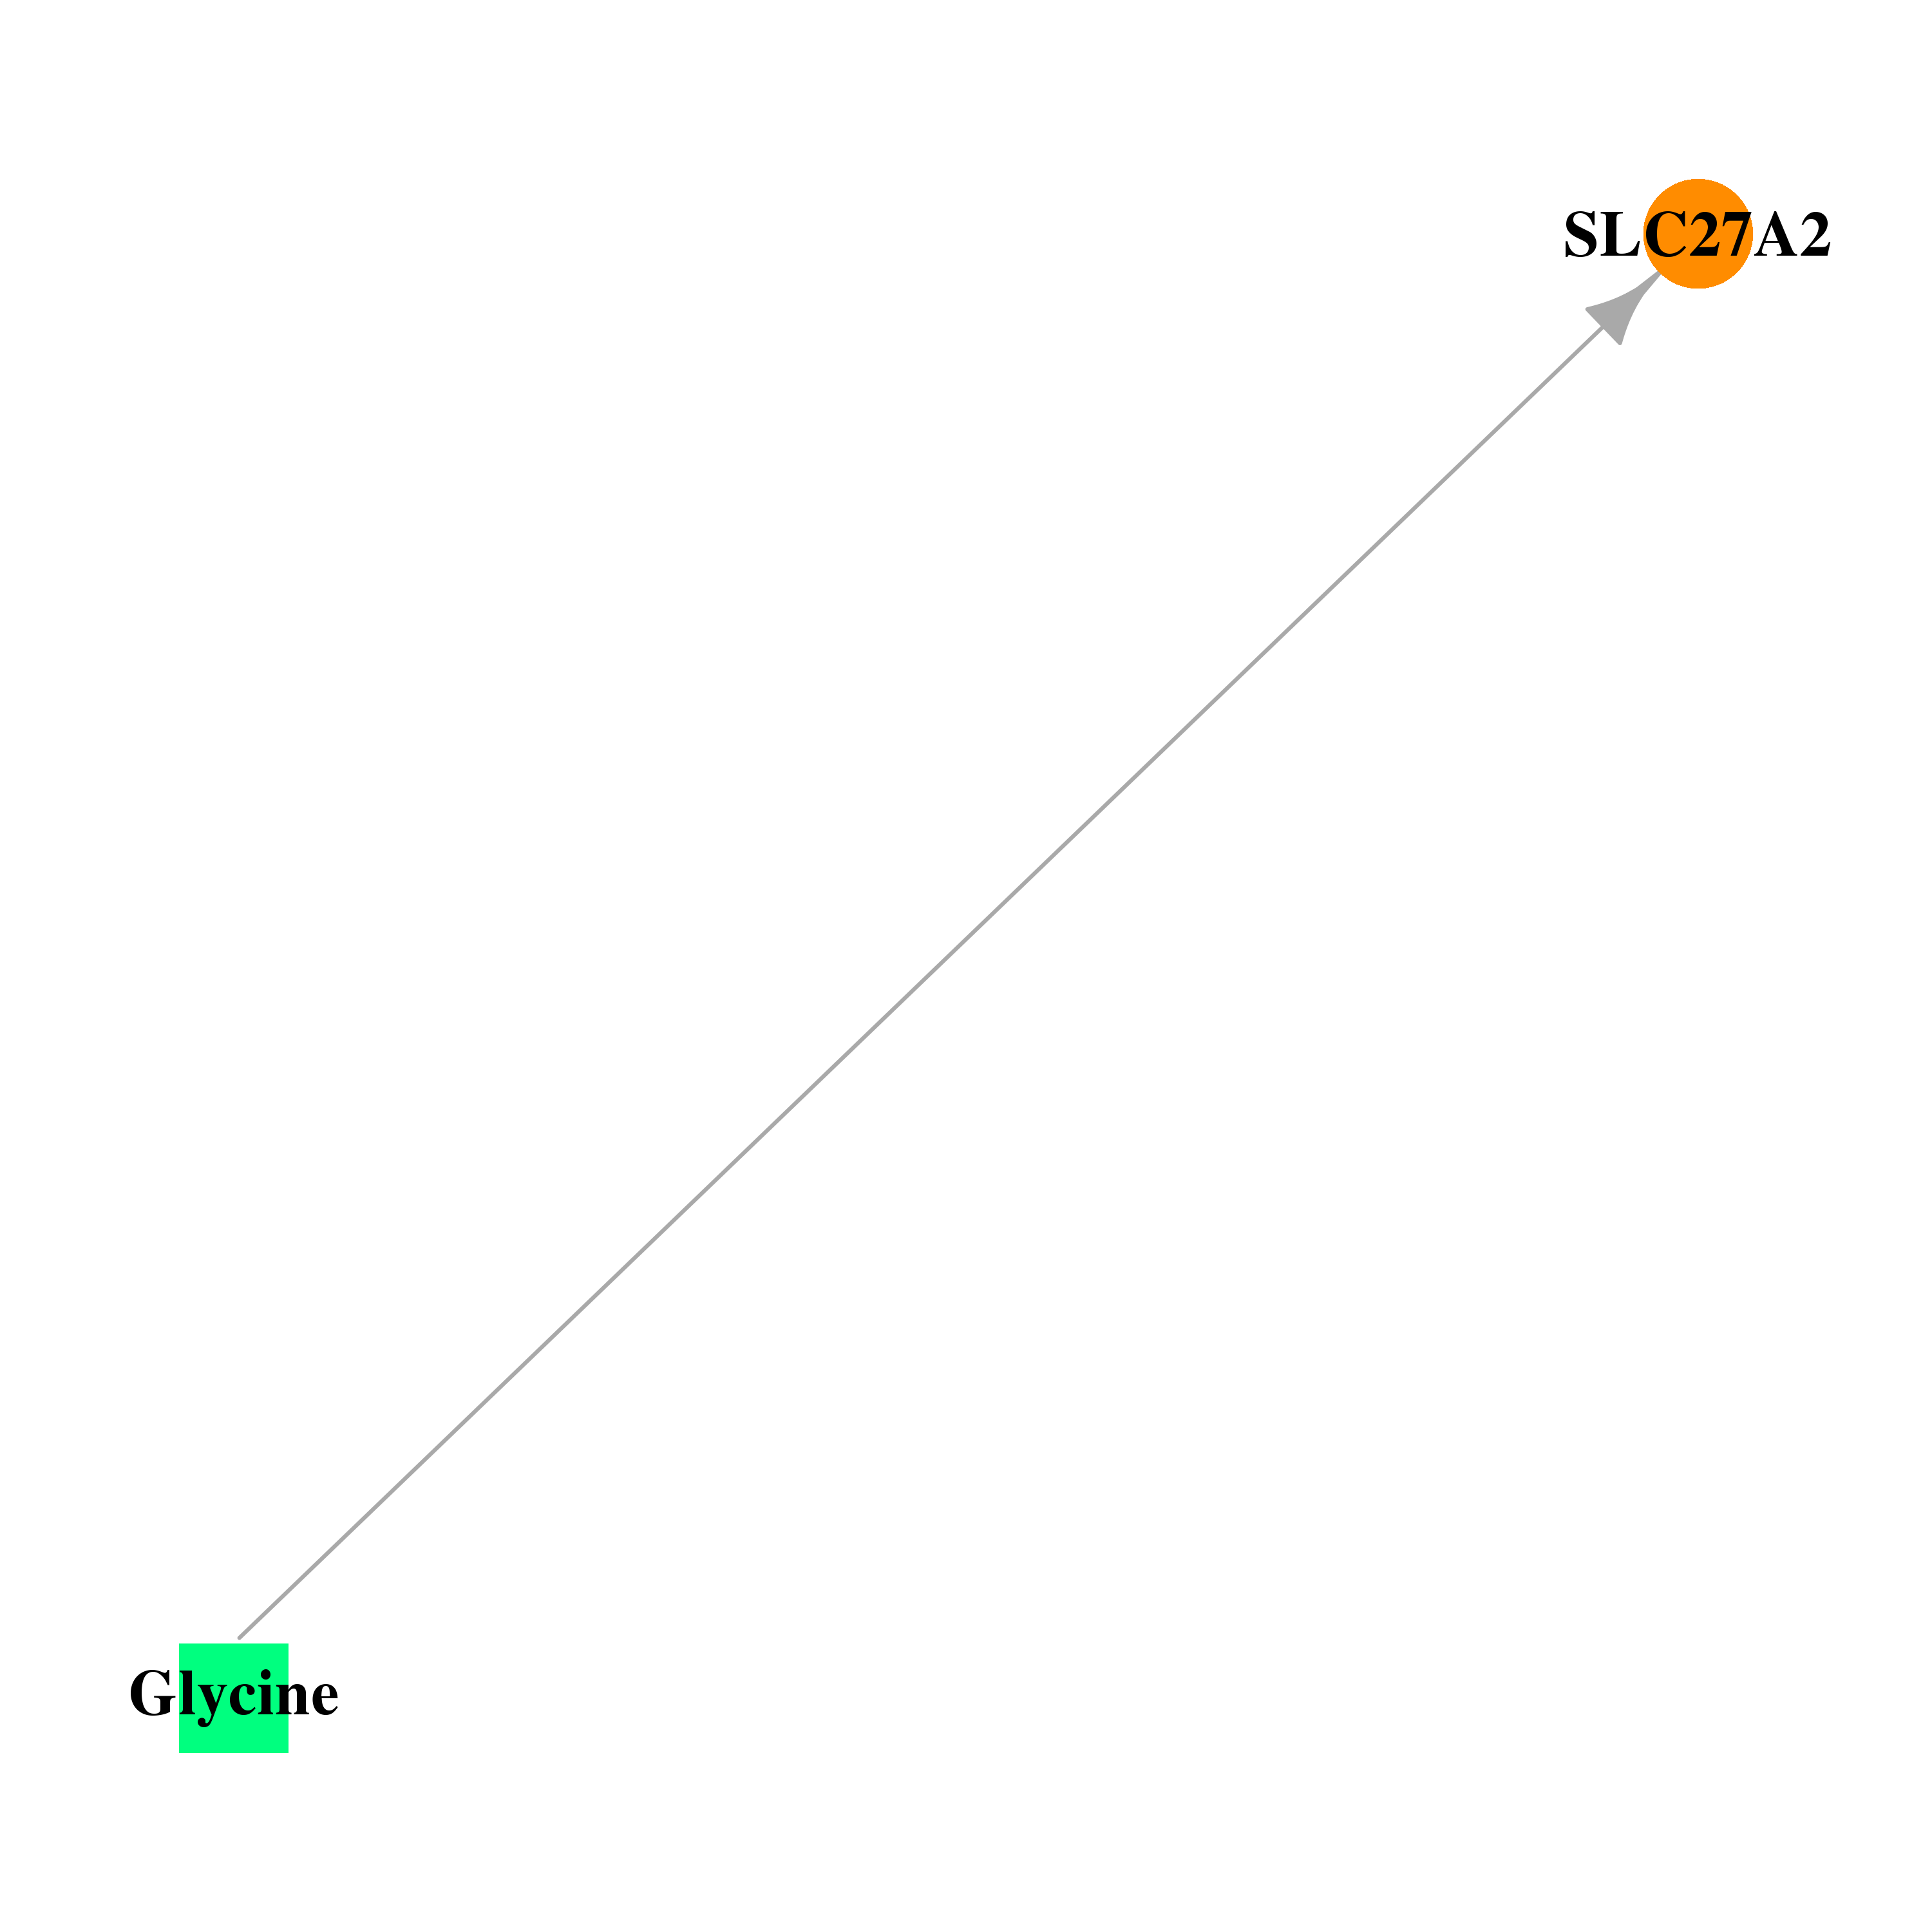 |
| * Drug Centered Interaction Network. |
| DrugBank ID | Target Name | Drug Groups | Generic Name | Drug Centered Network | Drug Structure |
| DB00145 | solute carrier family 27 (fatty acid transporter), member 2 | approved; nutraceutical | Glycine |  |  |
| Top |
| Cross referenced IDs for SLC27A2 |
| * We obtained these cross-references from Uniprot database. It covers 150 different DBs, 18 categories. http://www.uniprot.org/help/cross_references_section |
: Open all cross reference information
|
Copyright © 2016-Present - The Univsersity of Texas Health Science Center at Houston @ |