|
|||||||||||||||||||||||||||||||||||||||||||||||||||||||||||||||||||||||||||||||||||||||||||||||||||||||||||||||||||||||||||||||||||||||||||||||||||||||||||||||||||||||||||||||||||||||||||||||||||||||||||||||||||||||||||||||||||||||||||||||||||||||||||||||||||||||||||||||||||||||||||||||||||||||||||||||||||||||||||||||||||||||||||||||||||
| |
| Phenotypic Information (metabolism pathway, cancer, disease, phenome) |
| |
| |
| Gene-Gene Network Information: Co-Expression Network, Interacting Genes & KEGG |
| |
|


| Gene Summary for AKR1C4 |
| Basic gene info. | Gene symbol | AKR1C4 |
| Gene name | aldo-keto reductase family 1, member C4 | |
| Synonyms | 3-alpha-HSD|C11|CDR|CHDR|DD-4|DD4|HAKRA | |
| Cytomap | UCSC genome browser: 10p15.1 | |
| Genomic location | chr10 :5238797-5260910 | |
| Type of gene | protein-coding | |
| RefGenes | NM_001818.3, | |
| Ensembl id | ENSG00000266359 | |
| Description | 3-alpha-HSD1aldo-keto reductase family 1 member C4chlordecone reductase; 3-alpha hydroxysteroid dehydrogenase, type I; dihydrodiol dehydrogenase 4dihydrodiol dehydrogenase isozyme DD4type I 3-alpha-hydroxysteroid dehydrogenase | |
| Modification date | 20141211 | |
| dbXrefs | MIM : 600451 | |
| HGNC : HGNC | ||
| Ensembl : ENSG00000198610 | ||
| HPRD : 07040 | ||
| Vega : OTTHUMG00000017591 | ||
| Protein | UniProt: go to UniProt's Cross Reference DB Table | |
| Expression | CleanEX: HS_AKR1C4 | |
| BioGPS: 1109 | ||
| Gene Expression Atlas: ENSG00000266359 | ||
| The Human Protein Atlas: ENSG00000266359 | ||
| Pathway | NCI Pathway Interaction Database: AKR1C4 | |
| KEGG: AKR1C4 | ||
| REACTOME: AKR1C4 | ||
| ConsensusPathDB | ||
| Pathway Commons: AKR1C4 | ||
| Metabolism | MetaCyc: AKR1C4 | |
| HUMANCyc: AKR1C4 | ||
| Regulation | Ensembl's Regulation: ENSG00000266359 | |
| miRBase: chr10 :5,238,797-5,260,910 | ||
| TargetScan: NM_001818 | ||
| cisRED: ENSG00000266359 | ||
| Context | iHOP: AKR1C4 | |
| cancer metabolism search in PubMed: AKR1C4 | ||
| UCL Cancer Institute: AKR1C4 | ||
| Assigned class in ccmGDB | C | |
| Top |
| Phenotypic Information for AKR1C4(metabolism pathway, cancer, disease, phenome) |
| Cancer | CGAP: AKR1C4 |
| Familial Cancer Database: AKR1C4 | |
| * This gene is included in those cancer gene databases. |
|
|
|
|
|
|
| |||||||||||||||||||||||||||||||||||||||||||||||||||||||||||||||||||||||||||||||||||||||||||||||||||||||||||||||||||||||||||||||||||||||||||||||||||||||||||||||||||||||||||||||||||||||||||||||||||||||||||||||||||||||||||||||||||||||||||||||||||||||||||||||||||||||||||||||||||||||||||||||||||||||||||||||||||||||||||||||||||||||||||||
Oncogene 1 | Significant driver gene in | ||||||||||||||||||||||||||||||||||||||||||||||||||||||||||||||||||||||||||||||||||||||||||||||||||||||||||||||||||||||||||||||||||||||||||||||||||||||||||||||||||||||||||||||||||||||||||||||||||||||||||||||||||||||||||||||||||||||||||||||||||||||||||||||||||||||||||||||||||||||||||||||||||||||||||||||||||||||||||||||||||||||||||||||||||
| cf) number; DB name 1 Oncogene; http://nar.oxfordjournals.org/content/35/suppl_1/D721.long, 2 Tumor Suppressor gene; https://bioinfo.uth.edu/TSGene/, 3 Cancer Gene Census; http://www.nature.com/nrc/journal/v4/n3/abs/nrc1299.html, 4 CancerGenes; http://nar.oxfordjournals.org/content/35/suppl_1/D721.long, 5 Network of Cancer Gene; http://ncg.kcl.ac.uk/index.php, 1Therapeutic Vulnerabilities in Cancer; http://cbio.mskcc.org/cancergenomics/statius/ |
| KEGG_METABOLISM_OF_XENOBIOTICS_BY_CYTOCHROME_P450 REACTOME_METABOLISM_OF_LIPIDS_AND_LIPOPROTEINS | |
| OMIM | |
| Orphanet | |
| Disease | KEGG Disease: AKR1C4 |
| MedGen: AKR1C4 (Human Medical Genetics with Condition) | |
| ClinVar: AKR1C4 | |
| Phenotype | MGI: AKR1C4 (International Mouse Phenotyping Consortium) |
| PhenomicDB: AKR1C4 | |
| Mutations for AKR1C4 |
| * Under tables are showing count per each tissue to give us broad intuition about tissue specific mutation patterns.You can go to the detailed page for each mutation database's web site. |
| There's no structural variation information in COSMIC data for this gene. |
| * From mRNA Sanger sequences, Chitars2.0 arranged chimeric transcripts. This table shows AKR1C4 related fusion information. |
| ID | Head Gene | Tail Gene | Accession | Gene_a | qStart_a | qEnd_a | Chromosome_a | tStart_a | tEnd_a | Gene_a | qStart_a | qEnd_a | Chromosome_a | tStart_a | tEnd_a |
| Top |
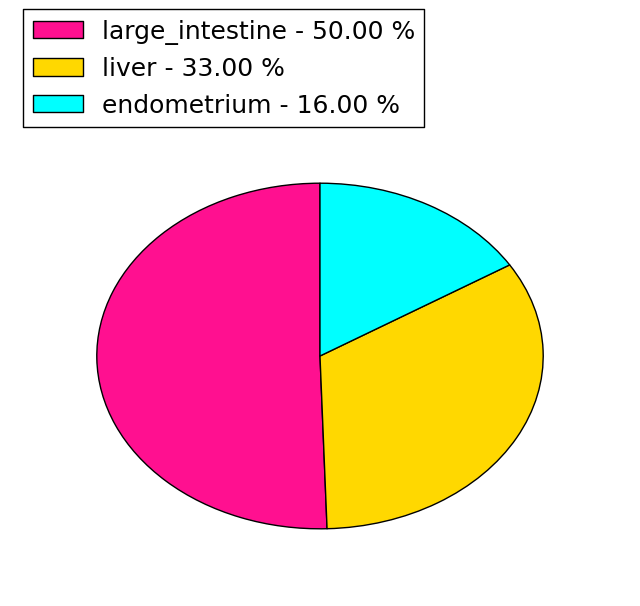
| Mutation type/ Tissue ID | brca | cns | cerv | endome | haematopo | kidn | Lintest | liver | lung | ns | ovary | pancre | prost | skin | stoma | thyro | urina | |||
| Total # sample | 1 | 2 | ||||||||||||||||||
| GAIN (# sample) | 1 | 2 | ||||||||||||||||||
| LOSS (# sample) |
| cf) Tissue ID; Tissue type (1; Breast, 2; Central_nervous_system, 3; Cervix, 4; Endometrium, 5; Haematopoietic_and_lymphoid_tissue, 6; Kidney, 7; Large_intestine, 8; Liver, 9; Lung, 10; NS, 11; Ovary, 12; Pancreas, 13; Prostate, 14; Skin, 15; Stomach, 16; Thyroid, 17; Urinary_tract) |
| Top |
|
 |
| Top |
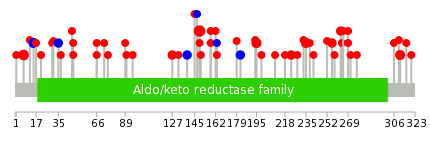
| Stat. for Non-Synonymous SNVs (# total SNVs=48) | (# total SNVs=6) |
 |  |
(# total SNVs=0) | (# total SNVs=0) |
| Top |
| * When you move the cursor on each content, you can see more deailed mutation information on the Tooltip. Those are primary_site,primary_histology,mutation(aa),pubmedID. |
| GRCh37 position | Mutation(aa) | Unique sampleID count |
| chr10:5247796-5247796 | p.E149G | 7 |
| chr10:5238849-5238849 | p.R7C | 4 |
| chr10:5254591-5254591 | p.P195S | 3 |
| chr10:5238875-5238875 | p.F15F | 3 |
| chr10:5260682-5260682 | p.L311V | 3 |
| chr10:5254979-5254979 | p.L235I | 3 |
| chr10:5248336-5248336 | p.L182L | 2 |
| chr10:5247767-5247767 | p.F139F | 2 |
| chr10:5258737-5258737 | p.R304* | 2 |
| chr10:5242256-5242256 | p.R66Q | 2 |
| Top |
|
 |
| Point Mutation/ Tissue ID | 1 | 2 | 3 | 4 | 5 | 6 | 7 | 8 | 9 | 10 | 11 | 12 | 13 | 14 | 15 | 16 | 17 | 18 | 19 | 20 |
| # sample | 1 | 2 | 12 | 2 | 2 | 1 | 4 | 1 | 2 | 8 | 5 | 6 | ||||||||
| # mutation | 1 | 2 | 7 | 2 | 2 | 1 | 4 | 1 | 2 | 8 | 5 | 7 | ||||||||
| nonsynonymous SNV | 1 | 2 | 6 | 2 | 2 | 1 | 3 | 1 | 2 | 7 | 5 | 6 | ||||||||
| synonymous SNV | 1 | 1 | 1 | 1 |
| cf) Tissue ID; Tissue type (1; BLCA[Bladder Urothelial Carcinoma], 2; BRCA[Breast invasive carcinoma], 3; CESC[Cervical squamous cell carcinoma and endocervical adenocarcinoma], 4; COAD[Colon adenocarcinoma], 5; GBM[Glioblastoma multiforme], 6; Glioma Low Grade, 7; HNSC[Head and Neck squamous cell carcinoma], 8; KICH[Kidney Chromophobe], 9; KIRC[Kidney renal clear cell carcinoma], 10; KIRP[Kidney renal papillary cell carcinoma], 11; LAML[Acute Myeloid Leukemia], 12; LUAD[Lung adenocarcinoma], 13; LUSC[Lung squamous cell carcinoma], 14; OV[Ovarian serous cystadenocarcinoma ], 15; PAAD[Pancreatic adenocarcinoma], 16; PRAD[Prostate adenocarcinoma], 17; SKCM[Skin Cutaneous Melanoma], 18:STAD[Stomach adenocarcinoma], 19:THCA[Thyroid carcinoma], 20:UCEC[Uterine Corpus Endometrial Carcinoma]) |
| Top |
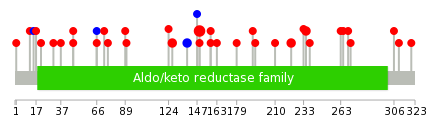
| * We represented just top 10 SNVs. When you move the cursor on each content, you can see more deailed mutation information on the Tooltip. Those are primary_site, primary_histology, mutation(aa), pubmedID. |
| Genomic Position | Mutation(aa) | Unique sampleID count |
| chr10:5247796 | p.E149G | 7 |
| chr10:5248263 | p.T127M | 2 |
| chr10:5254676 | p.F139F | 2 |
| chr10:5247730 | p.G158A | 2 |
| chr10:5247767 | p.R223Q | 2 |
| chr10:5254979 | p.L235I | 2 |
| chr10:5255069 | p.F90L | 1 |
| chr10:5242256 | p.R263H | 1 |
| chr10:5248277 | p.P124T | 1 |
| chr10:5238831 | p.V265I | 1 |
| * Copy number data were extracted from TCGA using R package TCGA-Assembler. The URLs of all public data files on TCGA DCC data server were gathered on Jan-05-2015. Function ProcessCNAData in TCGA-Assembler package was used to obtain gene-level copy number value which is calculated as the average copy number of the genomic region of a gene. |
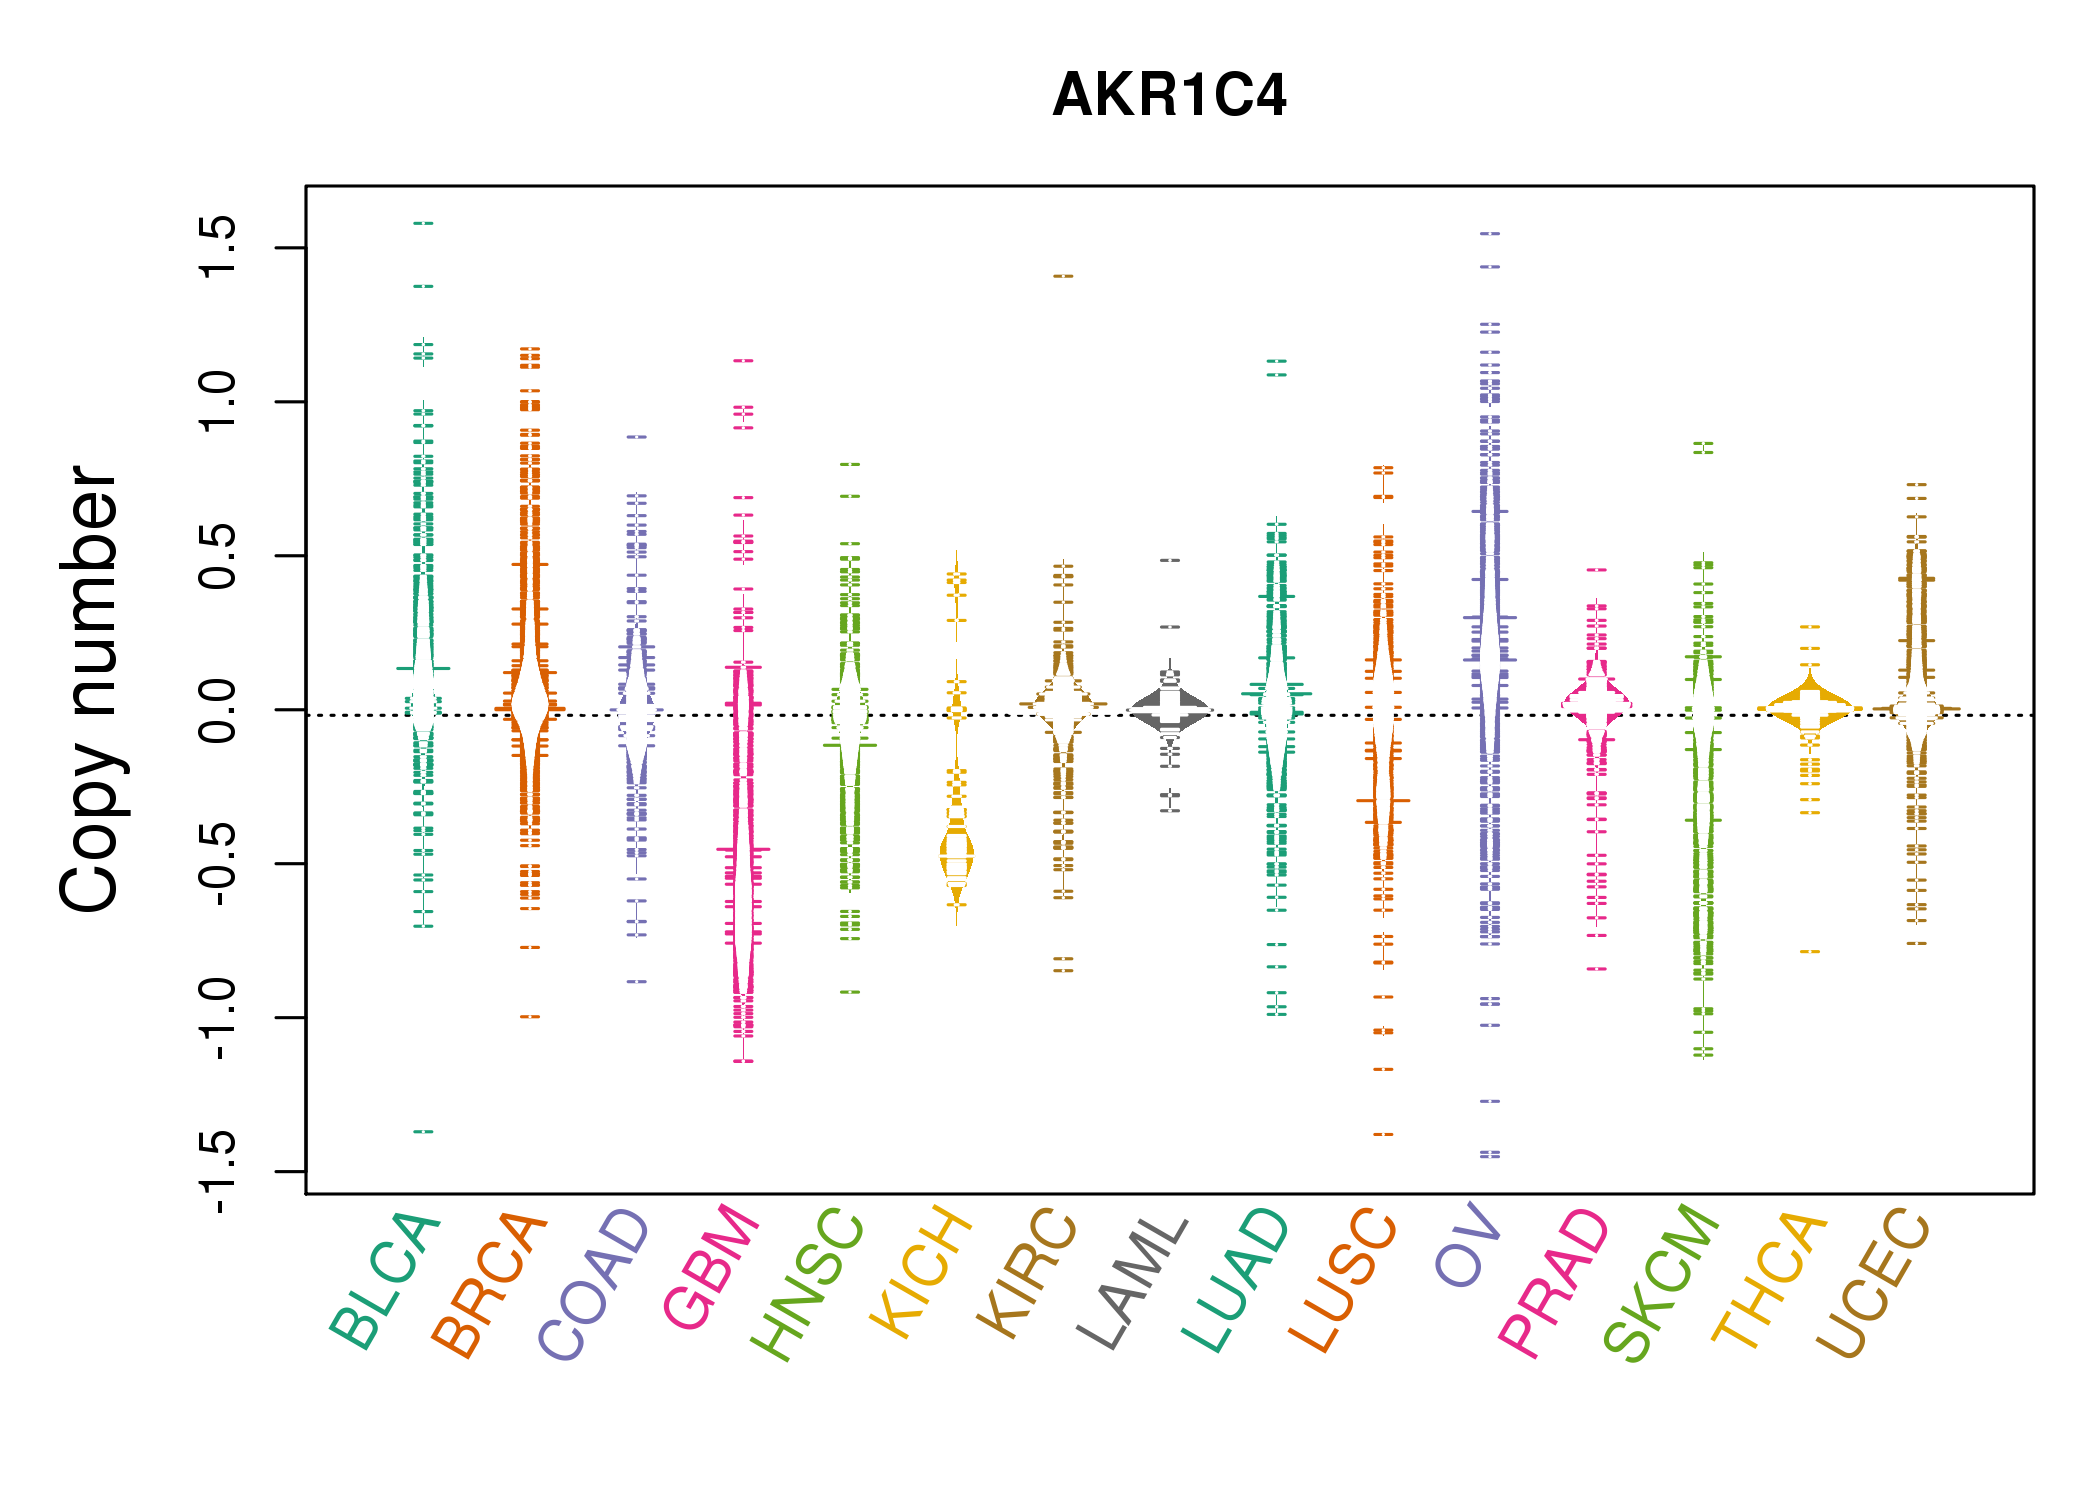 |
| cf) Tissue ID[Tissue type]: BLCA[Bladder Urothelial Carcinoma], BRCA[Breast invasive carcinoma], CESC[Cervical squamous cell carcinoma and endocervical adenocarcinoma], COAD[Colon adenocarcinoma], GBM[Glioblastoma multiforme], Glioma Low Grade, HNSC[Head and Neck squamous cell carcinoma], KICH[Kidney Chromophobe], KIRC[Kidney renal clear cell carcinoma], KIRP[Kidney renal papillary cell carcinoma], LAML[Acute Myeloid Leukemia], LUAD[Lung adenocarcinoma], LUSC[Lung squamous cell carcinoma], OV[Ovarian serous cystadenocarcinoma ], PAAD[Pancreatic adenocarcinoma], PRAD[Prostate adenocarcinoma], SKCM[Skin Cutaneous Melanoma], STAD[Stomach adenocarcinoma], THCA[Thyroid carcinoma], UCEC[Uterine Corpus Endometrial Carcinoma] |
| Top |
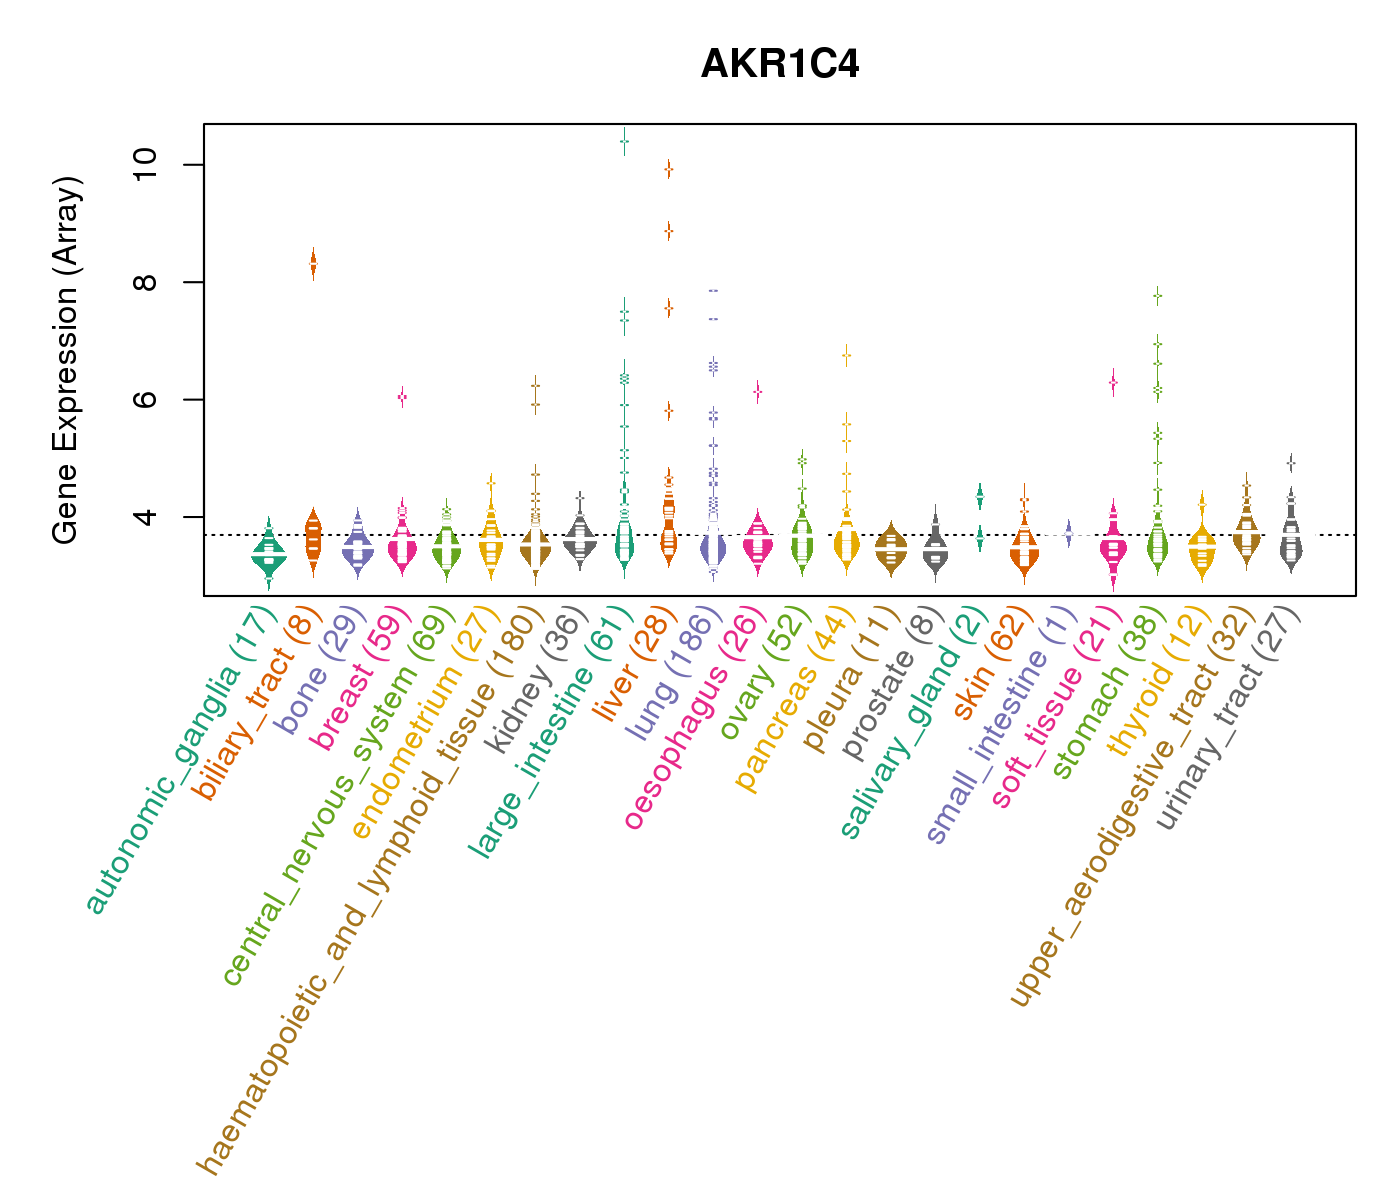
| Gene Expression for AKR1C4 |
| * CCLE gene expression data were extracted from CCLE_Expression_Entrez_2012-10-18.res: Gene-centric RMA-normalized mRNA expression data. |
 |
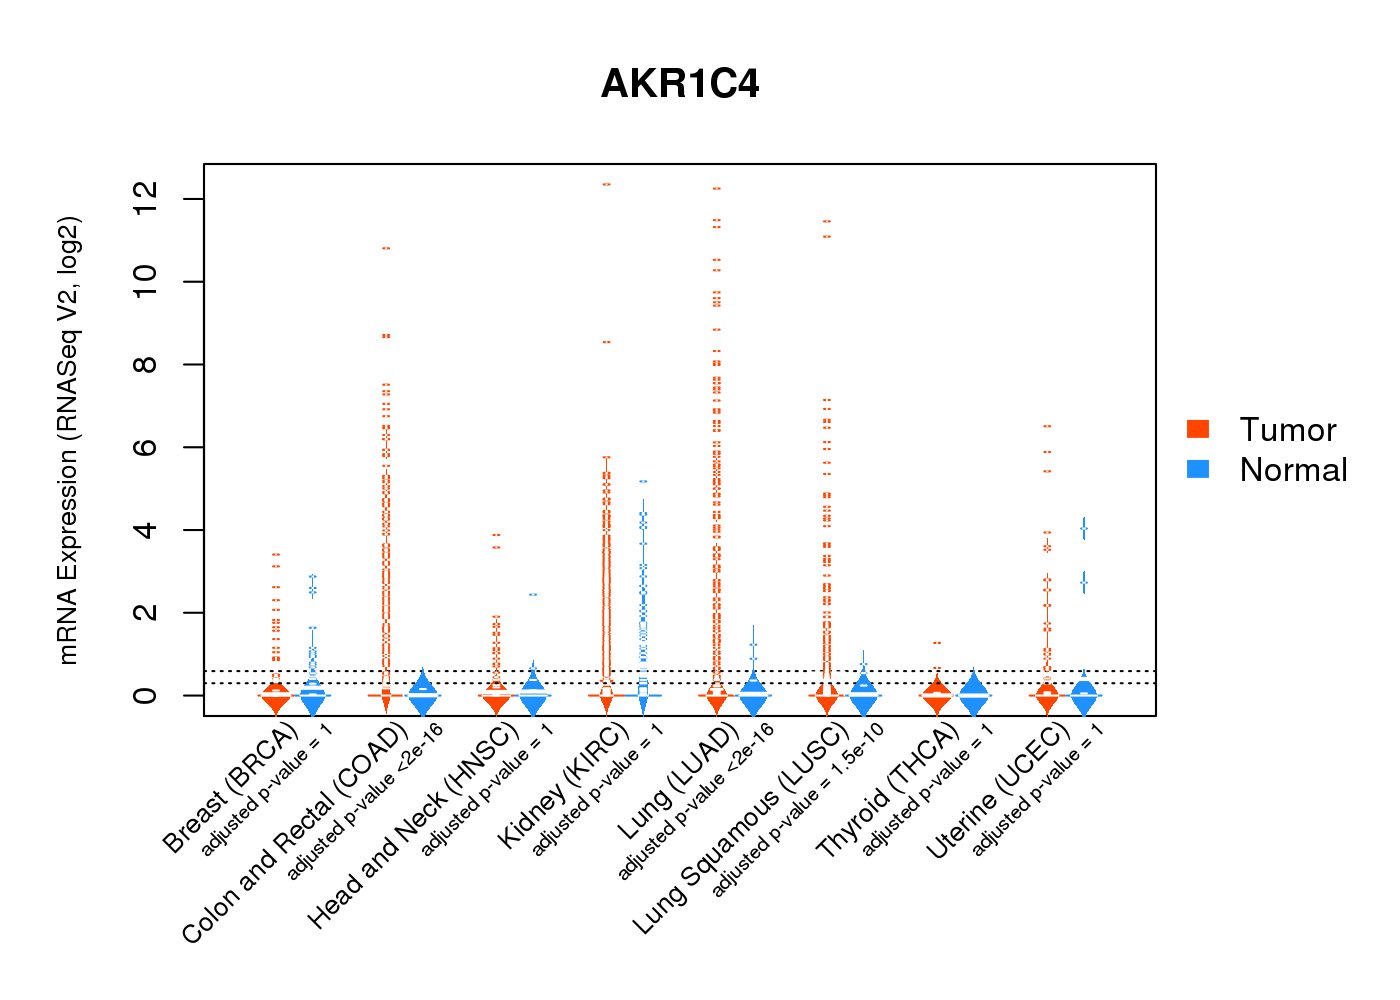
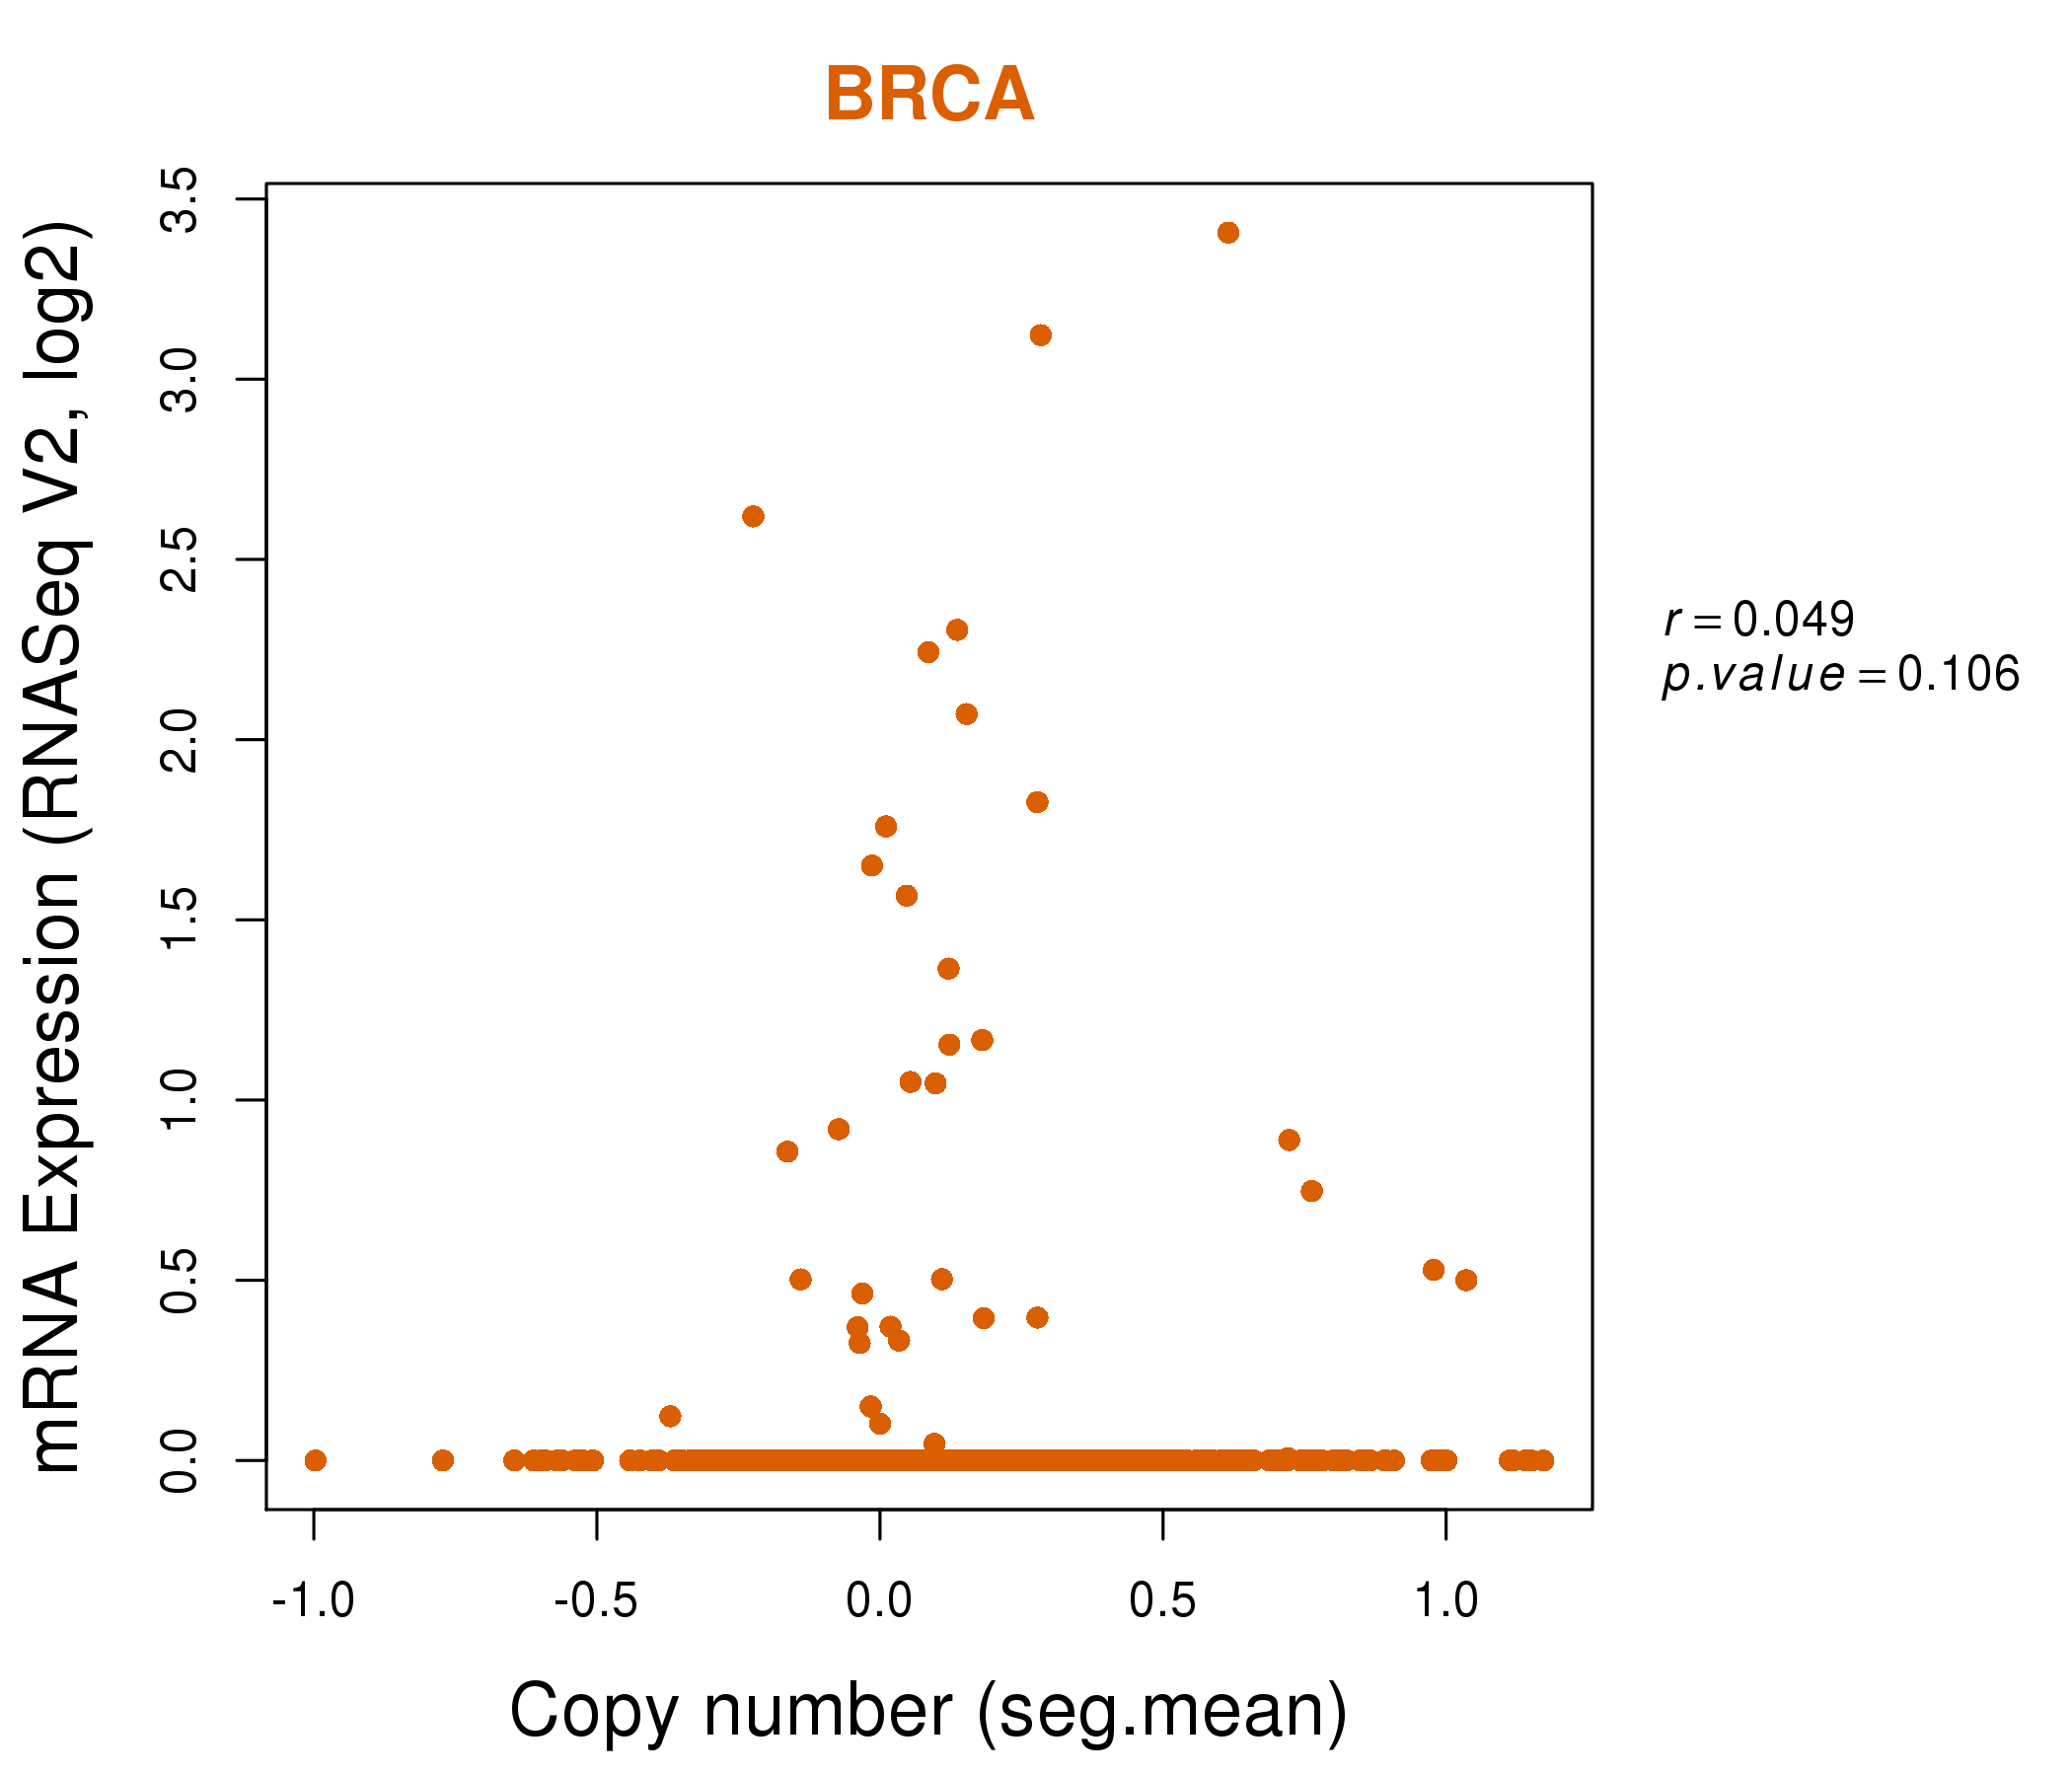
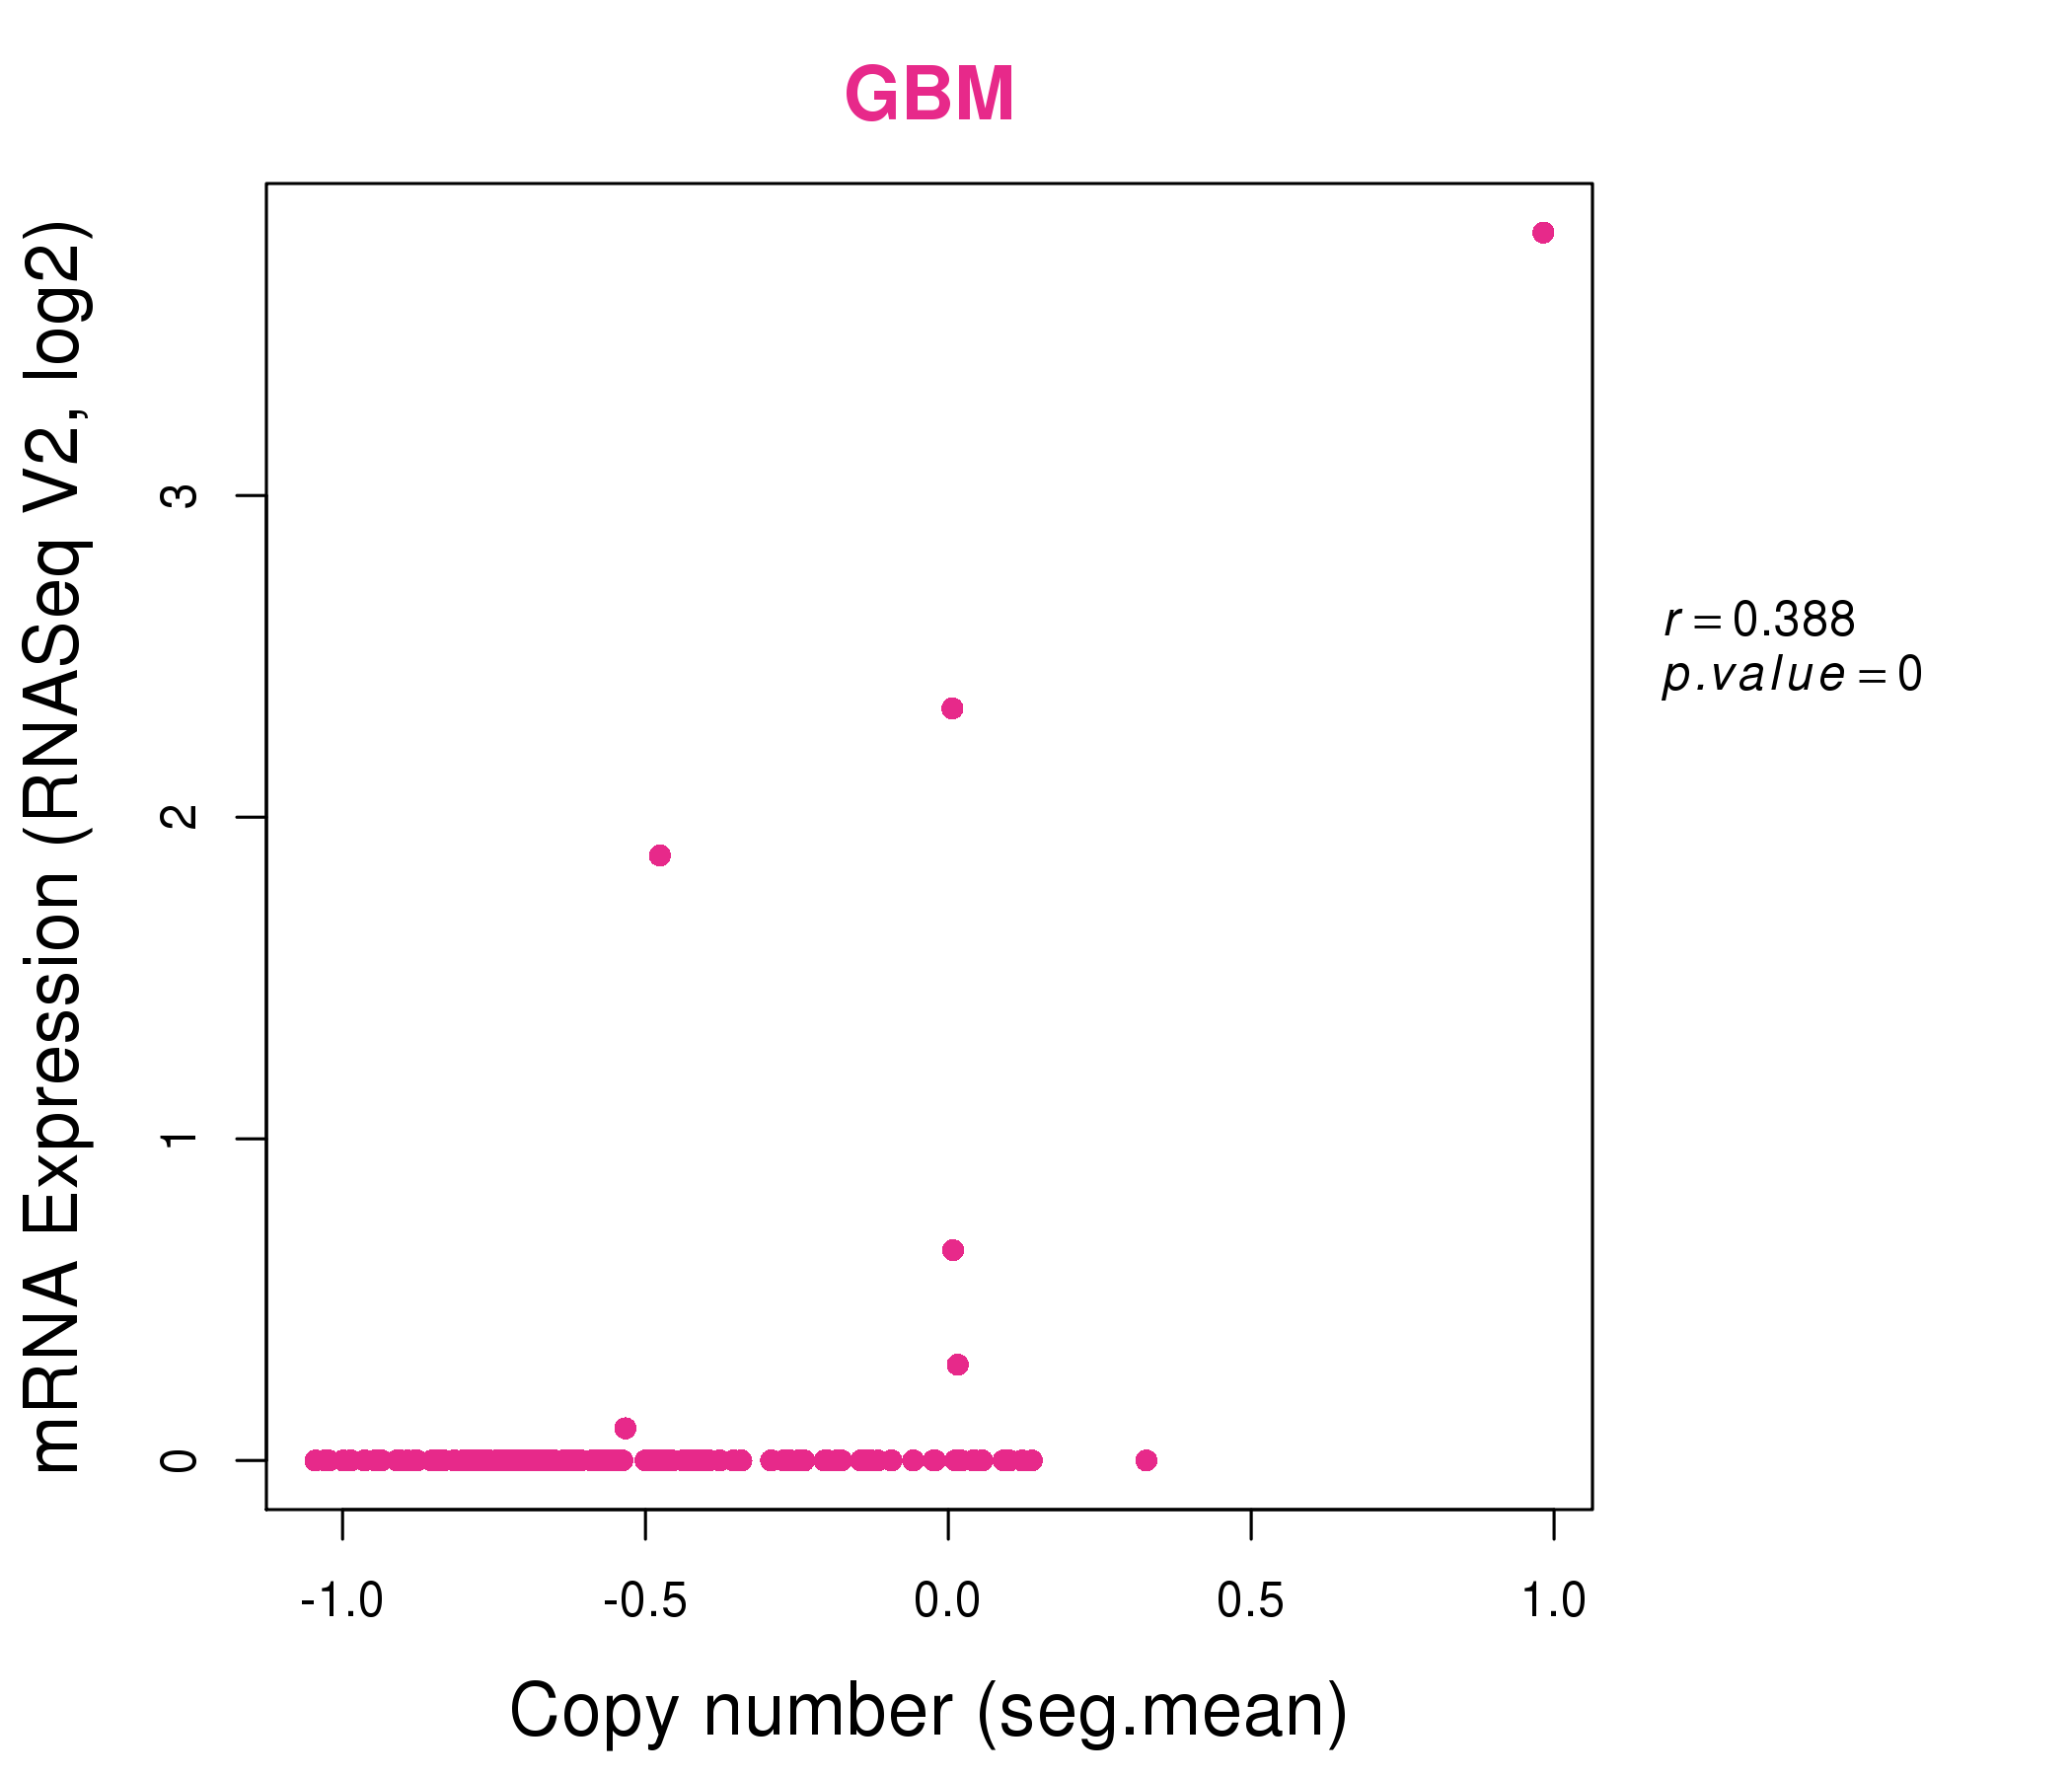
| * Normalized gene expression data of RNASeqV2 was extracted from TCGA using R package TCGA-Assembler. The URLs of all public data files on TCGA DCC data server were gathered at Jan-05-2015. Only eight cancer types have enough normal control samples for differential expression analysis. (t test, adjusted p<0.05 (using Benjamini-Hochberg FDR)) |
 |
| Top |
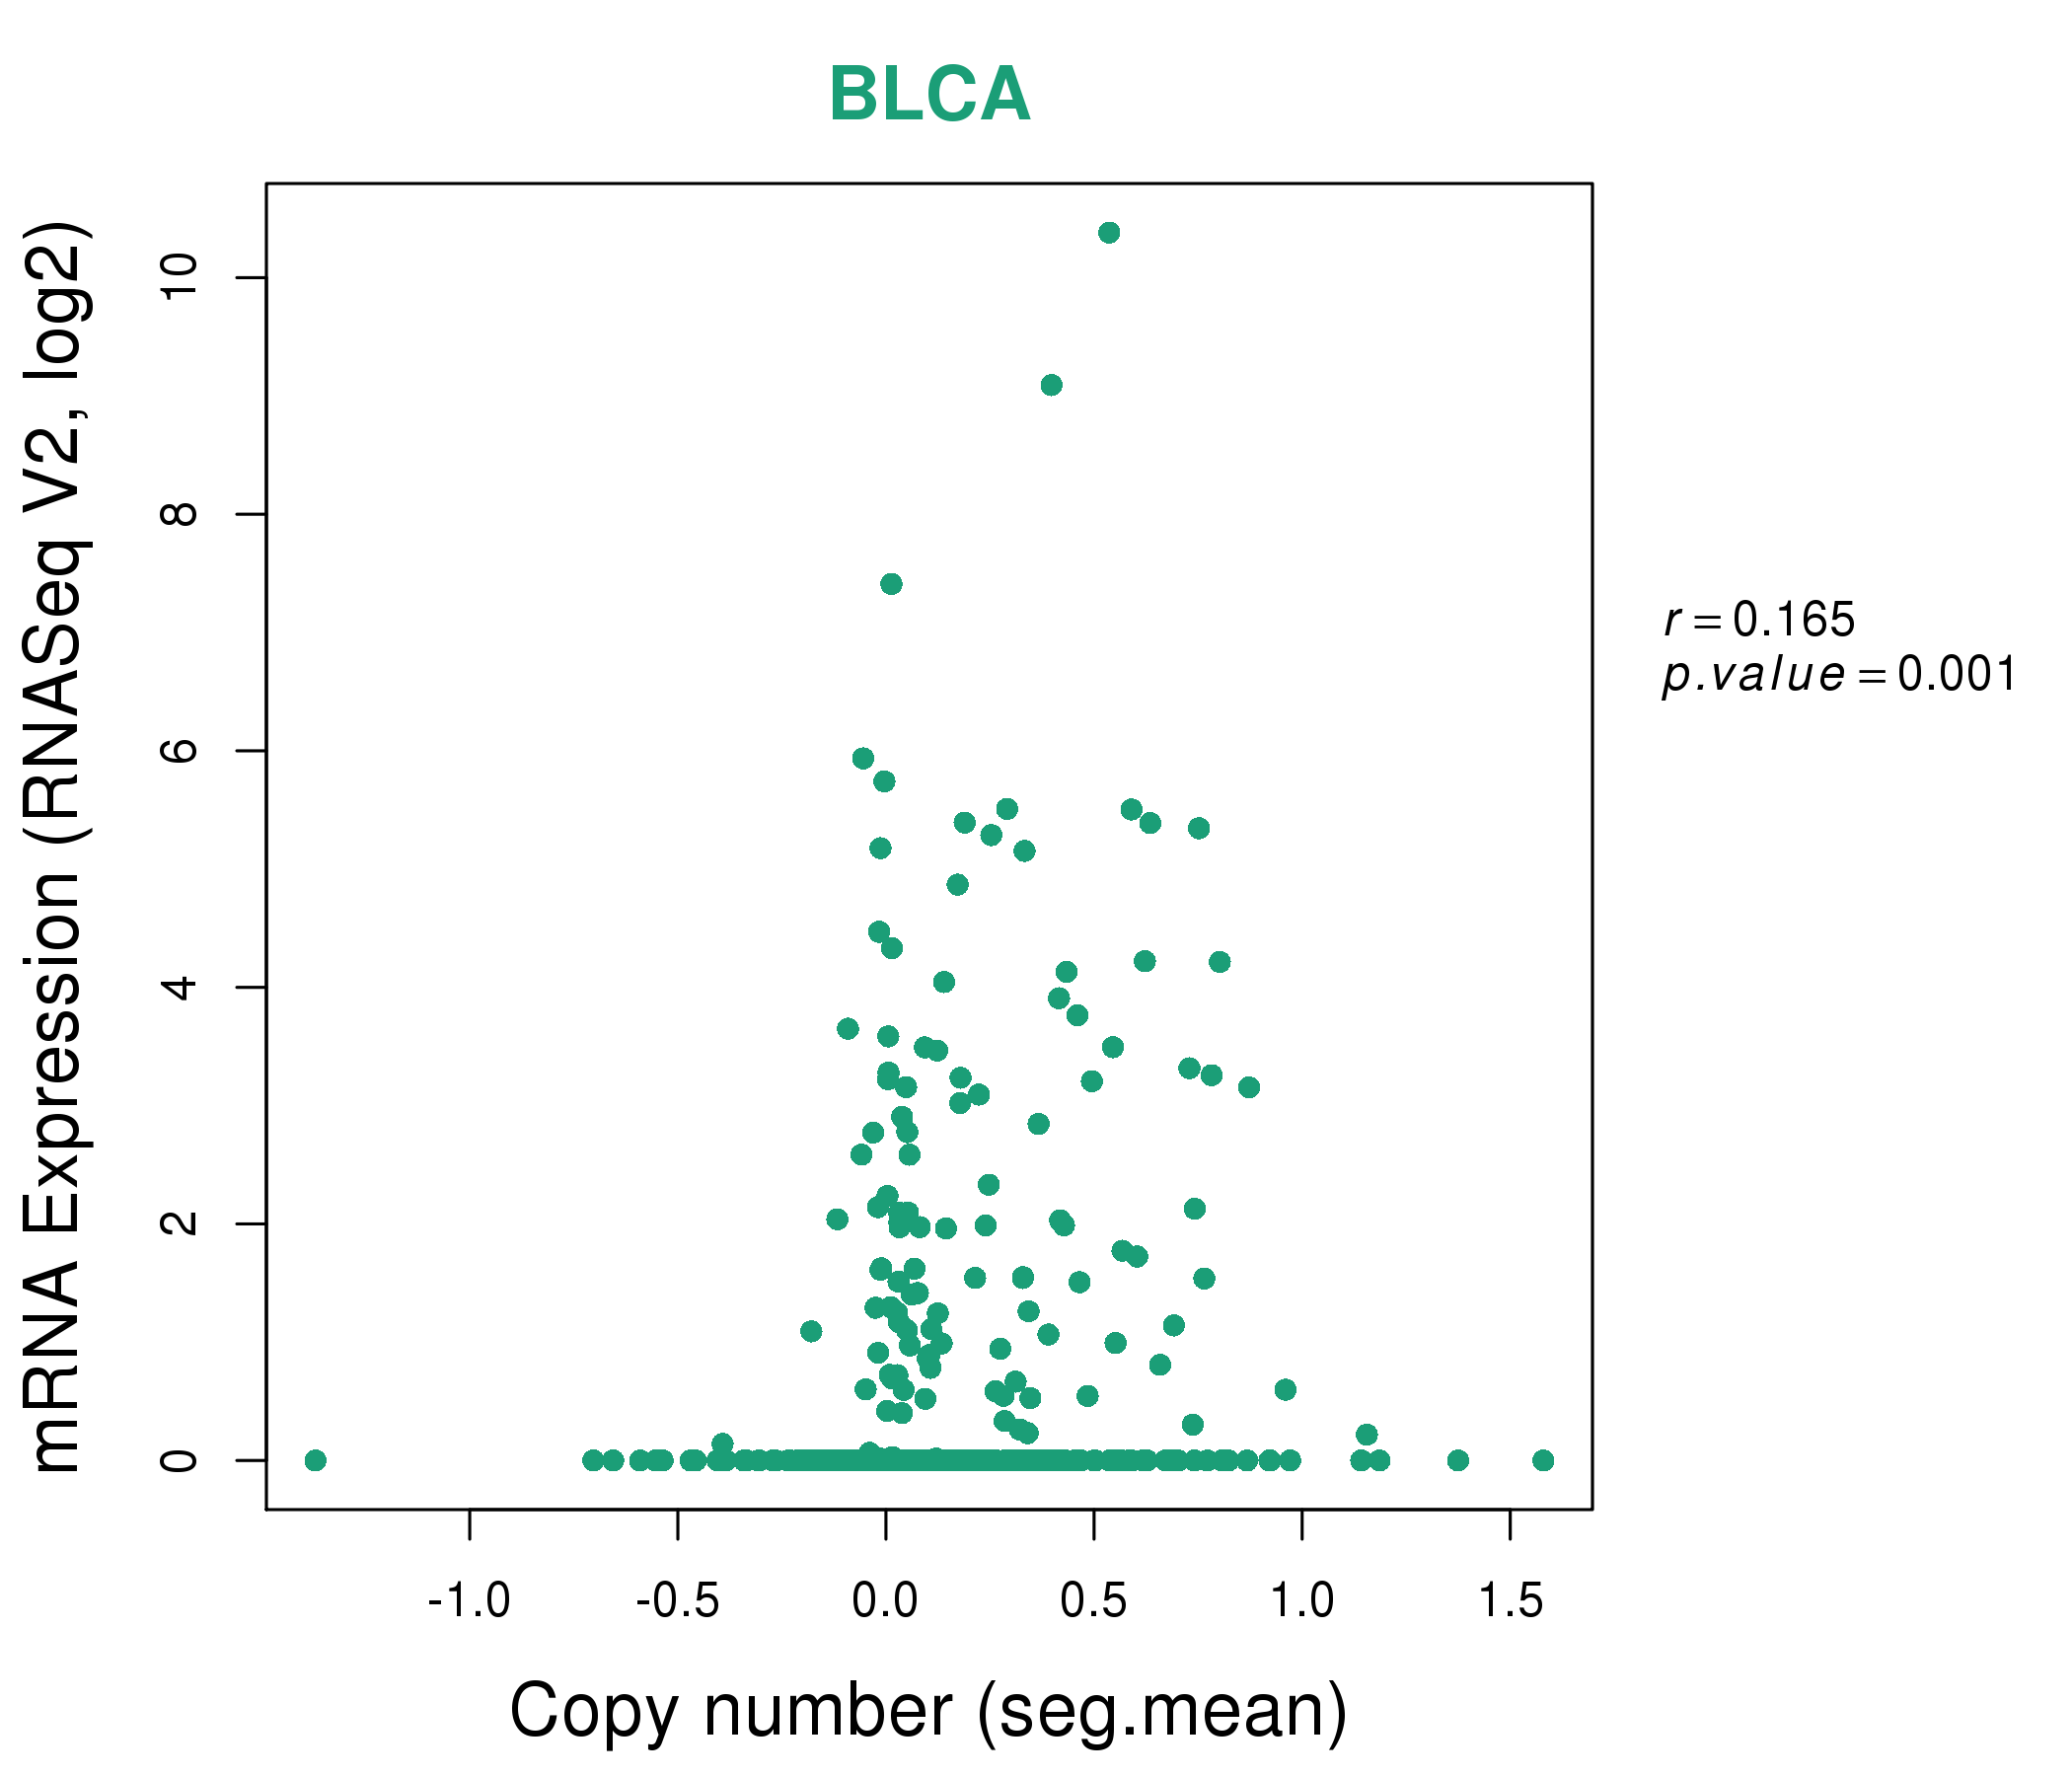
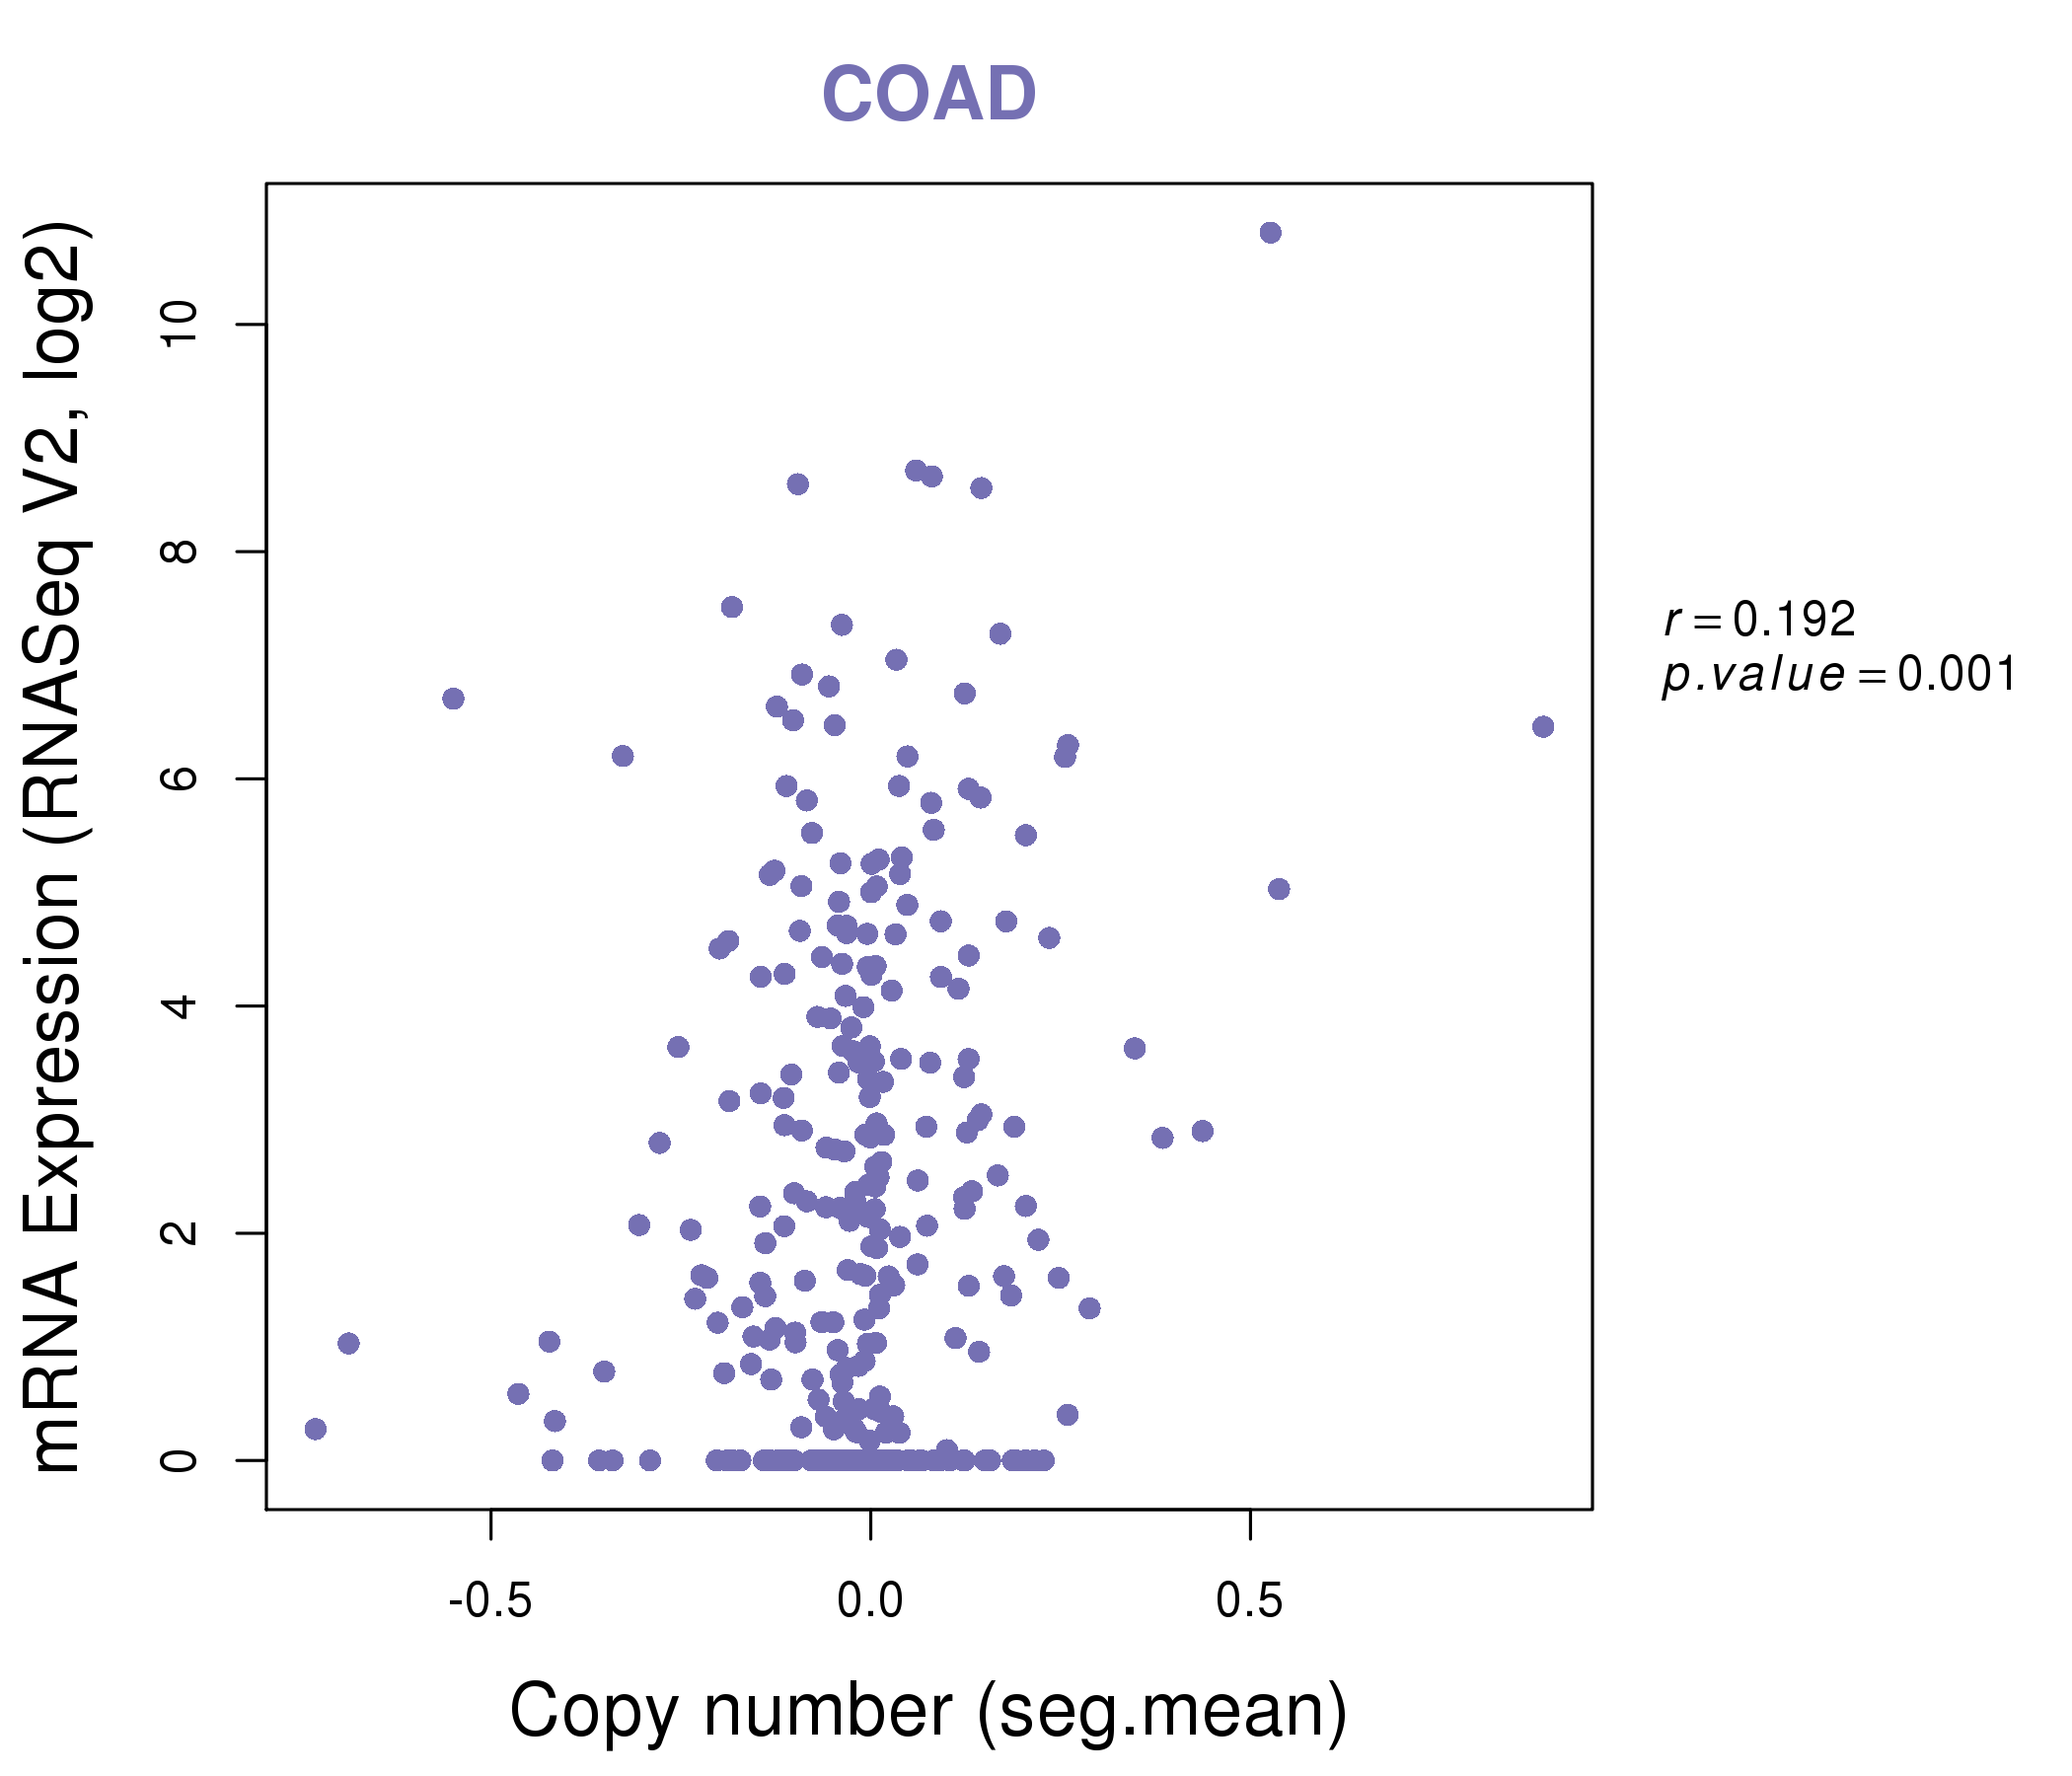
| * This plots show the correlation between CNV and gene expression. |
: Open all plots for all cancer types
 |
|
 |
|
| Top |
| Gene-Gene Network Information |
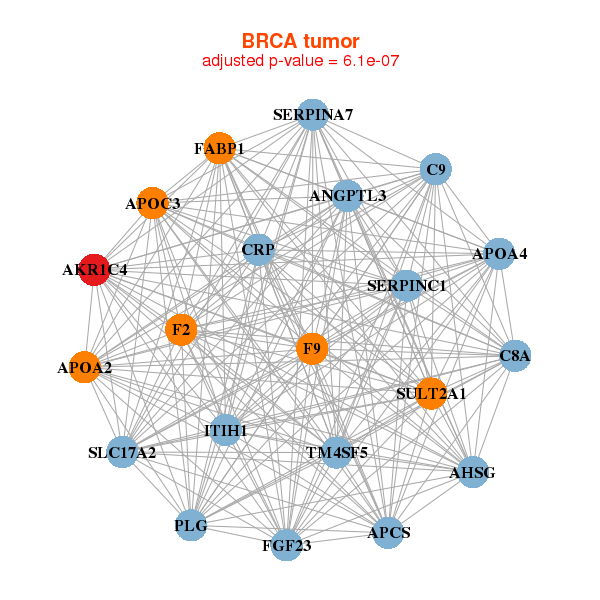
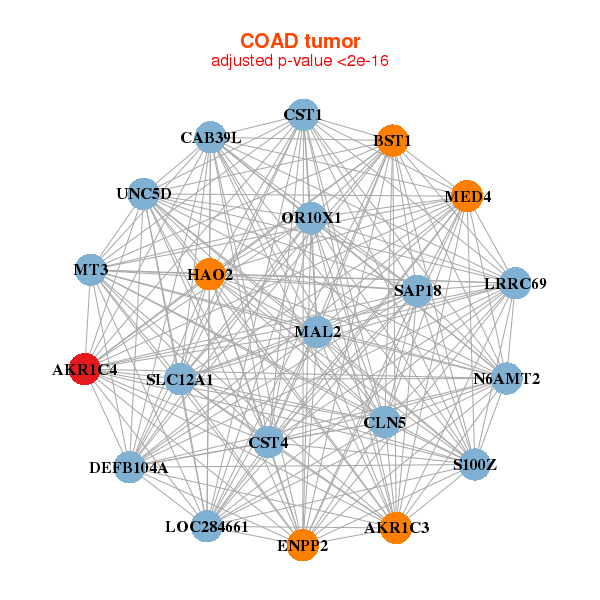
| * Co-Expression network figures were drawn using R package igraph. Only the top 20 genes with the highest correlations were shown. Red circle: input gene, orange circle: cell metabolism gene, sky circle: other gene |
: Open all plots for all cancer types
 |
| ||||
| AHSG,AKR1C4,ANGPTL3,APCS,APOA2,APOA4,APOC3, C8A,C9,CRP,F2,F9,FABP1,FGF23, ITIH1,PLG,SERPINA7,SERPINC1,SLC17A2,SULT2A1,TM4SF5 | AKAP12,AKR1C1,AKR1C3,AKR1C4,C8orf34,CALM1,CAV1, CRH,DMGDH,EHBP1,FAM149A,GALNT13,GLYAT,HHIP, MCAM,MPZ,RBPMS2,RFTN1,SPARC,SPATA9,TBX4 | ||||
 |
| ||||
| AKR1C3,AKR1C4,BST1,CAB39L,CLN5,CST1,CST4, DEFB104A,ENPP2,HAO2,LOC284661,LRRC69,MAL2,MED4, MT3,N6AMT2,OR10X1,S100Z,SAP18,SLC12A1,UNC5D | AADAC,ABCC2,AGXT2,AKR1C4,ERICH4,CYP2D6,DAB1, KCNJ13,LOC285733,MIR31HG,MGAM,MME,MS4A10,NAT8, PDZD7,RBP3,SHBG,SLC13A1,SOAT2,SULT2A1,TMPRSS15 |
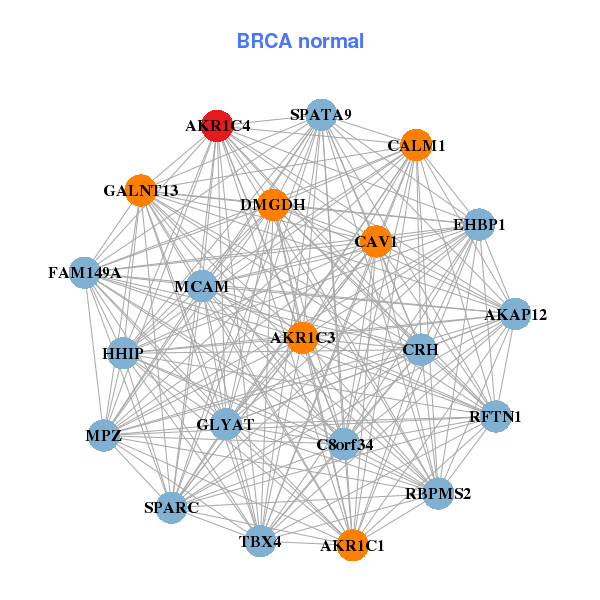
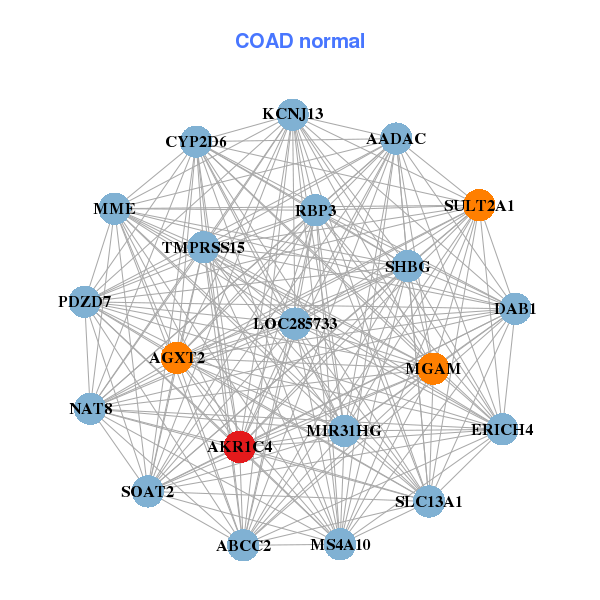
| * Co-Expression network figures were drawn using R package igraph. Only the top 20 genes with the highest correlations were shown. Red circle: input gene, orange circle: cell metabolism gene, sky circle: other gene |
: Open all plots for all cancer types
| Top |
: Open all interacting genes' information including KEGG pathway for all interacting genes from DAVID
| Top |
| Pharmacological Information for AKR1C4 |
| DB Category | DB Name | DB's ID and Url link |
| * Gene Centered Interaction Network. |
 |
| * Drug Centered Interaction Network. |
| DrugBank ID | Target Name | Drug Groups | Generic Name | Drug Centered Network | Drug Structure |
| DB00157 | aldo-keto reductase family 1, member C4 | approved; nutraceutical | NADH |  |  |
| DB00145 | aldo-keto reductase family 1, member C4 | approved; nutraceutical | Glycine |  |  |
| Top |
| Cross referenced IDs for AKR1C4 |
| * We obtained these cross-references from Uniprot database. It covers 150 different DBs, 18 categories. http://www.uniprot.org/help/cross_references_section |
: Open all cross reference information
|
Copyright © 2016-Present - The Univsersity of Texas Health Science Center at Houston @ |